51
f
o
•
•
O
cr
O
CO
ft)
CO
</)
N3
I
O
71.0
66.5
66.0
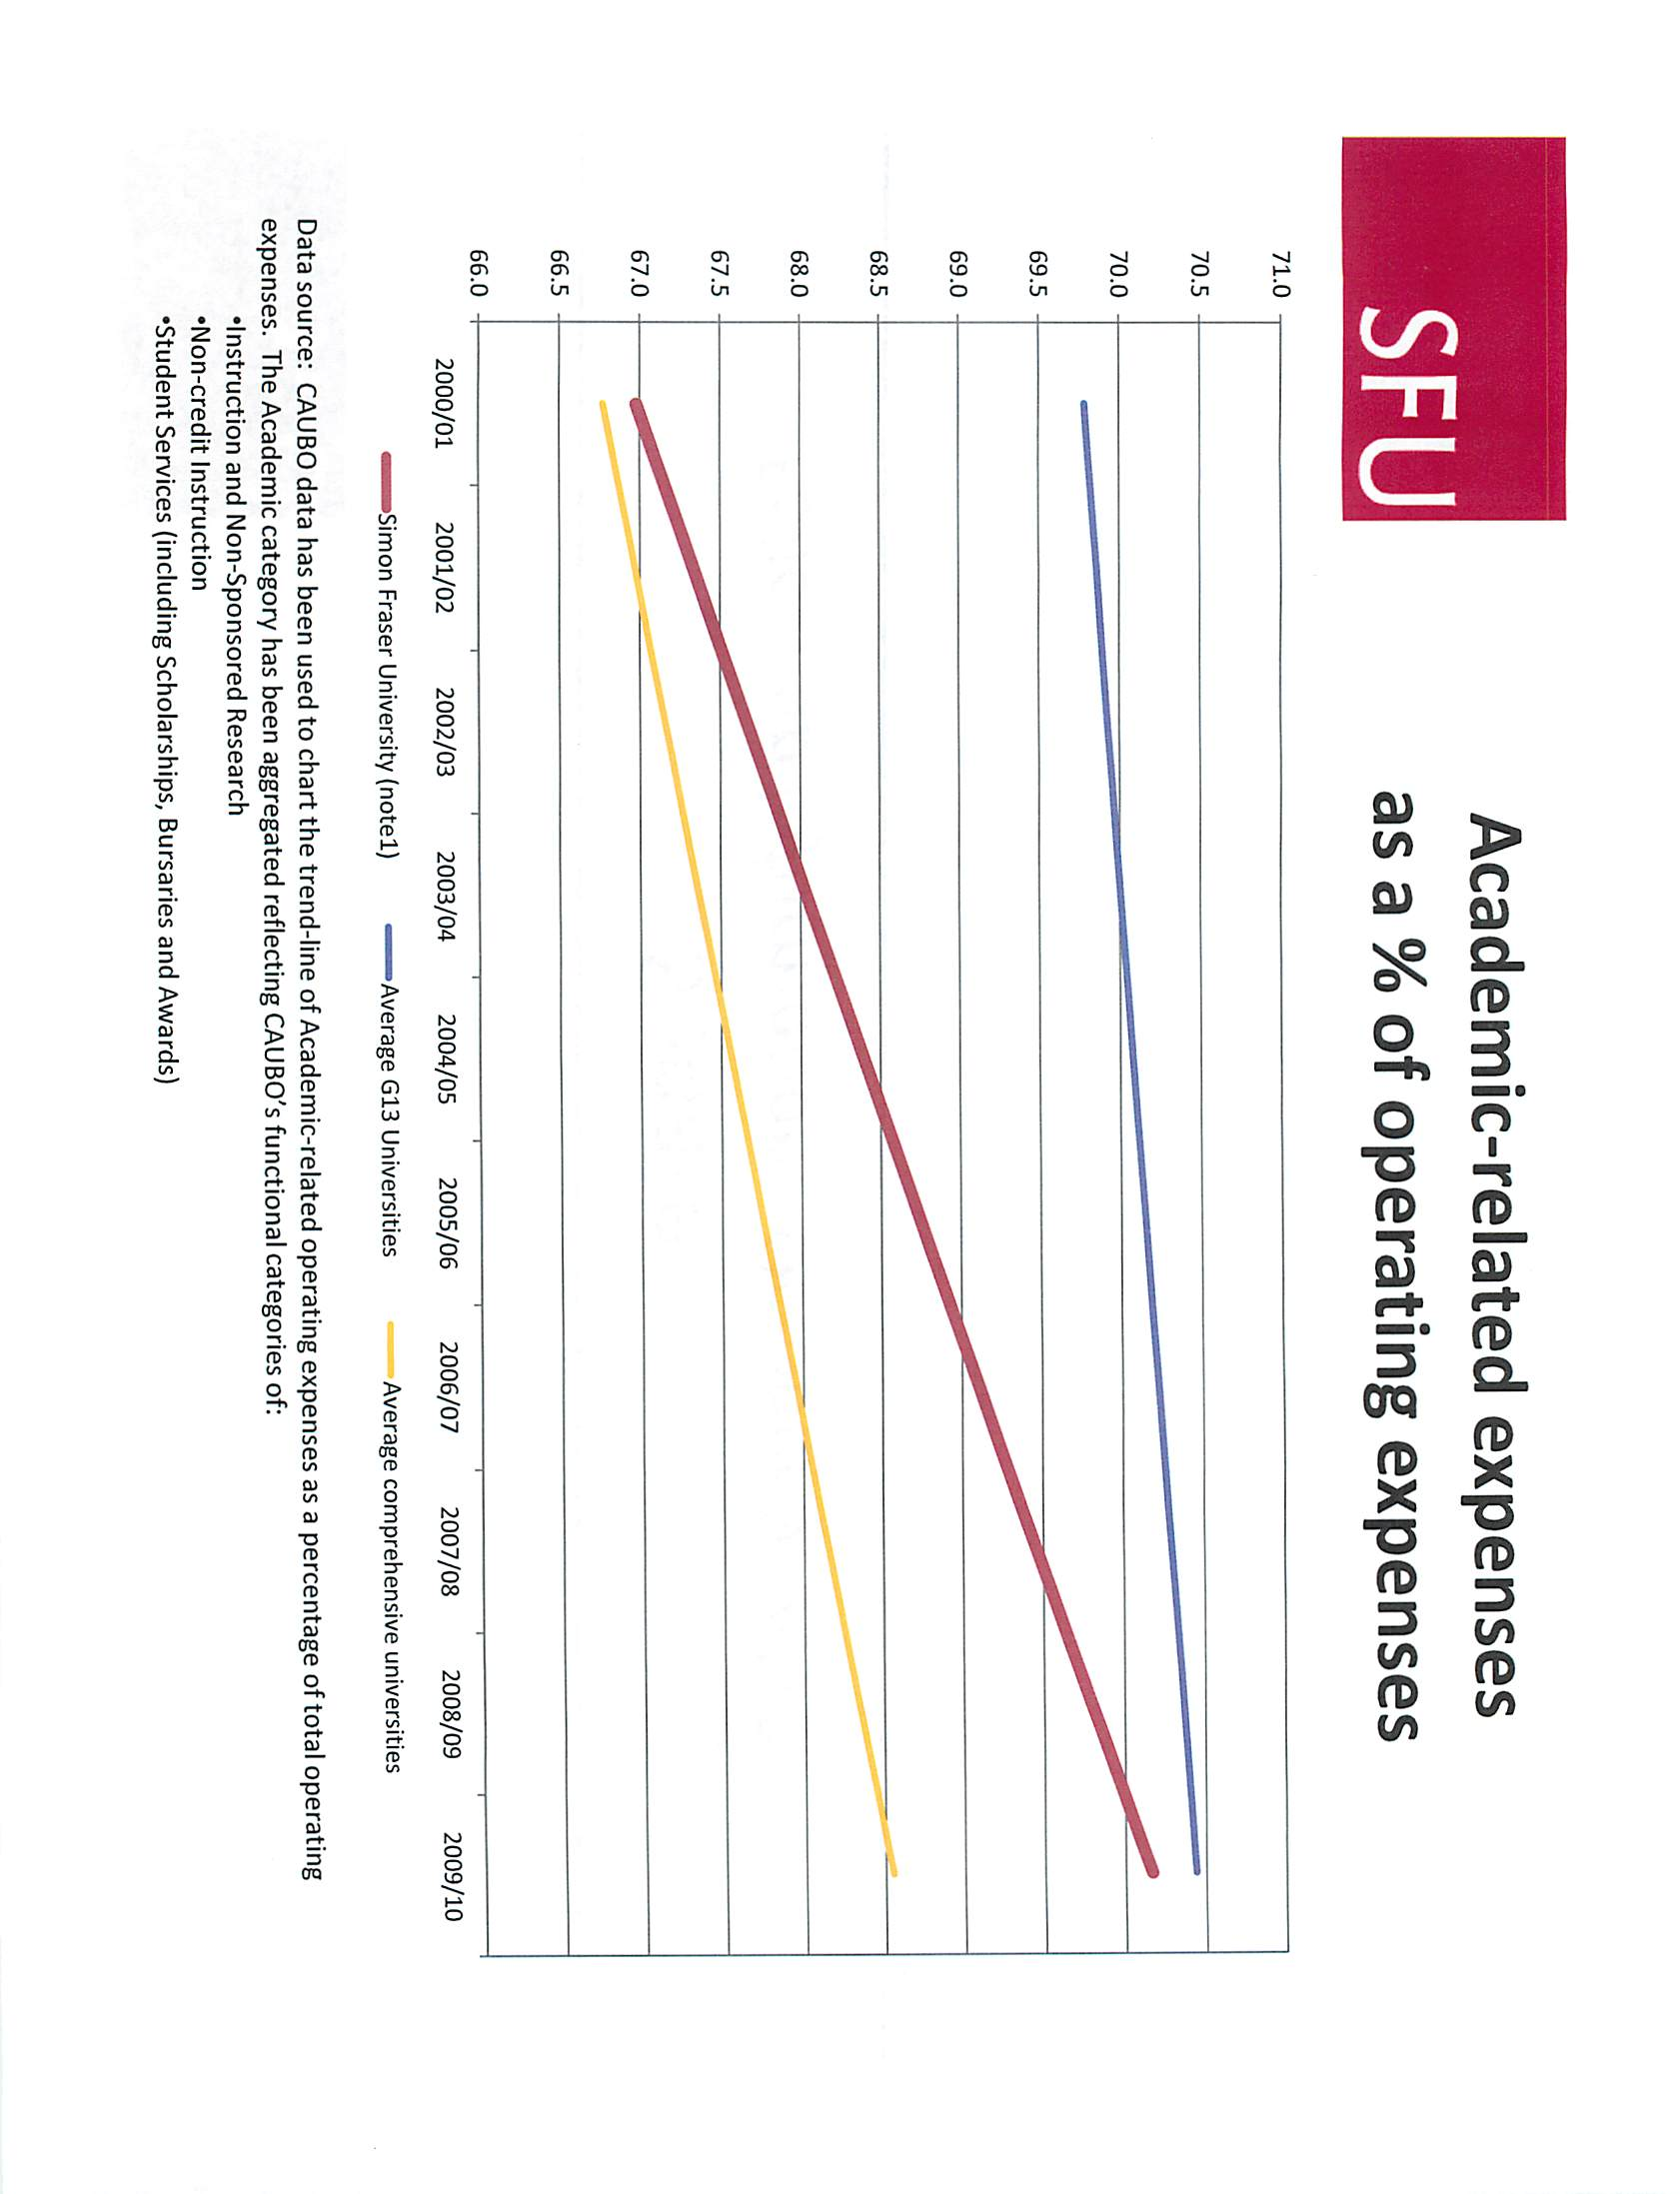
Academic-related expenses
as a % of operating expenses
2000/01
2001/02
2002/03
2003/04
2004/05
2005/06
2006/07
2007/08
2008/09
2009/10
«^—Simon Fraser University (notel)
^—Average
G13 Universities
Average comprehensive universities
Data source: CAUBO data has been used to chart the trend-line of Academic-related operating expenses as a percentage of total operating
expenses. TheAcademic category has been aggregated reflecting CAUBO's functional categories of:
•Instruction and Non-Sponsored Research
•Non-credit Instruction
•Student Services (including Scholarships, Bursaries and Awards)
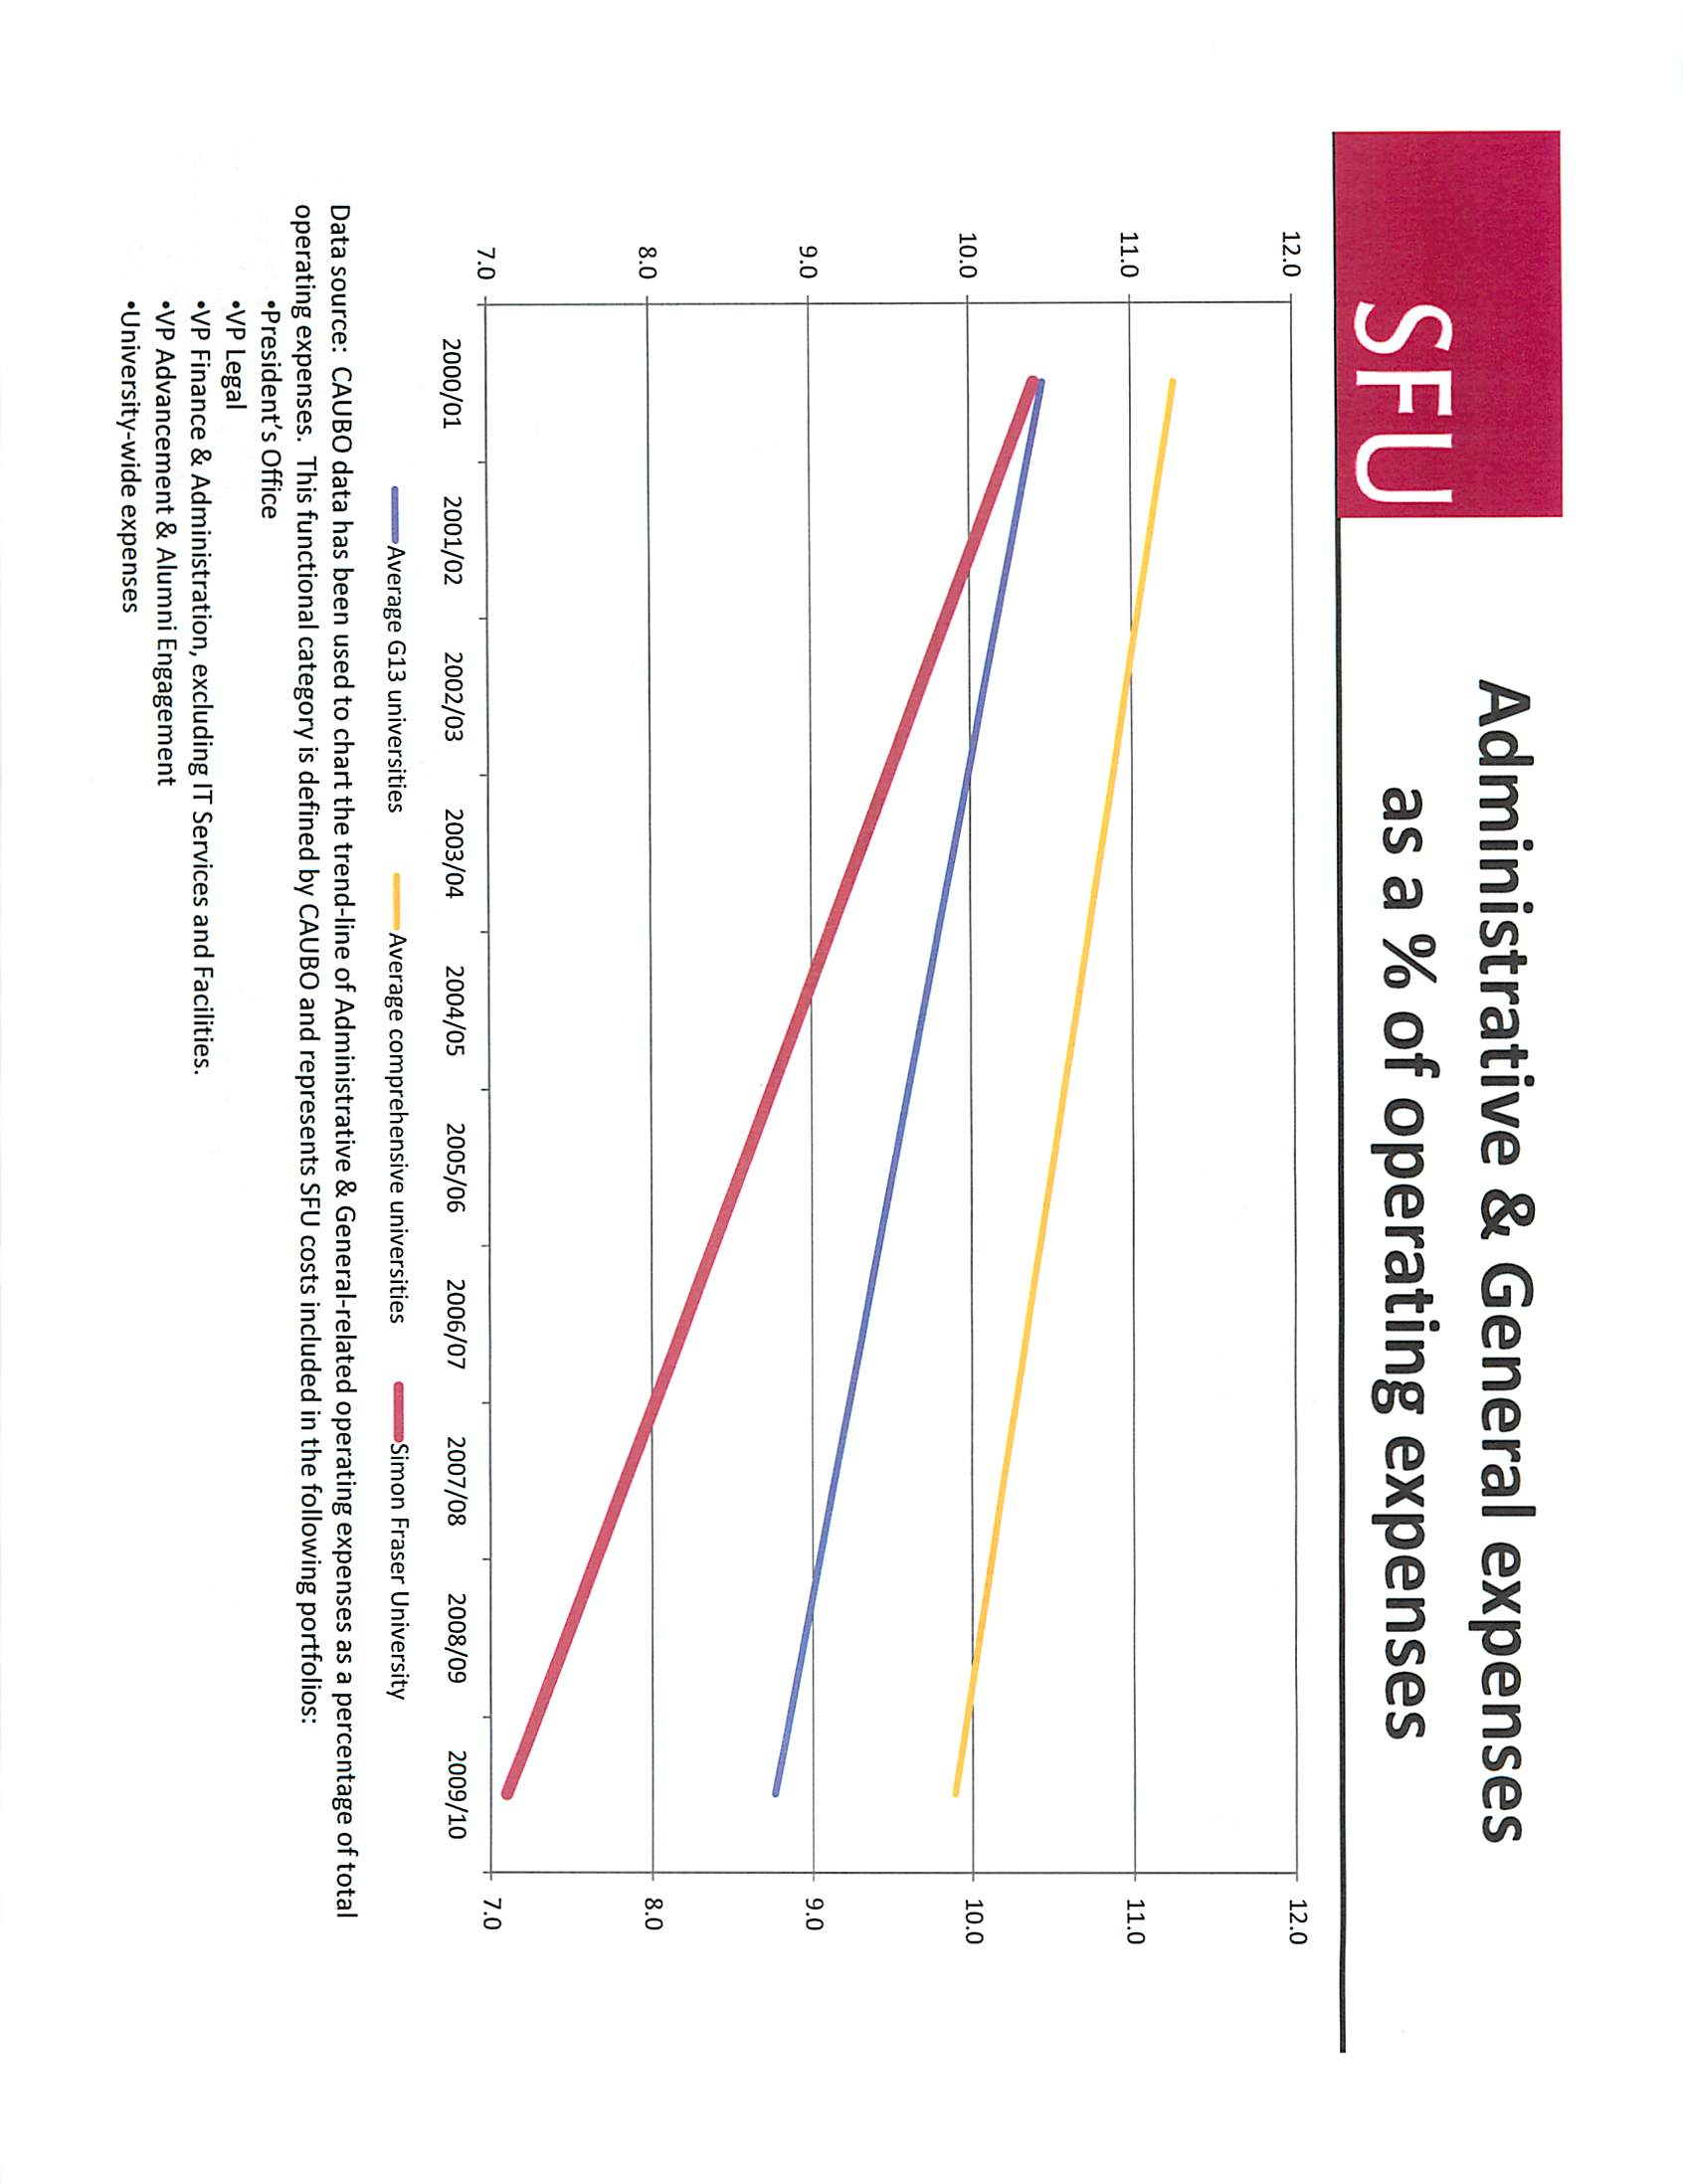
12.0
11.0
10.0
SFU
Administrative & General expenses
as a % of operating expenses
2000/01
2001/02
2002/03
2003/04
2004/05
2005/06
2006/07
2007/08
2008/09
2009/10
12.0
11.0
10.0
Average G13 universities
Average comprehensive universities
^™»Simon Fraser University
Data source: CAUBO data has been used to chart the trend-line of Administrative &General-related operating expenses as a percentage of total
operating expenses. This functional category is defined by CAUBO and represents SFU costs included in the following portfolios:
•President'sOffice
•VP Legal
•VP Finance &
Administration, excluding ITServices and Facilities.
•VP Advancement & Alumni Engagement
•University-wide expenses
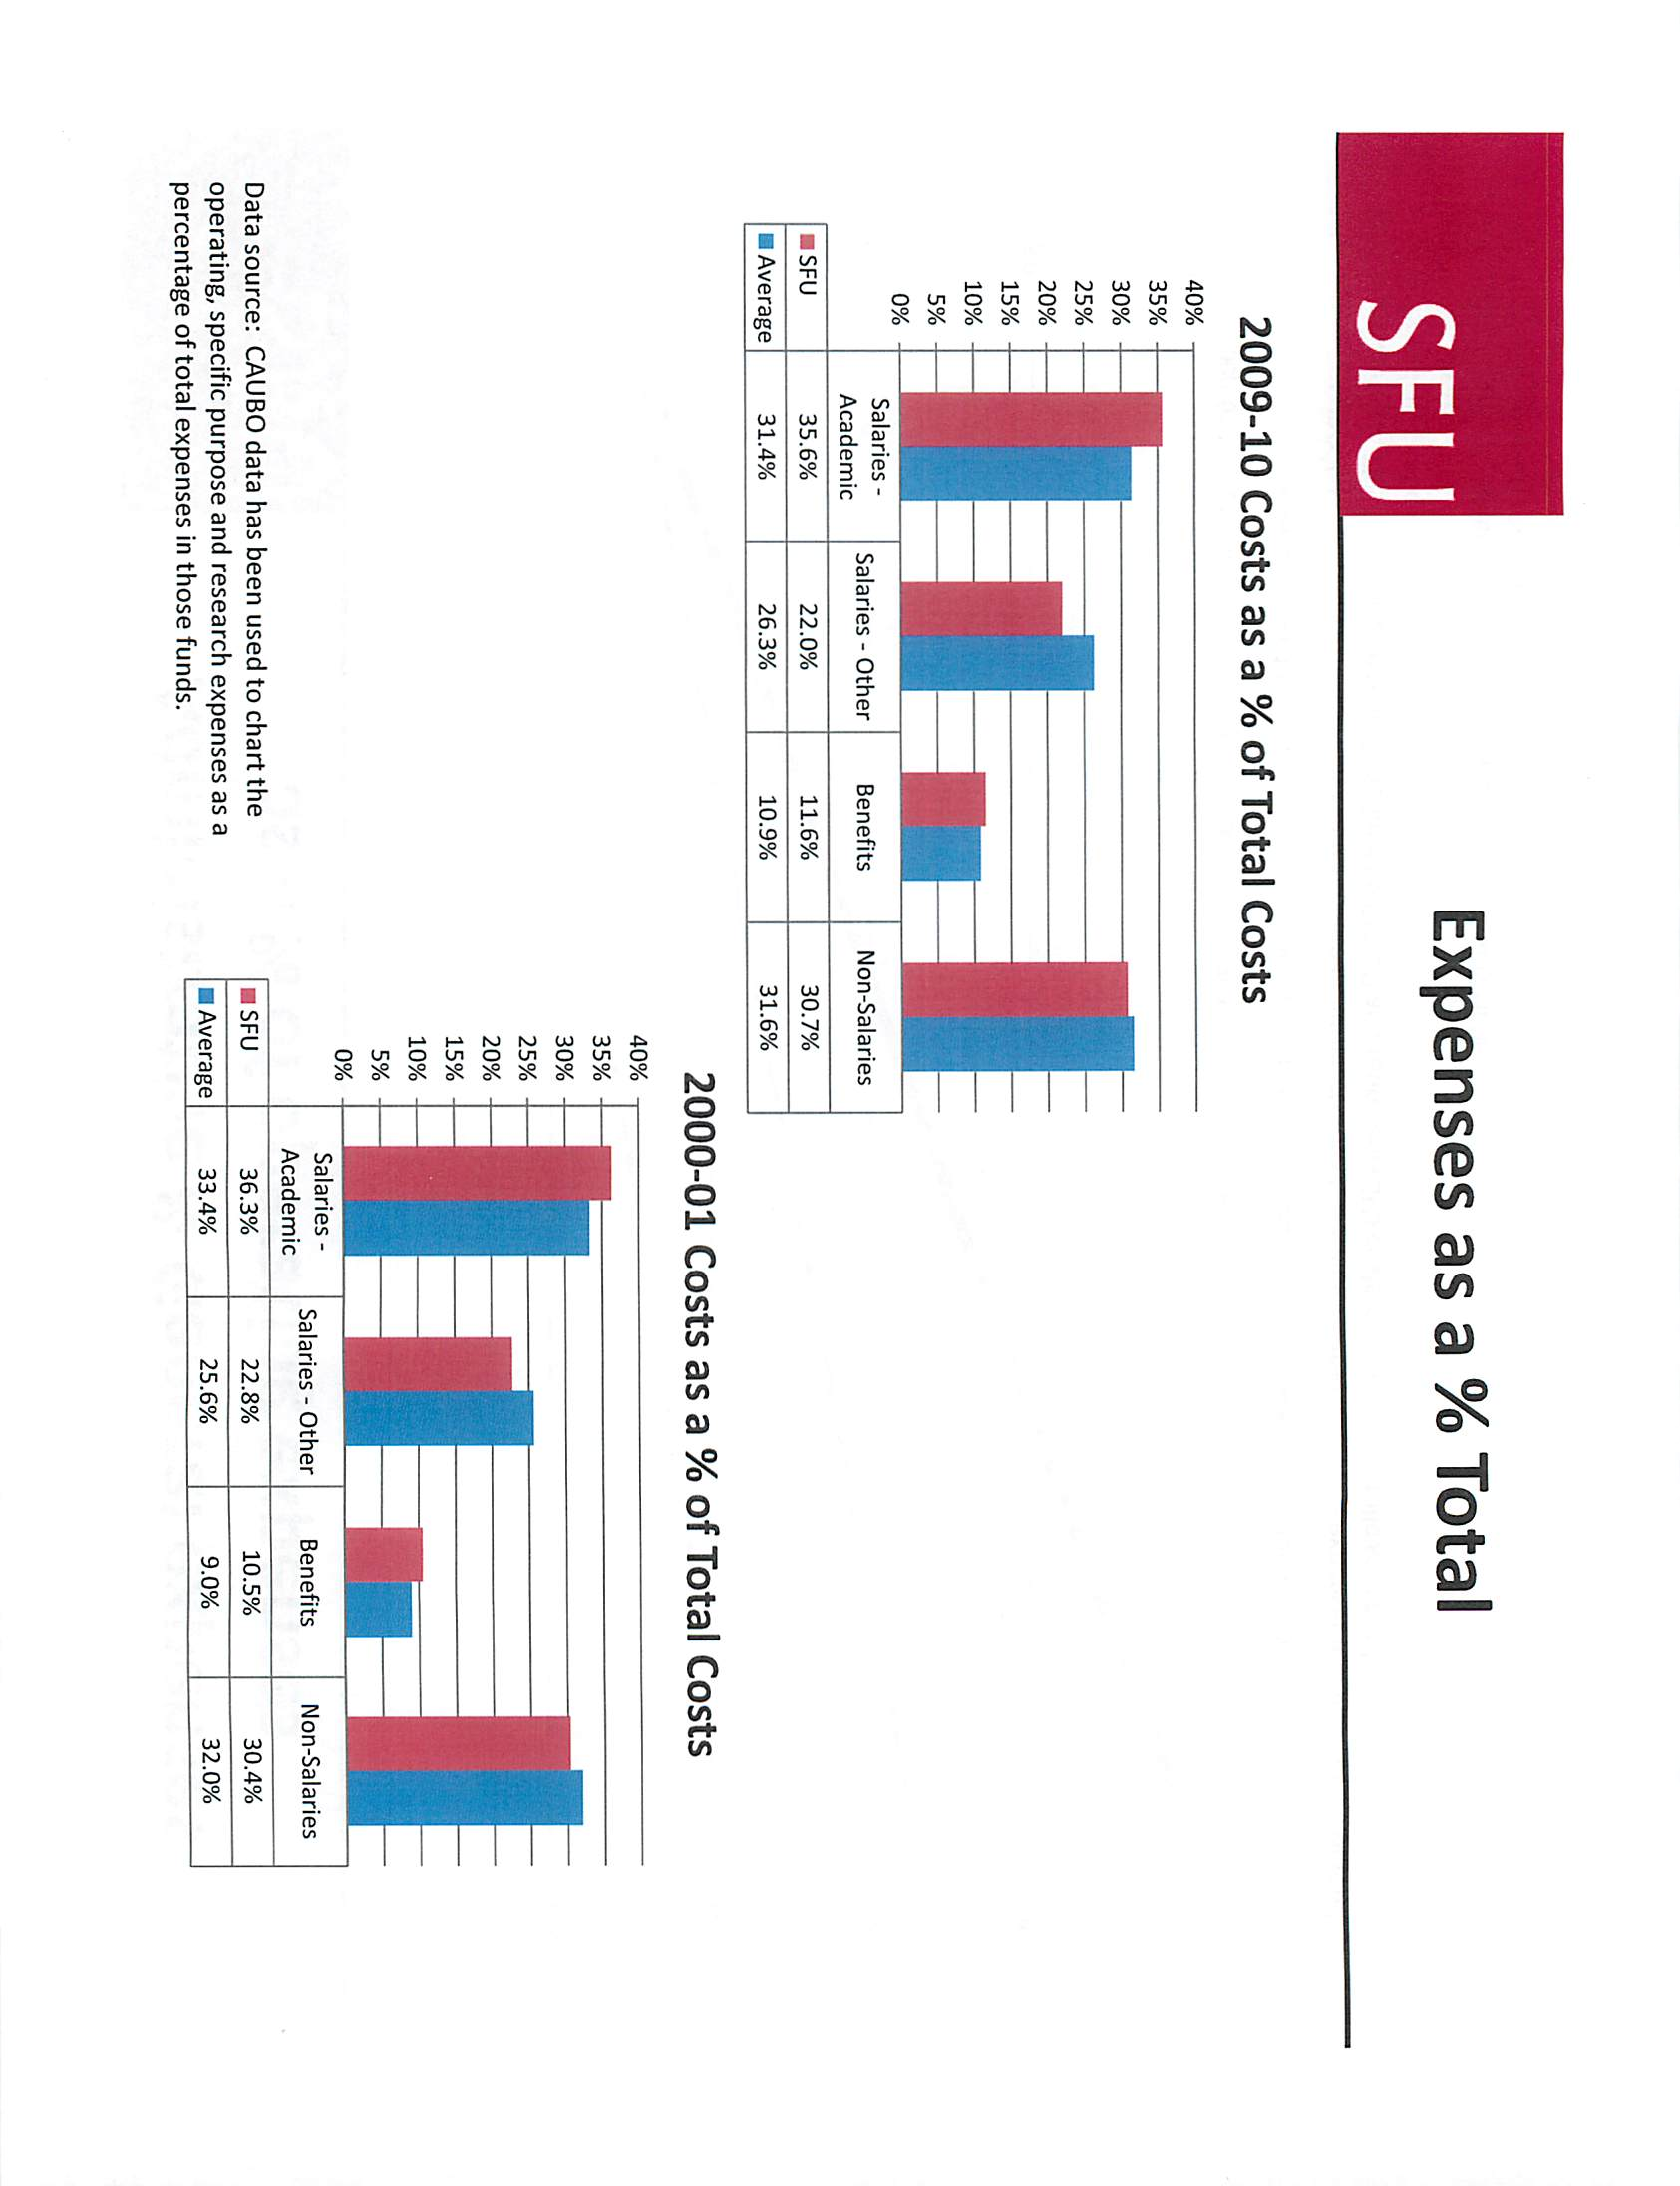
SFU
Expenses as a % Total
2009-10 Costs as a % of Total Costs
Data source: CAUBO data has been used to chart the
operating, specific purpose and research expenses as a
percentage of total expenses in those funds.
2000-01 Costs as a % of Total Costs
Back to top