I
SFU
To
:
Senate
S
I
MON FKASER UNIVER
S
I
T
Y
INS
T
I
TUT
IONAL
R
E
SEAR
C
H AND P
L
AN
N
IN(
;
F
r
om
:
S.12-137
Jacy
Lee, Director
~
Institutional Research
and
Planning
[IRP)
Subj
e
ct:
IRP
Reports
for Information
Date
:
August 22, 2012
At a
meeting
of
Senate held
on
March
7, 2011, Senator Paul
Perc
i
val
r
e
quested
that
relevant IRP
reports, such as,
the
annual
Grades Report be
brought
to
Senate for
information.
Attached are
two reports for information:
•
2011/12
Grades Report: This report is
pr
e
pared
once a year and
it summarizes
student
course
grades
at
the
University over a ten
year
period.
The
2011/12
Grades
Report
covers
the period from 2002/03 to
2011/12. Attached
is
t
he Summary Report.
The
full
report
is located
at
I
RP's website
http:ljwww.s
f
u.ca/content/dam/sfu/irp/students/grades
repo
rt/grades.re
p
ort.
pdf
•
2011 Undergraduate Student
Survey
(UGSS) Report
:
Th
e
UGSS surv
e
y is conduc
te
d
every
fall
term. The attached Highlights
report
presents a summary of key f
i
ndings
from
th
e
Fall
2011 survey
.
Topics
covered
are selected in consultation
with
Faculties,
Student Services and
other
administrative
units
of
the Univer
s
ity. Th
e
topics
included
:
course availability, teaching
and curriculum, student engagem
e
nt and selected
s
ervice
s
,
s
u
c
h
as
F
a
cilitie
s
,
use
o
f campus
e
s and
the
Library and Student Learning
Commons
.
The
full
repor
t
is
located at
:ljwww.sfu.ca/content/dam/sfu/
irp/surv
eys/ugss/ugss201
1report.
pdf
Enclosure
h
NHtllh'll.tl
H..,.
,...,J
h
h
.
111
d
P
l.11
111
111:.!.
~11111•11
I
LI'l'l
l
'
u
i'
,.
,,It~.
SX~K
l
'
11
1\
n'H
~
I
)
u
. :
.
:
.
B
tll
ll
.
ll
'~
.
B
: .
(
.ttl.hl.t
\
'='A
I
'
'
'
I
7-
s
:
~2
.
~'·
~>
o
•
1
::..
:--
;:
·
(
"~
t
,
~·~·,
1
'
''\
,fu.,.
a
11)
'
SIMON
FRASER
UNIVERSITY
I
N
STIT
U
TI
ONA
L RE
SE
AR
C
H A
N
D PL
AN
NI
NG
2011/12 Grades
Report:
Summary
Historical Distribution of
Undergraduate and Graduate
Course
Grades
2002/03 to
2011/12
Prepared
by
Janice
Wiebe,
Program
A
ss
i
stant
Jessica
T
illey, Analyst
Institutional Research and Planning
Summer
2012
.2012-08-.2.2
2011/1.2 SFU GRADES REPORT: SUMMARY
Page 3
Table of Contents
I.
Introduction...............................................................................................................................................................
4
II.
Definitions and Notes...............................................................................................................................................
4
Ill.
Analysis.....................................................................................................................................................................
5
Undergraduate
Course Grades...........................................................................................................................
5
Lower Division...................................................................................................................................................
5
Upper Division...................................................................................................................................................
9
Undergraduate
Course Grades by Student Faculty.......................................................................................... 13
Graduate Course Grades..................................................................................................................................... 15
lll,tttutlniJ.tl ltc,,.,,:.,.h .md l'i.tn!llllg. \iiiH'''I r.t•c: t.:ll\..r'll\', Ssss l '111\
,.,.1~\
I ::1•... Ilen::.•'''.
1:( . (
:.1n.
11
:,,
\'-i:\
: '-.•,
T :-:...
~:-,~.
11•1.
t
' r
-:-~s ~:~~.l,.'i'~"
,,
\1\\ ...r11 ..• ,,
1
,
2012-0H-22
2011
/
12
Sf'U GRADES
REPORT:
SUMMARY
I - Introduction
This report
s
ummariz
es student
course
grades at Simon
Fra
ser University o
v
er
t
he
ten
year
period
from 2002/03 to 2011/12
1•
Th
e full
report,
which presents
t
h
e
f
u
ll grade distributions
in both tabular and graphical
for
mats
,
is
ava
il
ab
l
e on
lin
http
s
:Uwww
.
s
fu
.ca/
content/dam/s fu/i rp/
s
tud
e
n
ts/gra des
re port
/
gra
des
.
report. pdf
.
II- Definitions and Notes
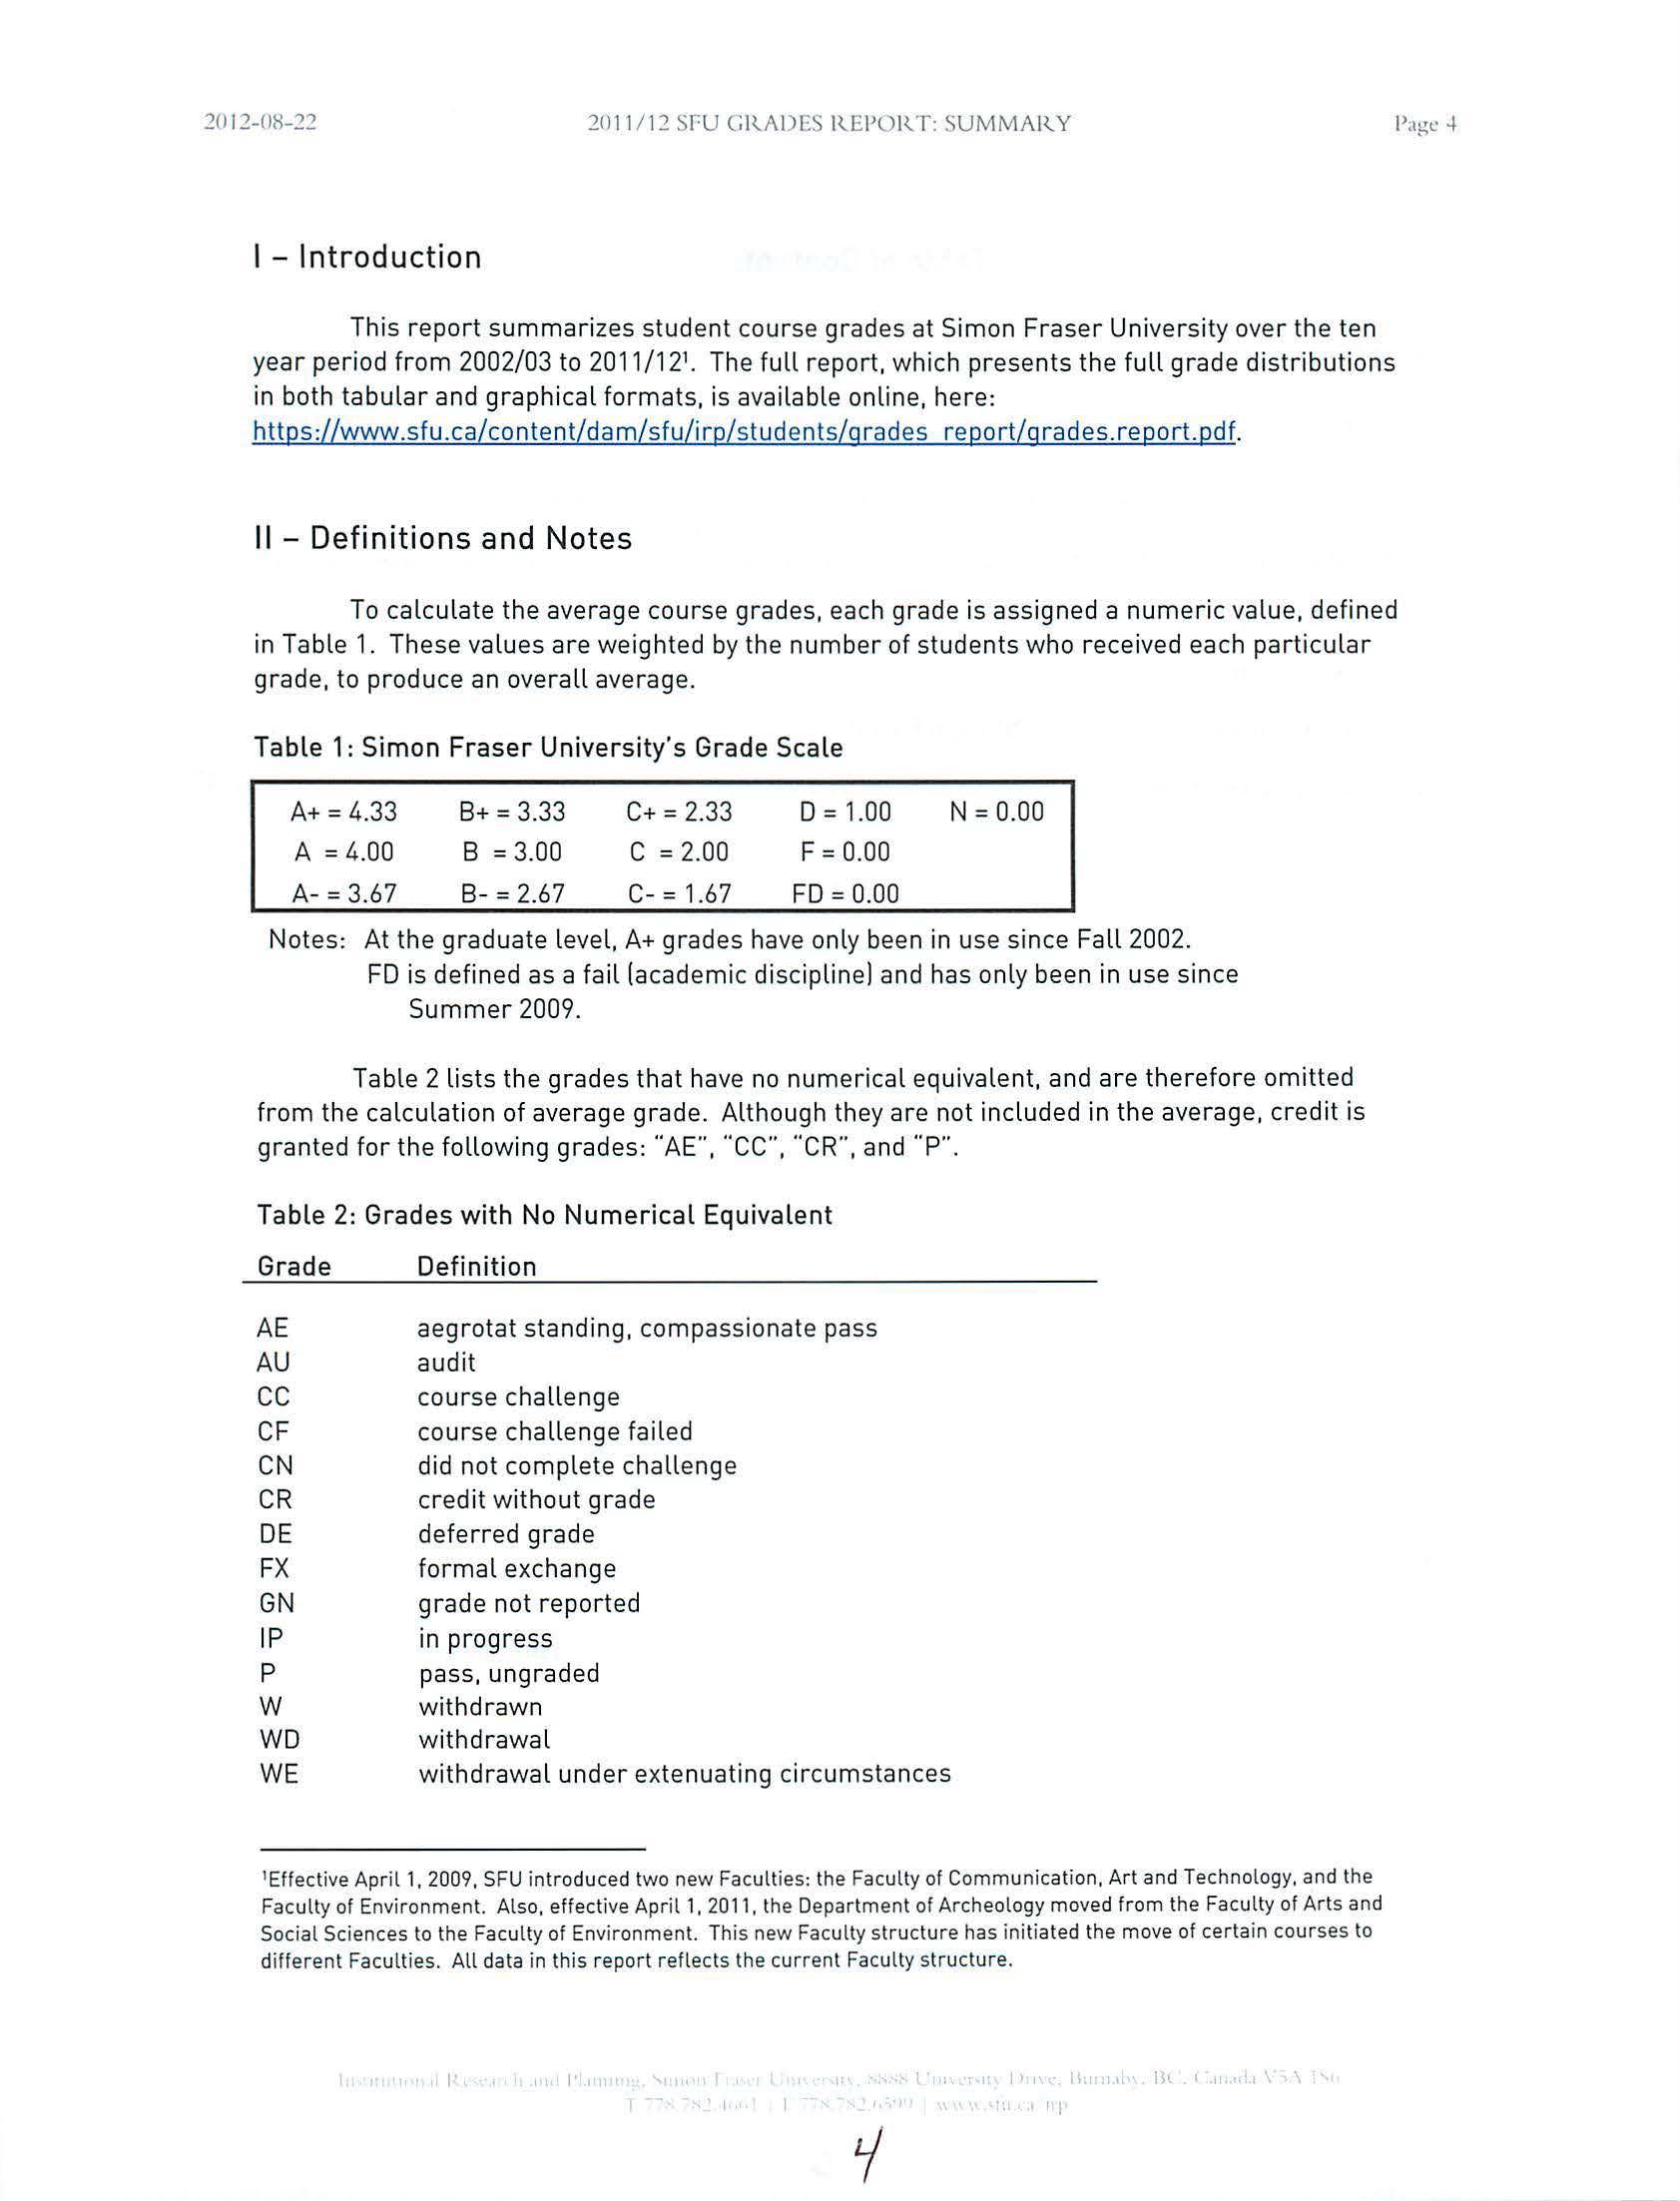
To
ca
l
cu
la
te the ave
rag
e course grades, each grade
i
s assigned
a numeric
va
lu
e
,
defined
in Table
1.
T
hese values are weighted
by the
number of students who received
each par
tic
u
l
ar
grade, to prod
uce
an
overall
average.
Table 1
:
Simon
Fraser University
's
Grade Scale
A+= 4
.
33
A
=
4.
00
A-= 3.67
B+
=
3.33
B
=
3
.
00
B- =
2.67
C+ =
2.33
c
=
2.00
C-
=1.
67
D
=
1.00
F
=
0.00
FD
=
0.00
N =
0
.0
0
N
otes: At the g
r
ad
u
ate
level,
A+
grades have
o
n
ly
been in use
since
Fa
ll
2002.
FD is defined
as a
fail (academic discipline]
and has only been
i
n use since
Summer 2009.
Table 2
li
sts
the grades that
h
ave
no numerical
equiva
l
e
n
t, a
n
d a
r
e the
r
efore omitt
e
d
from the
calculat
i
on of ave
r
age grade. A
l
tho
u
gh they are
not
inclu
ded
in th
e average
,
cred
it
is
g
r
an
t
ed for
th
e
following
g
r
ades:
"AE..,
"CC'
,
..cw,
and
"P".
Tabl
e
2: Grades with
No Numeric
a
l Equiv
a
lent
Grade
AE
AU
cc
CF
CN
CR
DE
FX
GN
IP
p
w
WD
WE
De
fi
nition
aegrotat standing
,
compassionate pass
a
udit
course challenge
course
cha
llenge
failed
did not complete
challenge
cred
i
t without grade
deferred grade
forma
l
exchange
grade
not
reported
in
progre
ss
pass,
un
graded
wit
h
drawn
withdrawa
l
wit
hdr
awa
l un
der
exte
nuating
c
i
r
c
um
stances
'Effec
tiv
e
April
1
, 2
00
9,
SFU
int
roduced
two
new Fac
ult
ies:
t
he Facul
t
y of
Communication, Art and
Technology
.
a
n
d
t
h
e
Fac
u
lty of Environment.
Also,
effective April
1,
20
11, th
e
Department of
Arch
eo
lo
g
y mov
ed
from
t
he Fac
u
lty
of
Ar
t
s and
Social Sciences
to th
e Fa
cult
y
of Environment. This
new Faculty str
u
c
tu
re has ini
t
iate
d t
he move
of certain
co
u
rses
t
o
d
ifferent Fac
ulti
es
.
All data
in
this
repor
t
reflects
the
curren
t
Fac
u
l
t
y struc
ture
.
I
I
I
ll (
:w
I
~-1 IX-~~
~011
I
I~
SFU GRADES R
.
EI'ORT: SUMMARY
Among undergraduate courses,
"
lower
division
..
courses are those numbered from
001
to
299 inclusive
.
"Upper
division
"
courses are numbered 300 to 499
inclusive.
Data reported on a yearly basis refers to fiscal
year.
For
example,
2010/11 grades are
the grades accumulated over the
2010 Summer term [SFU term code:
11041.
the 2010 Fall term
[SFU term code: 11071. and the 2011 Spring term
[SFU
term code: 1111).
To
protect student privacy, grade distributions
bas
ed
on five grades or fewer are not
reported.
Co-op courses, work-terms, and practicums
are
excluded from this report. Where
they could
be
identified,
courses graded as Pass/Fail
are
also
excluded.
Ill- Analysis
I
II.A
-
Undergraduate Course Grades
11/
.
A
.
T- Lower Division Course Grades {Courses Numbered 001-299/nclusive/
FAC
UL
TY C
O
M
P
A
RISI
ON
S
:
•
The
Faculty of
Education (EDUCl has
awa
rded
the highest average
low
e
r
division
course
grades in seven of the
last
ten
years, with
an average awarded grade of 3.04 over the past
decade
.
•
In
2006/07, the Faculty of Health Sciences
(HSCil
began offering
undergraduate
courses.
In
its first
three
years, courses in
Health
Sciences awarded the highest
average
lower
division grades, and have since remained among the top three
Facult
ies
for awarding the
highest average
lower division course grades [6-year average of 3
.
06).
•
The
average grades awarded
in
lower
division in
the Faculty
of Communication
,
Art and
Technology
[CAT]
courses
hav
e
been increasing over
the
past decade. This Faculty
awarded
the
second highest
lower division grades for the last two years.
•
All the other
Faculties
have consistently
awarded lower
average grades in their lower
division courses. In
general. lo
wer
division
cou
r
ses
in the Faculty of Environment (ENV]
have
awarded higher
grades
than
those
in
Arts and Social Sciences
(ARTS]
and Applied
Sciences
[APSCI.
while
lower division courses in the
Beedie
School of Business
[BUS]
and the
Faculty
of Science
(SCI
]
have awarded the lowest average grades
.
II
I'
I I
l
I
' (
~0
I
~-08-~~
~011/1~
SFU
GRADES REPORT:
SUMMARY
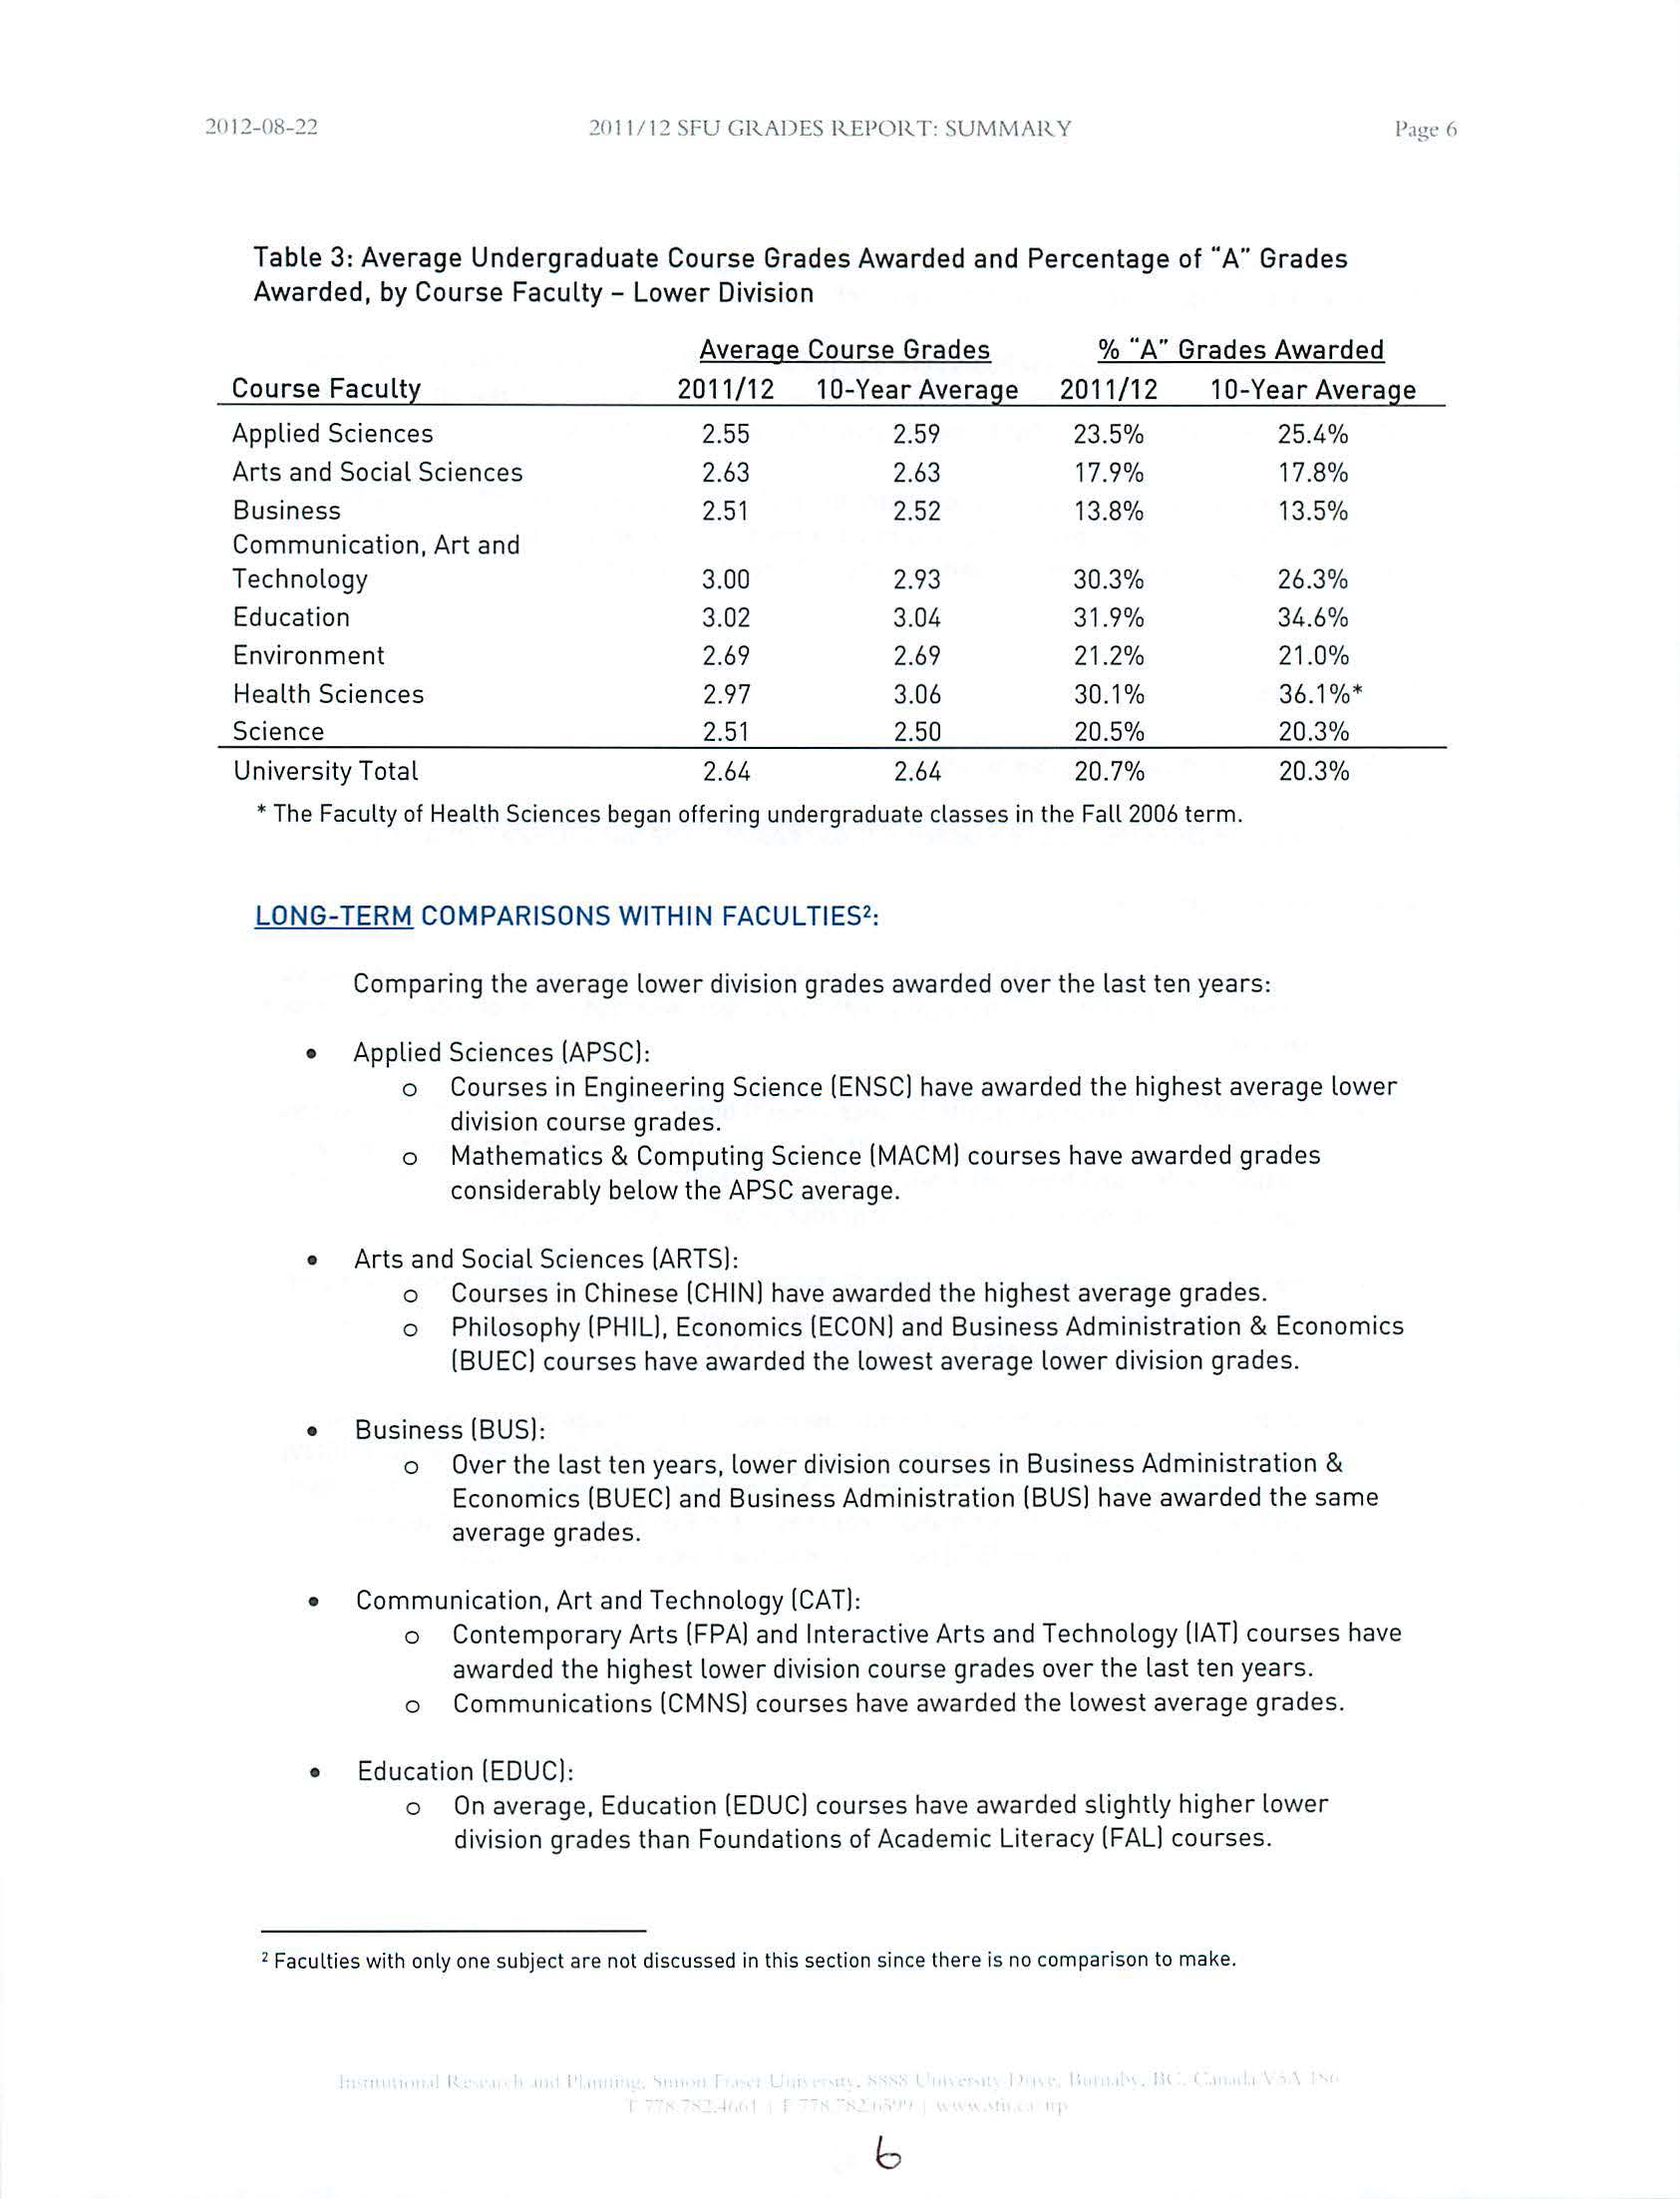
Table
3: Average
Undergraduate Course Grades
Aw
arded and
Percentage
of
"
A" Grade
s
Awarded
,
by
Co
u
rse
F
acult
y-
L
ower Division
Average
Course
Grades
%
"A
"
G
r
ad
es
Awa
r
ded
Course
F
aculty
2011/12
10-Year Ave
r
age
20
11
/12
1
0-Year Average
A
ppli
ed Sc
i
e
n
ces
2.55
2
.
59
23.
5
%
25
.
4%
Arts a
nd
Socia
l
Sc
i
ences
2.63
2.63
17.9%
1
7.8%
Business
2.51
2.52
13
.
8%
13.5%
Commun
i
catio
n,
Art and
T
ech
n
ology
3.00
2.93
30
.
3%
26.3
%
Education
3.02
3.04
31
.
9%
34
.
6%
E
nv
ironment
2.69
2.69
21.2%
2
1.0
%
H
ea
lth
Sciences
2.97
3.
0
6
30.1%
36
.
1
%*
Sc
ien
ce
2.51
2.50
20.5%
20
.3
%
University
T
o
t
a
l
2.64
2.64
20.7%
20.3%
*T
h
e
Faculty
of
H
ea
lth
Sciences
began
o
ff
e
ring undergradu
ate
classes
i
n the
Fall
2006 te
rm
.
LONG
-
TERM COMPARISONS WITHIN
FACULTIES
2
:
Comp
arin
g t
h
e average
low
e
r
division grades awarded ove
r
the
last ten ye
ars
:
•
Appl
i
ed Sc
i
ences
[AP
SC
]
:
o
Courses
in
E
ng
ineer
ing
Scie
n
ce
[EN
SC
l ha
ve
awarded the
h
i
g
h
est average
l
ower
d
i
visio
n
co
ur
se
g
r
ades
.
o
Math
e
matics
& Computing Sci
e
nc
e
[M
AC
Ml
co
u
rses have
awarded
grad
es
co
n
s
id
e
r
ably
b
elow
th
e A
P
SC ave
r
age
.
•
Arts a
n
d Socia
l
Sc
i
ences
[ARTS]:
o
Courses
i
n
C
hi
nese [CH
IN
]
hav
e awa
rded
the highest average
grad
es
.
o
P
hi
losophy
[
P
H
I
Ll.
Economics
[
ECON]
and
Busin
ess Adm
i
n
i
st
rat
io
n
&
Eco
n
om
i
cs
[BUEC] cou
r
ses
ha
ve
awarded the
lo
west ave
r
age lower divis
i
o
n
grades
.
•
Busine
ss
[BUS]
:
o
Over
th
e
l
as
t
ten
yea
r
s
,
l
ower
division
courses
in
Business
A
dm
i
n
ist
r
a
ti
o
n
&
Eco
n
omics
[BU
EC
l
a
n
d
Business
Adm
ini
stra
ti
on
[
BUS
] h
ave
a
wa
r
ded the
same
average g
r
ades.
•
Commun
i
cat
i
on
,
Art
a
nd
Techno
l
ogy
[
CAT]:
o
Co
n
temporary Arts [F
P
A
]
a
nd I
nteractive Ar
t
s
and
Tech
nol
ogy
[IAT
]
cour
ses
have
awa
rd
ed t
h
e h
i
g
h
es
t lower division
co
ur
se
g
r
ades
over
t
h
e
l
ast ten
years.
o
Commun
i
cations
[CMNS] co
u
rses
have
awar
d
ed the lowest
ave
ra
ge grad
es.
•
Edu
cat
ion
[EDUC
]
:
o
On
average
,
Ed
u
cat
ion
[EDUC]
co
urs
es
hav
e awa
rd
ed s
l
ightly
h
igh
er lower
d
i
vision
grades t
h
an Foundations
of Academic
Lit
eracy
[FALl
courses
.
2
Facu
ltie
s
with only
one
s
ub
jec
t
are not disc
u
sse
d in th
is
section
since
t
here is no
compa
rison to make
.
6
~01~-0H-~2
2011
I~
SfU
CllADES REPORT
SUMP.IARY
l'.tg<"
7
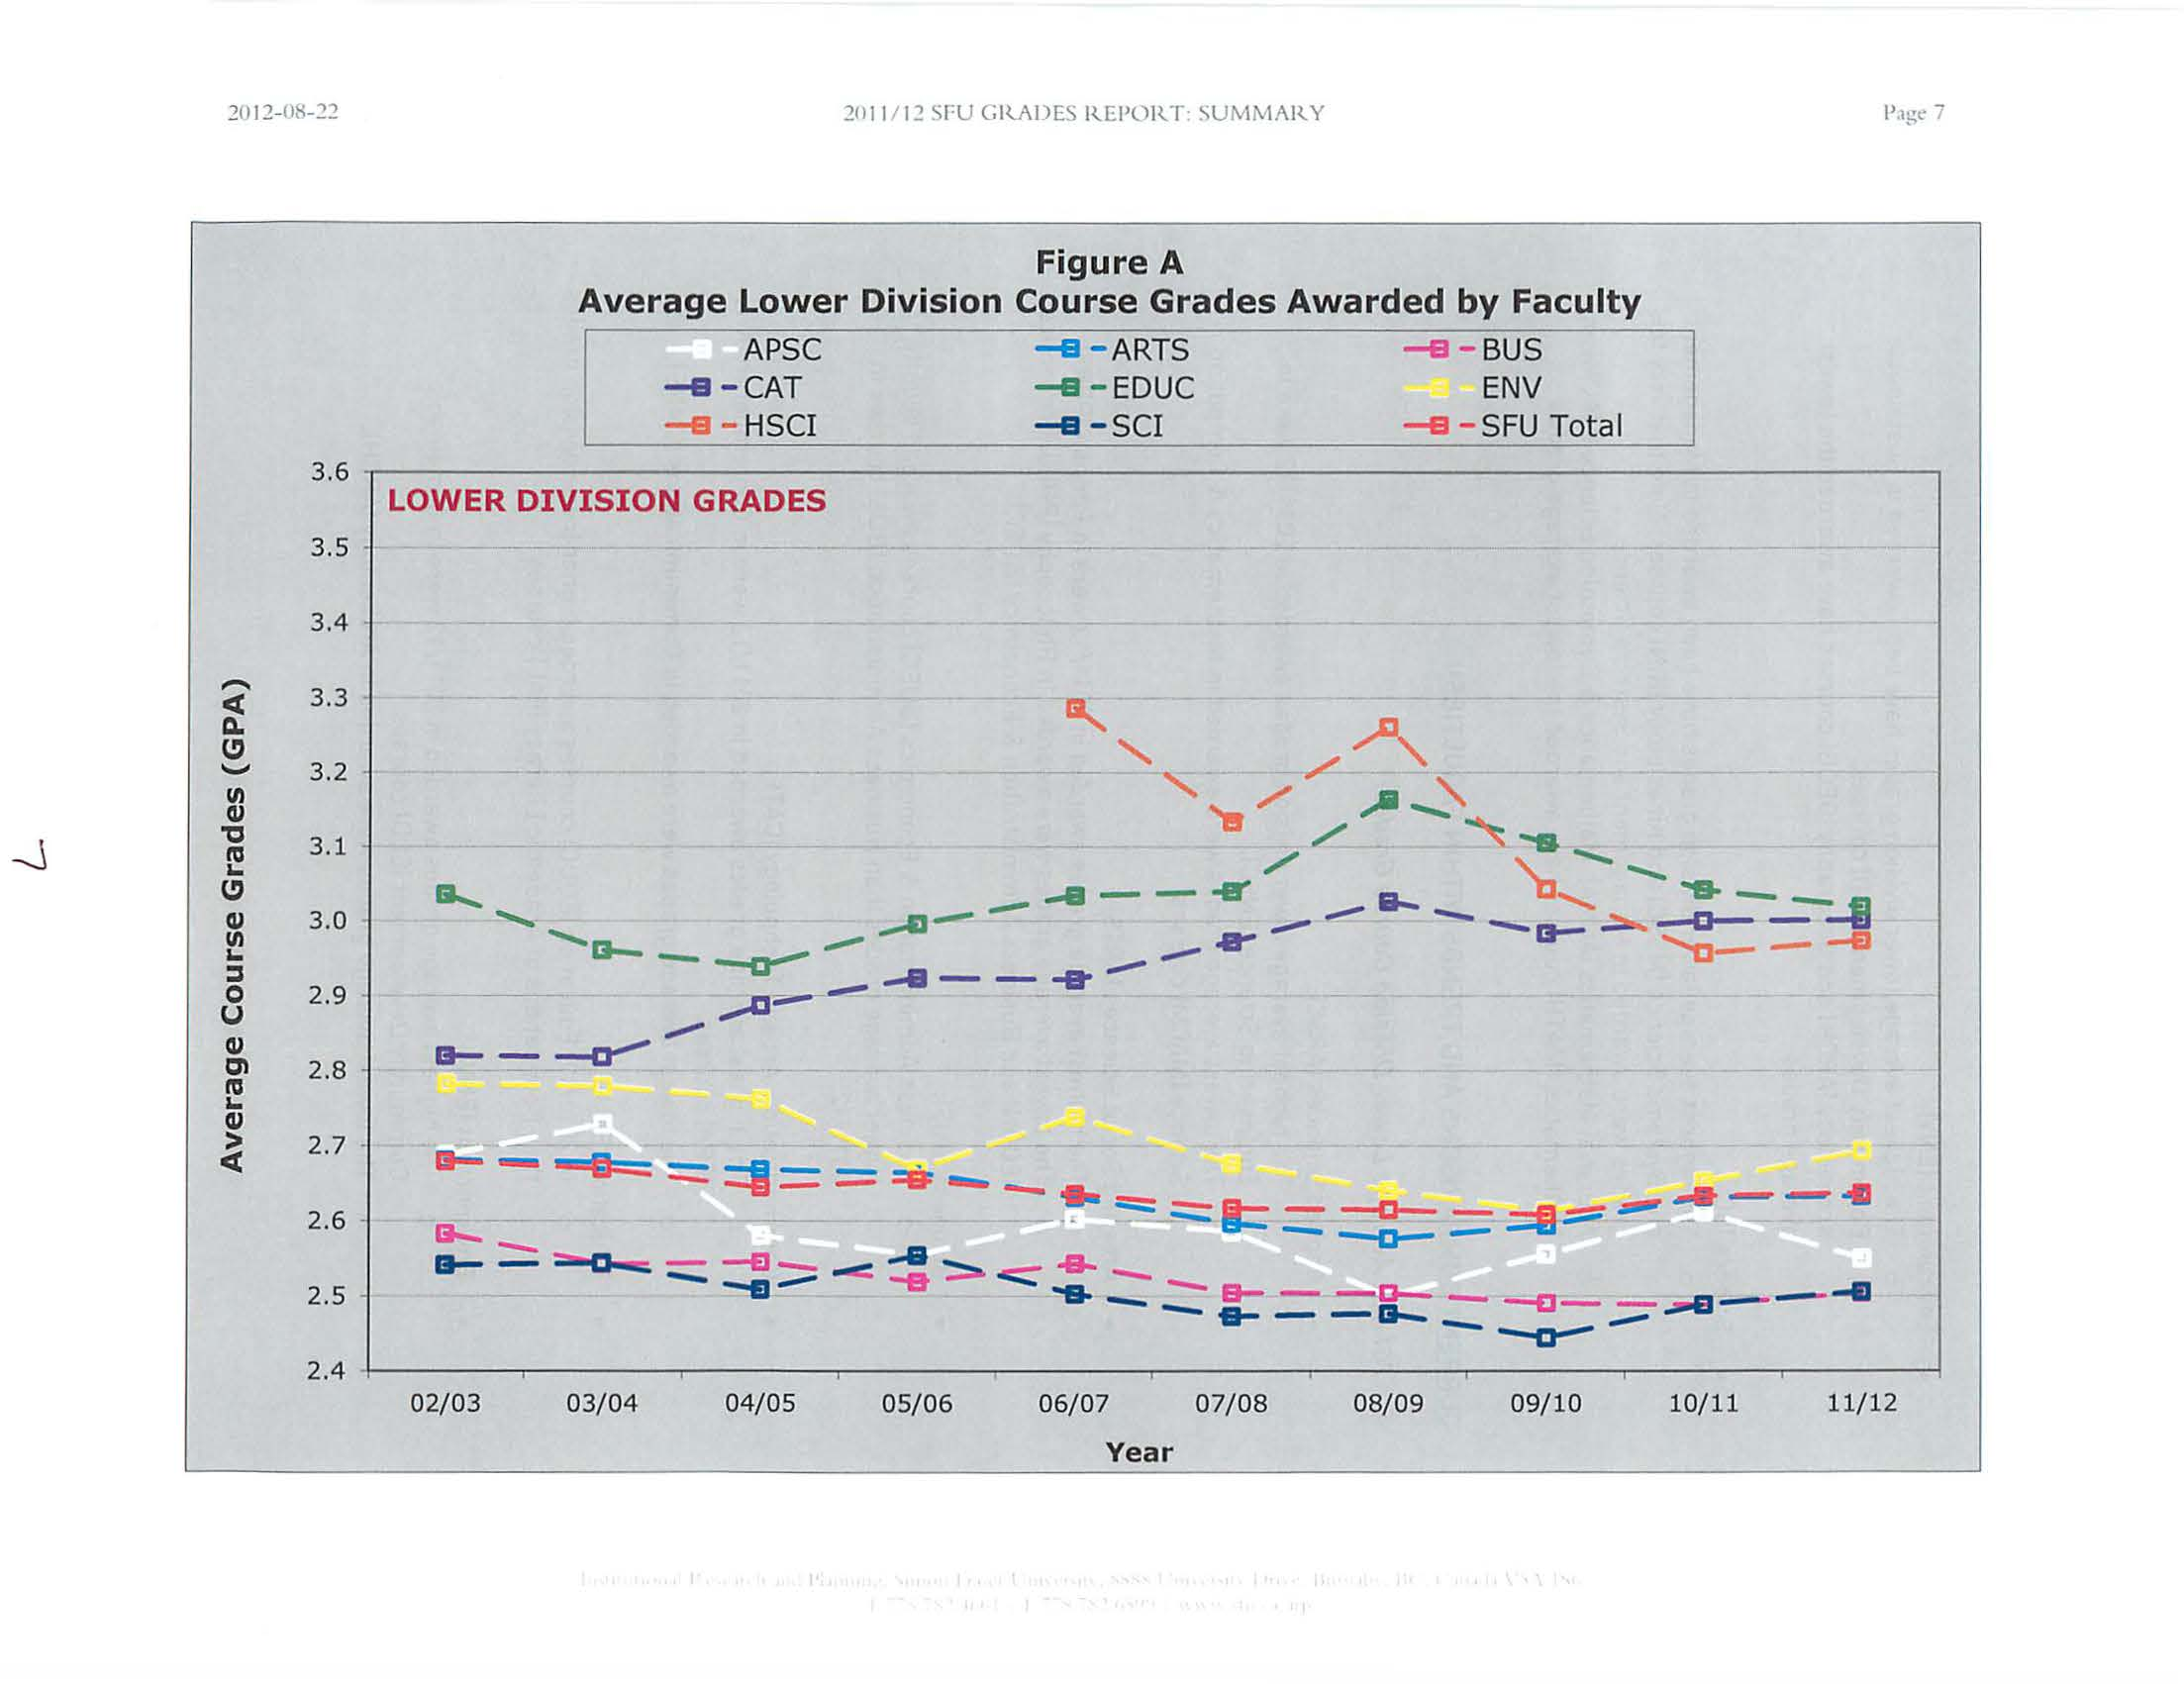
Figure A
Average Lower Division Course Grades Awarded by
Faculty
APSC
-
-
ARTS
-
-
BUS
-e-
CAT
--
EDUC
ENV
-e
-
HSCI
--
SCI
- -
SFU Total
3.6
.-----------------------------------------------------------------------------------~
LOWER DIVISION GRADES
3.5
3.4
-
C(
3.3
Q.
.._,
~
3.2
{/)
QJ
,
3.1
"'
a..
~
QJ
{/)
3.0
a..
:I
0
2.9
u
QJ
en
2
.
8
"'
a..
QJ
C(
>
2.7
.
2.6
2.5
2.4
02/03
0
3/
04
04/05
05/06
06/07
07/0
8
08/09
09/10
10/11
11/12
Year
2012-0H-22
20 II
I
12
Sf-U CR.ADES
RE
P
OR.T:
SUMMAR.
Y
•
Environment
(EN
V]:
o
Th
e
highest average
lo
we
r
div
i
s
i
on
grades have been awarded
i
n Sustainable
Commu
ni
ty
Development
(
SCD] co
u
rses.
o
A
rcheology
(ARCH]
a
n
d
Geography
(
GEOG] co
ur
ses have
awarded the lowest
average grades.
•
Science
(SCI]
:
o
The
highest
average
l
ower
division grades
h
ave
be
en
awarded
i
n
Management
and Systems Science
(MS
SC
]
and Kinesiology (KIN]
co
urs
es.
No
te t
ha
t very
few
grades were award
ed
in
Management and
Systems
Science.
o
Actuarial
Math
emat
i
cs
(A
CMA
I. Math
ema
t
ics
&
Co
m
p
uti
ng
Sci
ence
[
MACM] and
Mathematics
[MATH]
co
ur
ses
have awarded the
l
owest
average
grades
.
CURRENT
COMPAR
ISONS
AND TRENDS WITHIN
F
ACULT
IES
2
:
2011/12
Average Lower Division Course Grades
:
•
Applied Sc
i
ences
[APSC]:
o
The
highest average lower
di
v
i
sio
n
grades awarded in 2011
/
12 were
i
n
Engineering
Science (ENSCI.
o
Th
e
lowest
average
grades
we
r
e
awarded
i
n
Mathematics
& Compu
t
i
ng
Science
(M
ACM
]
courses.
•
Ar
t
s
and Social
Sc
i
e
nc
es
(
A
RT
S]:
o
The
high
est ave
r
age
grades
awar
d
ed
in
201
1
/
1
2 we
r
e
i
n
Persian (PERSI.
o
The
l
owest ave
r
age
grades
were awa
rd
ed
in
P
h
i
loso
p
hy (PH
I
Ll,
Economics
(ECON] and Business
Ad
mini
st
ration
&
E
co
nomi
cs
(B
U
E
C
].
•
B
us
i
n
ess (BUS
]:
o
Bu
s
in
ess Adm
ini
st
r
ation & Eco
n
om
i
cs
(BUEC]
co
u
r
ses awarded
slightly
high
er average grades t
h
a
n Bu
s
in
ess Adm
ini
s
t
r
at
i
on
(
BUS] courses
in
2011/12
.
•
Commun
i
cation
,
A
rt
and
T
ec
hn
o
l
ogy
(CAT]:
o
The
highest
average g
r
ades awarded
in
2011
/
1
2 were in Cont
e
mpo
r
ar
y
Arts
(
FPA
l
co
ur
s
e
s.
o
Th
e
lowest
average grades were awa
rd
ed
in
Comm
u
n
ic
ations (CMNS
].
•
Ed
u
ca
ti
o
n (E
D
U
C
]
:
o
In
201
1
/12,
Education
(EDUC]
co
ur
ses awarded
h
igh
e
r l
ower
d
i
v
i
s
i
on grades
th
a
n F
o
undat
ions of Academ
i
c
Li
te
r
acy
(F
A
Ll
co
ur
ses
.
•
Environment [ENV]:
o
Th
e
highest
average grades awa
rd
ed
i
n 2011
/
12
we
r
e
i
n
Sustaina
b
l
e
Commun
i
ty
D
eve
l
opment
[
SCD
]
co
ur
ses.
o
The low
es
t average grad
e
s were awarded
in
Arc
h
eo
l
og
y
[ARCH
].
H
'
\
\
8
~o
II
I~
sru GRADES REI'ORT: SUMMARY
•
Science
(SC
I
]:
o
The high
es
t
average grades
i
n
2011/12 we
re
awarded in
Man
ageme
nt
&
S
ys
tems
Sc
i
e
n
ce (MSSC;
note
that
very
few
grade
s we
r
e
awarded
in MS
SC
this
yea
rl
o
Th
e
l
owest average
grad
es
were
awarded in
Actuarial
Math
e
matic
s
(ACMAI.
Large Changes in
2010/11
to
2
011
/
12
Average
Lower Division Grades
:
Page: 9
•
The following
subjects
ha
ve see
n
large changes
(of
at
lea
s
t
0
.
25
1in the
average
lower
di
v
ision grad
e
awarded
from
last
year
to th
is yea
r:
o
Increa
ses:
En
v
ir
onmenta
l
Science [
EV
SC: 2.64
to 2.921 and Management
&
Systems
Science
[MSSC:
3.94 to 4.24;
note that
very few
grades
were
awarded in MSSC this
yea
rl.
o
Decrea
ses:
F
o
undat
ions of
Academic
Lite
rac
y
[FAL:
2.93
to
2.63
]
and Labour
Stud
ies
[LBST
:
2.99
to
2.68
1.
///.A.2- Upper Division Course Grades /Courses Numbered
300-499
Inclusive/
FACU
L
TY C
O
M
P
A
RISI
ONS
:
•
With the exception of
2006/07,
th
e
Faculty of Education
(EDU
C
I
awarded
the highe
st
ave
r
age
upper
division
cou
r
se g
r
ades
in
eac
h
of
t
he last
ten years
[
ave
r
age
grade
awarded:
3.471.
•
After
Education,
t
h
e
Faculties
of Communication
,
Ar
t
and Technology
[CATI
and
H
ea
lth
Sciences
[HSCII ha
ve awarded t
h
e
high
est
upp
er
division
average
grades
over t
h
e
past
ten
years
(1 0-year
ave
r
a
ge
of 3.21
and
3.22
,
respect
i
ve
l
y.]
It
sho
u
ld be
noted that HSCI
has only
bee
n
offering
und
ergrad
u
a
te
co
ur
ses for
th
e
pa
st six
years, and
th
e
averag
es fo
r
its fi
rst t
wo
yea
r
s
were based
on
relatively
s
m
all sa
mpl
e s
i
zes.
•
Th
e
remaining Fa
cu
lti
es
ha
ve
co
n
sistent
l
y awarde
d low
er
average
u
pper
division
gr
a
d
es
,
averaging in the
range
of
2.92 to 3.04.
Ho
wever
,
upper division
grad
es
awarded
in th
e
Faculty
of
Environm
en
t [ENVI
have been
incr
easing
over the past two years, and are
no
w
n
ear
ly as high
as those
in
Comm
u
nicat
ion,
Art
a
nd T
ec
hnolog
y
(CATI and
H
ea
lth
Sc
i
e
n
ces
[H
SC
II.
,•
2012-0H-22
20
I I
I
12
SFU G
l
tADES IUPOR
T:
SUMMARY
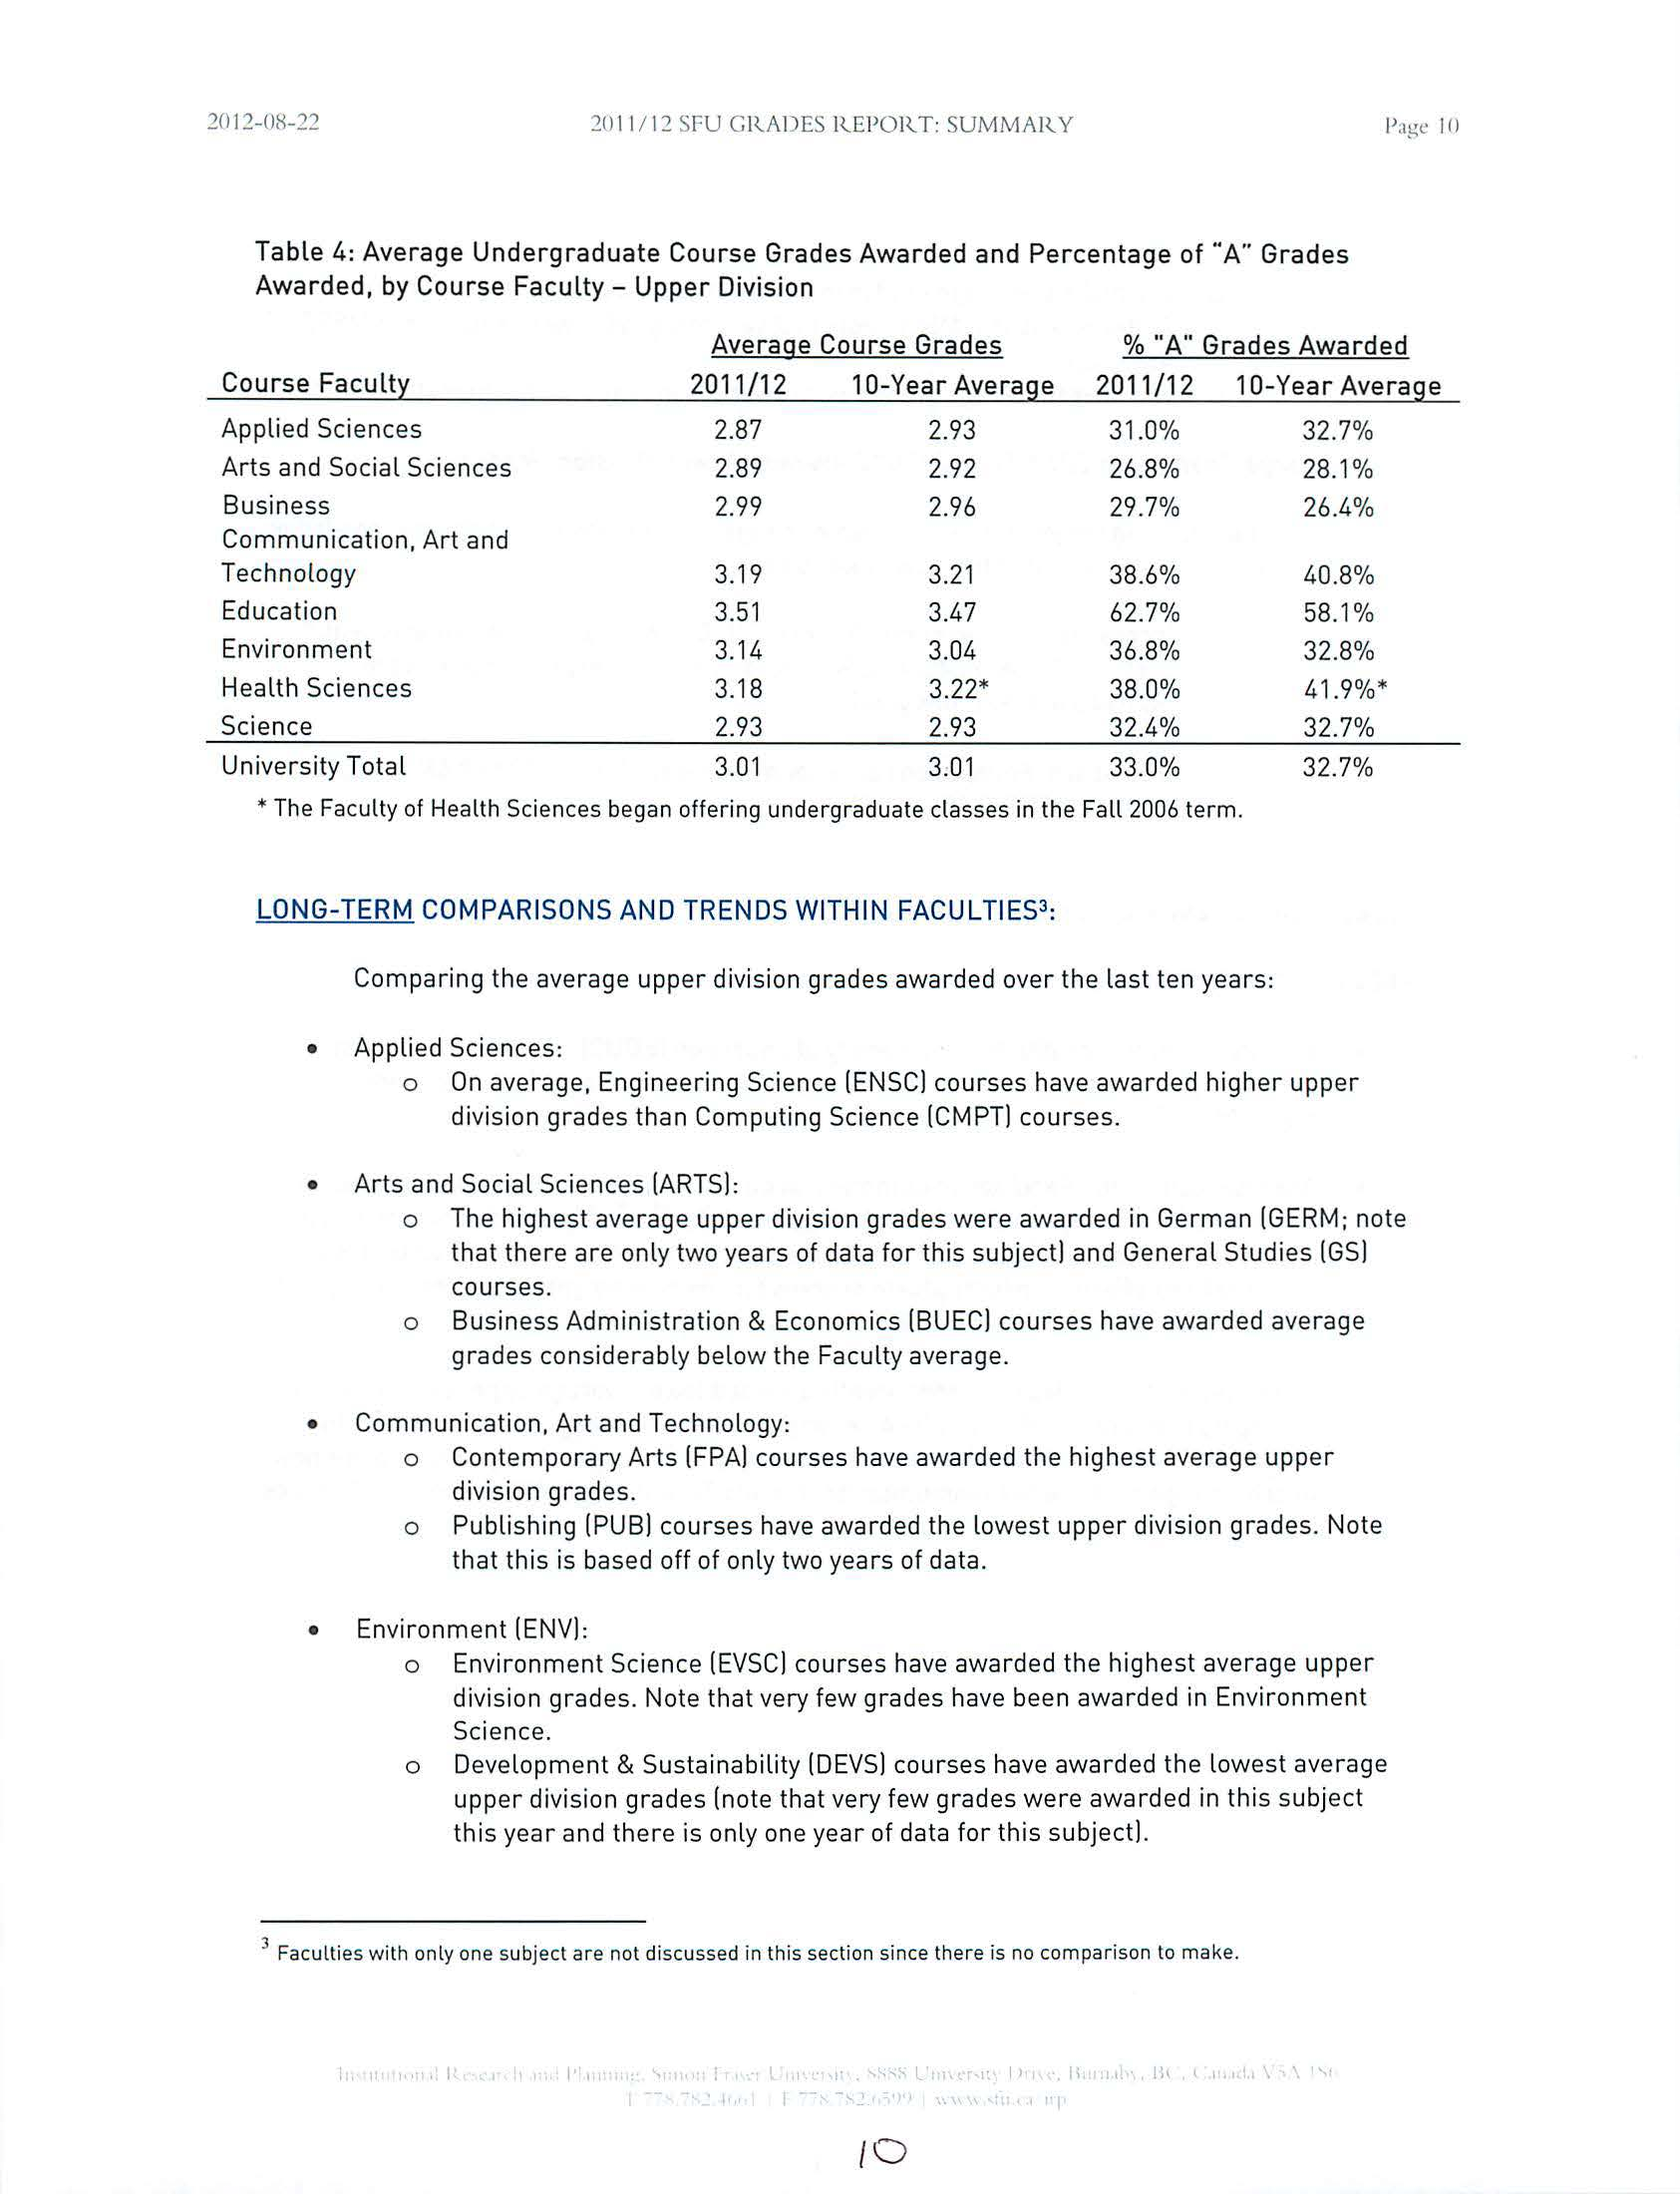
Table
4:
Average Undergrad
u
ate
Cou
r
se G
r
ades
Awarded
and
Percentage of "A" Grades
Awarded,
by
Course
F
aculty
-
Upper Division
Average Co
u
rse Grades
% "A" Grades
Awarded
Course
Facult:t
2011/12
10-Year Average
2011
/
12
1
0
-
Y
ear
Average
Applied
Sciences
2.87
2.93
31.0
%
32.7%
Arts
and
Social Sciences
2.89
2.92
26.8
%
28.1%
Busin
ess
2.99
2.96
29.7
%
26.4%
Communication,
Art and
Technology
3.19
3.21
38.6
%
40.8
%
Educat
ion
3.51
3.47
62.7%
58.1
%
En
viro
nment
3.14
3.04
36.8%
32.8
%
Health
Sciences
3.18
3.22*
38.0
%
41.9%*
Science
2.93
2.93
32.4%
32.7
%
Univers
i
ty Total
3.01
3.01
33.0%
32
.
7%
*
The
Faculty of Health Sciences
beg
an
offering
undergraduate classes
in
the
Fall
2006 term.
LONG-TERM
COMPARISONS AND TRENDS W
I
TH
I
N FACULTIES
3
:
Comparing
th
e
average
upper
division
grades
awarded over
t
h
e
l
as
t
te
n
years:
•
Applied
Sciences:
o
On average,
Engineer
i
ng
Science
[ENSC)
courses
have
awarded
h
i
gher upper
division grades than Computing
Science [CMPT)
courses.
•
Arts
and
Social Sciences [ARTS):
o
Th
e
highest
average
upper
di
v
ision grades
were awarded
in
German
[
GERM; note
that there are only two years of data for this subject) and General Stud
ies
[GS
)
courses.
o
Business
Adm
in
istr
at
ion
&
Economics [BUEC) cou
rses
have
a
w
arded average
grades considerably below the
Facult
y
average.
•
Communication, Art and
Te
c
hn
o
l
ogy:
o
Contemporary
Arts [FPA) courses
have
awarded
t
he
h
ighes
t
average upper
division
grad
es
.
o
Publi
s
hing
[PUB) courses
have
awarded
the lo
wes
t
u
p
pe
r
division grades.
N
o
te
that this
is
based off of only two years of
data.
•
Environm
e
nt
[ENV):
o
En
v
ironment
Science
[EVSC
)
courses
have
awarded
th
e
highest average upper
division grades.
Note
that
very
few grades
have
been awarded
i
n En
vi
r
o
nme
n
t
Science.
o
Deve
l
opment
&
Sustainability
[DEVS) courses ha
ve
awarded
the
lo
west
average
upp
e
r
division
grades [not
e
that very
few
grades were awarded
in
t
h
is
subject
this
year and
there is
only
one year
of data for this
s
ubject).
3
Faculties with only one
s
ubj
ect
are
not
di
sc
u
ssed
in
this
section
since there is
no comparison
to
make.
I
I
,,
[0
2012-0H-22
21l
II
1
2
\
I
.U CRADES REI'ORT. SUMMARY
1'.1~,.
II
Figure B
Average Upper Division Course Grades Awarded by
Faculty
APSC
_..
ARTS
_..
BUS
_..
CAT
-+-
EDUC
o
ENV
_...
HSCI
_..
SCI
_...
SFU Total
3.6
UPPER DIVISION GRADES
3.5
-
3.4
-
c(
3.3
Q.
~
-
3
.
2
Ill
~
0
-
"C
3.1
.--
IU
loo
~
~
3.0
Ill
loo
:I
u
0
2.9
~
en
2.8
IU
loo
~
>
2.7
c(
2
.
6
2.5
2.4
02/03
03/04
04/05
05/06
06/07
07/08
08/09
09/10
10/11
11
/
12
Year
"
2012-08-22
20
11
I
1
2 SFU G
i
lADES
l
lE
P
O
l
l T: SUM MA
l
lY
•
Science
(SCI!
:
o
The highest
average grades have been awarded in
U
ndergraduate
Semester
in
Dialogue
(DIAL) and
Marine
Science
(MASCI.
Note that MASC usually awards
fewer
than
40
upper
division grades each
yea
r
.
o
Science (SCI). Mathematics
&
Computing Science
(M
AC
MI. Mathematics
(MATH
).
and
Nuclear
Science (NUSC] courses
have
awarded
th
e
lowest average upper
division grades.
CURRENT COMPARISONS AND
TRENDS
WITHIN FACULTIES
3
:
2011/12
Average Upper Division
Course
Grades:
•
Applied Sciences
(APSC]:
o
In
2011/12,
Engin
eer
ing
Scie
n
ce
(ENSC]
courses
awarded
h
igh
er uppe
r
division
grades than Computing Science
(CMPT]
courses.
•
Arts and Social Sciences
(ARTS]
:
o
The highest average grades awarded
in
2011/12 were
i
n
Latin
Ame
rican
Studies (LAS] and German (GERM). Note that
very few
grades
we
r
e awarded
in these
s
ubj
ects.
o
Business Administration & Economics (BUEC] and
E
conomics
(ECON
]
courses awarded the
l
owest
average upper division grades in 2011/12.
•
Communication, Art and
Technolog
y
(CAT]:
o
The highest average grades awarded in
2011/12 were
in
Contempo
ra
ry Arts
(FPA).
o
The
lowest average grades awarded in 2011/12
were
in Publishing (PUB).
•
Environment (ENV]:
o
The highest
average
grades
awarded
in
2011/12 were
in
Environmental
Science (EVSC). Note that very few grades
we
r
e awarded in this subject.
o
The
lo
west
average grades
were
awarded
in
Development
&
Sustainability
(DEVS; note that DEVS
awarded fewer
than 30 grades
in
2011/12.1
•
Faculty of Science
(SCI]
:
o
The
subjects awarding
th
e
highest
average
grades
in
2011/12 were
Mar
i
ne
Sc
ien
ce
(MASCI and
Und
ergraduate Semester in
Dialogue
[DIAL).
Note that
MASC awarded fewer
t
h
a
n
30 grades in
2011/12
.
o
The
lo
wes
t
average grades were awarded
in Nu
clear Science
[NUSC]
and
Mathematics
& Comput
in
g
Science (MACMI.
Large
Changes in 2010/11 to 2011/12 Average
Upper Division
Course
Grades:
•
The following
subjects
have
seen
large
changes
[of at
l
east
0.25] this
y
ear over
last
year"s average
upp
er
division grade
awarded:
o
Increases:
Statistics
[STAT:
2.84
to 3.121.
Science [SCI: 2.37 to 2.63
1.
and
Spanish
(SPAN:
3.16
to
3.411.
1\<
(
\
...
[
2-
:!012-0S-:!2
:!Oil
I
1:! SFU CRADES Rll'OR.T. SUMMARY
o
Decreases:
Nuclear
Science (NUSC:
2. 74 to
2.371,
Environmental
Sc
i
ence
(EVSC:
4.33
to
4.00;
note that
very few
grades
were awarded in
EVSC].
and
Publi
shing
Program (PUB:
3.09
to 2.79].
11/.A
.J-
General Observations
(All
Undergraduate Courses/
•
In
2011/12
,
t
h
e
average
undergraduate grade awa
r
ded was 2.79.
•
The
ave
rag
e
undergraduate
grade awarded over the past ten
ye
ars
is
2.79.
!'age: 1.>
•
Over
the
pas
t
te
n
years,
upper
d
i
vision
courses
have consistentl
y
awarded higher grades
than
l
ower
di
vis
ion
courses in all
F
aculties.
1
11.8- Undergraduate
Course Grades by Student
Faculty
Thi
s
sect
ion
summarizes the 2011/12 undergraduate course g
r
ade distributions
wi
thi
n
eac
h F
ac
ult
y, contro
lling
for the Faculty
of
undergraduate
students en
r
o
ll
ed
i
n the co
u
rses.
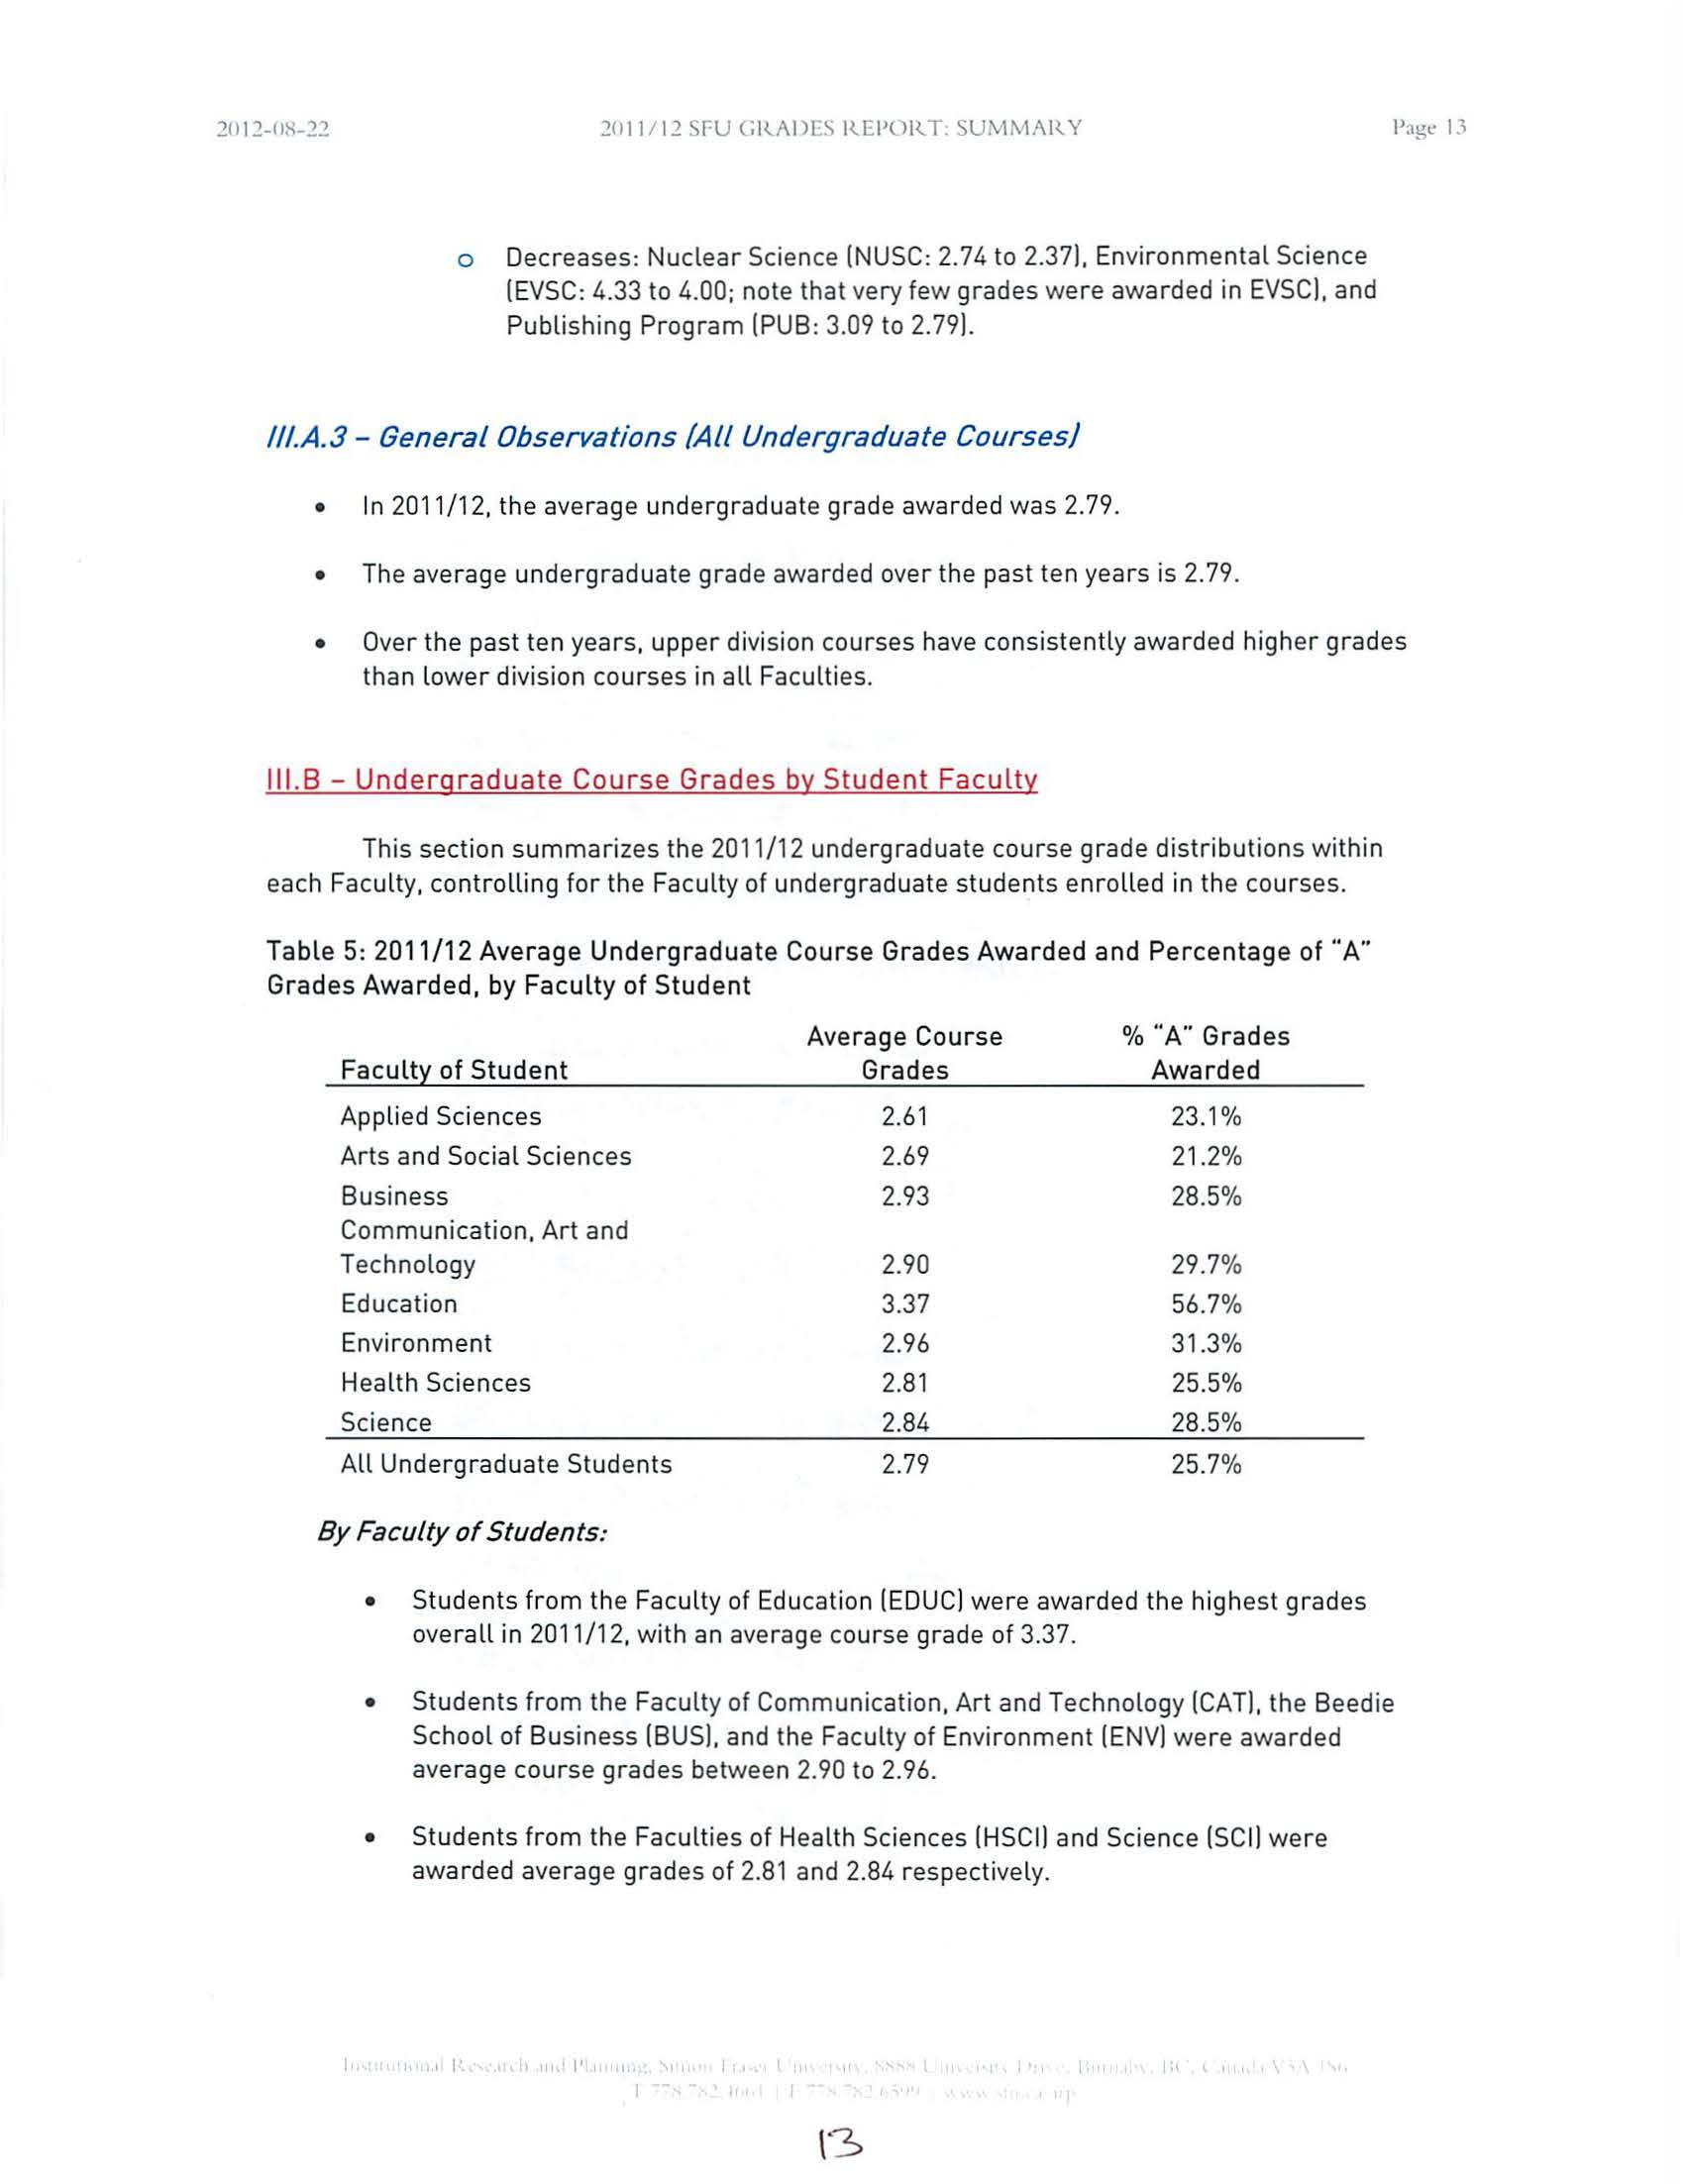
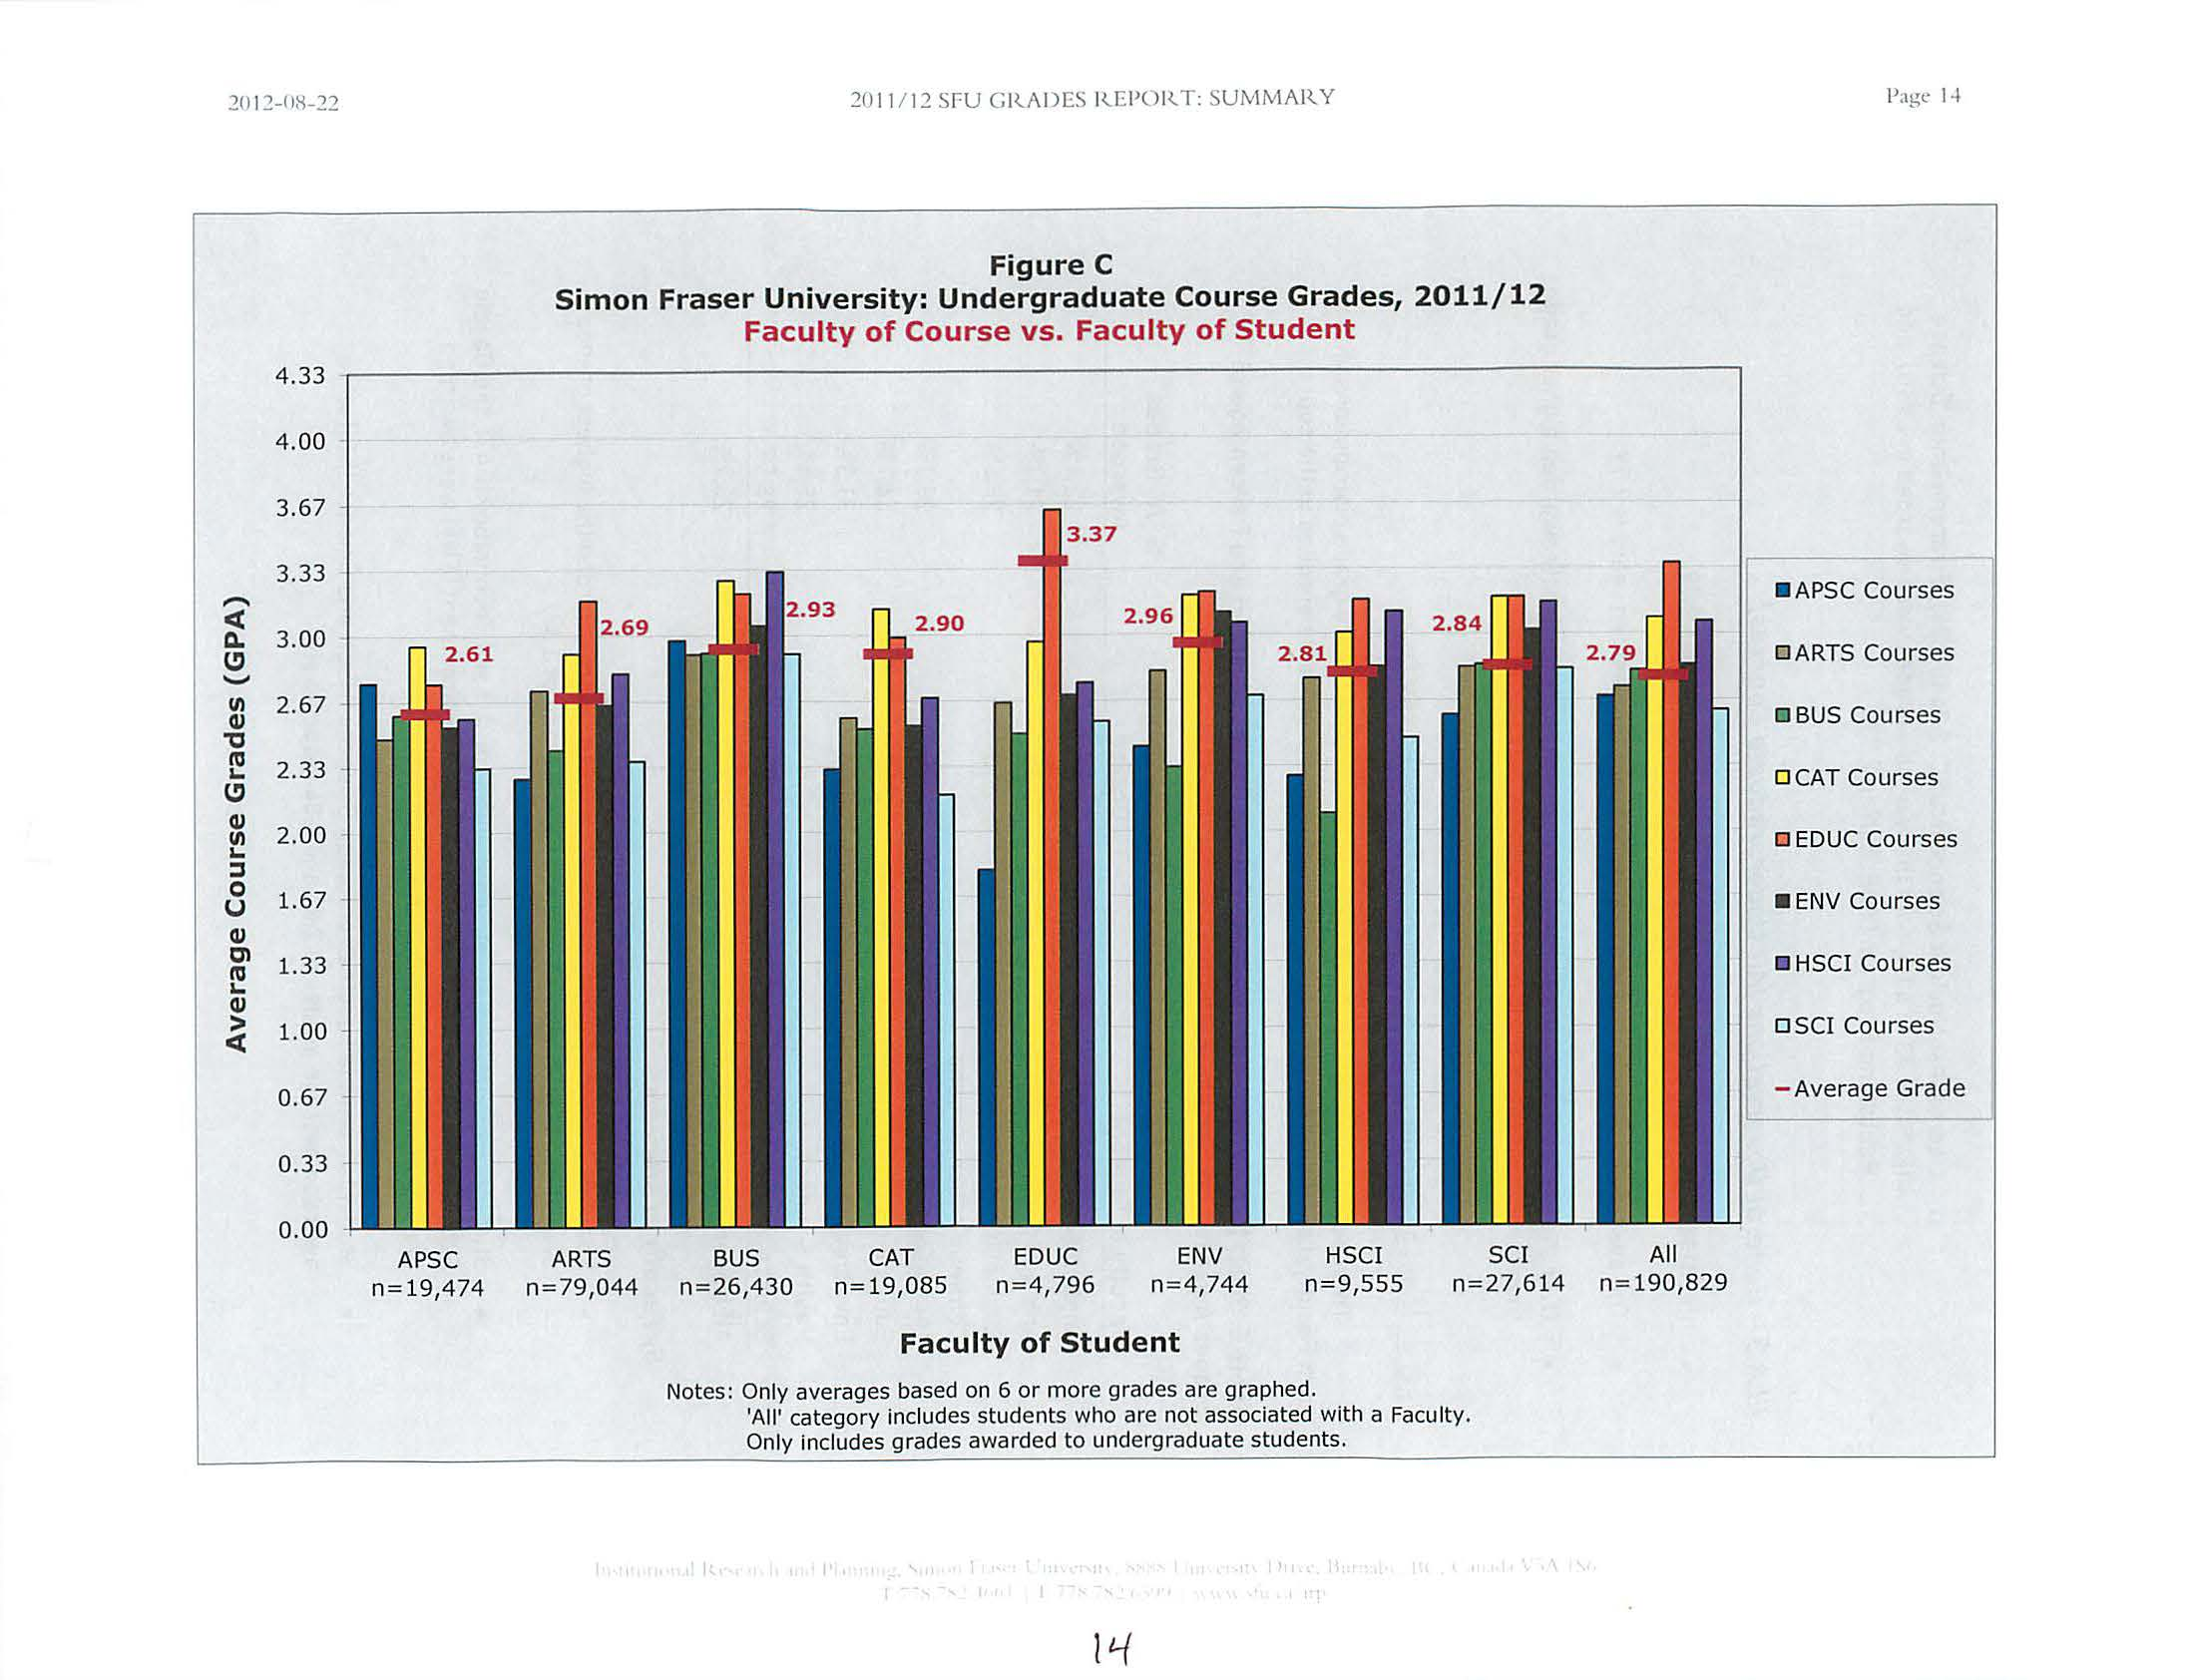
Table 5:
2
01
1
/12 A
v
erage Undergraduate
Course
Grades Awarded and
Percentage of
"A"
Grades
Awar
d
ed, by
F
acult
y
of Student
Ave
rage
Course
%
"A" Grades
Faculty of Student
Grades
Awarded
Applied Sciences
2.61
23
.1
%
Arts and
Socia
l
Sciences
2.69
21.2
%
Business
2.93
28.5
%
Communication,
Art
and
Technolo
g
y
2.90
29.7
%
Education
3.37
56.7
%
En
v
ironment
2.96
31.3
%
Health
Sciences
2.81
25.5
%
Science
2.84
28.5%
All Unde
rg
rad
u
a
t
e Students
2.79
25.7
%
By Faculty ofStudents
:
•
Stude
n
ts
fr
om the
F
aculty of Education
(
EDUC) were awarded the highest grades
overall in 2011/12,
with an average course grade of
3.37.
•
Students from the Faculty of
Communication
,
Art and
Technology (CAT]. the Beedie
School of Business
(BU
S]. and
the Faculty of Environment (ENV)
were
awarded
average course grades between
2.90
to
2.96.
•
S
tud
ents from the Faculties
of
H
eal
th
Sc
i
ences (
H
SCI) and Science
(SC
I
)
were
awarded average grades of
2.81 and 2.84
respec
t
ive
l
y
.
t I
p I
I
\
3
20
12
-0~-22
4.33
4.00
3
.
67
3
.
33
-
<
c.
3.00
~
-
II)
2.67
CIJ
'tl
ru
1..
2.33
~
CIJ
II)
2.00
1..
:::J
0
1.67
u
CIJ
Cl
1.33
ru
1..
CIJ
>
<
1.00
0.67
0.33
0.00
20
1
1
/
12
Sf'
U
GRAI)ES
l
tEI'OR
T
: SU
MMARY
Figure
C
Simon Fraser University: Undergraduate Course Grades, 2011/12
Faculty of Course vs. Faculty of Student
3.37
APSC
ARTS
BUS
CA
T
SCI
All
n=19,474
n=79,044
n=26,430
n=19,085
EDU
C
n=4
,796
ENV
n=4,744
H
SCI
n=9,555
n=27
,61
4
n=190,829
Faculty
of Student
Notes
:
Only averages based on 6 or
mor
e
grades are graphed.
'All'
category inc
lu
des students who are not
associated
w
ith
a
Fa
c
ulty.
Only
includes
grades awarded to
undergradu
ate s
tudents
.
l'ag~
I
.J
•
APSC
Cour
ses
DARTS
Courses
m
BUS
Courses
DCAT
Courses
o
EDUC
Courses
•
ENV
Courses
•
HSCI
Courses
o
SCI
Cour
ses
-
Average Grade
2012-0H-22
20 I
I
I
12 SFU CRADES
I
{.E
i'
OR.T: SUMMARY
•
St
u
de
n
ts from the
F
aculties of
Arts and
Social Sc
i
ences [AR
T
S
]
a
n
d Applie
d
Scie
n
ces
[A
P
SC] we
r
e awa
r
ded the lowest
average
grades
in
2011/12
,
with
an ave
r
age cou
r
se
g
r
ade of 2.69 and 2.6
1
respect
i
vely.
•
Students f
r
om all Fac
u
lties most commonly took co
u
rses
from t
h
e
ir
own Fac
ul
t
i
es.
B
y
Fa
c
ul
t
y of Courses:
•
In
cou
r
ses offe
r
ed by the
F
ac
u
lty o
f E
d
u
cation
[EDU
C], s
tud
e
n
ts
fr
o
m
t
h
e
F
ac
ult
y of
E
duc
ati
o
n [EDU
C]
r
ece
i
ved t
h
e
h
ig
h
es
t
ave
r
age grades
in
2011/
1
2.
•
I
n c
o
u
r
ses
o
ffe
r
ed by t
h
e
F
ac
u
lty of
En
v
i
ro
n
me
nt [EN
VI.
s
tu
de
n
ts
fr
o
m t
h
e F
ac
ult
y of
En
vi
r
o
nm
e
nt
[
E
NV] received the h
i
ghes
t
average
g
ra
d
es
i
n 201
1
/
1
2
.
•
In
c
o
u
rses o
ff
e
r
ed by all other Facu
l
ties,
students
f
r
om th
e B
ee
di
e Sc
h
oo
l
of
B
u
si
n
ess
[B
US] rece
i
ved
t
h
e
h
ig
h
est
ave
r
age
g
r
ades
i
n 20
1
1/
1
2.
•
Apa
r
t f
r
om the
F
ac
ul
ty of Environment
[EN
VI.
courses
i
n all
F
acu
l
ties were most
freque
n
tly ta
k
en by students
from wit
h
in those Facu
l
t
i
es. Faculty o
f E
nv
i
ro
n
me
n
t
[ENV]
c
o
u
rses
were
most of
t
en take
n
by
s
t
udents
f
r
om the Fa
cu
lty of Arts a
n
d Social
Sc
i
ences [A
R
TS].
I
I
I.C
-
Graduate Course Grades
FACULTY COMPAR
I
S
ION
S
:
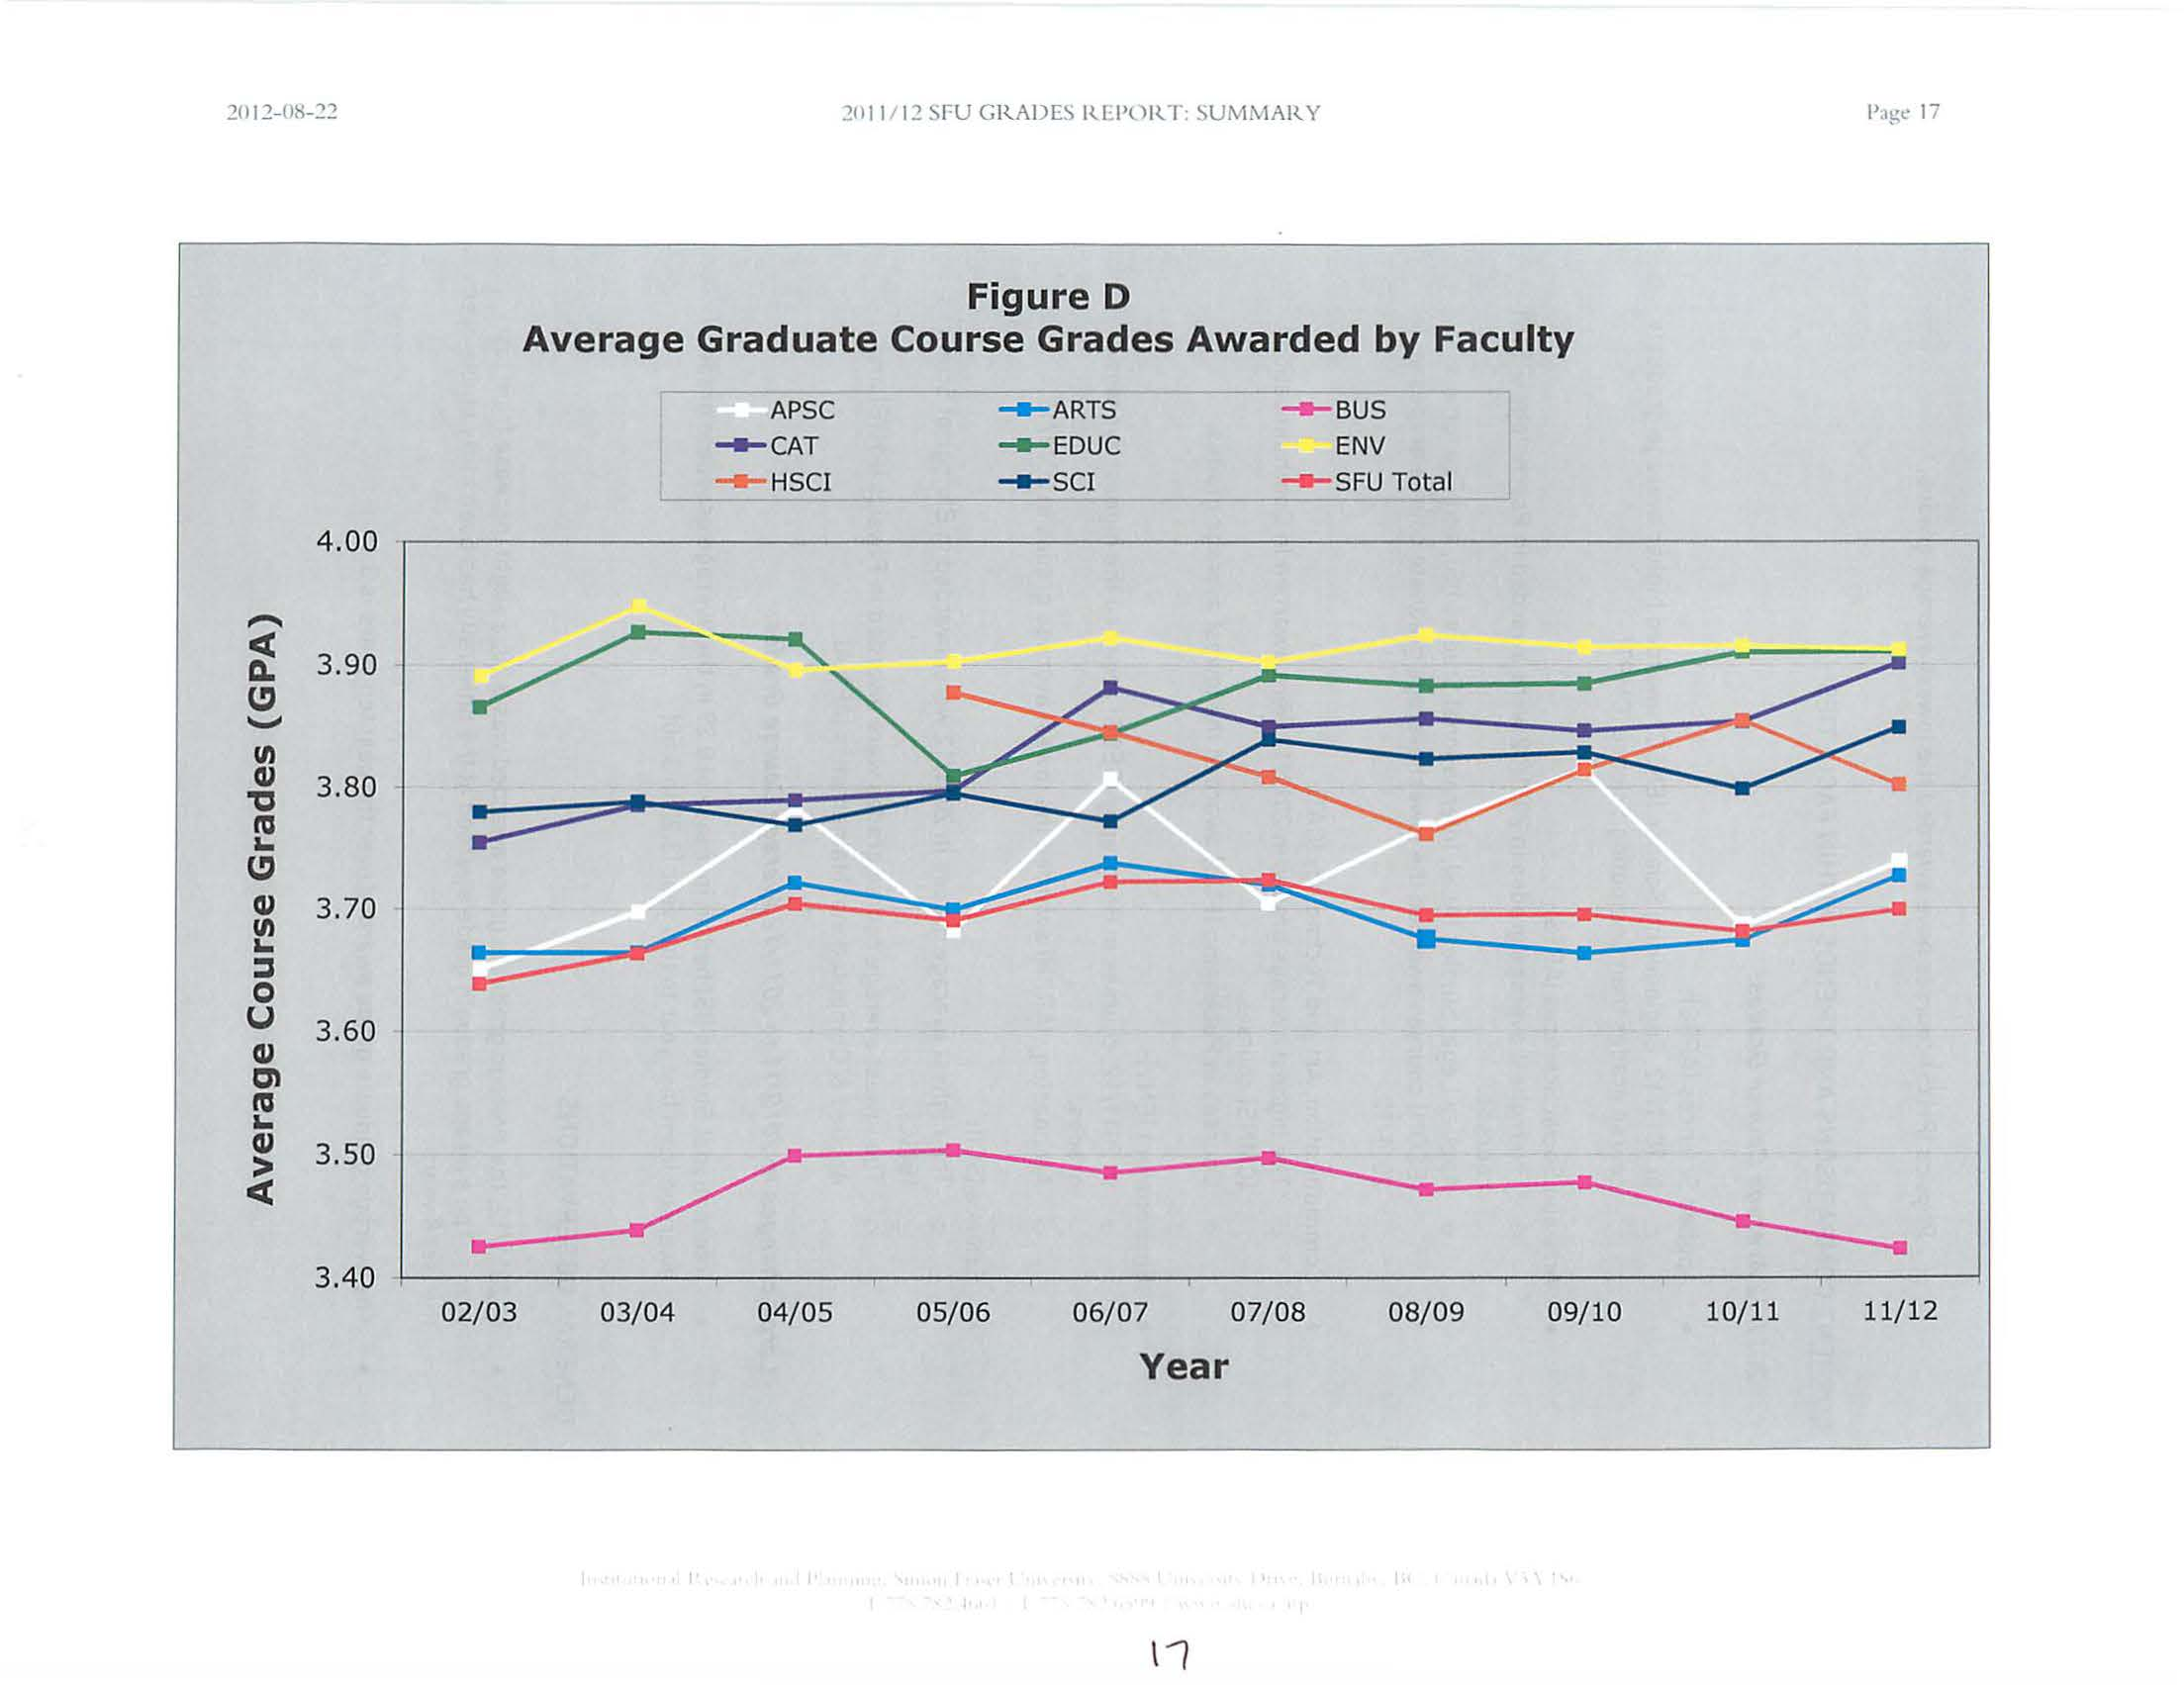
•
T
h
e
F
ac
u
lty of Env
i
ro
n
ment [E
N
V] has awarded the h
i
g
h
es
t a
verage grad
u
a
t
e
l
eve
l
cou
r
se
g
r
ades
i
n nin
e
of t
h
e
l
as
t
te
n
years, w
i
th an average awarded grade of 3
.
91.
•
T
h
e
Fac
u
lty of
Edu
ca
ti
on
[E
DUC
] h
as been one
of
the top two
F
ac
ul
t
i
es
in
e
i
g
ht
of t
h
e
l
ast
ten years,
i
n
t
erms of average graduate grades
awar
d
ed [10-year ave
r
a
g
e
i
s 3.88
.]
•
T
he Fac
u
lties of Co
m
municatio
n
,
A
r
t
a
n
d
T
ec
h
no
l
ogy
[
CA
T
],
H
ea
l
th Sc
i
e
n
ces [
H
SCII.
and
Sc
i
e
n
ce
[
SC
I] h
ave
awar
d
ed
similar average
grades over the past deca
d
e,
w
i
th
10-year
ave
r
ages of 3
.
83,
3
.
81
and 3.80,
r
espectively.
•
T
he Faculties of App
li
ed
Sciences [APSC
]
a
n
d
Arts and Social Sciences
[ARTS] have
genera
ll
y
awa
r
ded
l
ower average graduate grades than
all other
Fac
u
lt
i
es except
Busi
n
ess
[10-yea
r
averages
of 3.73 and 3.70,
respectively
.
]
•
The Beedie School
of
B
u
siness
[B
U
S
]
has awa
r
ded
the lowest average grades in
each
of
the last ten yea
r
s
,
w
i
t
h
an
average grade awarded of
3.46.
I'
I
~
2012-0H-22
20
II
I
12
Sr:U GRADES
ll..E
I'
Oil..
.
T: SUM MAll..
Y
Page 16
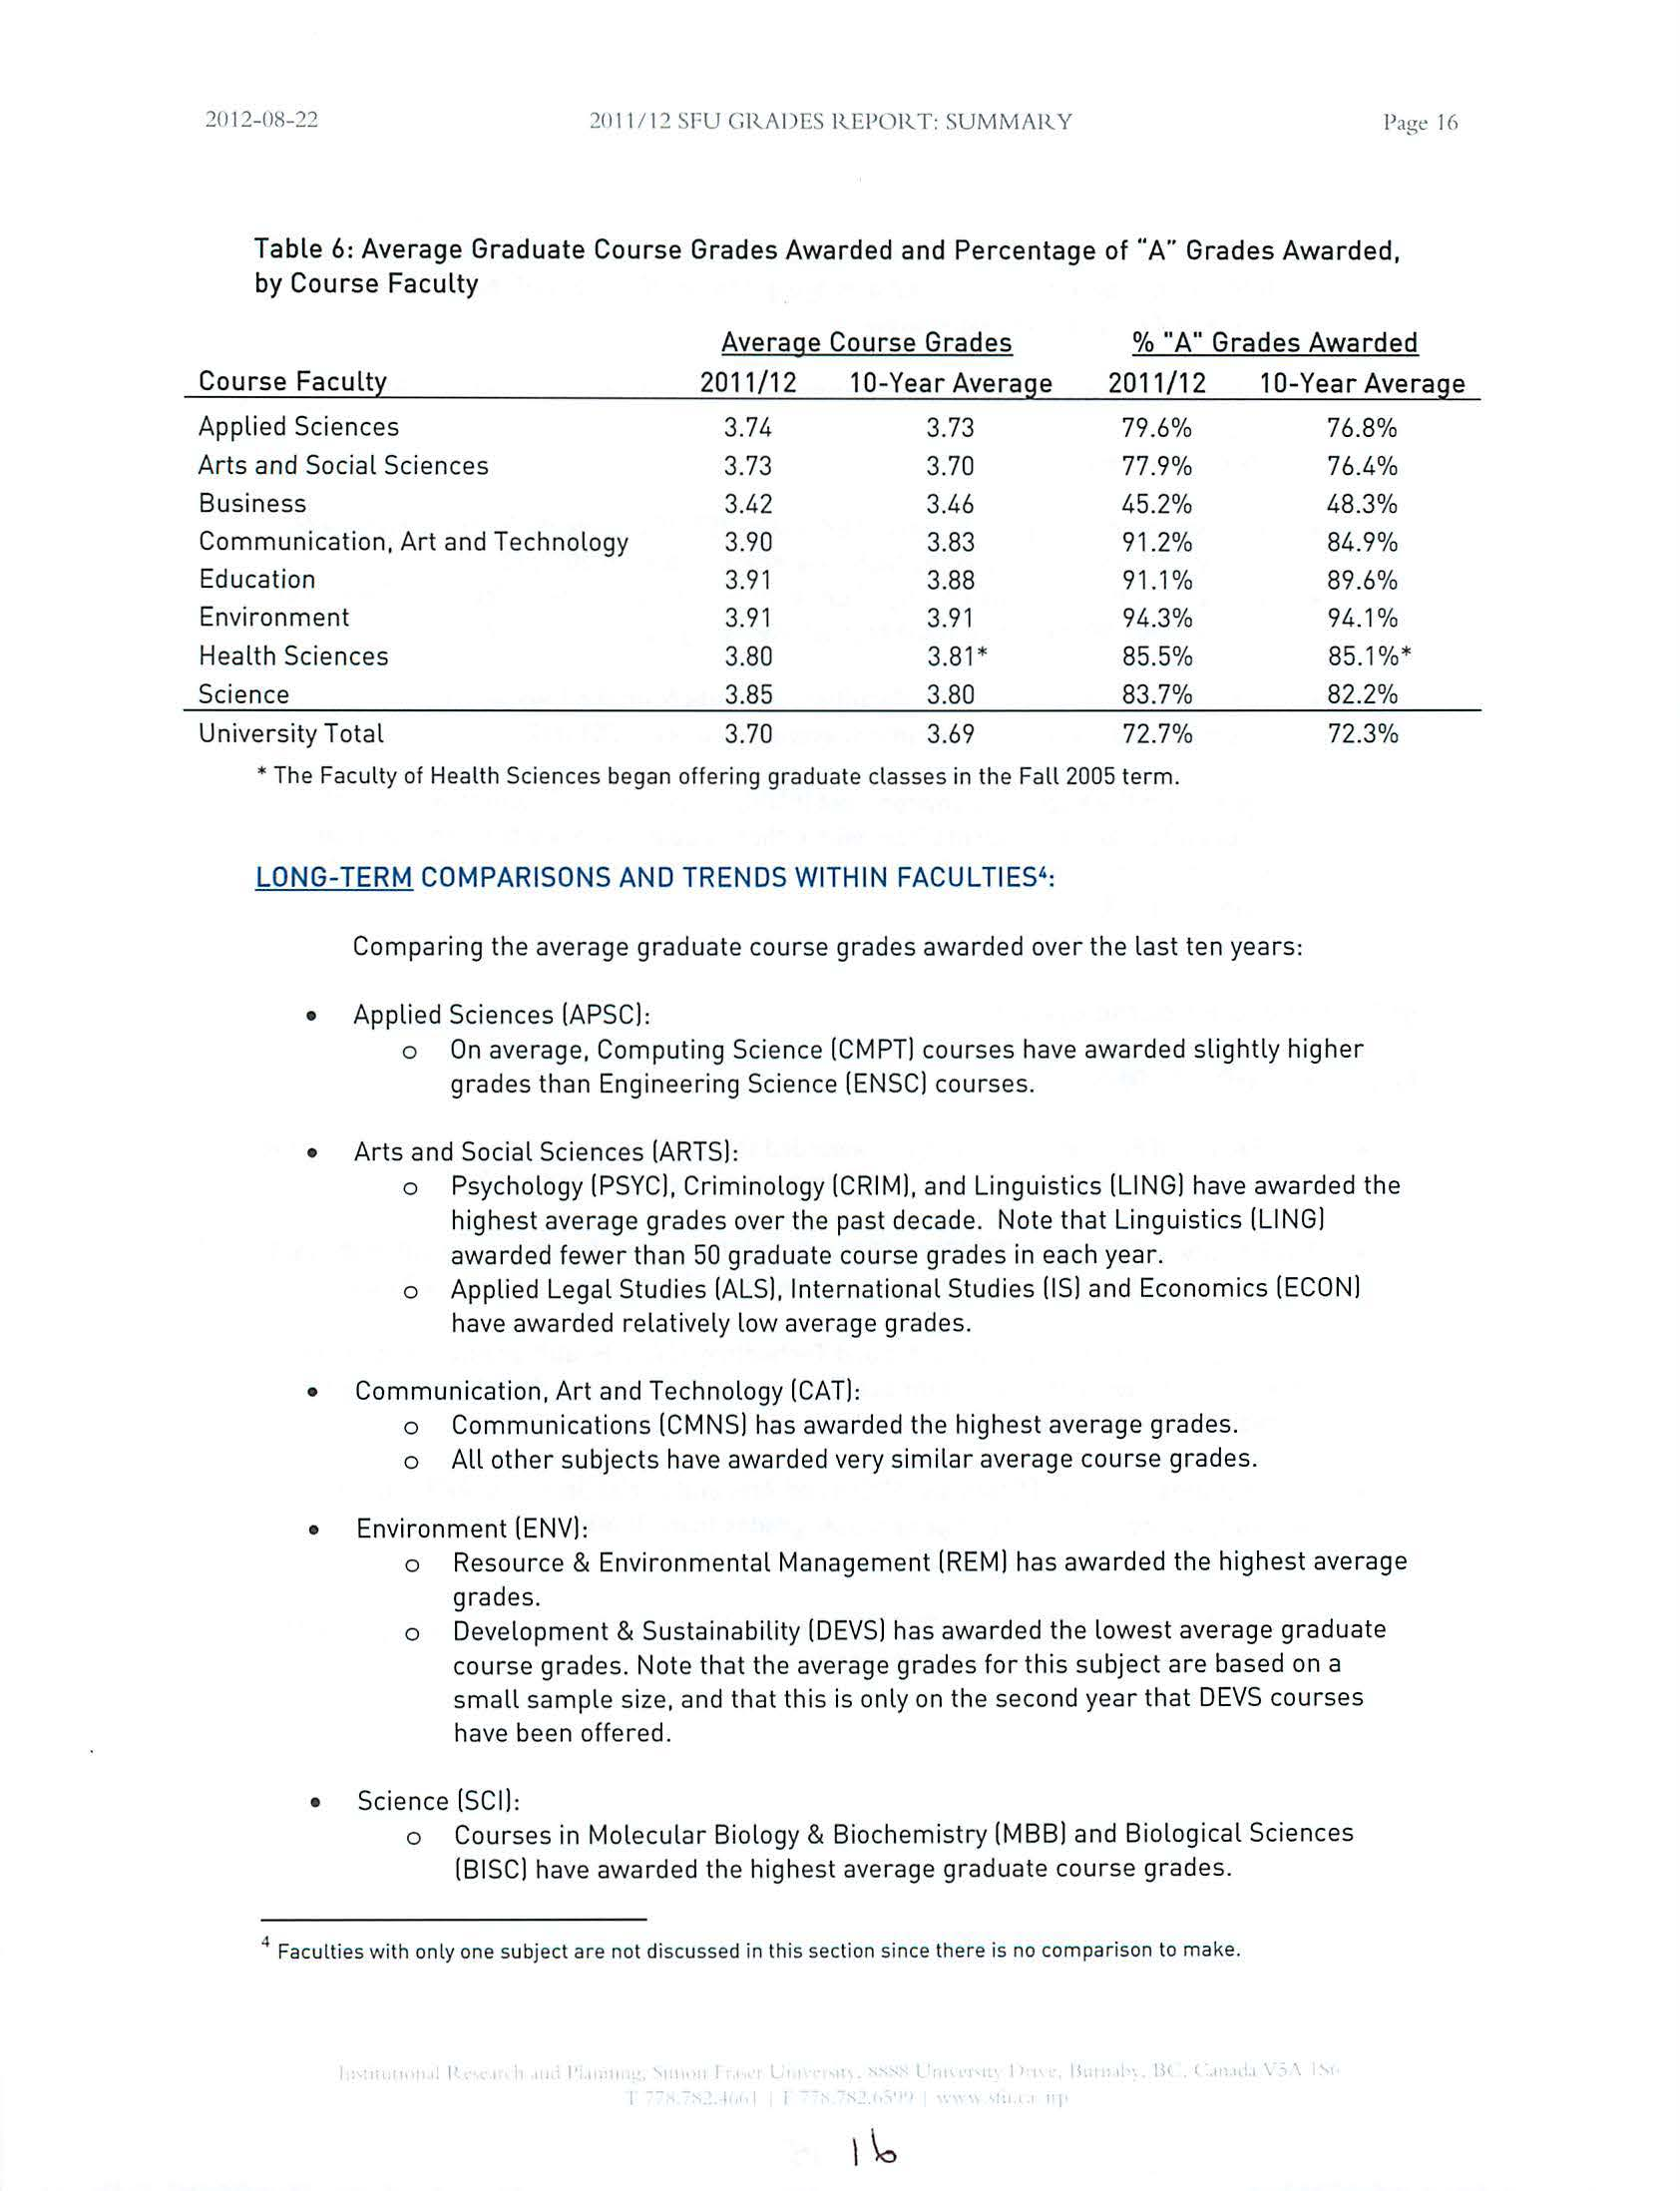
Table
6:
Average Graduate
Course Grades Awarded and
Per
cen
tage
of
"
A
"
Grades Awarded,
b
y Cou
r
se
Faculty
Average Cou
r
se
Grades
%
"A" Grades
Awarded
Course Facult:t
2011/12
10-
Ye
ar
Average
2011/12
10-Year Average
Applie
d
Scie
n
ces
3.74
3.73
79.6%
76.8%
Arts and
Soci
al
Sciences
3.73
3.7
0
77.9%
76.4%
Business
3.42
3.46
45.2
%
48.3%
Communication, Art
and Technology
3.9
0
3
.
83
91.2%
84
.
9
%
Education
3.91
3.88
91.1%
89.6%
En
vironment
3.91
3.91
94.3%
94.1%
H
ealt
h
Science
s
3.80
3.81*
85
.
5
%
85.1%*
Science
3.85
3.80
83.7%
82.2%
Uni
ve
rsity
T
ota
l
3.70
3.69
72.7
%
72.3%
*T
h
e
Fa
cul
t
y
of Health Sciences began offering graduate
cl
asses
in
th
e
Fall
2
00
5
term.
LONG-TERM COMPARISONS AND TRENDS WITHIN
FACULTIES
4
:
Comparing
the ave
r
age
graduate
course
g
rad
es
awarded
o
v
er
the
last
ten
ye
ars
:
•
Applied Sciences [APSCI:
o
On average,
Comput
ing
Science
[CMPTI courses have a
wa
rded
s
lightly higher
grades
than
Engineering
Science
[ENSCI courses
.
•
Arts and
Soci
al
Sc
ienc
es
[
ARTS]:
o
Ps
ycho
log
y
[PS
YCI.
Criminology
[CRIMI.
and
Linguistics
(LING] have awarded the
highest average grade
s
over the past decade. Note
that Linguisti
cs
[LING]
awarded fewer than 50 graduate cours
e
grades in
each year
.
o
Ap
plied Legal
St
udies
(ALSI.
In
ternational Studies [lSI
a
nd Economics
(ECONI
have awarded
r
ela
ti
ve
l
y
l
ow
average grades
.
•
Communication,
A
rt
and
Technolog
y
[CAT]:
o
C
ommunications
[CMNSI has awarded the
highe
st
average grades
.
o
All other subjects have awarded very similar average
course
grade
s
.
•
Environm
e
nt IENVI:
o
Resource & Environmental Management [REM] has
awarded
the highest
average
grades
.
o
Development & Sustainabil
i
t
y
[DEV
S
]
has awarded the
lo
west
average graduate
course grades. Note that the
avera
g
e grades
for
this
subject are based on a
sma
ll
samp
l
e
s
i
ze,
and that this is only
on
th
e
second
yea
r
that
DEVS
courses
have been offered.
•
Science
(SCI]
:
o
Cour
ses
in Mol
ec
ular Biology
&
Biochemistry [MBBI
a
nd
Biological Sciences
[BI
SCI
have
awa
rded
th
e
h
ighest average graduate
course grades.
4
Faculties wi
t
h
only
one s
ub
ject are no
t di
sc
uss
ed
in
t
his section since
t
he
r
e
is
no comparison
t
o make.
'
l<
\
\
:201.2-0H-2.2
.2011 1.2 SFU G
R
ADES RLI'ORT SUM:vlAR Y
l'.tg<'
17
FigureD
Average Graduate Course Grades Awarded by Faculty
APSC
-
ARTS
-
sus
-
CAT
-
EDUC
ENV
-
HSCI
-
sci
-
sFU
Total
4.00
.......
ct
0.
3.90
......,
~
cu
U)
3.80
"C
~
...
ra
cu
3.70
...
::J
U)
u
0
3
cu
.
60
ra
cu
c::n
...
3.50
ct
>
3.40
'
02/03
03/04
04/05
05/06
06
/
07
07/08
08
/
09
09/10
10/11
11
/12
Year
\
1
2012-0H-22
20
II
I
12
SFU CllA])ES
I
U.
:
POR.T:
SUMMARY
o
Physics (PHYS] courses have awa
r
ded the lowest average grades.
CURRENT COMPARISONS AND TRENDS WITH
I
N FACU
L
TIES
4
:
2011
/
1
2
Average Course Gr
a
de
s:
•
A
pp
l
i
ed Sc
i
ences (A
P
SC
]
:
o
I
n 2011/12, Eng
i
nee
ring
Sc
i
ence
(
E
N
SC
]
awa
rd
ed h
i
gher average grad
u
a
t
e
course g
r
ades than Comput
i
ng
Scie
n
ce
(
CM
PT].
•
Arts
and Socia
l
Sc
i
ences (ARTS]:
o
T
he highest ave
r
age grades i
n
2011/12
were awa
r
ded in Psychology (PSYC]
courses.
o
Applied
L
egal Studies
[A
L
SI.
I
nternational Stud
i
es [IS]. and Economics
(
E
CON] courses awarded the
l
owest
ave
r
age graduate course grades
i
n
2011/12.
•
Communication, Art and Technology [CAT]
:
o
T
he highest
average
grades in
2011/12 were
awarded in Communications
[CMNS
]
courses.
o
Co
u
rses in Publishing
[
P
U
B]
awa
r
ded the lowest ave
r
age g
r
ades
.
•
E
n
vi
r
onmen
t
[ENV
]
:
o
I
n 2011/12,
courses
in Geography [GEOG
]
awarded the h
i
ghest average
grades.
o
Arc
h
aeology (ARCH]
awarded
the lowest
average
grades in 2011/12.
•
Science [SCI]:
l'.lgl' IH
o
The highest average
grades in 2011/12 were awarded in
Biological
Sciences
[BISC].
o
The
l
owest
average
course
grades
were
awarded in Physics [PHYS]
and
Applied &
Computational Mathematics [APMAI.
Large
c
hanges in
2
010
/11 to 2
011
/12
Ave
r
a
ge Course Grade
s:
•
I
nterna
t
io
n
al St
u
d
i
es [IS
]
had an increase
of
0.29 i
n
the average grad
u
ate
grade
awar
d
ed
fr
o
m last year
t
o
thi
s
year
[
3.22 to 3.50]
GENERAL
OBSERVATIONS:
•
I
n
2011/12
,
the
average
graduate grade awarded
was 3.70,
a
slight
increa
se
from last
year"s.
The average graduate grade
awarded at
the un
i
ve
rsity has been fa
i
rly
sta
b
l
e over
the
last 8
years.
•
T
h
e average
graduate grade
awarded over
the pas
t
ten
years is 3.69.
I'
'
I
'
II
I
I•
l
' I \
'\ ...
,
I
I
2012-06-29
Fall 2011 Undergraduate
Swdem S
ur
\'ey:
Hi
ghligh
t
\
HIGHLIGHTS
FALL 201
I
SFU UNDERGRADUATE STUDENT SURVEY
The Undergraduate Student Survey has been conducted at Simon Fraser University every Fall semester
since
1992
1
(e
xcep
t
in 2002.]
Thi
s
annual survey provides essential
feedback
on the academic
exper
i
ences
and concerns of
our undergraduate students. Every
year
,
students are asked about their
experiences with course availability at SFU, as
we
ll as
a range of other topics that
c
h
a
nge from
year to
year. The
new
to
pics
for this
yea
r
's s
urve
y we
re teaching
/
curriculum,
services, and student engagement.
A
total of 6,953
undergraduate
st
udents
participated
in
this year's survey.
Thi
s
repre
se
nt
s a
response
rate
of 28.5%, which
is
very
similar to last
year's
response
rate
of 28.6
%
. Assuming that the sample
is
representati
ve,
proportions
calculated on all respondents are
accurate
within
±
1.2%,
19
time
s
out of 20
2
•
The full report is
available on the
Institutional Research
ht
t
p
:1/
w
ww.sf
u
.
ca/
irp
/s
u
r
ve
y
s/
u
g
ss/i
n
dex.
h
t
m
l
General
E
x
perience
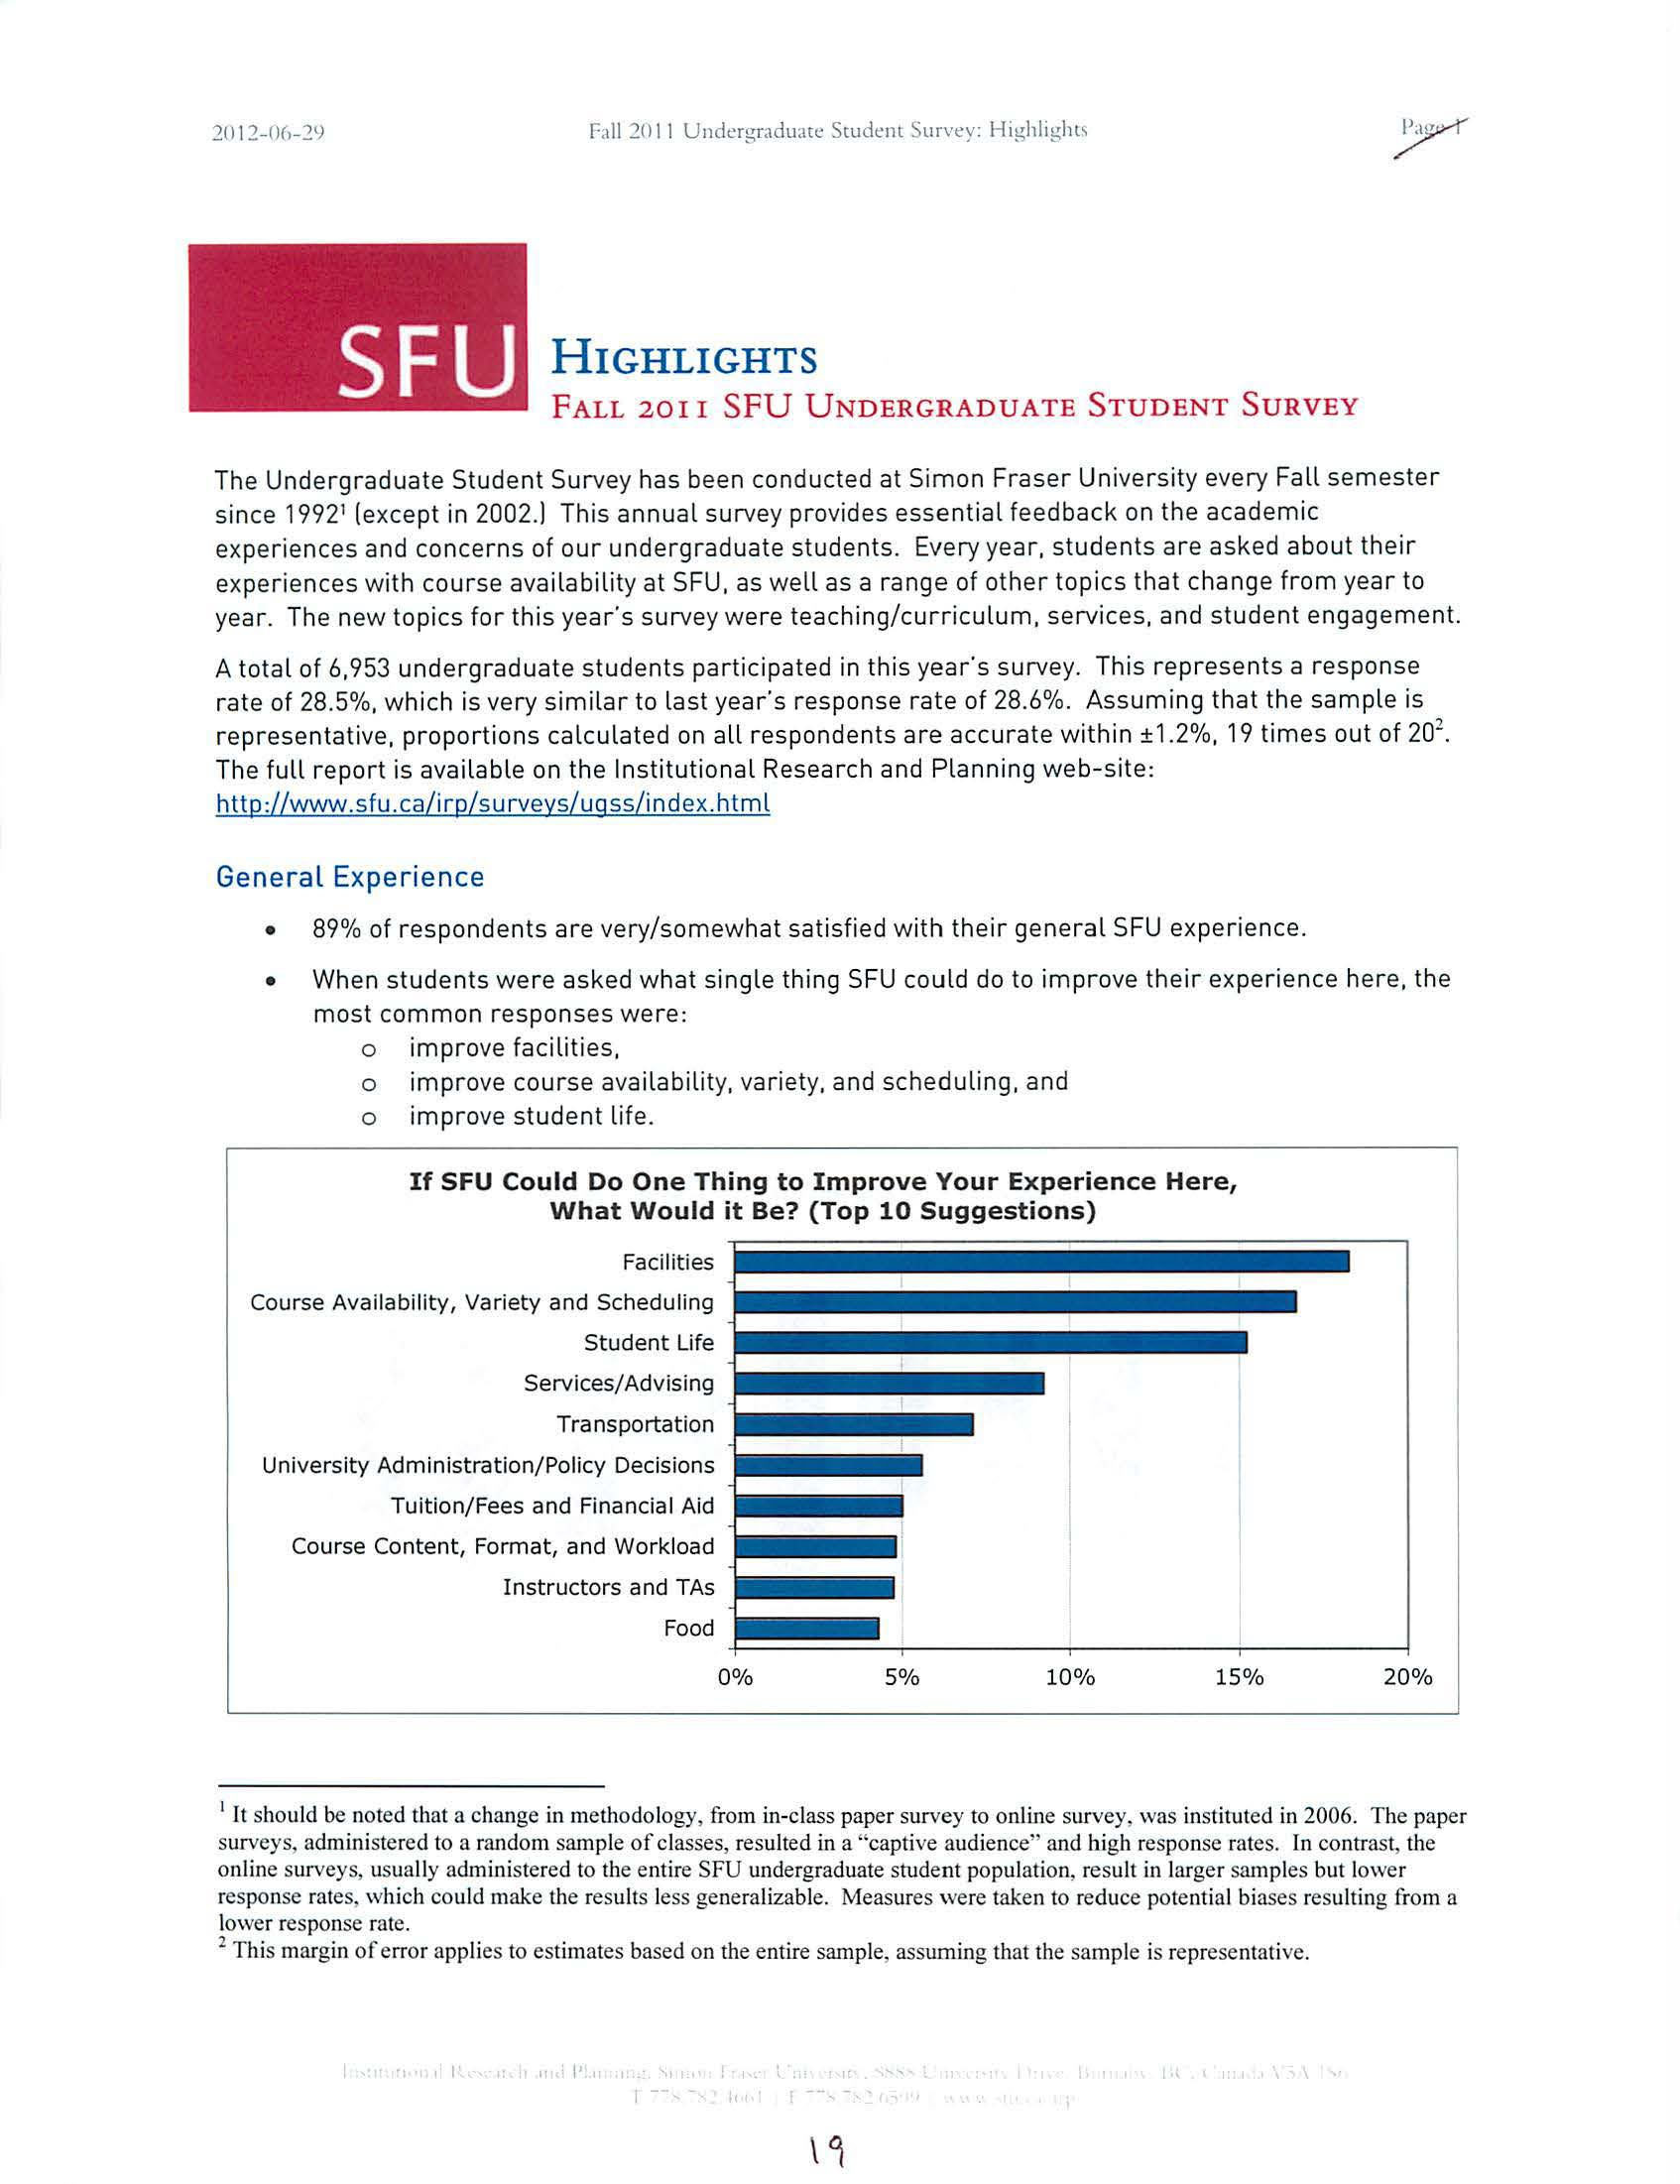
•
89% of
respondents
are very/somewhat satisfied
wit
h
their general SFU experience.
•
When students
we
re
asked what single thing SFU
co
uld
do to improve
th
ei
r
experience
here,
the
most common responses were:
o
improve
facilit
ies,
o
improve course availability,
va
riet
y,
and scheduling, and
o
im
pro
ve
student
life.
If SFU Could Do One
Thing
to
Improve
Your Experience Here,
What
Would
it Be? (Top 10 Suggestions)
Fa
cilities
jiiiiiiiiiiiiiiiiiiiiiiiiiiiiiiiiiiiiiiiiil
l
Course Availability,
Var
ie
ty
and Scheduling
Student
Life
Services/Advising
Transportation
Universit
y
Administration/Policy
Decisions
Tuition/Fees and
Financial Aid
Course
Co
ntent,
Format, and Workload
Instructors and
TAs
1
-f
Food
~~~~~
~
~--------~----------~--------__j
0%
5%
10
%
15%
20%
1
It
s
hould
be
not
e
d that
a
change
in
methodology
,
from
in-class paper
s
urvey to
onl
in
e
s
urve
y
,
was
in
s
tituted in
2006. The
pap
er
s
u
rveys, ad
mini
s
ter
e
d to
a
random
sam
ple
ofc
l
asses,
re
s
ulted in a
"
captive aud
i
ence
"
and
high re
s
pon
se
rate
s.
In
contrast,
the
onli
n
e s
urve
ys
,
u
s
uall
y
adm
ini
s
t
e
red to th
e
entire SFU undergraduate
s
tudent
population
,
re
su
lt
in
larger
sa
mple
s
b
ut
lower
r
es
pon
se
ra
t
es
,
which
could make the
r
esults
le
ss
gene
r
al
i
zab
l
e.
Measure
s
were
taken
t
o
reduc
e
potentia
l
bia
ses
re
s
ulting
f
r
om a
lower
re
s
pon
se
rate.
2
This margin
oferror app
l
ies to estimates based on the entire
sam
ple
,
as
s
uming
th
at
the
sa
mple i
s
rep
r
esentative.
2012-06-29
rail
20
II
Under~radu.ttc
Student
S
ur
vey:
Highlight
s
•
When
asked to
compare their
expe
ri
e
nc
e
at SFU to their
e
x
pectat
i
ons
w
h
en
they first
a
rr
ive
d:
o
14%
of
r
es
pondents
sa
id
that
S
FU ha
s exceeded
their
expectat
ion
s
,
o
67% said SFU
h
as
met their
expecta
tion
s
,
and
o
19%
indicated
that SFU has
f
a
il
ed
t
o
meet
th
e
ir
expecta
t
io
ns.
Course Availab
il
ity
•
I
n
general, this
year's c
ours
e availab
i
lity
results represent a
step
backwards
from
the Fall2010
r
es
ult
s.
•
NUMBER of Courses
: 77%
of respondents
were a
bl
e
to r
eg
ist
e
r
in t
h
e
n
um
be
r
of
co
u
rses they
wa
nted
this
fall, a
s
tati
s
ticall
y
significant
decrease
from
l
as
t
year's
rat
e of 81%.
•
SPECIF
I
C Cou
r
ses:
54%
were able
to
r
e
gi
s
t
er
in
a
ll
of
the
specific co
u
rses
t
hey wanted to take
this term. This i
s
on
par
w
i
th t
h
e 2009
r
ate,
and is
a s
ta
t
i
st
icall
y sign
i
f
i
ca
n
t decrease
from last
year's
rat
e
of 57%.
•
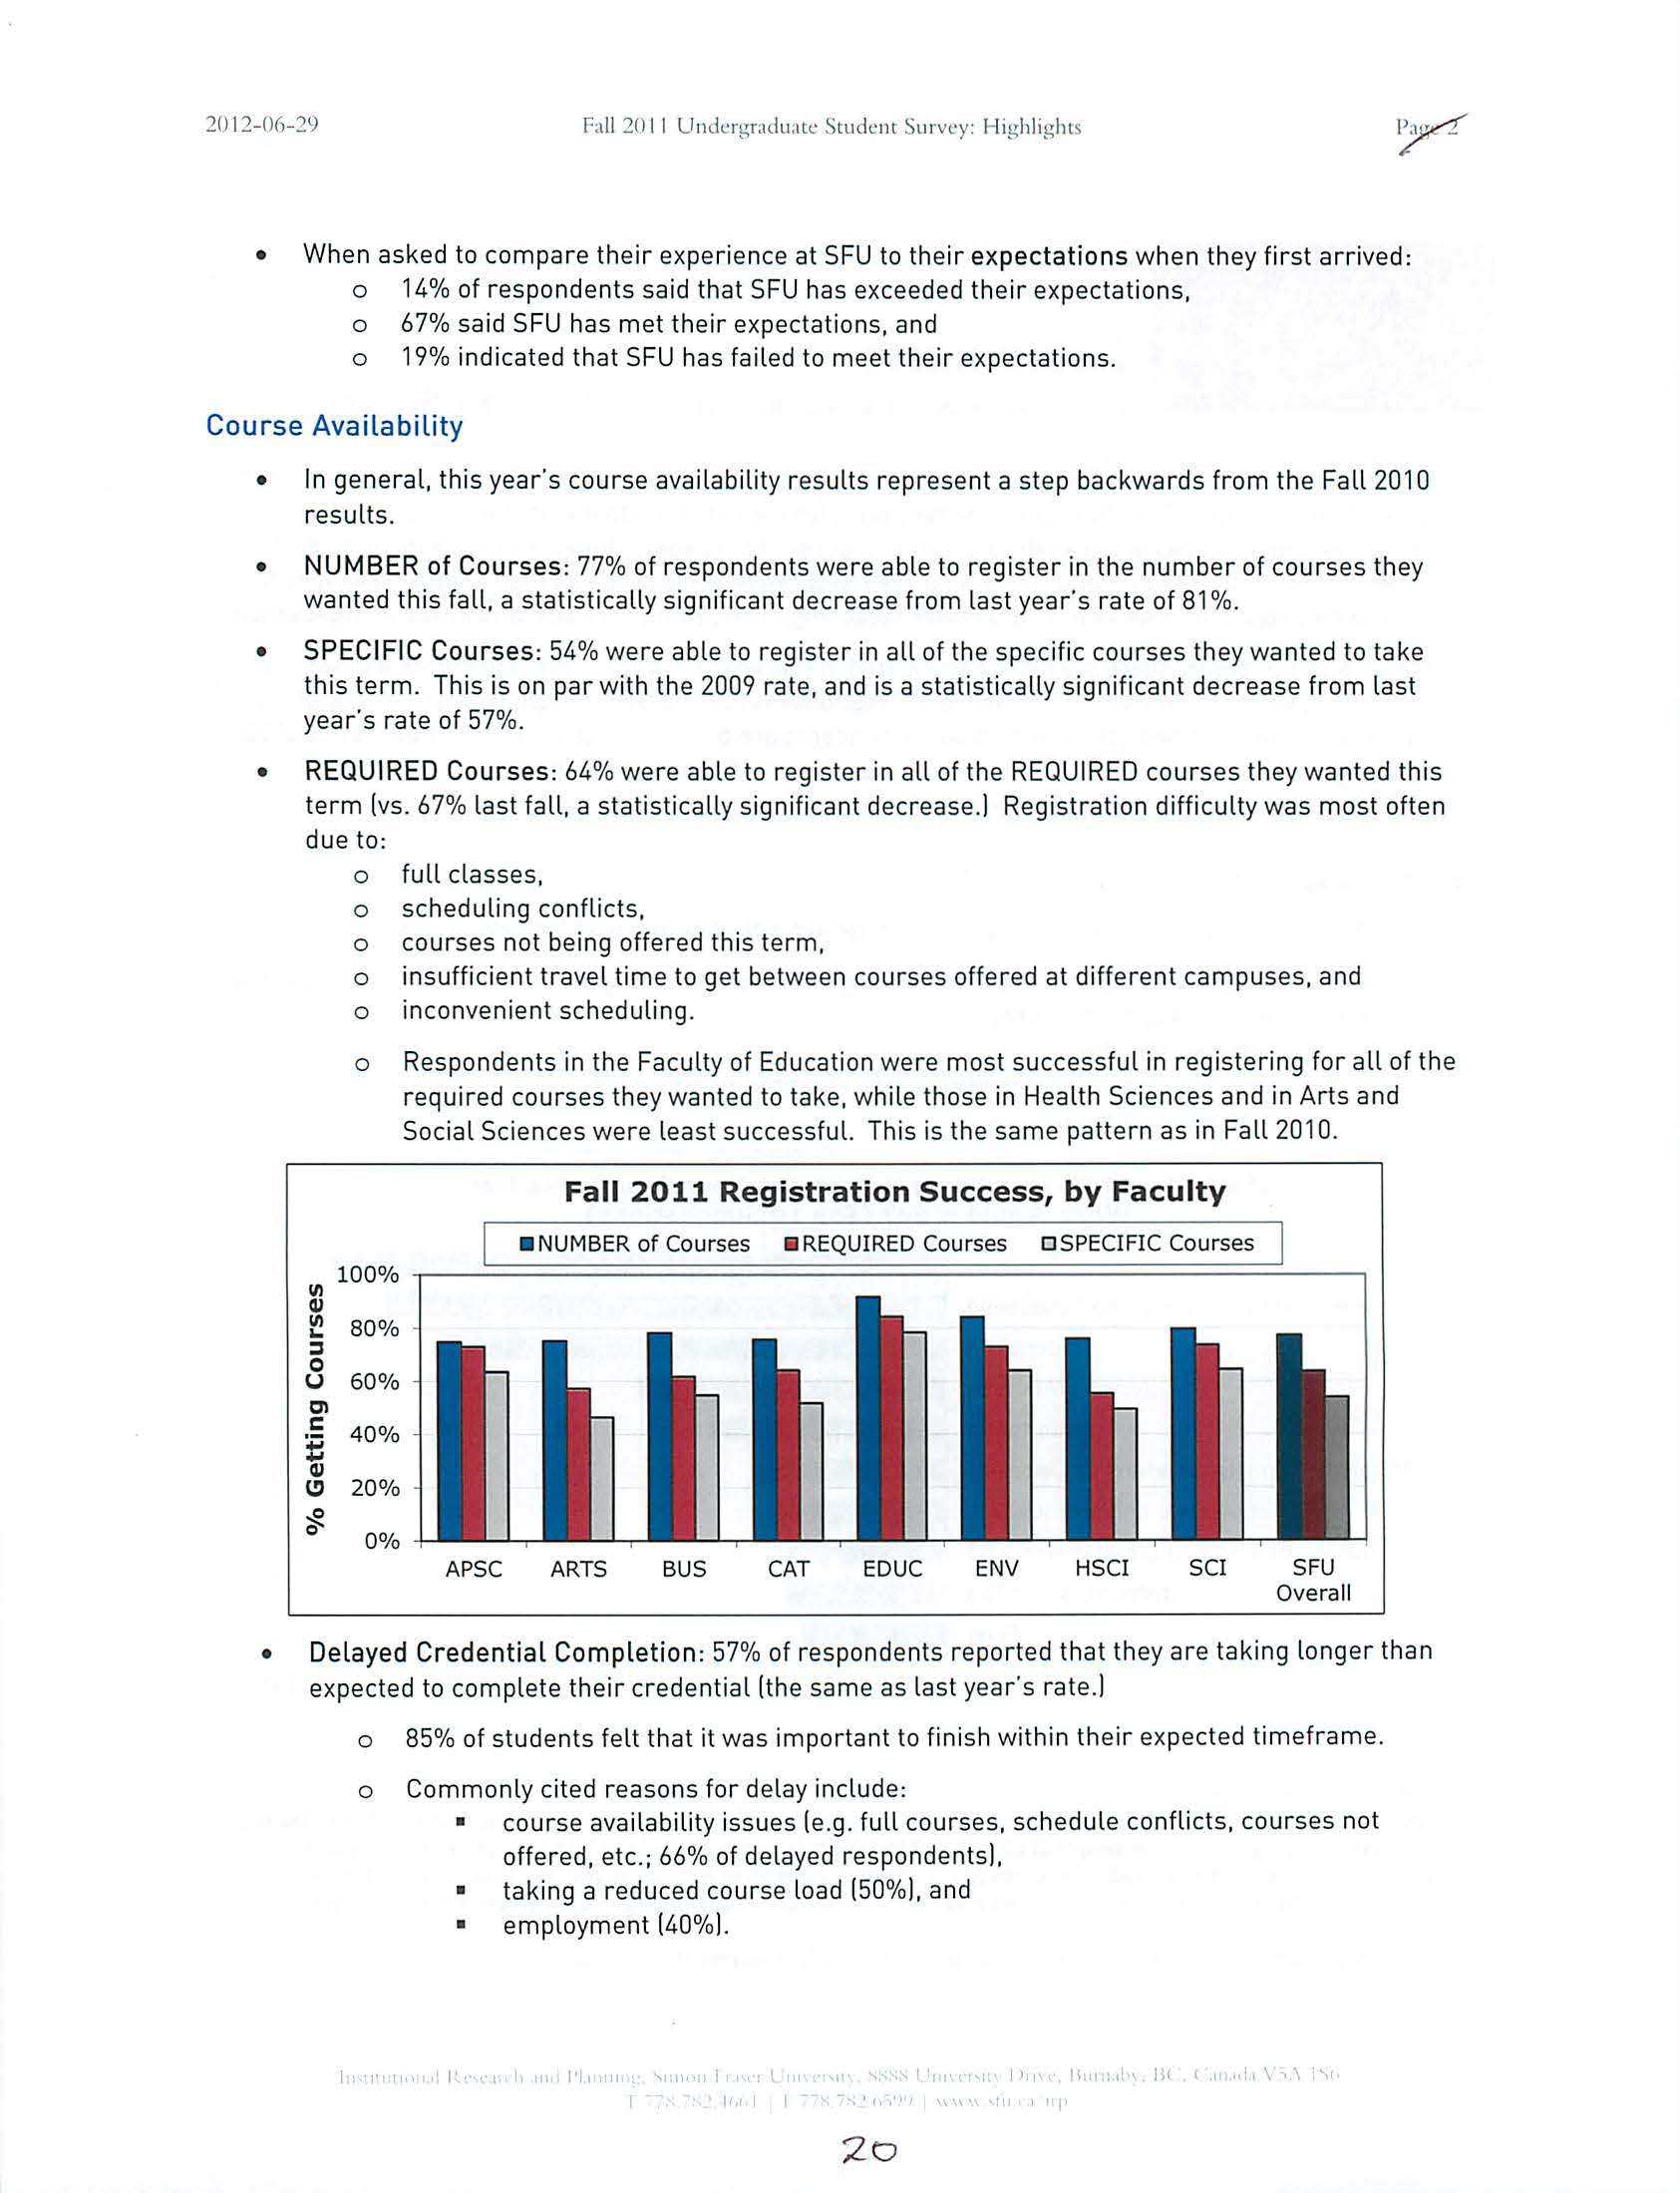
REQUIR
E
D Courses:
64%
we
r
e ab
l
e
t
o
regi
ster i
n
all
of
th
e
REQ
U
I
RED
co
u
rses they wanted
this
term
(v
s
.
67%
l
as
t
fall,
a
statistically
s
ignifi
cant
decrease.] Registration
dif
fi
c
u
l
t
y was most often
due
t
o:
Ill
41
Ill
..
::J
u
0
c
en
B
41
(!)
0
~
o
full classes,
o
scheduli
n
g co
nfli
cts
,
o
co
ur
ses not be
in
g
offered
thi
s term,
o
in
s
uffici
e
nt
travel
tim
e
to get between
cou
r
ses o
ff
ered a
t
d
i
ffe
r
ent campuses, and
o
inco
nven
ient
sched
ulin
g.
o
Respondents
in t
h
e
Faculty
of
Education
were most successful
i
n reg
i
ste
r
ing for all of the
r
eq
uir
ed
courses they
wan
t
ed
t
o
take,
while those
in
Hea
l
th Sc
i
ences and
i
n Arts and
Social Sciences
were
least
s
u
ccessful. Th
i
s
i
s
the
same pattern as
i
n
F
all 2010.
10
0%
80%
60%
40%
20%
0%
APSC
Fall 2011
Registration
Success, by Faculty
•
NUMBE
R of Courses
•
REQUIRED
Courses
D
SPECIFIC Courses
AR
T
S
BUS
CAT
EDUC
ENV
HSCI
SCI
S
F
U
Overall
•
Delayed Crede
n
tial
Completion:
57% of
respondents reported
th
a
t
they
are taking
l
onger
t
han
expected to complete
their
credentia
l (th
e same as
l
ast yea
r
's
rate.]
o
85%
of st
u
dents felt
th
at
it
was
important to finish
with
i
n
t
h
eir expected t
i
meframe.
o
Commo
nl
y c
it
ed reaso
n
s
for delay include:
•
co
ur
se ava
ilabilit
y
i
ss
u
es
(e.g.
f
ull
co
ur
ses
,
sche
dule
co
nfli
cts, cou
r
ses not
offered,
etc
.
; 66%
of delay
e
d r
es
pondents].
•
taking a
red
u
ced course
l
oa
d (50
%
1.
a
n
d
•
emp
lo
yment
(
40%
1.
I I
11
'-tl
I
~
II
jl
1\
I 11
\
I
H
( I I
\ "\ '\1
.,
'
I
Zo
o
Rates of delayed
completion are highest in the
Facu
lty
of
Hea
lth
Sciences (64%1 and
lowest
in the
Faculty
of
Education
(
40%1.
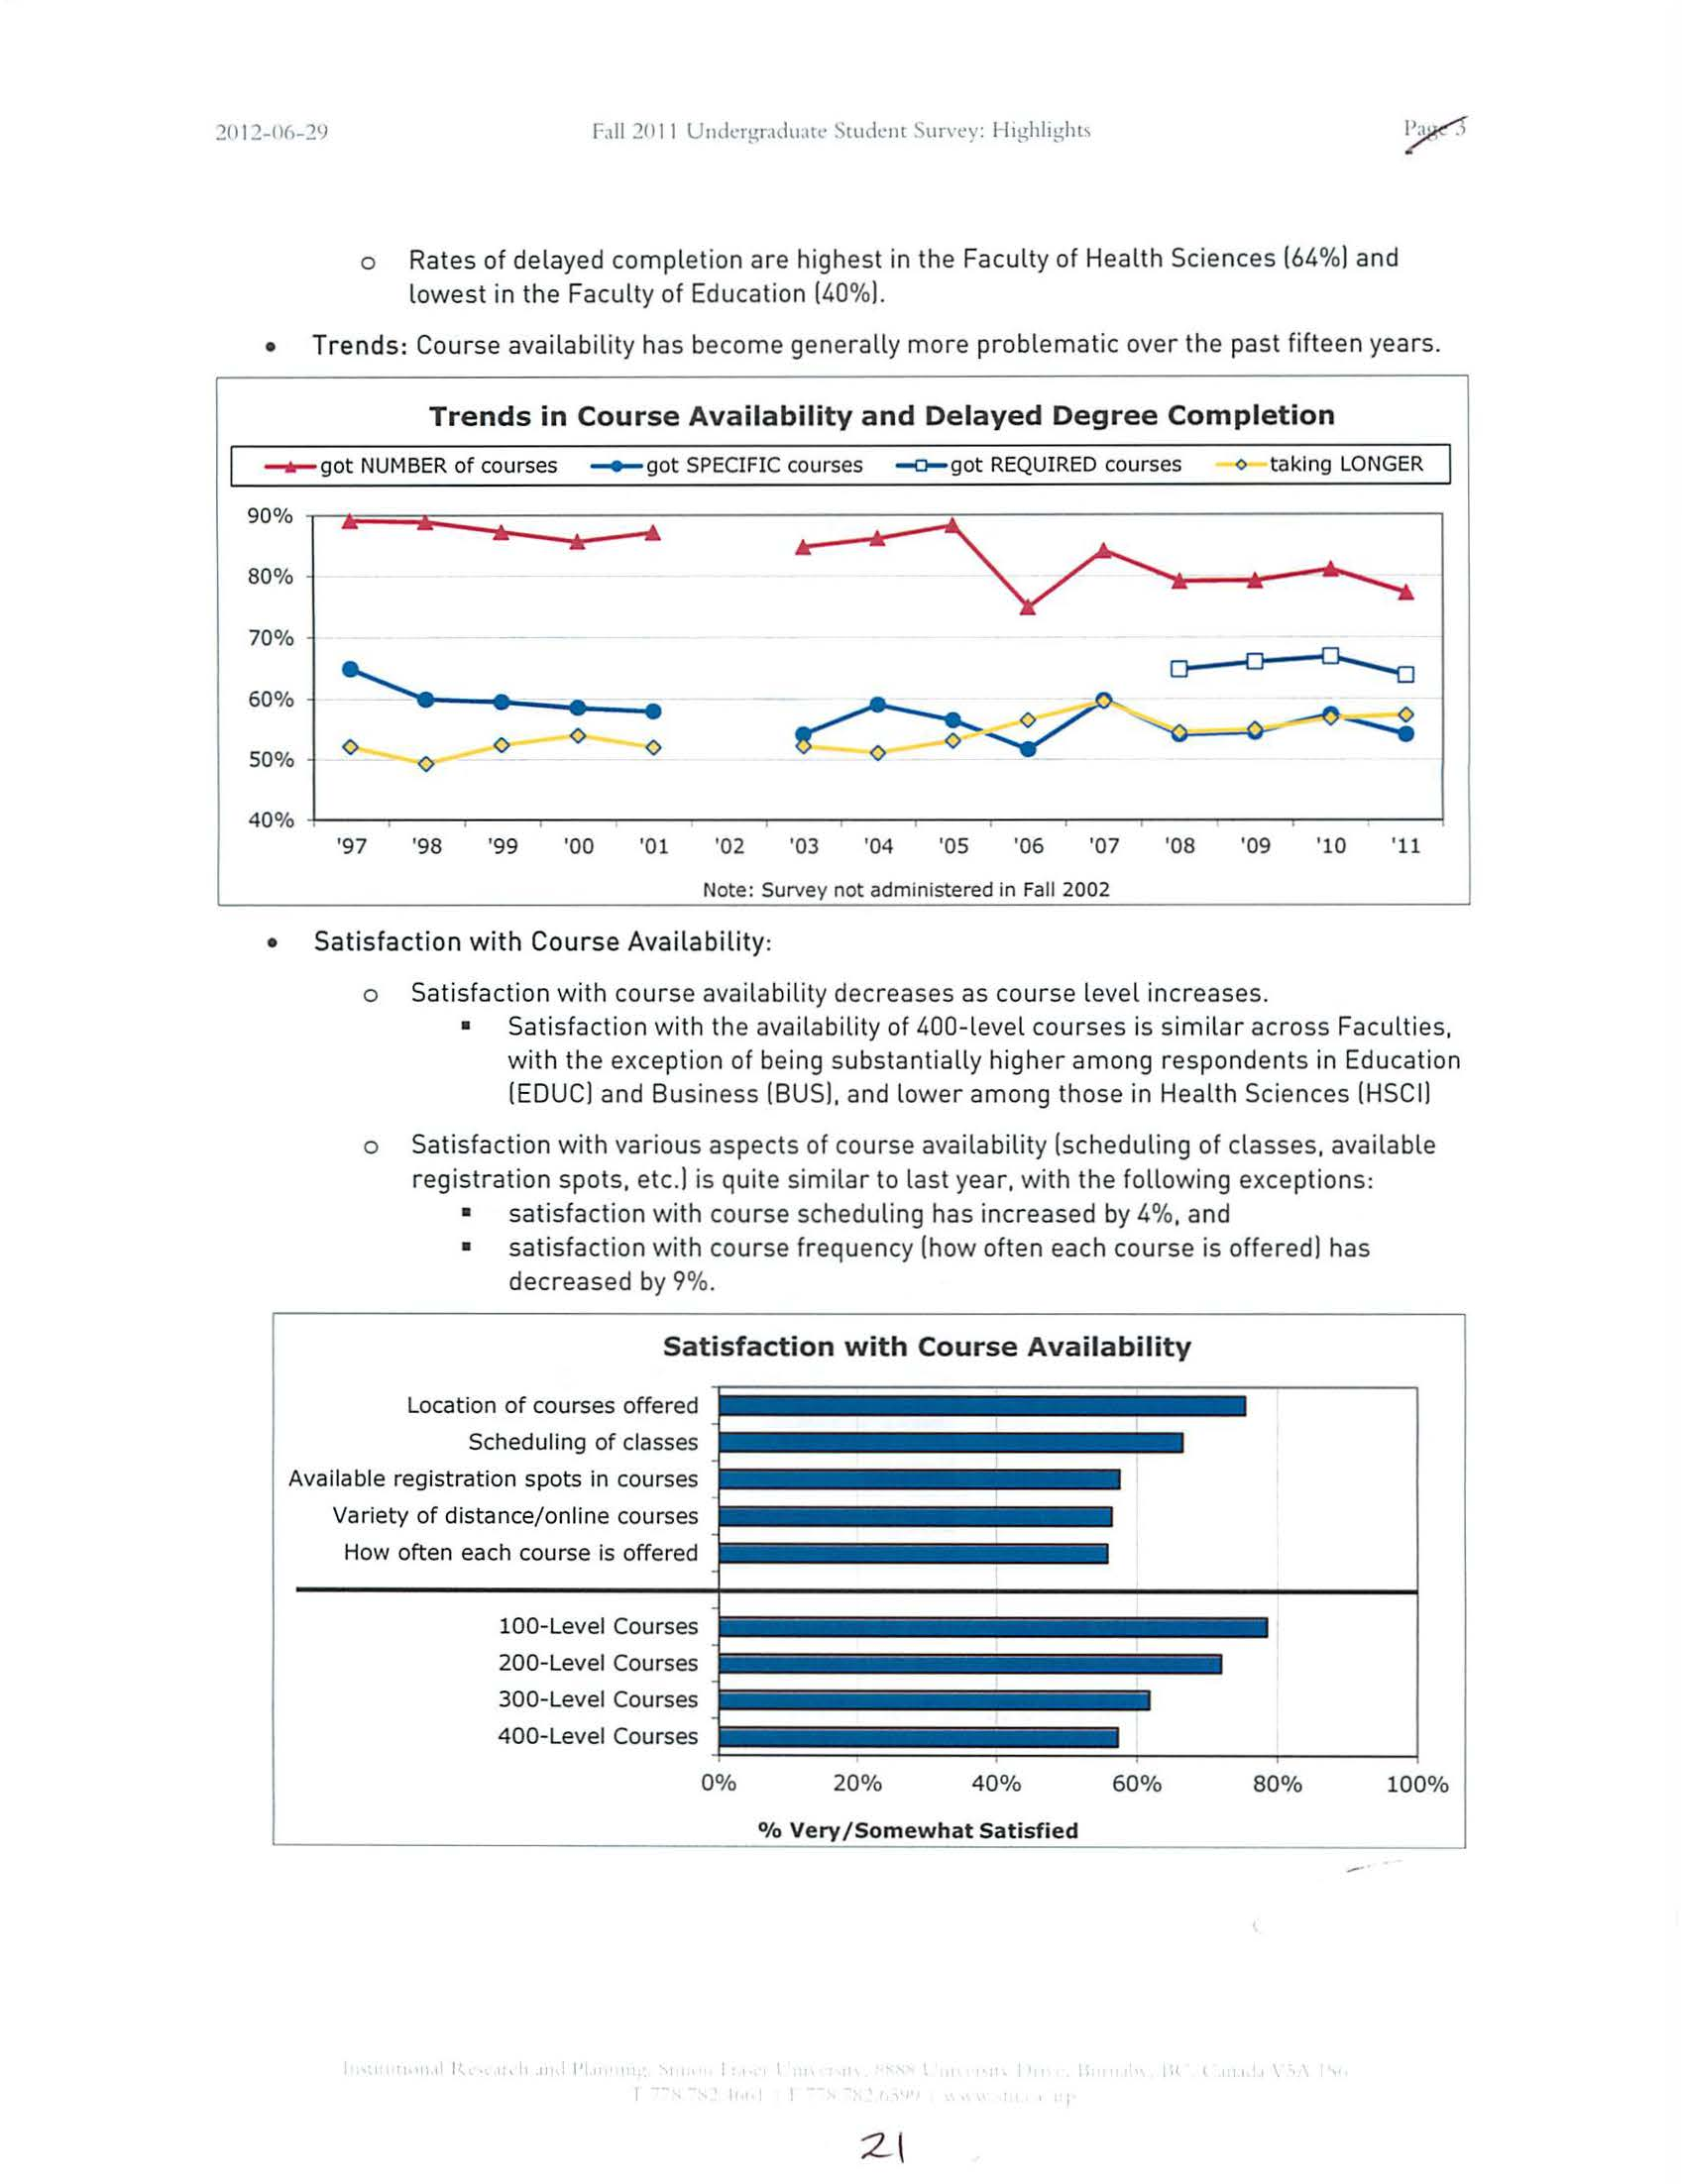
•
Trends
: Course
availability
has
become generally
more
problematic
over the
past
fif
t
een years
.
Trends in Course
Availability
and Delayed Degree Completion
-
got
N
UMB
ER
of
cours
es
-
got
SPECIFIC
courses
~
got
REQUIRED
courses
o
t
ak
in
g
LONGER
70%
~
o---a----D--a
60
%
•
•
•
~
~
~.--()
~
0
0
0
0
50%
0
40%
'97
'98
'
99
'00
'0
1
'0
2
'03
'04
'O
S
'06
'0
7
'08
'09
'
10
'1
1
Note: Survey not administered in
Fall
2002
•
Satisfaction
with
Course
Availability
:
o
Satisfaction
w
i
th cou
r
se ava
i
lability dec
r
eases as cou
r
se
l
evel
i
ncreases.
•
Satisfaction
with the availabi
li
ty
of
400-level courses
i
s similar across
F
acu
l
ties,
wit
h
the exception of being substantially
higher
among
r
espondents in
E
ducation
l
EDUC]
and
Bu
siness
(BUS].
and
lower
among those in
Health
Sciences
(HSCI]
o
Satisfaction
with
var
ious
aspects of
co
urse
availability
(
scheduling of
classes,
available
registration
spots, etc.! is quite simila
r
to last
yea
r,
with the following
exceptions:
•
satisfaction
with course scheduling
has increased
by
4%,
and
•
satisfaction
w
ith
course frequency (how often each course is offered] has
decreased
b
y
9
%.
Satisfaction with Course Availability
L
ocation
of courses
offered
jiiiiiiiiiiiiiiiiiijiiiiiiiiiiiiiii·
----~
Scheduling
of
classes
•••••••••••••111111111
Available
reg
istration
spots
i
n courses
Va
r
iety
of distance/online courses
How
ofte
n
each
cou
rse
is
offered
•••••••••••••
100-Level
Cou
r
ses
200-Le
vel
Courses
300
-L
evel Cou
r
ses
Ji••••••••••••••
400-Level Courses
~
=============r======~------~----
~
0%
20%
40%
60%
80%
100%
%
Very
/Somewhat
Satisfied
I
I
I'
20
1
2-06
-
29
f'a
ll
20 II U
n
dergraduate
S
tu
dent Survey:
Hi
g
hli
g
h
ts
I
~
Teach
i
ng/Curr
i
culum
•
Q
u
a
li
ty of
T
eaching:
86% of
r
espo
nd
e
nts are
satisfied
w
ith
the overall
qual
i
ty
of
t
eac
hing
at
S
FU.
•
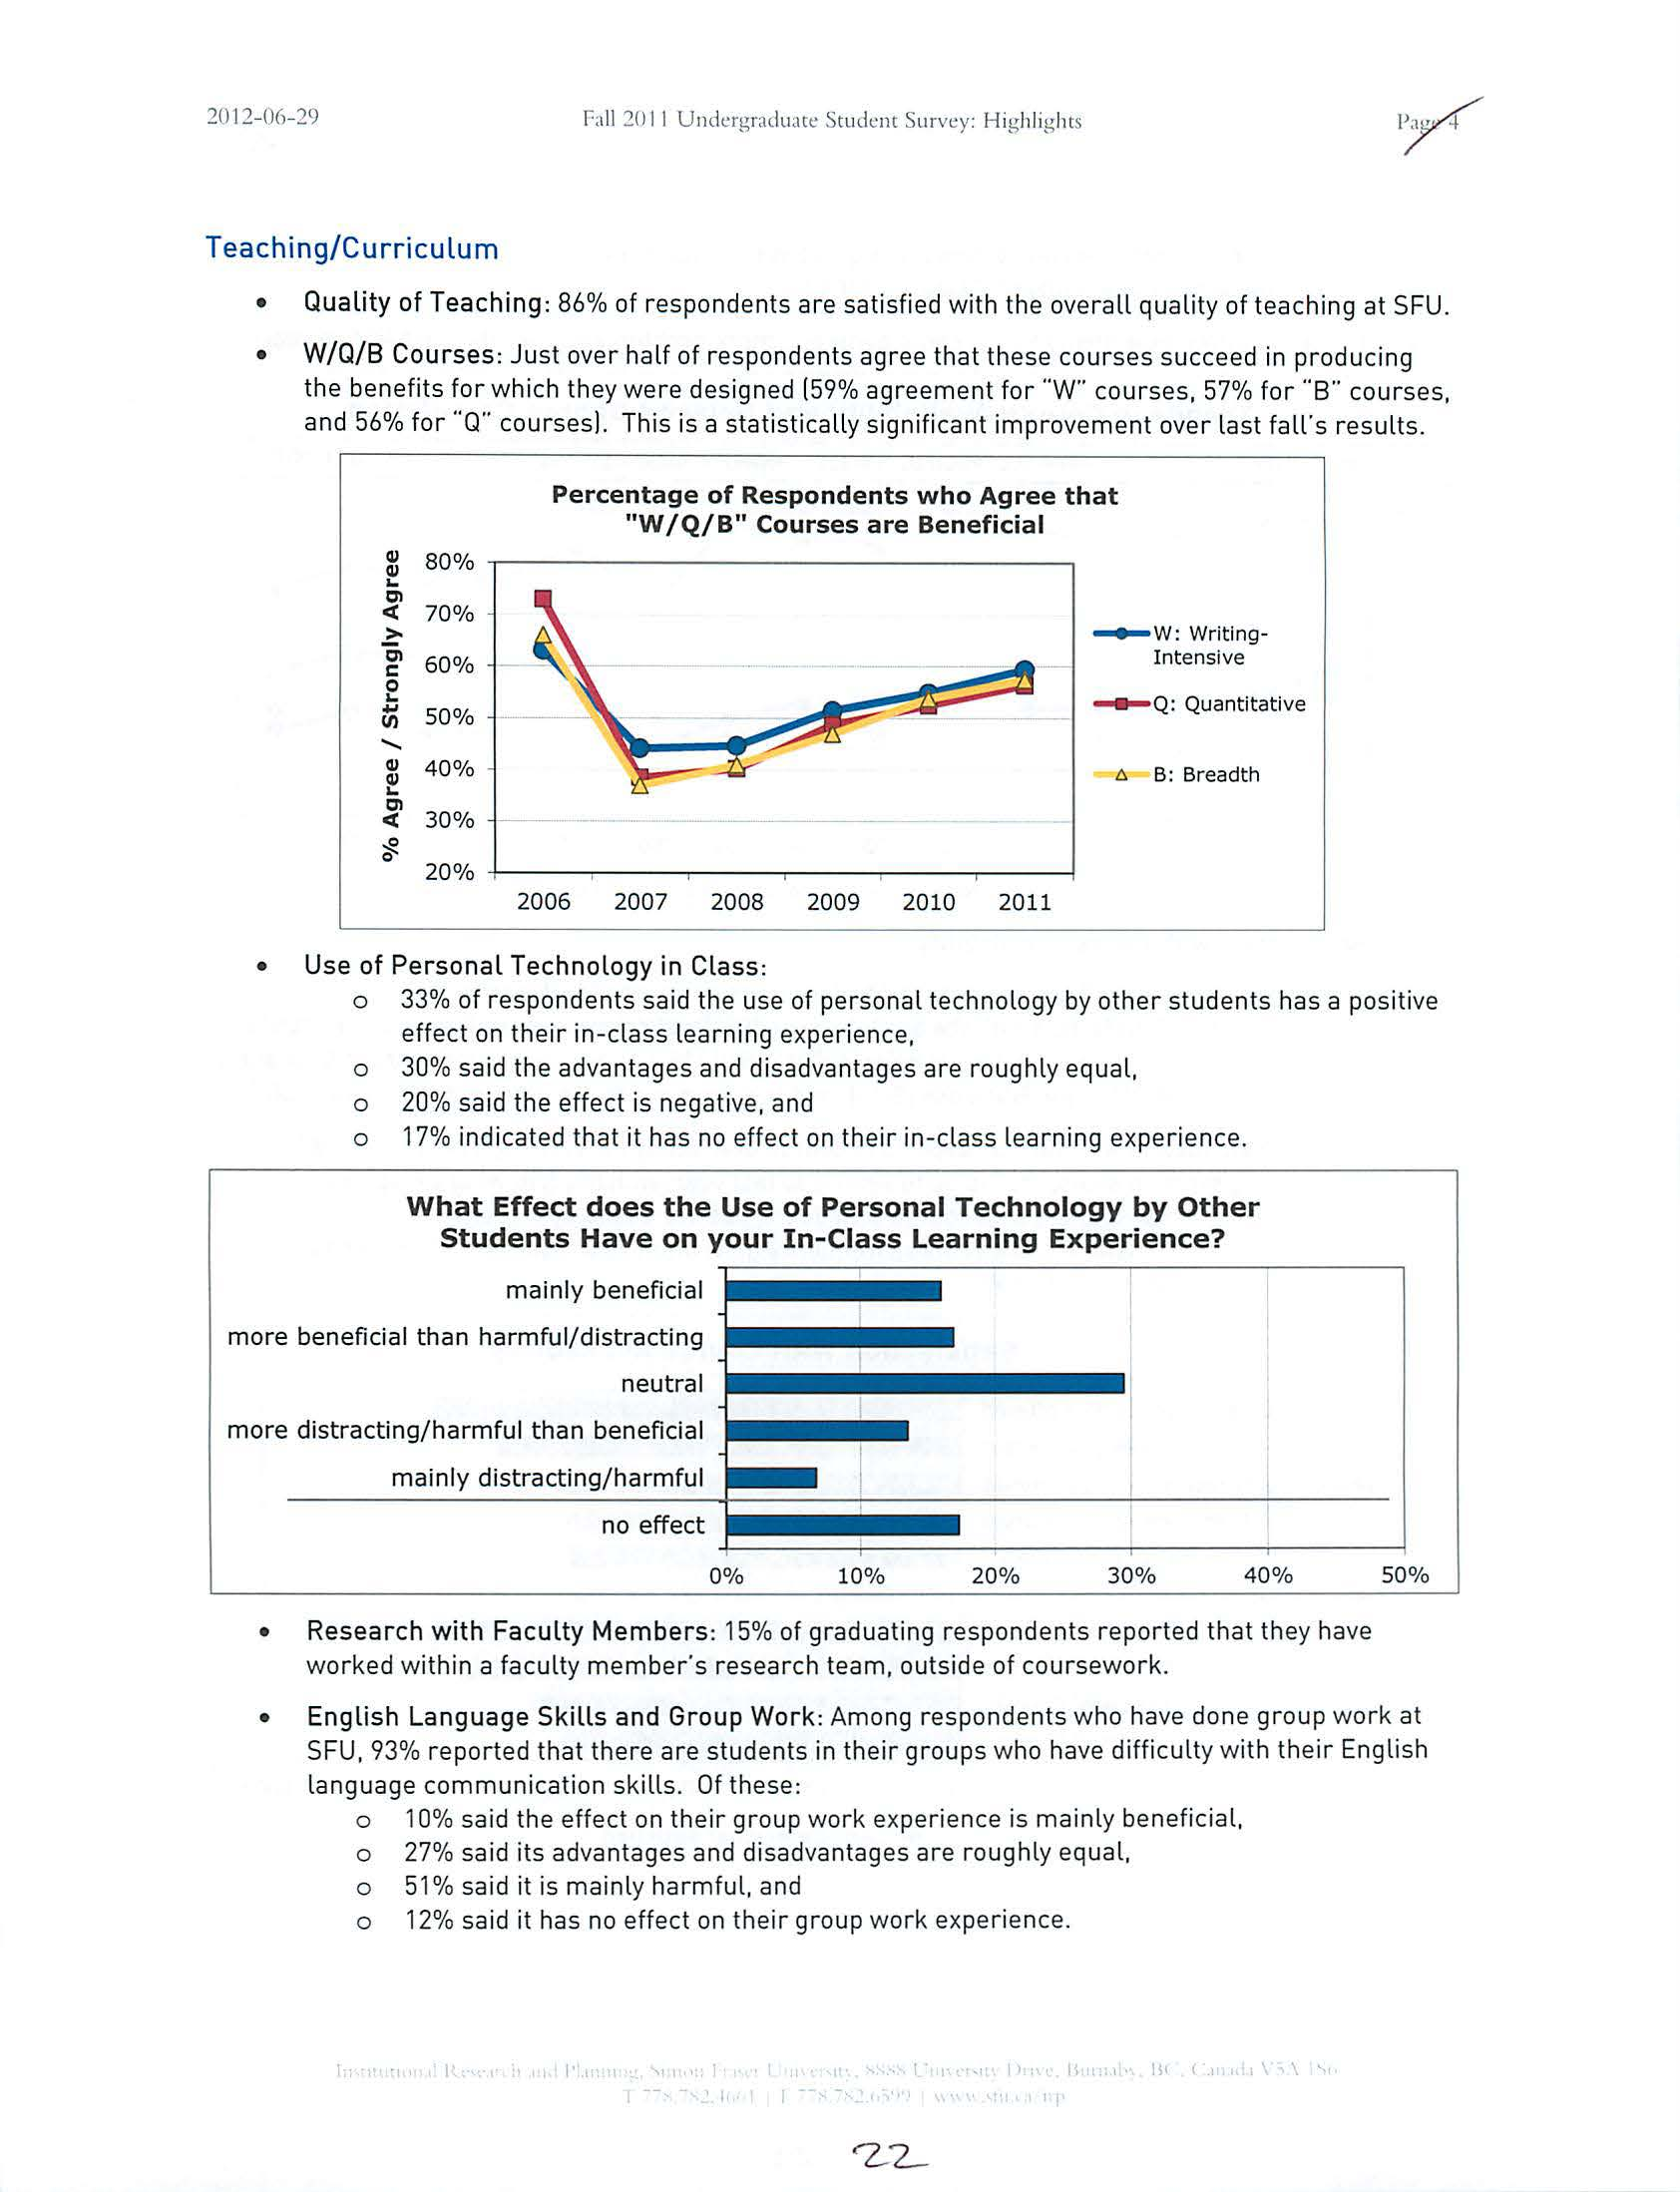
W/Q/8 Courses: Just
over
half
of
r
es
pond
en
ts
agree that
the
se co
urses
s
u
cceed
in producing
the
benefits
for
which they were designed
(59
%
agreement
for
"
w.
courses, 57%
for ..s.
courses,
and
56
%
for
"
a..
courses].
T
his is
a
sta
tisticall
y
significant improvement over
last fall.s re
s
ult
s.
QJ
80%
..
01
~
70%
-
c,
>
c
60%
....
0
50
Ill
%
.....
QJ
40
%
..
01
~
30%
0
~
20%
P
e
rcentage of Respondents who Agree that
"W
/
Q/B
"
Courses are Beneficial
2006
2007
200
8
2009
201
0
2011
-
w:
Writ
ing-
Int
ensive
-
Q:
Quantitati
ve
A
B: Breadth
•
Use of Pe
r
so
n
al
T
ec
h
nology i
n
C
l
ass:
o
33% of
respondents
said the
u
se
of personal
t
ec
hnolog
y
by other students
ha
s
a
po
si
ti
ve
more
more
effect
on
their in
-class
le
arni
n
g exper
i
ence
,
o
30% sa
id the
a
d
van
t
ages a
nd
d
i
sadvantages a
r
e
r
o
ugh
l
y eq
u
a
l
,
o
20% sai
d th
e
effect
i
s
n
e
ga
tive, a
nd
o
17%
indi
cated
th
at
it ha
s
no
e
ff
ec
t
on
t
he
ir i
n-class
l
ear
nin
g
experience.
What Effect does the Use of Personal
Technology
by Other
Students Have on your In-Class Learning Experience?
mainl
y
beneficial
I
beneficial than h
arm
ful
/
di
s
tracting
neutra
l
_I_
I
di
st
racting
/
harmf
u
l tha
n
b
e
n
eficia
l
mainly
di
strac
ting
/
harmf
ul
no effect
I
0%
10
%
20%
30%
40%
•
Resea
r
ch w
i
th Facu
l
ty Members
:
15% of
g
r
a
du
a
tin
g
r
espo
nd
e
nt
s
reported
that
they have
wo
r
ked w
i
t
h
i
n
a
fac
ul
ty
m
em
ber"
s
research team, outside
of co
ur
sewo
rk
.
50
%
•
Eng
li
sh
L
anguage
Skills
and Gro
u
p
Wo
r
k
: Among respo
nd
ents who
have
do
n
e
group
work at
SF
U
, 93
%
report
e
d
that there
are st
u
dents
in their
g
r
oups who
h
ave
difficulty
with t
h
ei
r
English
language
comm
unic
a
ti
on s
kill
s.
Of these:
o
10
%
sa
id
the
ef
f
ect on thei
r
gro
up
wo
rk
e
xper
i
ence
i
s ma
i
n
l
y be
n
eficial,
o
27
%
said
it
s advantage
s
and disadvantages are ro
ugh
ly equal,
o
51
%
sa
i
d i
t
is
mainly harmful,
a
nd
o
12
%
said it has
n
o effect on their g
r
ou
p
wo
r
k experie
nc
e.
'I•
20
1
2-06-2')
Fall
20
II
Undcr~r.Hiuat<:
Student Survey:
H1~hh~lm
•
Student Learning Outcomes:
Students
we
r
e asked wha
t
qualities/skills
the
y
thought an SFU
graduate
should
ha
ve
.
Respond
e
n
ts
indicated
tha
t
critical
t
h
i
nking
sk
ill
s
are
t
he
most important.
Important
Qua
li
ties/Skills/Experiences SFU Students
should
Have by the
T
ime
they
Graduate (top 5)
Critica
l
thinking
Ability
t
o
app
l
y
knowledge/methods
Oral
co
mmuni
c
ation
Team-work
Solid
foundation
in their
field
Services
0%
10%
20%
I
I
I
30
%
40%
SO
%
60
%
70
%
•
Facilities
:
74%
of
r
es
pondent
s a
r
e sa
ti
sfied wit
h
the
q
ua
li
ty of on-camp
u
s
buildings
a
nd
fac
i
lit
i
e
s
(vs.
77
%
last
yea
r
, a stat
i
stica
ll
y s
ig
nif
ic
ant cha
n
ge.
)
o
When
asked
wh
i
c
h build
i
n
g
has the greatest need
of
updating,
th
e
top
ch
o
ices we
r
e:
•
Aca
d
emic
Quadrangle (AQ,
se
lected b
y
48%
of
res
pond
e
nts!.
•
Rob
ert
C. Brown Hall/Images
Theat
re
(RCB
/IMAG
TH,
11%
1.
and
•
West Mall Centre (WMC,
11
%
1.
AQ: Most Urgently Needed Update/Maintenance
Washrooms
jiiiiiiiiiiiiiiliijiiiiiiiiiiiiiiiiiil
--l
Aesthetics/Decor
Lighting
Furni
t
ur
e
(
Desks, Chairs)
St
ud
y/Seat
ing
A
r
eas
+----
-r
---~--
--.----~
---
4
0
%
10
%
20%
30
%
40%
5
0
%
•
Library
a
nd
Student
Learning
Commons
:
When asked
w
hat
the
Library could
d
o
to make
it
eas
i
e
r
for
st
ud
e
nts t
o
bring their
l
aptops to
c
ampus
,
the
mos
t
popular
replies were:
o
mor
e e
l
ect
r
ical outlets
(
r
e
qu
este
d
by
68
%
of ap
p
licable
respondents!.
o
more/improved carrells,
seat
in
g a
nd
stud
y
spaces
(
65
%
1.
a
n
d
o
provid
e
chargi
n
g
stations
(58%
1.
•
Use
of Campuses:
Stude
n
ts
we
r
e aske
d
wh
i
c
h
campus
th
ey
regularl
y
use to
ta
ke
classes
,
us
e
t
h
e
Library, access
Student
Ser
v
ices, use
computer labs,
a
nd
use study space.
o
The
vas
t
majorit
y of
respon
de
nts
indicated that they
do these
activities at
the
Burnab
y
campus
[
-80-87
%
,
depending
on the
activit
y
!.
followed by th
e
Su
rr
ey cam
pus
(
17-26
%
1.
then the Va
n
couver
campus
[7-15
%
1.
o
Some students
regularly
use mult
i
ple campuses for these acti
v
ities
:
•
24
%
of
r
espondents
r
egularl
y
take classes at mu
ltipl
e campuse
s,
•
9% access
Student Services
at multiple campuses,
and
•
17%
use the
Libr
ary, com
puter l
abs,
and
st
ud
y s
p
ace
at more
t
ha
n
one
campus
.
:WI2-06-29
F3ll
2011 Underg
r
aduate
Studem
Sur\'l'y:
Hig
hl
i
ghts
I
~
General
•
Engagement at SFU: Graduating
students were
asked
about
their participation
in
va
rious
activities
at
SFU, over
the
course of their
studies here.
Among respondents:
o
19
%
had participated in
co-op, and an additional62% said
that they
would
have lik
e
d
to.
o
7-11
%
had particip
a
ted in
field schools,
international
exchange/study abroad, and
wo
rk
-
study.
An
additional55-67
%
said
they
would
ha
ve
lik
ed
to
participate in
these programs.
o
13%
indicated
that they
we
re una
wa
re
of events
in their department,
program or
Fa
c
ulty
in
w
hi
ch
they could have participated.
•
Engagement in the Community
:
In th
e
last
yea
r:
o
40%
of respondents
e
ngaged in
civic activities
in th
e
ir
local community,
o
33%
e
ngag
e
d
in
hum
a
nitarian
e
fforts
to help
the n
eedy
,
a
nd
o
15-20
%
engaged
in
environmental advocacy,
socia
l ju
st
ice
activ
ities,
and community
service
wo
rk that mad
e
u
se
of their SFU
education
.
o
Among those who
did
engage
in these
activities,
21%
d
id
so
in
an
international
sett
ing.
o
34-55%
indic
ate
d that
they are
not planning on
engaging
in these types
of acti
v
iti
es.
•
Employment: 53
%
of respondents are currently employed
or
se
lf
-e
mployed
.
Among
the
se:
o
1
0
%
work more than 30
hour
s
per
week
in
a paid
j
ob
,
o
31%
wo
rk
16-
30
hour
s
p
e
r
week
,
and
o
58%
wo
rk
1
5
hours
or less p
e
r
week.
•
Tuition for International
Students:
Internation
a
l
st
ud
e
n
ts
were
asked w
hether the
y wou
ld
sti
ll
have come
to
SFU
if
t
h
e
tuition had been high
er.
o
At
an increase
in
tuition
o
f
$1,000 per year,
47%
of
international re
spo
nd
e
nts indi
ca
t
e
d
that th
ey
d
ef
init
e
l
y wo
uld ha
ve
come, 22% said
th
a
t
they
wo
uld
not
have
co
m
e, a
nd
3
1
%
were
un
s
ur
e.
o
At
an in
crease
of
$5,
000
per year, 14% said
th
a
t
they definitely would
h
ave
come, while
71% definitely
wo
uld
not have
co
me to
SFU,
a
nd 15
%
were
un
s
ur
e
.
•
Student Goals
: S
tud
e
nt
s
were asked to
indicate
what they were
h
o
ping to
get out of their
SFU
e
du
cat
ion
.
Respond
e
nt
s
indi
cat
e
d that
getting a good
jo
b
had bee
n
their
t
op
priority.
When Students Decided
to
come to SFU,
They
were Hoping to ... (Top 5)
fulfill
their
desire
for
knowledge
meet new friend
s
and
hav
e
a
good
time
-l
I
I
I
train
for
a
spec
ific
career
•••••••••••••••
i
J
I
learn new
ways of
looking
at
the
world
0%
10
%
20%
30
%
40%
50
%
60
%
I
II
I I
I' I
'I I
I
II
()I
Ill I
I
I\
'\ '
'
I
70
%
2Cl
12-ll(•-2')
F.tll 201
I
Undt.rgr.tdu;H<.'Swd<.'nt Sun.n.:
Htghhglm
Recommendations
•
Facilities:
While overall satisfaction
with
facilities
is
relatively
high
[74
%
1. in the student
comments,
facilities were
t
he
most
f
requentl
y
cited
improvement requested.
Based
on
comments received,
student
satisfaction
with facilities
could
be further impro
v
ed
by:
o
Continuing
to
make improvements to
o
n-campus
washrooms,
as
well
as keeping the
was
hroom
s clean throughout the
day, and in a good state of
repair.
Washrooms
in
the
AQ were
most frequently
cited
as
being
in need
of
upda
ting or
maintenanc
e.
o
Increase lighting
in
l
ecture
hall
s.
o
Continu
ing
to add, expand, and make
improvements to
study areas.
•
Course Availability and Scheduling:
Student responses suggest the need
for
continued effort to:
o
Increase
the frequency of required uppe
r
division
courses
.
o
Incre
ase the seat capacity of courses that
ha
v
e been
historically
popular.
o
Schedule
co
u
rses
likel
y to
be taken together at
non-o
ver
lapp
ing times
[and
at
sufficiently
spaced
tim
es, when
they
are offered on d
i
fferent campuses.]
o
Check that exam times
for courses
commonly
taken
toget
h
er
do not overlap,
before
r
eleas
ing
the exam schedule.
•
Student
Life
/
Campus Community:
Students
continue to
request
i
mpro
vements
to student life
and the campus community, such
as
holding
more student events on campus.
•
WQB Courses:
Whi
l
e students' perception of
the
value
of WQB courses
has
been
r
isi
ng
for
several years
,
the
rigidity
of
the requirement
s seems
to cause issues for some students.
Respondents
suggest that the requirements would
be less
cumbersome
if
t
here
were more
designated
WQ
B
courses, especiall
y
at
the
upper
division level.
•
Policies and Services:
Some
additional student suggestions over the
last
few
years
for
improving their experience at SFU include:
o
Reducing wait times to see academic advisors.
o
Improving the
registration
priority system, and communicating the a
l
gorithm
to
students.
o
Increasing
the English-language
communication standards for
incoming students.
o
Lower
in
g
tuition and fees
,
and/or
impro
vi
ng
financial
aid.
Back to top