S.11-126
SFU
OFFICE OF THE VICE-PRESIDENT, ACADEMIC AND PROVOST
University Drive, Burnaby, BC
Canada V5A 1S6
TEL: 778.782.3925
FAX: 778.782.5876
www.sfu.ca/vpacademic
MEMORANDUM
attention Senate
DATE
October 18,2011
from
Jon Driver, Vice-President, Academic and
PAGES 1/2
Provost
RE:
Response to question regarding gender differences
Senator June Francis has submitted the following questionslto me:
1.
What are the key gender difference statistics at SFtlLSpecifically, what are the
application, acceptance and registration rates by gender at SFU? Are there noteworthy
trends in these data?
2.
Are there any significant differences in these data by faculty or other important
criteria?
3.
Does SFU have strategies in place for addressing any imbalances identified? If so, what
are these? If not,
why not?
Institutional Research and Planning has prepared a short report (attached) that I
hope provides
useful summary data for Senate.
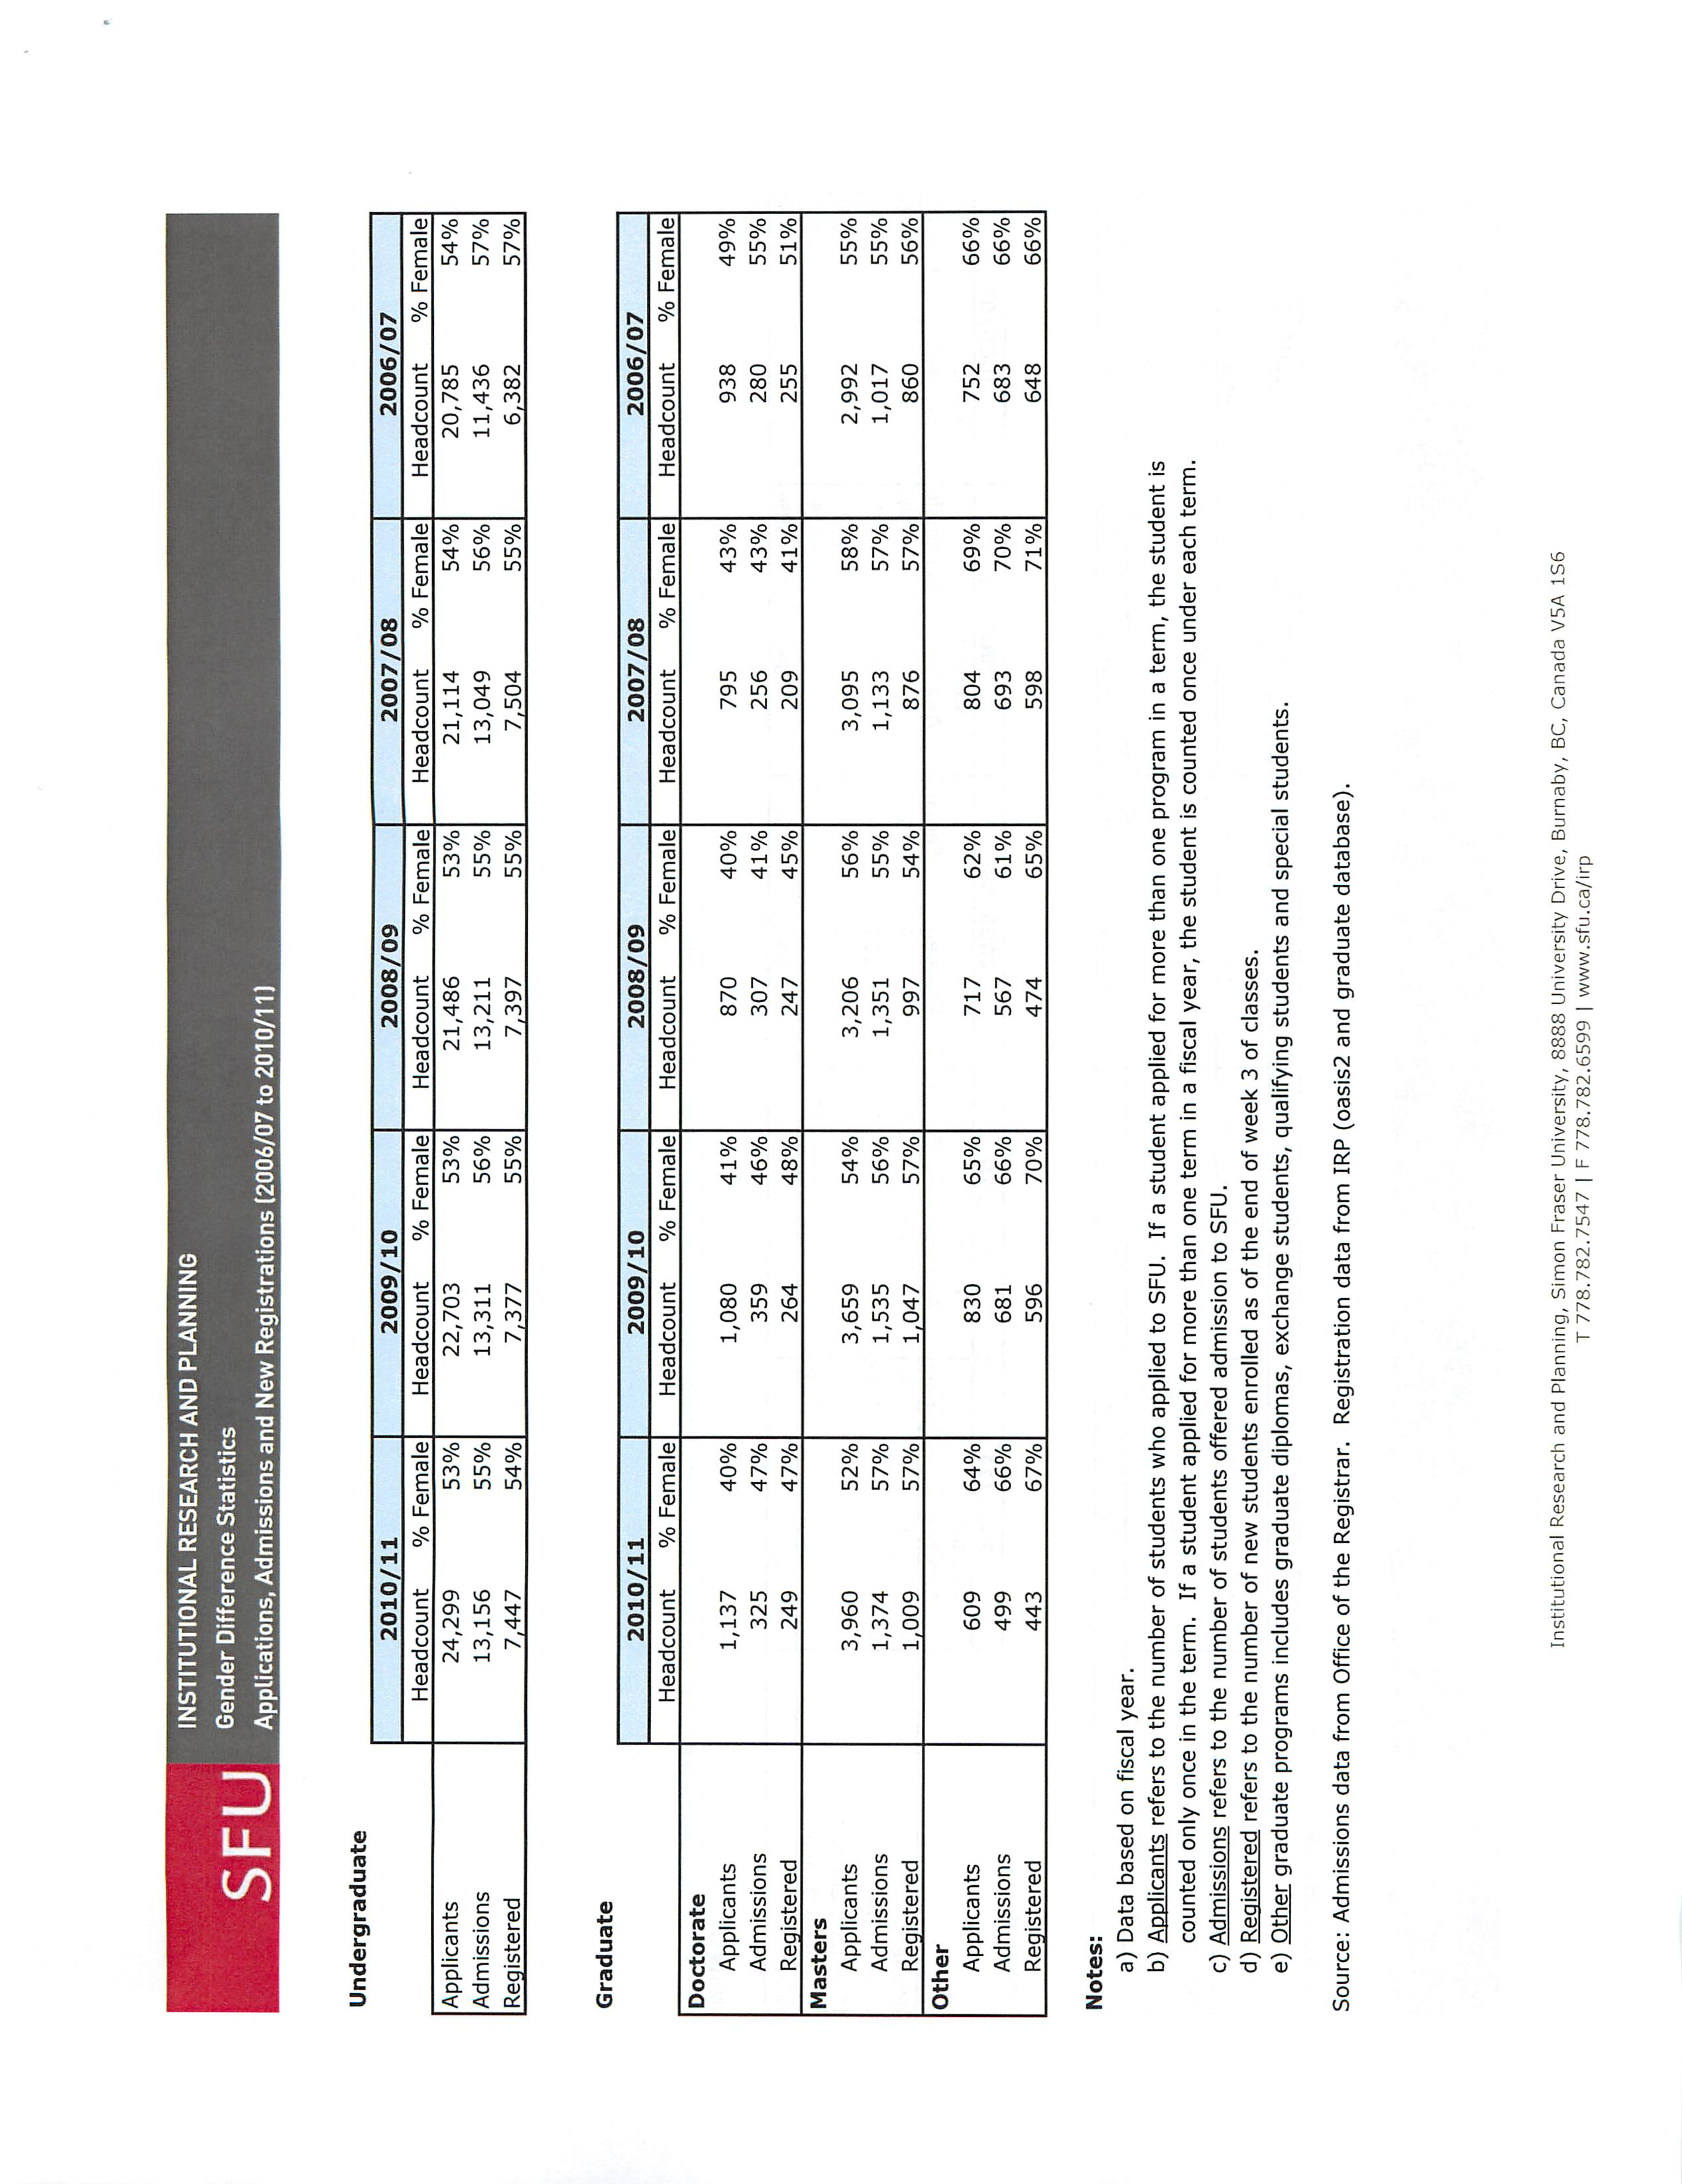
As one can see from the first page of the report, the overall rate of applications from men and
women has remained fairly constant for the last five years, with women constituting slightly more
than half of applicants, admitted individuals and first-time registrations for undergraduate
programs. In graduate programs, there are differences between doctoral, masters and diploma
programs. In doctoral programs, there is still a predominance of male applicants, with a slight
decrease of female applicants and admissions since 2006/2007. A similar decline in the number of
women who apply to masters programs can be seen, but the percentage of female first registrations
has
been fairly constant. The relatively high percentage of female applicants and registrants in
"other" graduate programs probably reflects the fact that the Graduate Diploma in Education
attracts a high percentage
of women.
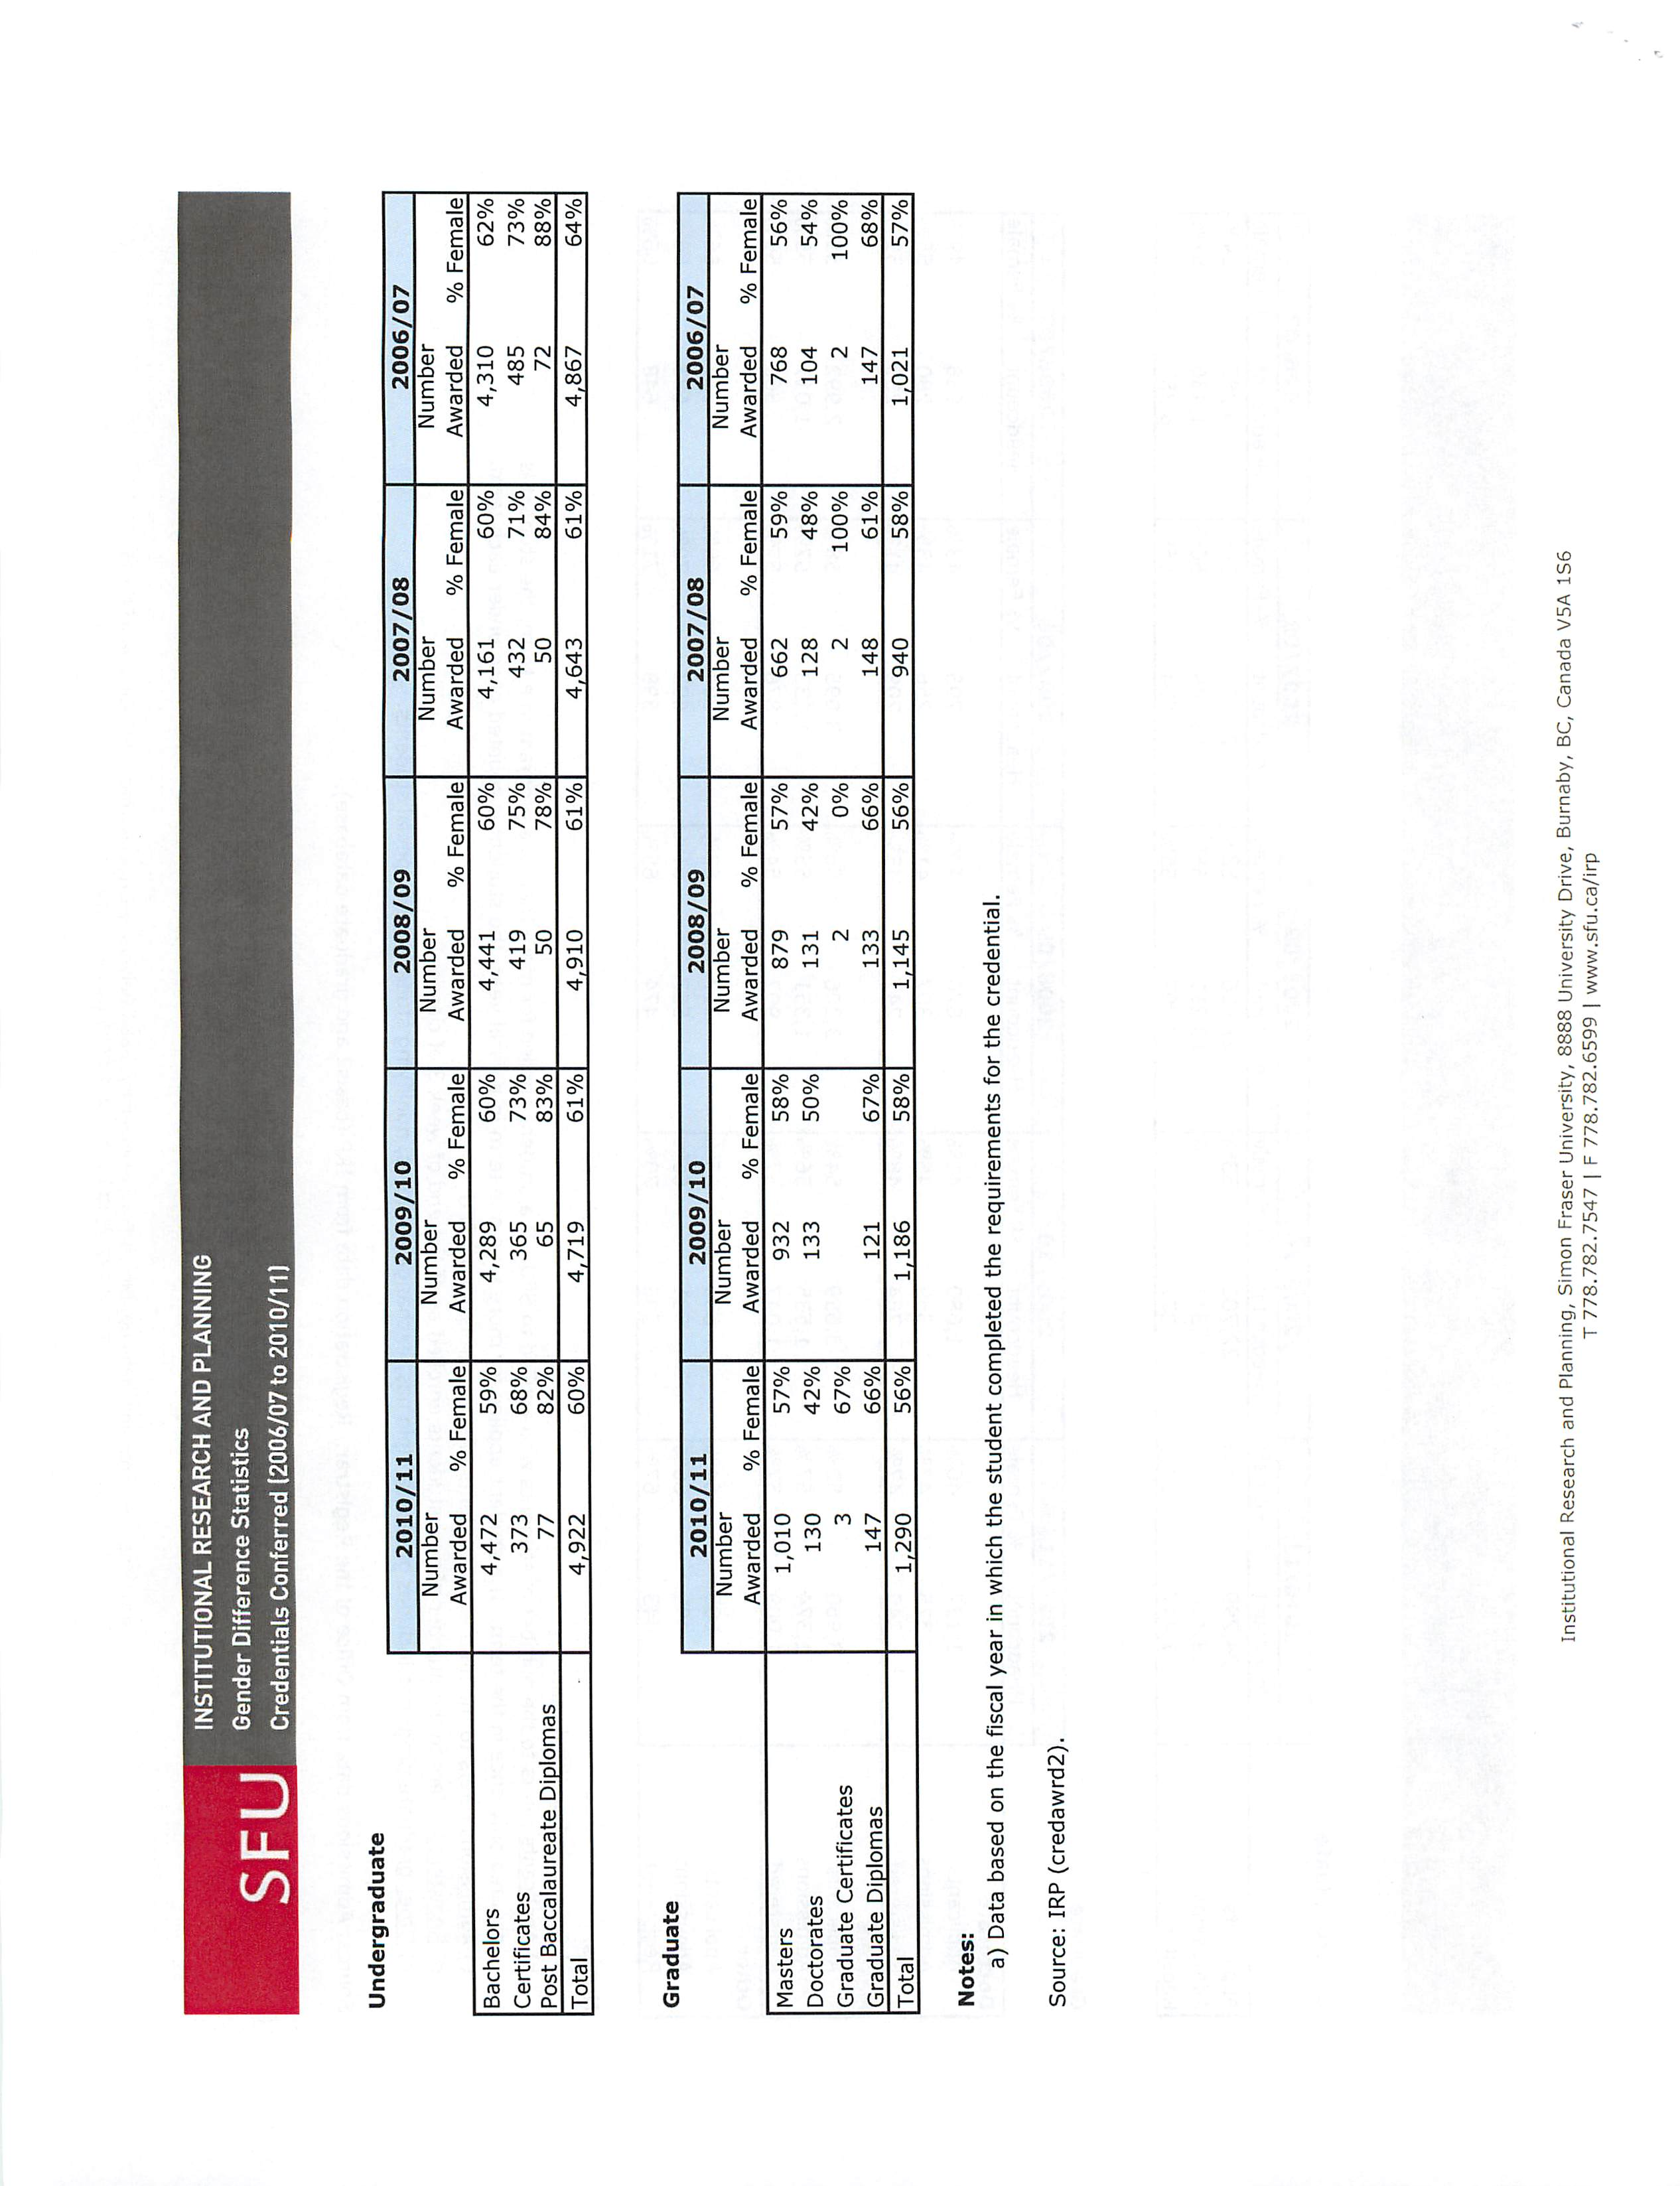
The second page provides data on the number and percentage of credentials awarded by gender.
These data therefore reflect the
number of women and men who start a program and their
persistence in the program.
There is a slight decline in the percentage of women who receive
bachelor's degrees, but overall for the last five years there has been an approximate 3:2 ratio of
women to men who have completed undergraduate degree programs. At the graduate level, we
see a similar trend for masters programs (likely influenced by a high percentage
of women in the
SIMON FRASER UNIVERSITY
THINKING OF THE WORLD
M.Ed, programs). The rather small number of doctorates awarded annually probably influences
the less stable gender percentages, but overall women receive fewer doctoral degrees than men.
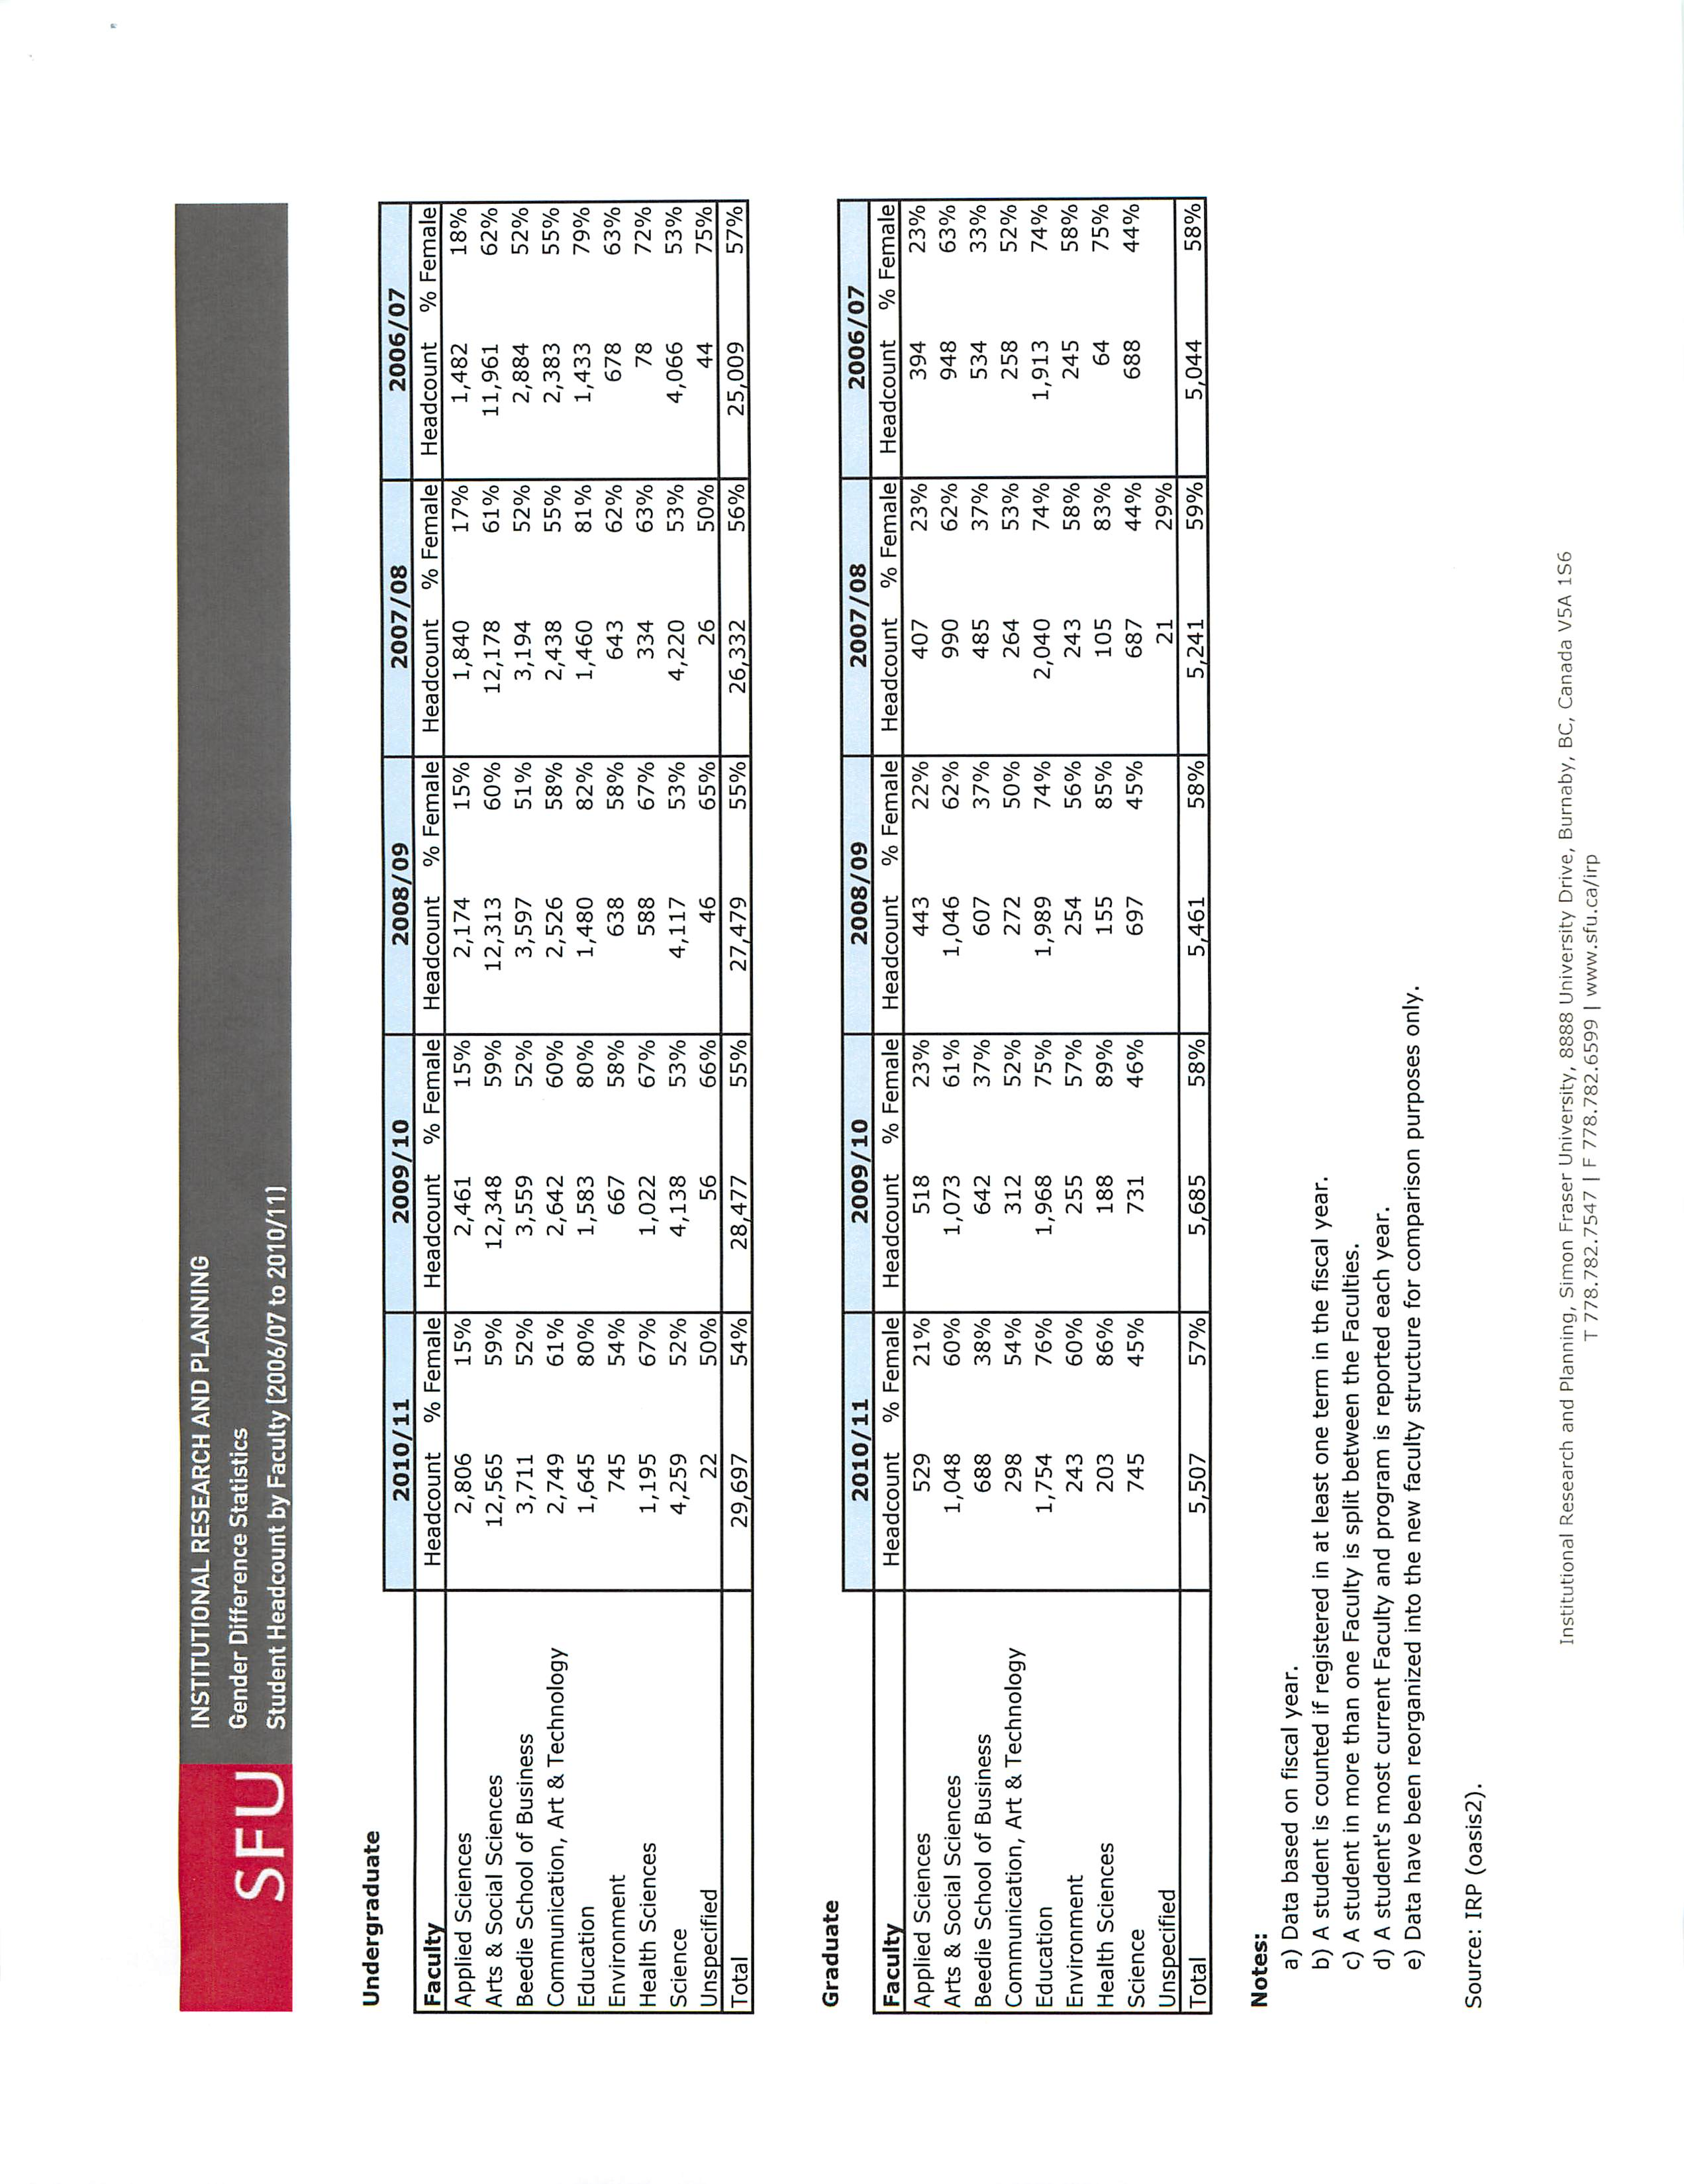
The third page breaks down headcounts of registered students by Faculty. As one would expect,
there are significant differences in the gender balance across Faculties. For undergraduate
programs, the lowest participation of women is in Applied Sciences (Computing and Engineering)
and the highest in Education; these two Faculties have been outliers for the past five years. For
the remaining Faculties, the results are fairly consistent through time, although there appears to be
a trend to fewer female students in Environment and more in FCAT, with the percentage of male
students ranging from the 30!s in Health Sciences to 48% in Science and Business. The only
Faculty with less than 50% women undergraduates is Applied Sciences.
Graduate enrollment patterns do not map exactly on to undergraduate patterns. For example,
Business graduate programs have more men than women, whereas in Health Sciences there are
higher percentages of female graduate students than undergraduates. Applied Sciences remains the
most male-dominated Faculty for graduate programs.
One should note that if all data were broken down by school, department or program, more
variation could be observed.
Given the overall figures, I am not particularly worried that the University as a whole is
unbalanced with regard to gender, and I recognize that there are broad societal factors that result
in phenomena such as the high proportion of men in engineering and the high proportion of
women intending to become teachers. Given that disciplinary differences exist, I would expect
Faculty deans to be involved in determining
whether action is warranted, and what action is
appropriate.
SFU
INSTITUTIONAL RESEARCH AND PUNNING
Gender Difference Statistics
Student Headcount by Faculty (2006/07 to 2010/11)
Undergraduate
2010/11
2009/10
2008/09
2007/08
2006/07
Faculty
Headcount % Female
Headcount % Female Headcount % Female
Headcount % Female
Headcount % Female
Applied Sciences
2,806
15%
2,461
15%
2,174
15%
1,840
17%
1,482
18%
Arts & Social Sciences
12,565
59%
12,348
59%
12,313
60%
12,178
61%
11,961
62%
Beedie School of Business
3,711
52%
3,559
52%
3,597
51%
3,194
52%
2,884
52%
Communication, Art & Technology
2,749
61%
2,642
60%
2,526
58%
2,438
55%
2,383
55%
Education
1,645
80%
1,583
80%
1,480
82%
1,460
81%
1,433
79%
Environment
745
54%
667
58%
638
58%
643
62%
678
63%
Health Sciences
1,195
67%
1,022
67%
588
67%
334
63%
78
72%
Science
4,259
52%
4,138
53%
4,117
53%
4,220
53%
4,066
53%
Unspecified
22
50%
56
66%
46
65%
26
50%
44
75%
Total
29,697
54%
28,477
55%
27,479
55%
26,332
56%
25,009
57%
Graduate
2010/11
2009/10
2008/09
2007/08
2006/07
Faculty
Headcount % Female
Headcount % Female
Headcount %
Female
Headcount % Female
Headcount %
Female
Applied Sciences
529
21%
518
23%
443
22%
407
23%
394
23%
Arts & Social Sciences
1,048
60%
1,073
61%
1,046
62%
990
62%
948
63%
Beedie School of Business
688
38%
642
37%
607
37%
485
37%
534
33%
Communication, Art & Technology
298
54%
312
52%
272
50%
264
53%
258
52%
Education
1,754
76%
1,968
75%
1,989
74%
2,040
74%
1,913
74%
Environment
243
60%
255
57%
254
56%
243
58%
245
58%
Health Sciences
203
86%
188
89%
155
85%
105
83%
64
75%
Science
745
45%
731
46%
697
45%
687
44%
688
44%
Unspecified
21
29%
Total
5,507
57%
5,685
58%
5,461
58%
5,241
59%
5,044
58%
Notes:
a) Data based on fiscal year.
b) A student is counted if registered in at least one term in the fiscal year.
c) A student in more than one Faculty is split between the Faculties.
d) A student's most current Faculty and program is reported each year.
e) Data have been reorganized into the new faculty structure for comparison purposes only.
Source: IRP (oasis2).
Institutional Research and Planning, Simon Fraser University, 8888 University Drive, Burnaby, BC, Canada V5A 1S6
T 778.782.7547 | F 778.782.6599 | www.sfu.ca/irp
SFU
INSTITUTIONAL RESEARCH AND PLANNING
Gender Difference Statistics
Applications, Admissions and New Registrations (2006/07 to 2010/11)
Undergraduate
2010/11
2009/10
2008/09
2007/08
2006/07
Headcount
% Female
Headcount
% Female
Headcount
% Female
Headcount
% Female
Headcount
% Female
Applicants
Admissions
Registered
24,299
53%
13,156
55%
7,447
54%
22,703
53%
13,311
56%
7,377
55%
21,486
53%
13,211
55%
7,397
55%
21,114
54%
13,049
56%
7,504
55%
20,785
54%
11,436
57%
6,382
57%
Graduate
2010/11
2009/10
2008/09
2007/08
2006/07
Headcount
% Female
Headcount
% Female
Headcount
% Female
Headcount
% Female
Headcount
% Female
Doctorate
Applicants
1,137
40%
1,080
41%
870
40%
795
43%
938
49%
Admissions
325
47%
359
46%
307
41%
256
43%
280
55%
Registered
249
47%
264
48%
247
45%
209
41%
255
51%
Masters
Applicants
3,960
52%
3,659
54%
3,206
56%
3,095
58%
2,992
55%
Admissions
1,374
57%
1,535
56%
1,351
55%
1,133
57%
1,017
55%
Registered
1,009
57%
1,047
57%
997
54%
876
57%
860
56%
Other
Applicants
609
64%
830
65%
717
62%
804
69%
752
66%
Admissions
499
66%
681
66%
567
61%
693
70%
683
66%
Registered
443
67%
596
70%
474
65%
598
71%
648
66%
Notes:
a) Data based on fiscal year.
b) Applicants refers to the number of students who applied to SFU. If a student applied for more than one program in a term, the student is
counted only once in the term. If a student applied for more than one term in a fiscal year, the student is counted once under each term.
c) Admissions refers to the number of students offered admission to SFU.
d)
Registered refers to the number of new students enrolled as of the end of week 3 of classes.
e) Other graduate programs includes graduate diplomas, exchange students, qualifying students and special students.
Source: Admissions data from Office of the Registrar. Registration data from IRP (oasis2 and graduate database).
Institutional Research and Planning, Simon Fraser University, 8888 University Drive, Burnaby, BC, Canada V5A 1S6
T 778.782.7547 | F 778.782.6599 | www.sfu.ca/irp
SFU
INSTITUTIONAL RESEARCH AND PLANNING
Gender Difference Statistics
Credentials Conferred (2006/07 to 2010/11)
Undergraduate
2010/11
2009/10
2008/09
2007/08
2006/07
Number
Awarded
% Female
Number
Awarded
% Female
Number
Awarded
% Female
Number
Awarded
% Female
Number
Awarded
% Female
Bachelors
Certificates
Post Baccalaureate Diplomas
4,472
59%
373
68%
77
82%
4,289
60%
365
73%
65
83%
4,441
60%
419
75%
50
78%
4,161
60%
432
71%
50
84%
4,310
62%
485
73%
72
88%
Total
4,922
60%
4,719
61%
4,910
61%
4,643
61%
4,867
64%
Graduate
2010/11
2009/10
2008/09
2007/08
2006/07
Number
Number
Number
Number
Number
Awarded
% Female
Awarded
% Female
Awarded
% Female
Awarded
% Female
Awarded
% Female
Masters
1,010
57%
932
58%
879
57%
662
59%
768
56%
Doctorates
130
42%
133
50%
131
42%
128
48%
104
54%
Graduate Certificates
3
67%
2
0%
2
100%
2
100%
Graduate Diplomas
147
66%
121
67%
133
66%
148
61%
147
68%
Total
1,290
56%
1,186
58%
1,145
56%
940
58%
1,021
57%
Notes:
a) Data based on the fiscal year in which the student completed the requirements for the credential
Source: IRP (credawrd2).
Institutional Research and Planning, Simon Fraser University, 8888 University Drive, Burnaby, BC, Canada V5A 1S6
T 778.782.7547 | F 778.782.6599 | www.sfu.ca/irp