SFU
MEMORANDUM
S.11-82
OFFICE OF THE VICE-PRESIDENT, ACADEMIC AND PROVOST
IUniversity Drive, Burnaby, BC
TEL: 778.782.3925
vpacad@sfu.ca
Canada V5A1S6
www.sfu.ca/vpacademic
attention
Senate
date
May 26,2011
from
Jon Driver, Vice-President, Academic and
pages
1/4
\ Mk^
C
Provost
„
\o^
Response to Senator Black's Question
RE
I am responding to a question asked by Senator Sam Black in April. As his question is important, detailed
and complex, I will first reproduce the question and then provide some responses.
Senator Black's question
Background:
The March 6th "Student Issue" of Maclean's magazine published data regarding responses to student
satisfaction questions collected by the NSSE (National Survey of Student Engagement) and CUSC
(Canadian University Survey Consortium). The latter survey polled 1,000 first year SFU students and had
a 70% return rate. That was significantly higher than the national average among the other 38 institutions
polled. The Administration is commended for electing to participate in these national surveys.
Our relative rank among Canadian institutions seems consistently very low for all four questions relating to
student satisfaction. The comparison class includes many smaller schools. But in the CUSC survey, our
students also grade us significantly worse than do students from larger institutions such as McGill,
Dalhousie, and Montreal. We also score lower than cross-Province rival Victoria.
I have not been able to obtain access to the CUSC data using the internet, however, Maclean's
describes the first year student responses to two questions as follows:
1) "Generally, I am satisfied with the quality of teaching I have received."
Among 39 schools SFU scores LAST nationally for students who "strongly agree" with that
statement. (Calgary declined to release their information.)
2) "I am satisfied with my decision to attend this university."
Among 39 schools SFU scores SECOND TO LAST nationally for students who "strongly agree"
with that statement. (Calgary declined to release their information.)
The relative rankings for the small schools collected in the NSSE survey follow a similar pattern for their
student
satisfaction questions. SFU is below average and below all of its local competitors (except
Capilano). Here again, I've not been able to obtain direct access to the data.
SIMON FRASER UNIVERSITY
thinking of the world
Questions:
1) Does the Administration believe these results present cause for concern? What is their cause? Is the
Administration alarmed by the lack
of enthusiasm for the quality of teaching at SFU, as expressed
by first year students, relative to our competitors?
2) What concrete steps are being taken to address the apparent causes of student discontent?
3) Several years ago the non-completion rate at SFU stood at 40%. What is the current non-
graduation rate?
VPA Response
We need to be careful about how we use the results of survey questions that askfor student opinions of
their experiences, as opposed to questions that track student experiences and outcomes on a more
empirical basis. To illustrate my point, I have attached a document (compiled by Institutional Research
and Planning) that provides some
examples of survey results that are more positive than those cited by
Senator Black. I do not want to suggest that we don't have anyproblems, but I do want to point out that
our students report satisfaction and positive outcomes on a range of other survey instruments. I also note
that the Maclean's report is based on a subset of survey questions that do not reflect the full range of
student responses.
I should also point out that the CUSC survey asks whether students "strongly agree" and "agree" with
certain statements, and whether they are "very satisfied" or "satisfied" with their experience. Senator
Black reports SFU's ranking on the basis of the percentage of students who "strongly agree" that they are
satisfied with the quality of teaching; however, if we add the responses of students who "agree", SFU's
percentage rises to 93, ranking us tied for 9th place, behind smaller undergraduate-focused universities, and
ahead of other large universities such as Ottawa, Calgary, UBC, Saskatchewan, Manitoba, Alberta,
Victoria, Carleton, McGill and Montreal. Similarly, if we combine students who are "very satisfied" and
"satisfied" with their decision to attend SFU, the percentage rises to 91, again ranking us tied 9th behind
smaller undergraduate-focused universities (with the exception of Victoria who arejust ahead of us), and
ahead of Calgary, Ottawa, Saskatchewan, Alberta, Montreal, and UBC.
However, I also want to recommend that we do not engage too seriously in the widespread practice of
ranking institutions based on survey results. One of the most respected student survey organizations
(NSSE) specifically cautions against this practice, and advises institutions that their survey data can be used
most effectivelyby measuring trends through time at a single institution.
It is important that we examine negative survey results carefully, but we must also try to understand the
context of the results, and ensure that as we respond we are not simply trying to get good survey scores but
are also meeting our own goals of providing a high quality education.
One of the
reasons that we decided to participatein NSSE is that it asks questions about student
experiences that are generally thought to be positively correlated with a high quality post-secondary
education (so called "high impact" practices), rather than solely asking about student opinion of their
experiences. For example, instead of simply asking "are you satisfied with the quality of instruction" the
NSSE survey also asks about the instructional activities in which a student has participated (e.g. writing
papers, analyzing data, making presentations etc.), thus providing a better empirical basis for assessing
whether the institution provides a good quality education. NSSE is also a useful survey because it
combines student responses into a series of "benchmarks" (e.g. "level of academic challenge" or "student-
faculty interaction") that provide a summary of how well an institution serves its students.
Question One
I agree with Senator Black that the survey results he reports, and others, should cause us concern, even if,
as argued above,
our ranking is perhaps not aspoor as he suggests. However, it is very difficult to respond
to the second part
of his question and assess the cause of dissatisfaction reported by first year students.
Although quality of teaching could be a contributing factor to student dissatisfaction, some other factors
that relate to student dissatisfaction during first year might include:
•
SFU has a high proportion of EAL students who may find university level work and university
teaching styles especially challenging, particularly in their first year;
• General dissatisfaction with the commuter campus environment;
• High degree of flexibility in curriculum at SFU may result in a less clear academic structure;
trimester system means a less structured school year;
• W and Q courses may be seen asmore difficult;
•
Difficulty in transition from high school to first year in combination with high grading standards;
• Large first year class size relative to colleges or as compared to the high school environment;
• Less sense of connection to one Faculty or departmental "home" when first admitted to the
university;
•
The significant proportion of students who hold part-time jobs and consequendy have difficulties
managing their schedules in an environment where course availability is an issue.
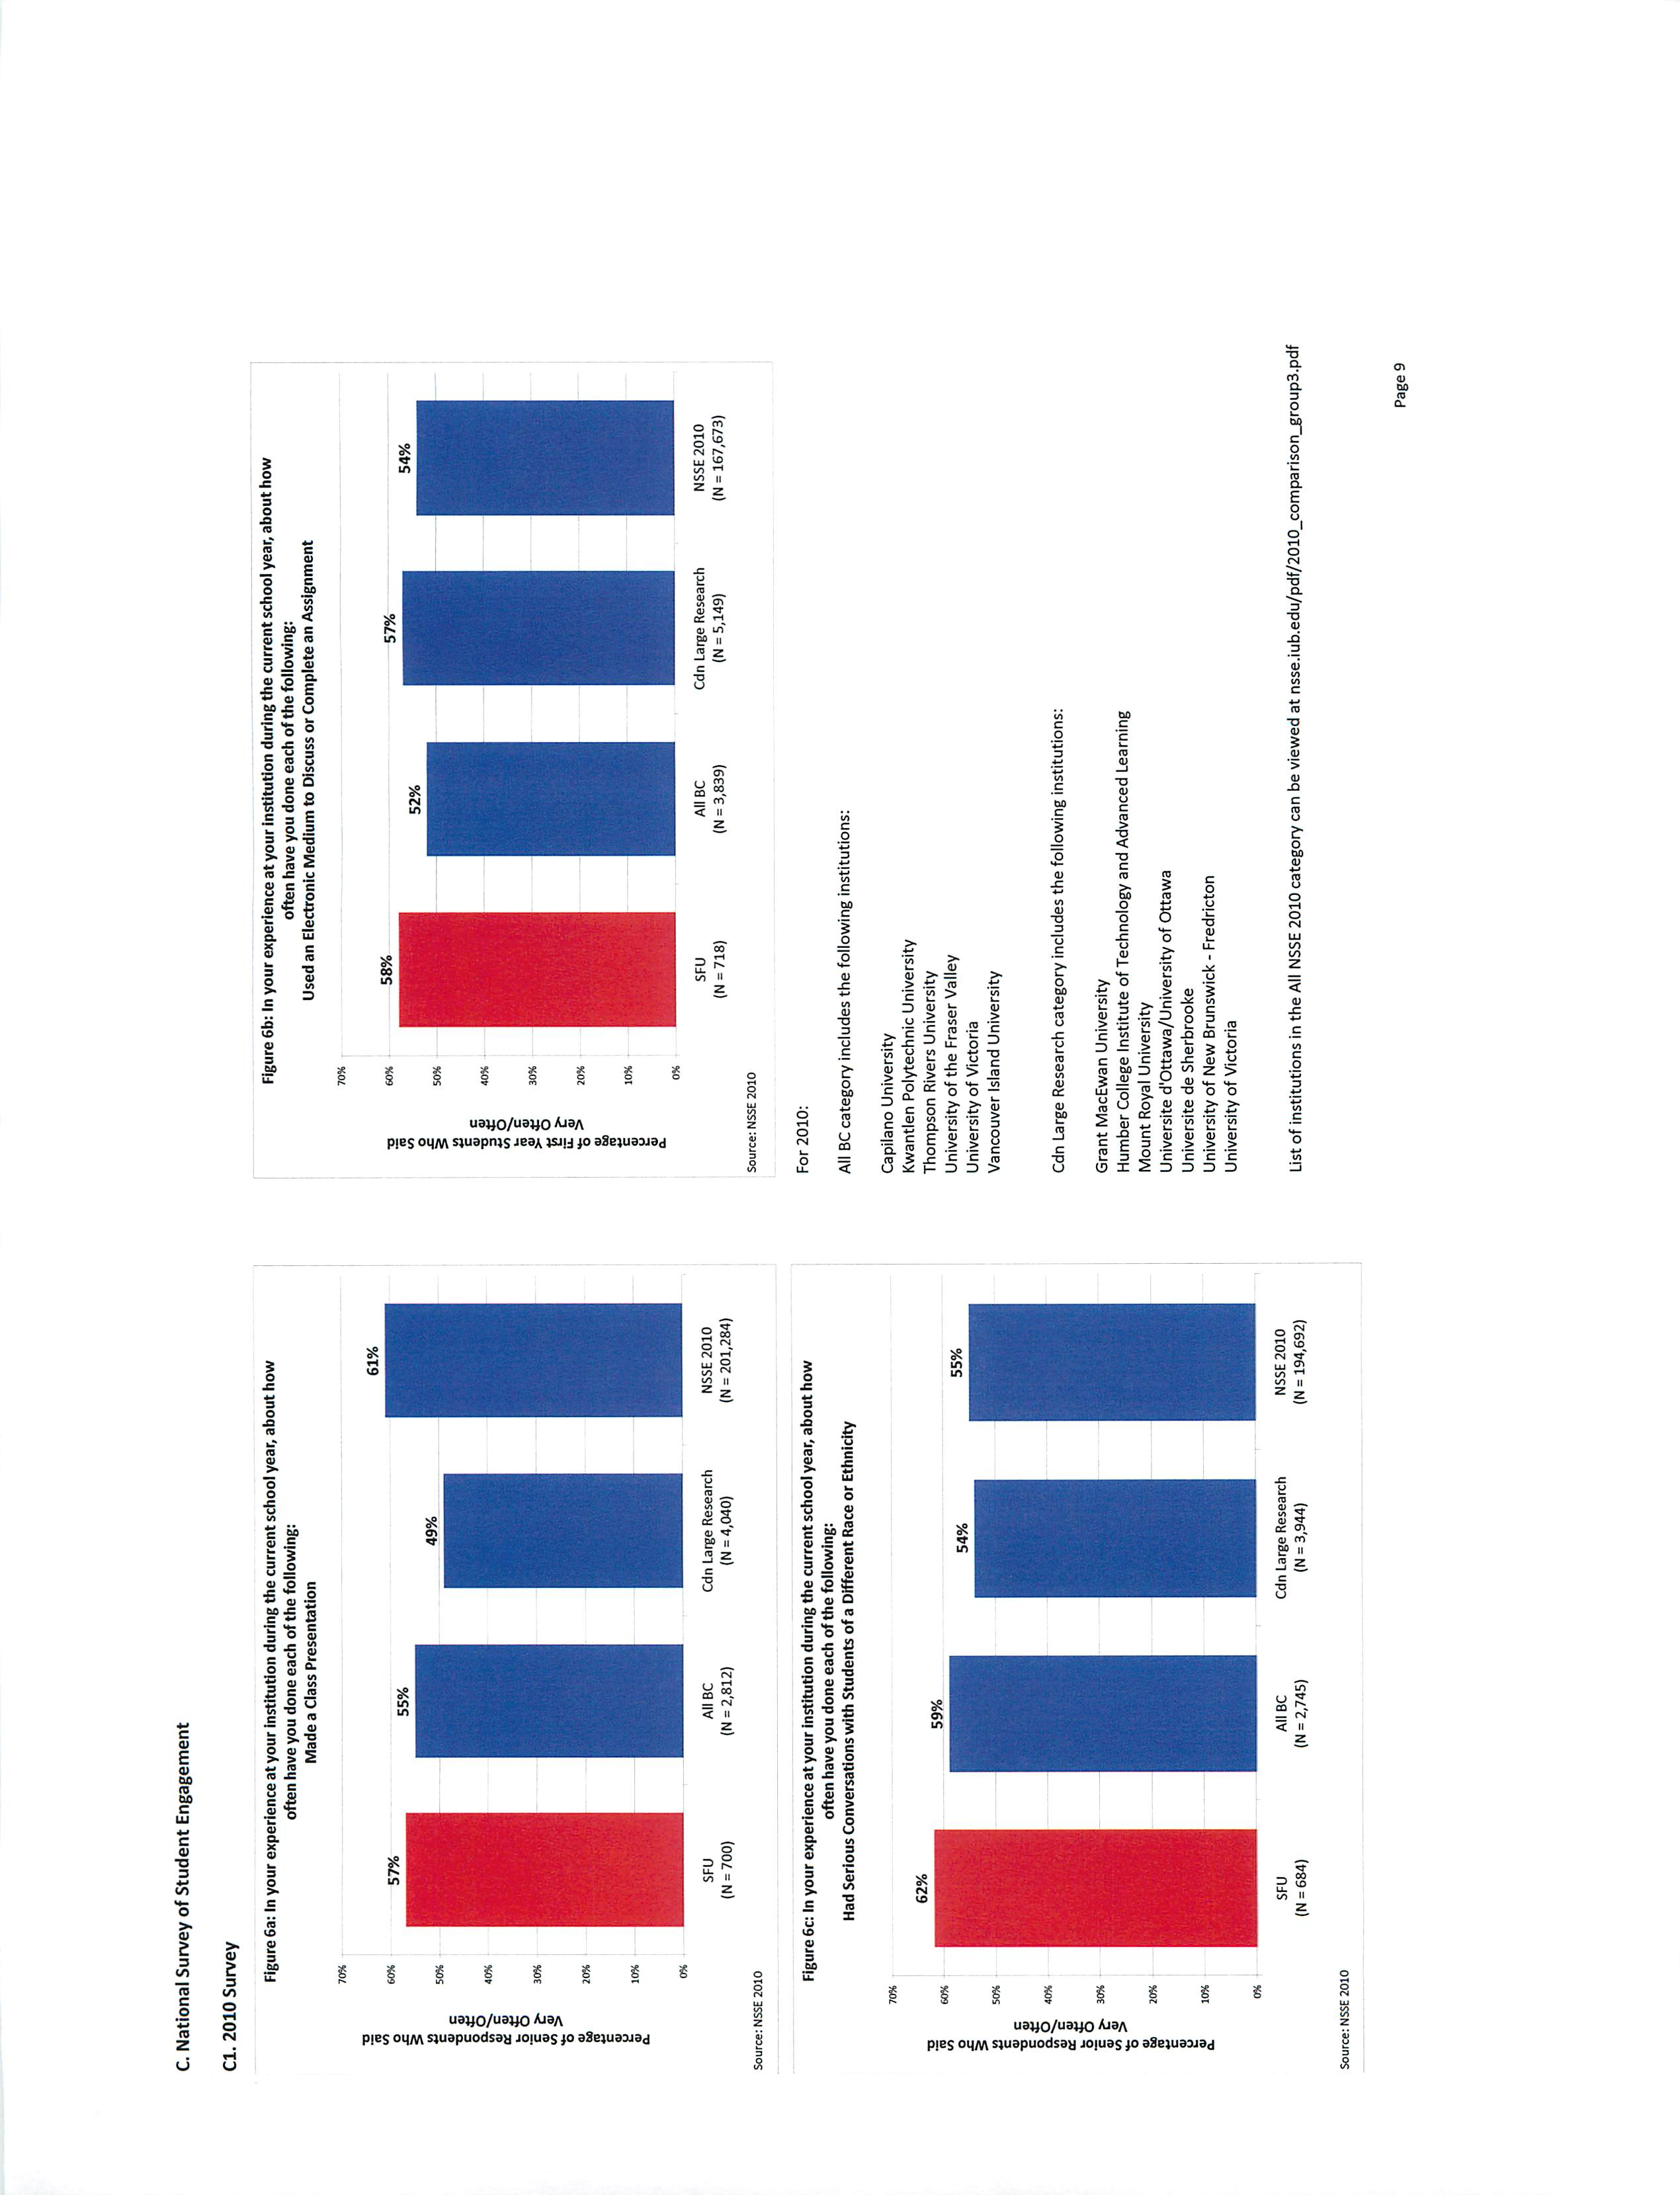
I am more concerned by NSSE data, which mainly report student experiences. Our recent NSSE results
show that we do not excel in any of the five benchmark areas, and we do slighdyworse in some areas than
comparator institutions in BC or in the entire NSSE population. For example, first year students at SFU
reportedlower rates of feedback from faculty members and less writing activity than at other universities in
the BC comparison group. As noted above, NSSE would urge us to be cautious in interpreting these
results. For example, in the NSSE surveystudents are asked how many papers they wrote during the year,
but SFU students typically take lower course loads (approximately 10 credits per semester) than at other
universities; thus, the number of papers written at SFU may be lower even if the percentage of courses
requiring a paper is consistent across institutions. In spite of these cautions, I do think we need to pay
more attention to the first year experiences of our students, especially as the overall level of satisfaction
expressed by SFU students after graduation is high, and seems consistent with results from other BC
universities (see attachment 1).
Question Two
If some students express dissatisfaction with first year courses, and if the NSSE data tend to support this
opinion through a more empirical analysis, then we should be lookingat a number of options, including
better support for instructors, better support for students, and some changes to curriculum.
With regard to instruction, we have taken the following steps:
1. Restructuring and repurposing of the Teaching and Learning Centre, following recommendations
from the Task Force on Teaching and Learning. The TLC produces regular bulletins for
instructors, and is currendy hiring staffto provide closer coordination between the needs
of
individual Faculties and the services offered by the TLC. The TLC continues to provide
numerous workshops on many aspects of teaching and learning.
2. Increased funding for the International
TA program.
3. Re-thinking instructor and course evaluations. As approved by Senate in May 2011, SCUTL will
lead a project to develop more effective evaluations of courses and instructors. This should result
in better understanding of what teaching methods are most effective.
4. Developed a fund to support investigation by faculty members of innovative teaching and learning
practices, in order to diversify teaching methods at SFU.
3
We have already upgraded support for students significandythrough a number of initiatives in recent years,
including:
1. Development
of Student Central and Arts Central
2. Implementation of the Student Success program
3.
Development of Student Learning Commons
4. Development of Degree Progress Report
5. Implementation of FAL and FAN courses
6. Increased retention programming for international and aboriginal students
7. Increases to student services generally through use
of over-enrollment tuition
With regard to curriculum:
1. Some first year cohort programs already exist, and others are being developed.
2. New curriculum management software will allow information on learning outcomes to be
incorporated in information for students, thus clarifyingpurpose
of course and program.
3. Beginning in fall 2011, we will work on clearer definitions of learning outcomes for all programs
and courses, and processes that better support evaluation for improvement of programs and
curricula. Some academic units (e.g. Beedie School
of Business and School of Engineering
Science) are already developing more formal learning outcome measures because of discipline
accreditation requirements.
Question three
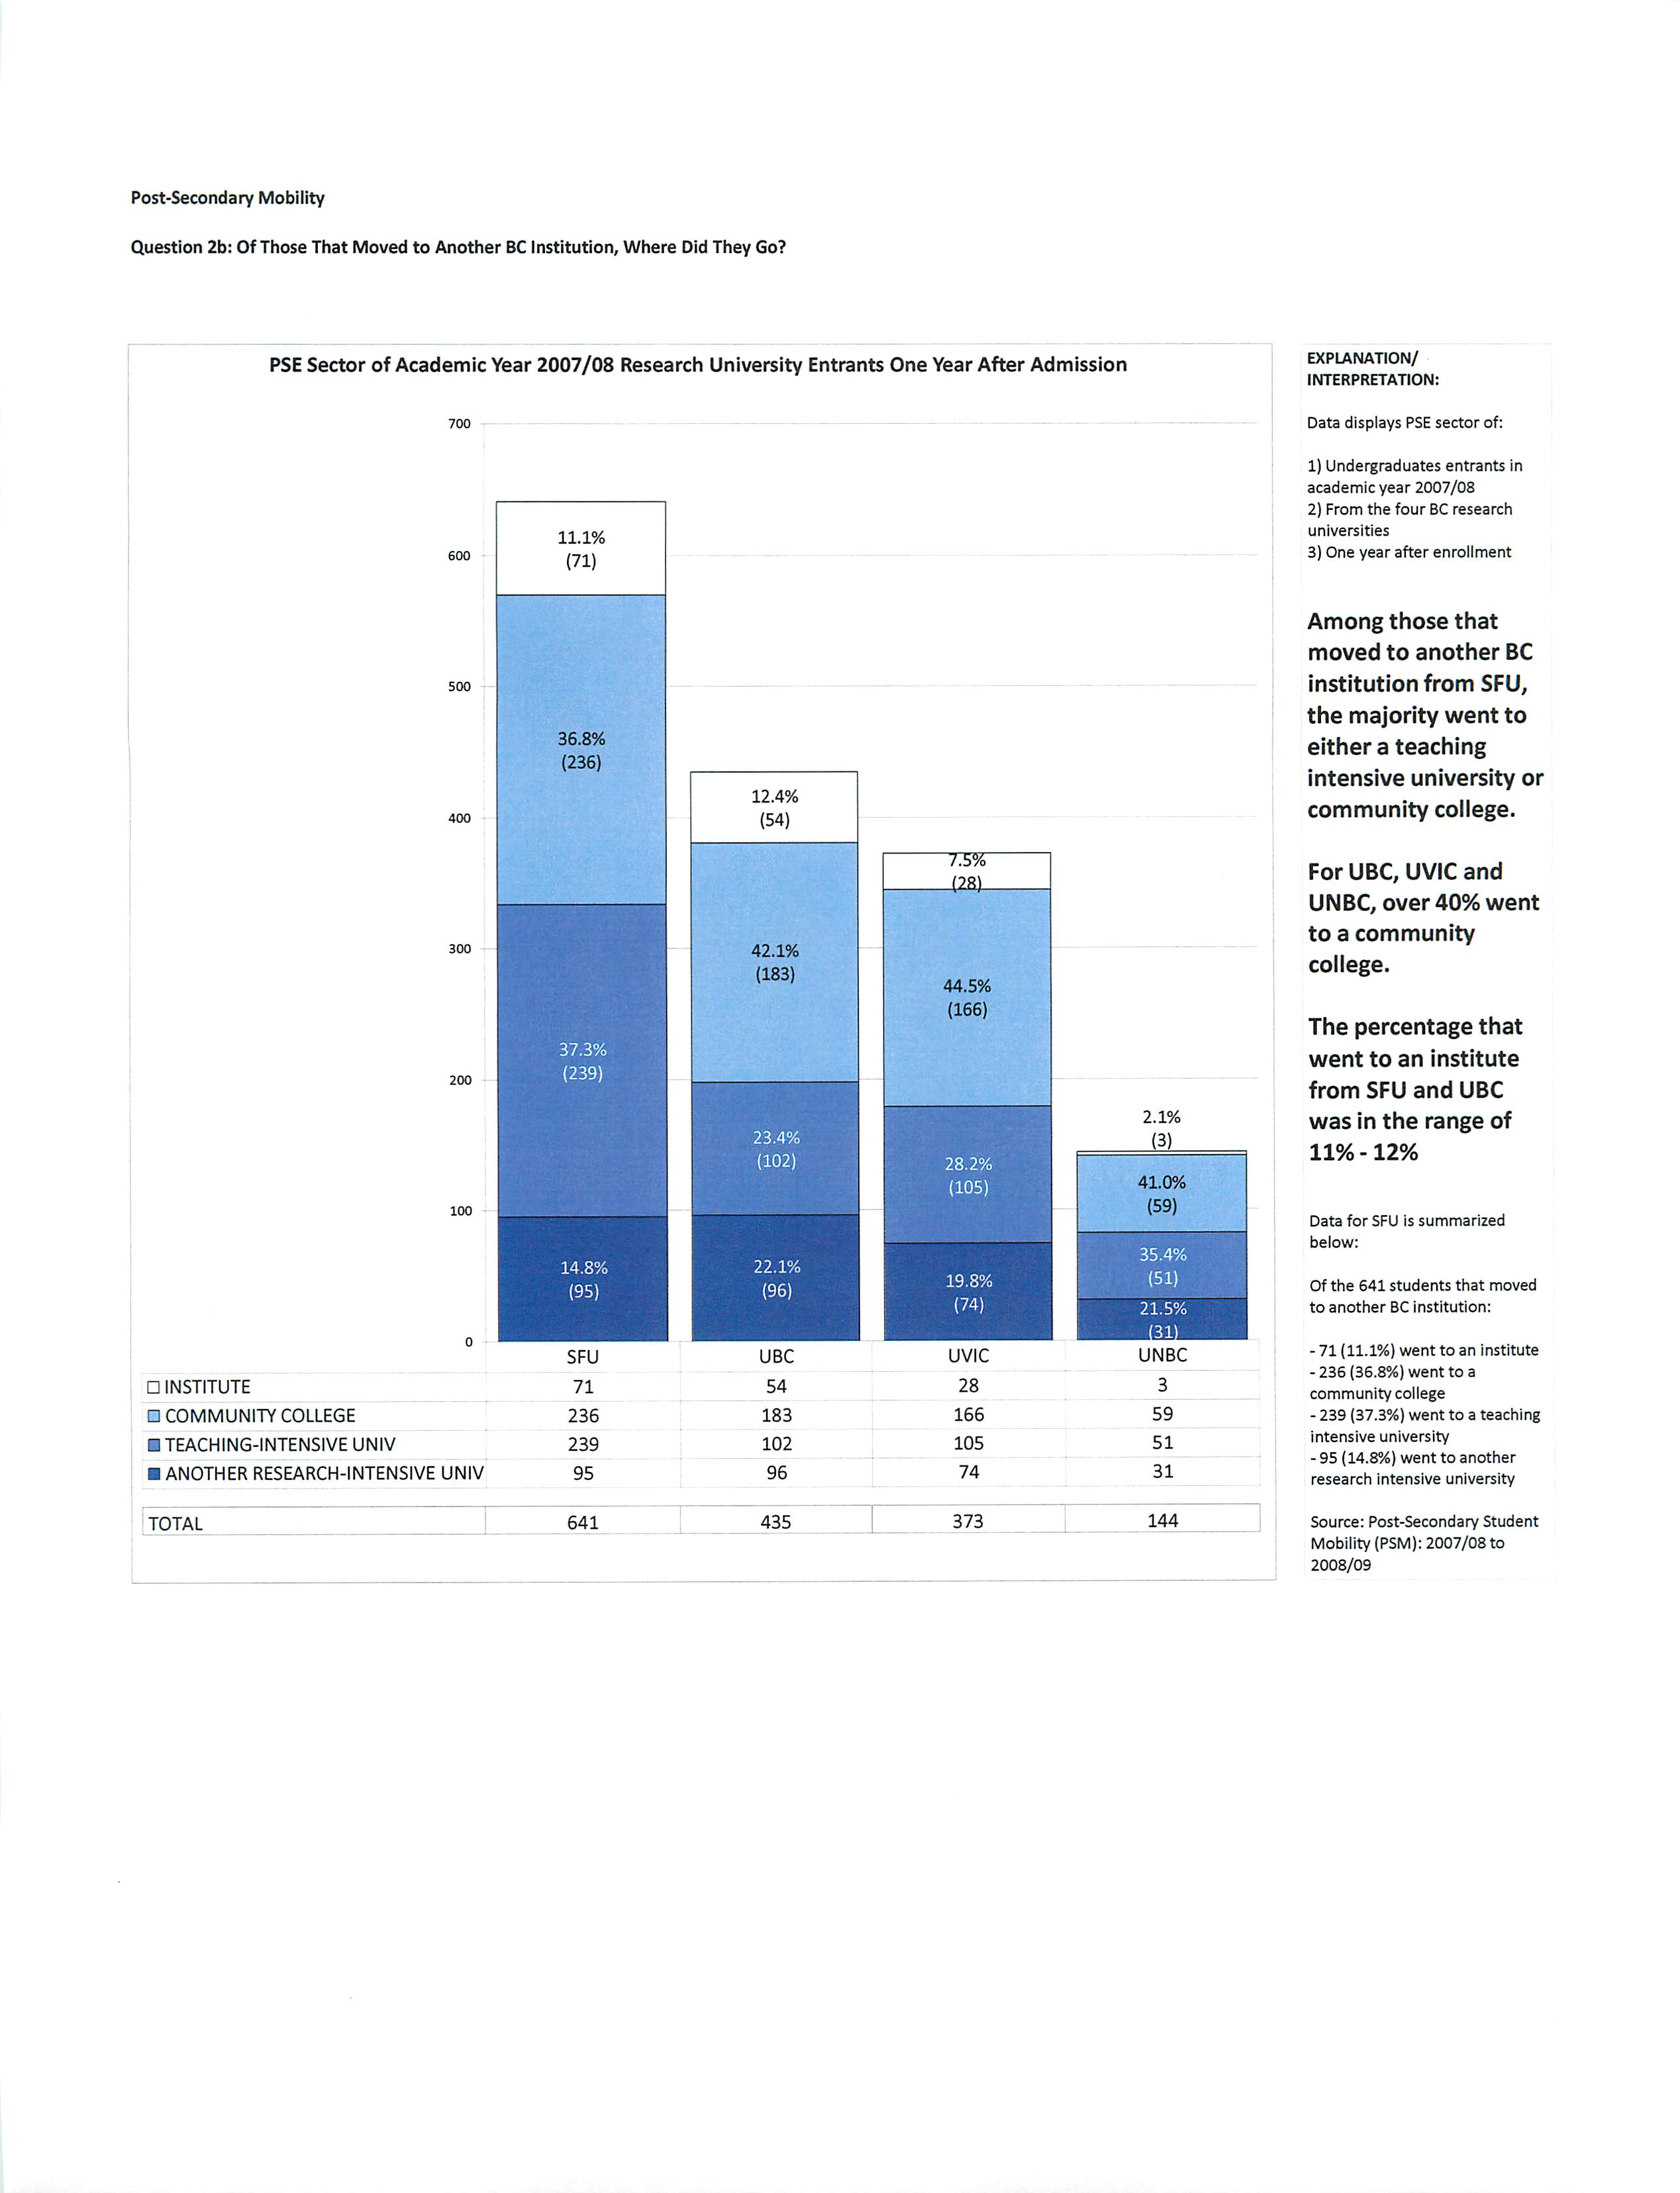
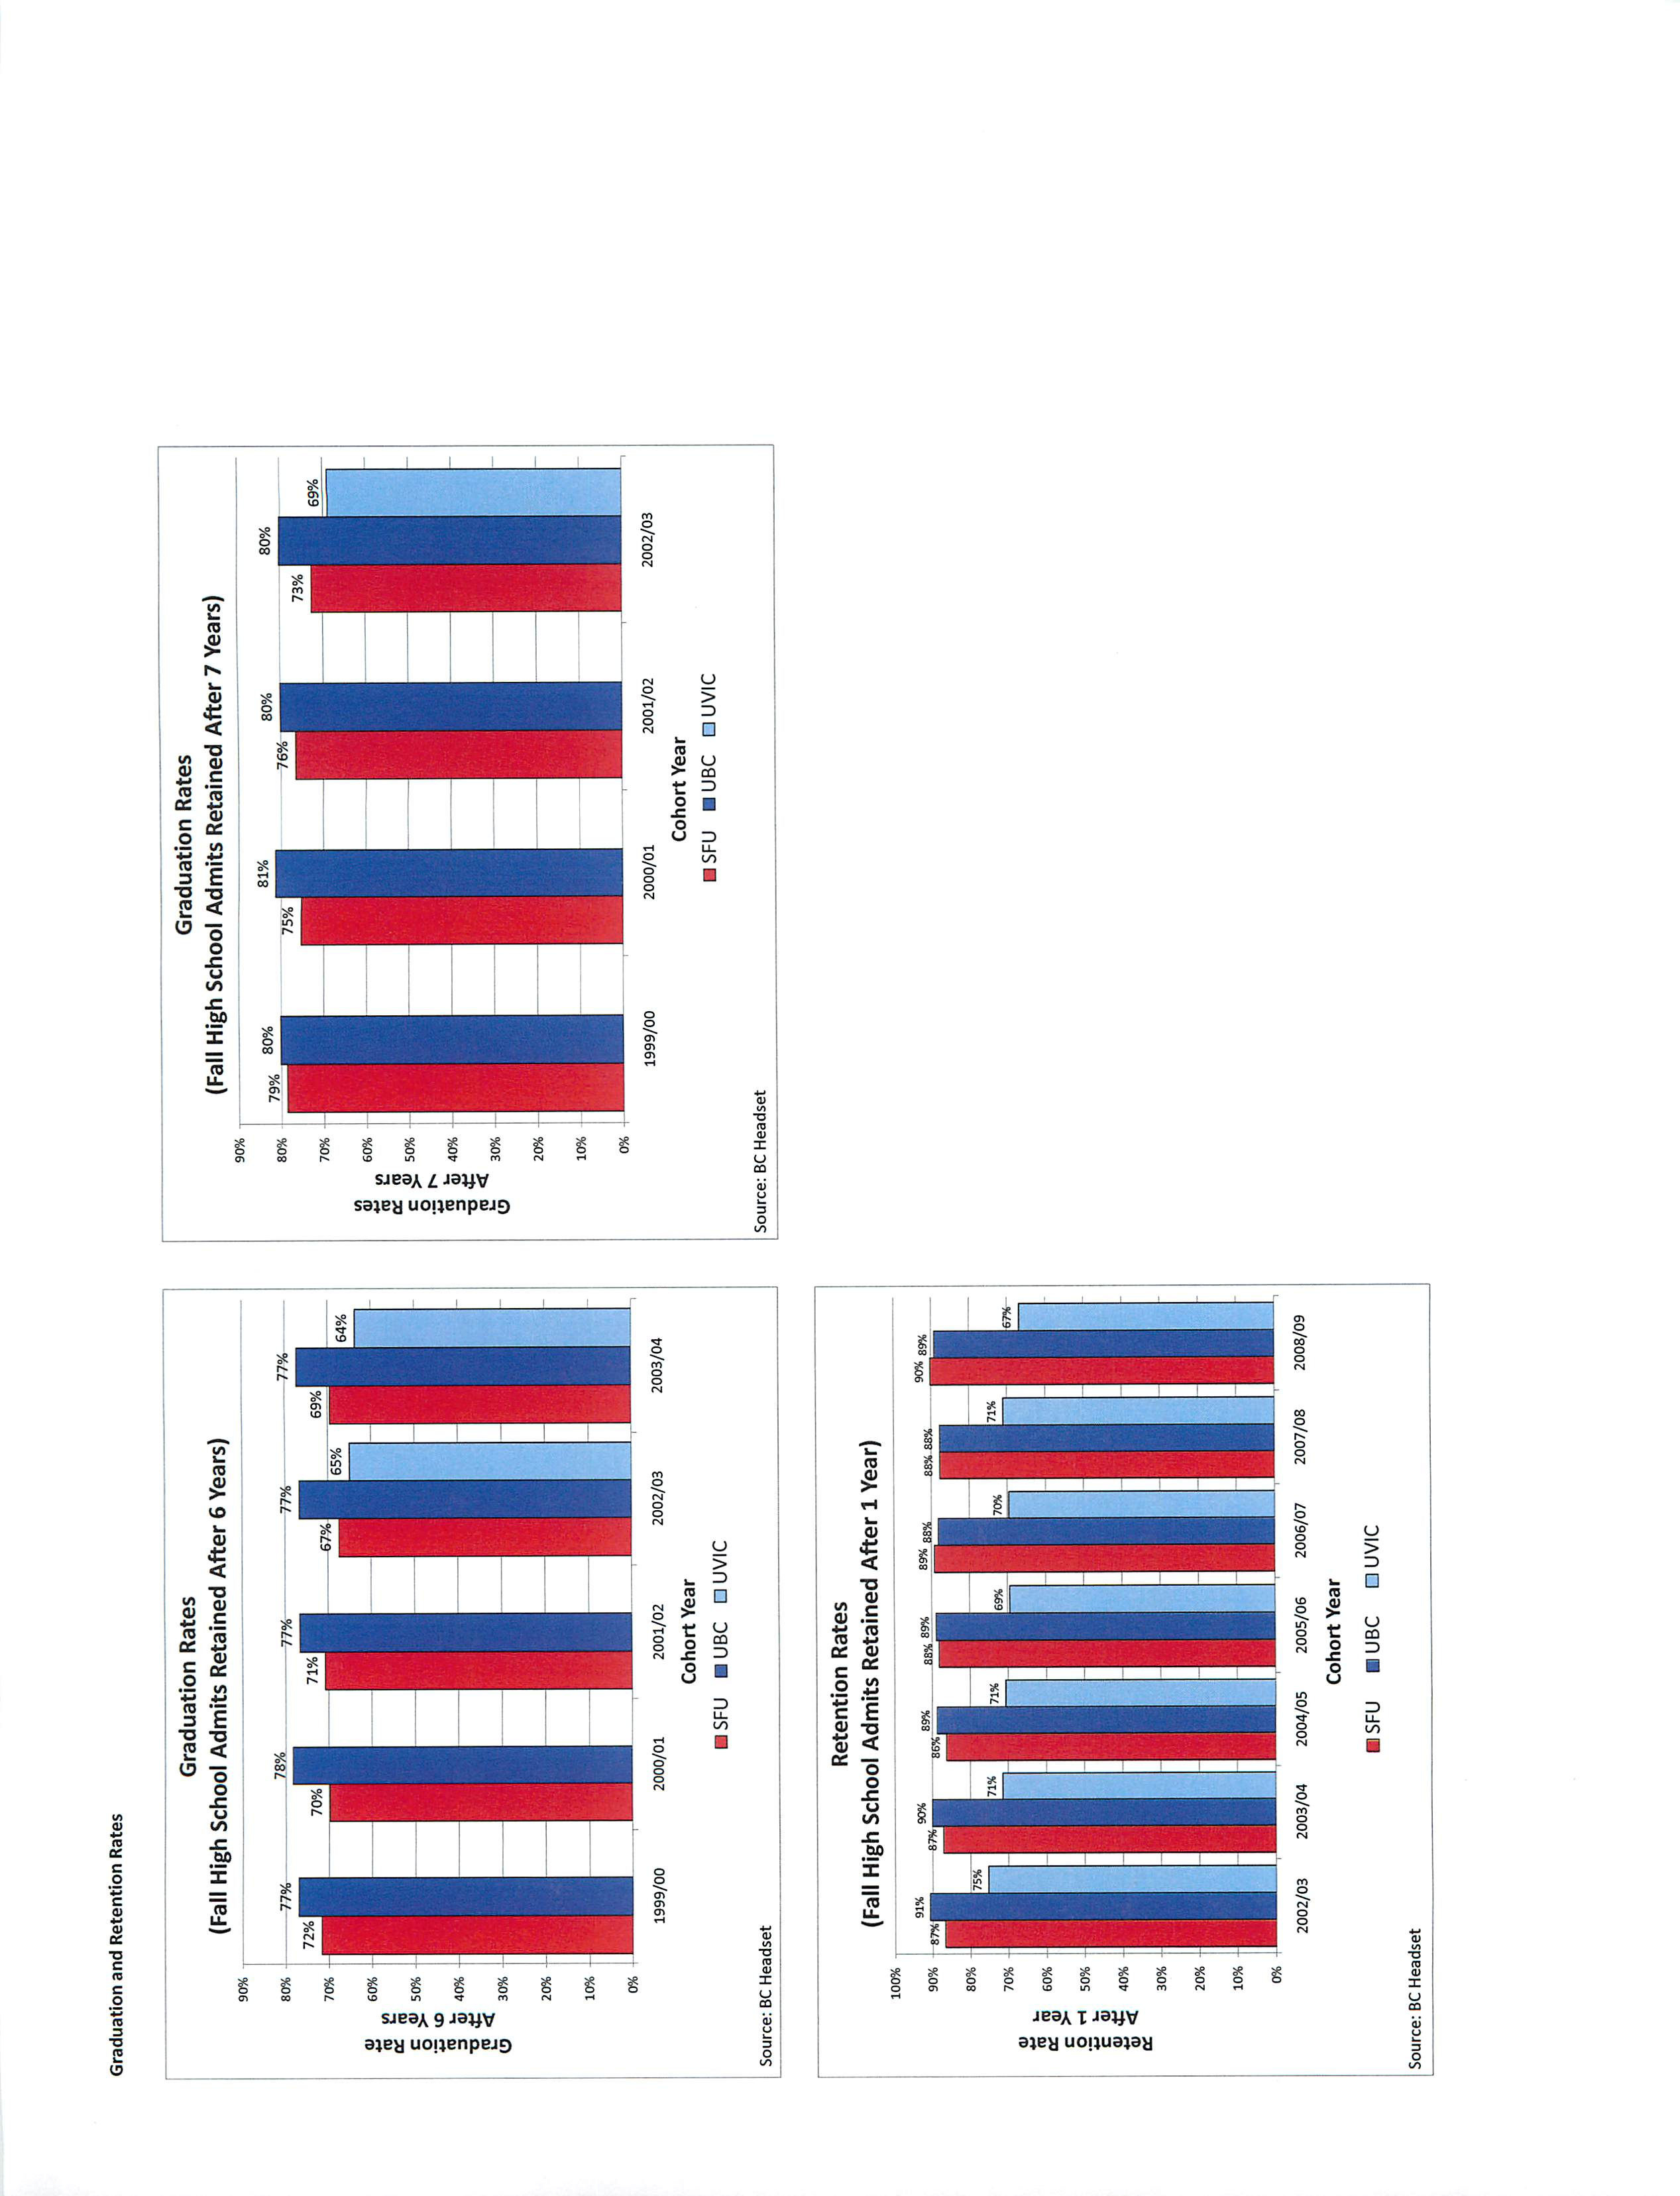
In British Columbia, the graduation rate for a particular institution is compHcated by the fact that BC has a
highly integrated post-secondary system that allows easy transfer between institutions. We therefore
should ask what proportion of students admitted to SFU complete an SFU degree, what proportion
complete a degree or other credential elsewhere, and what proportion never complete. Comparative data
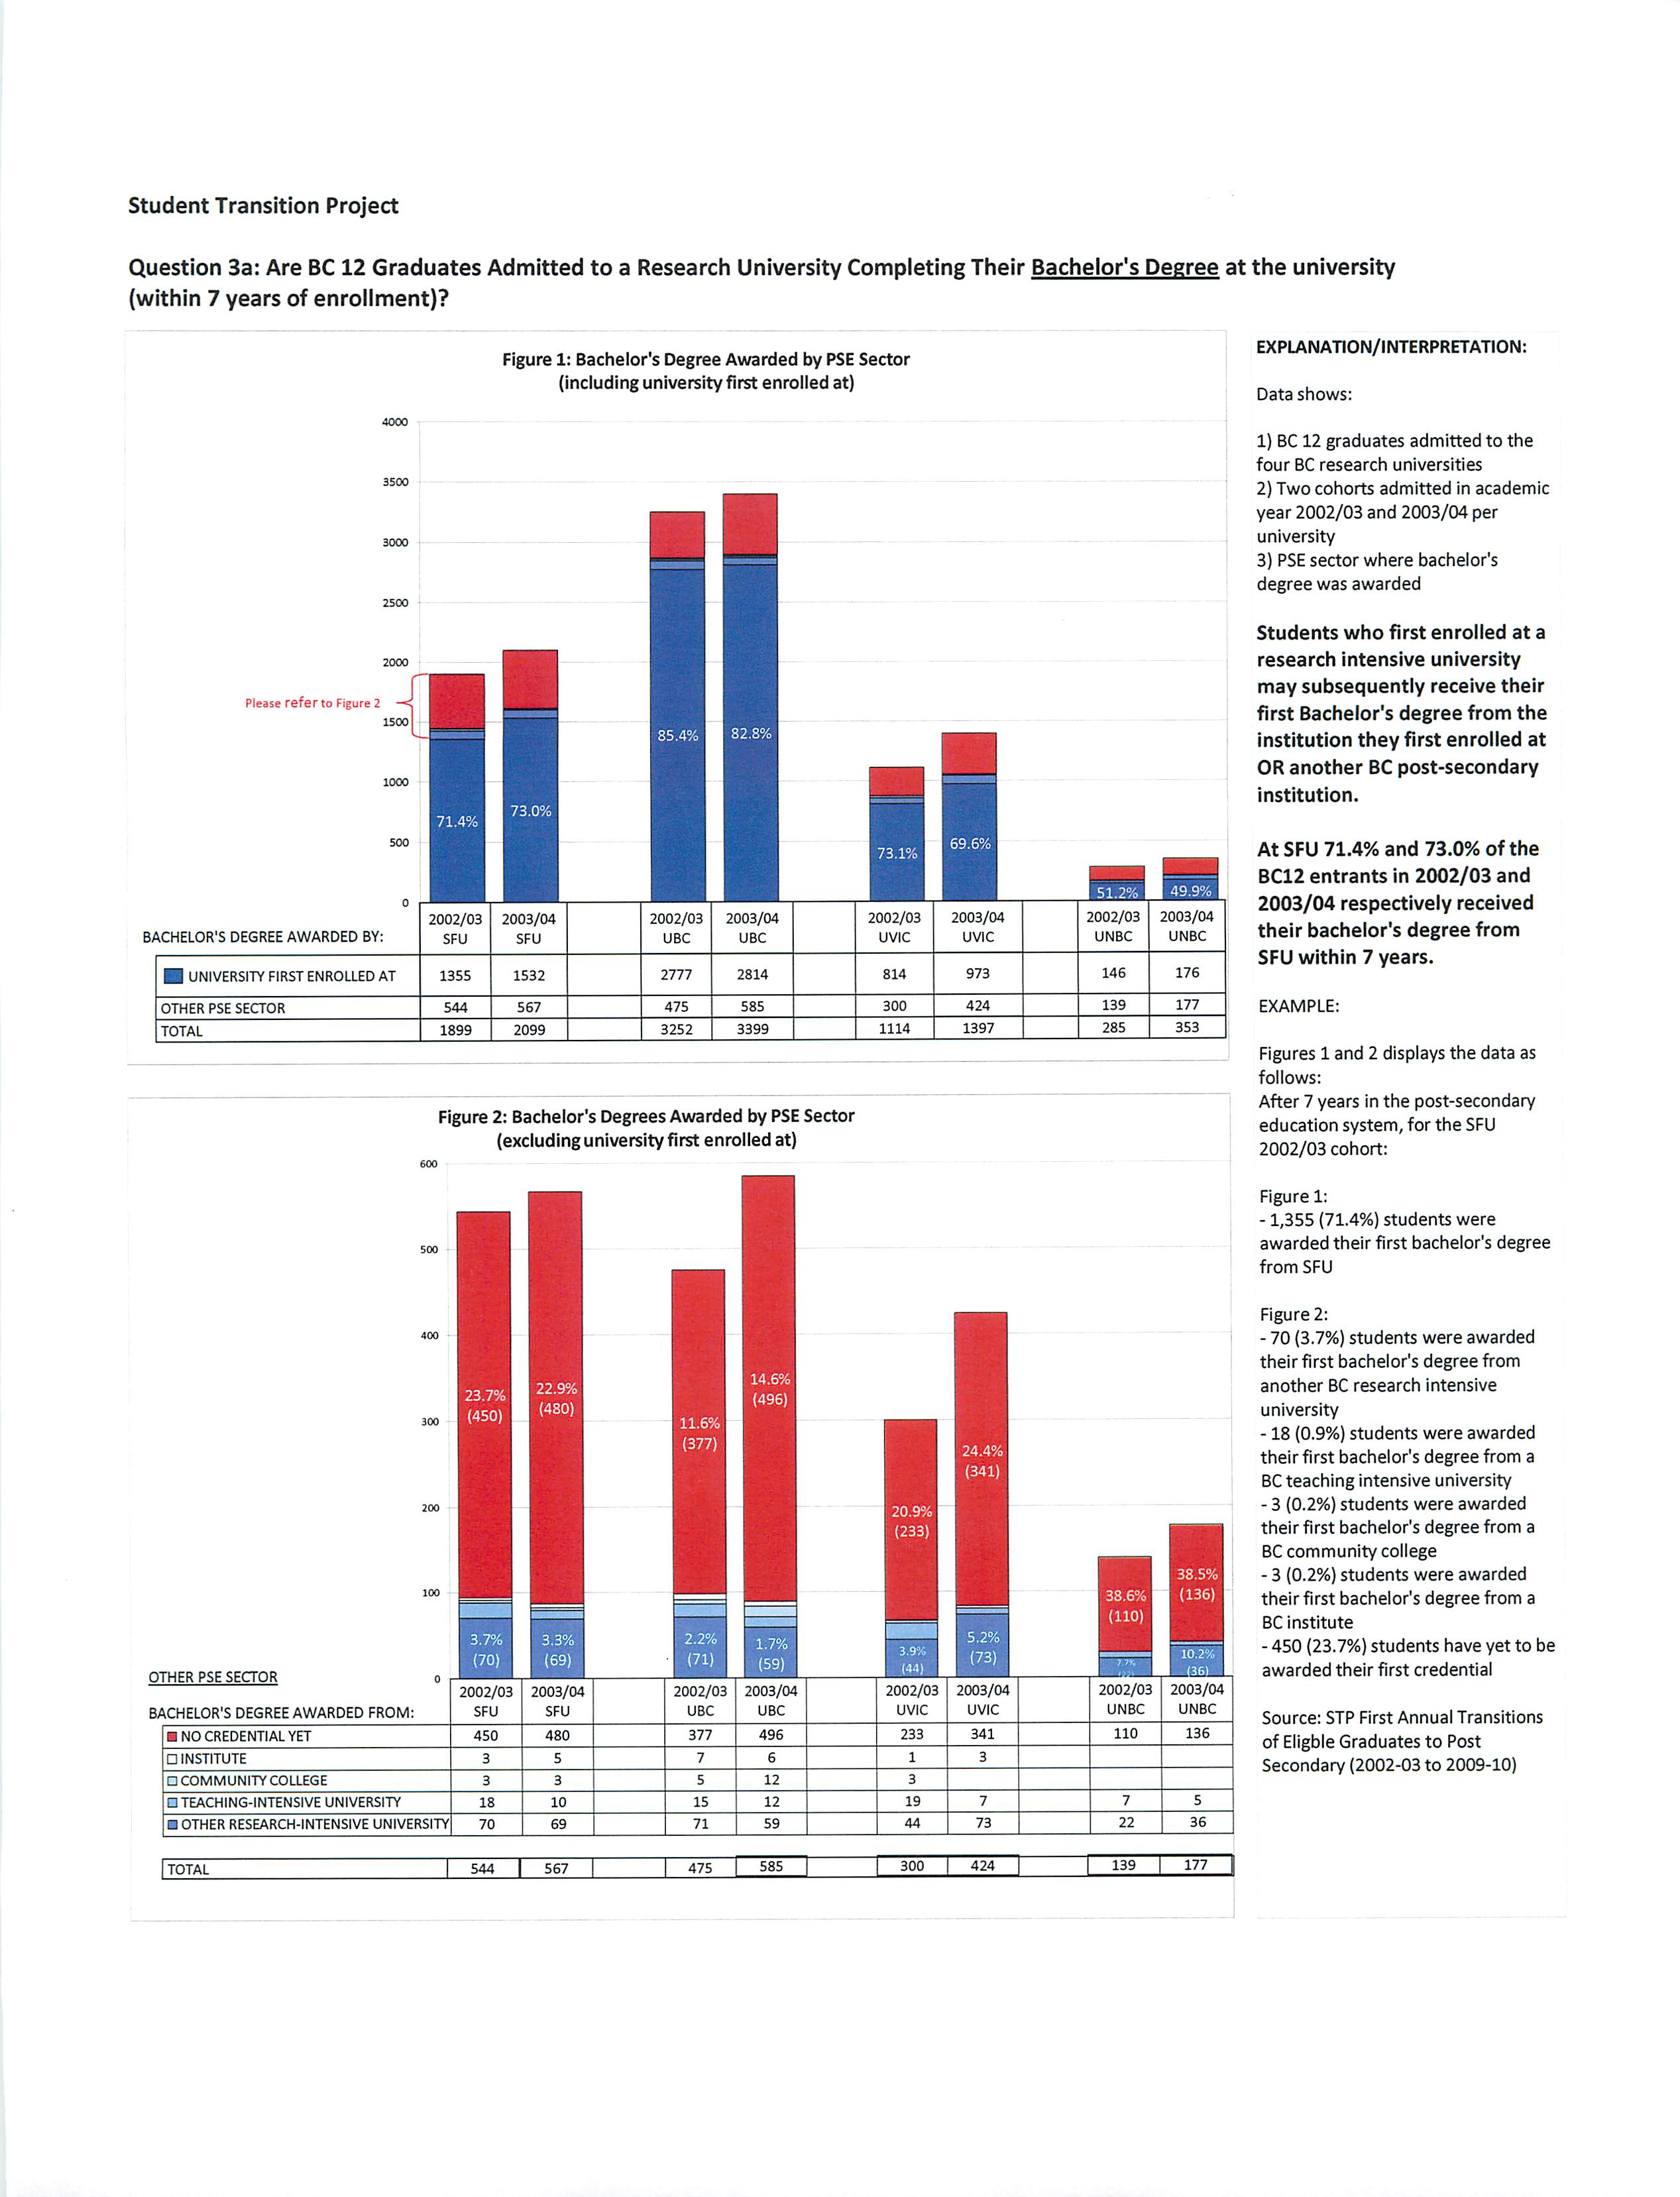
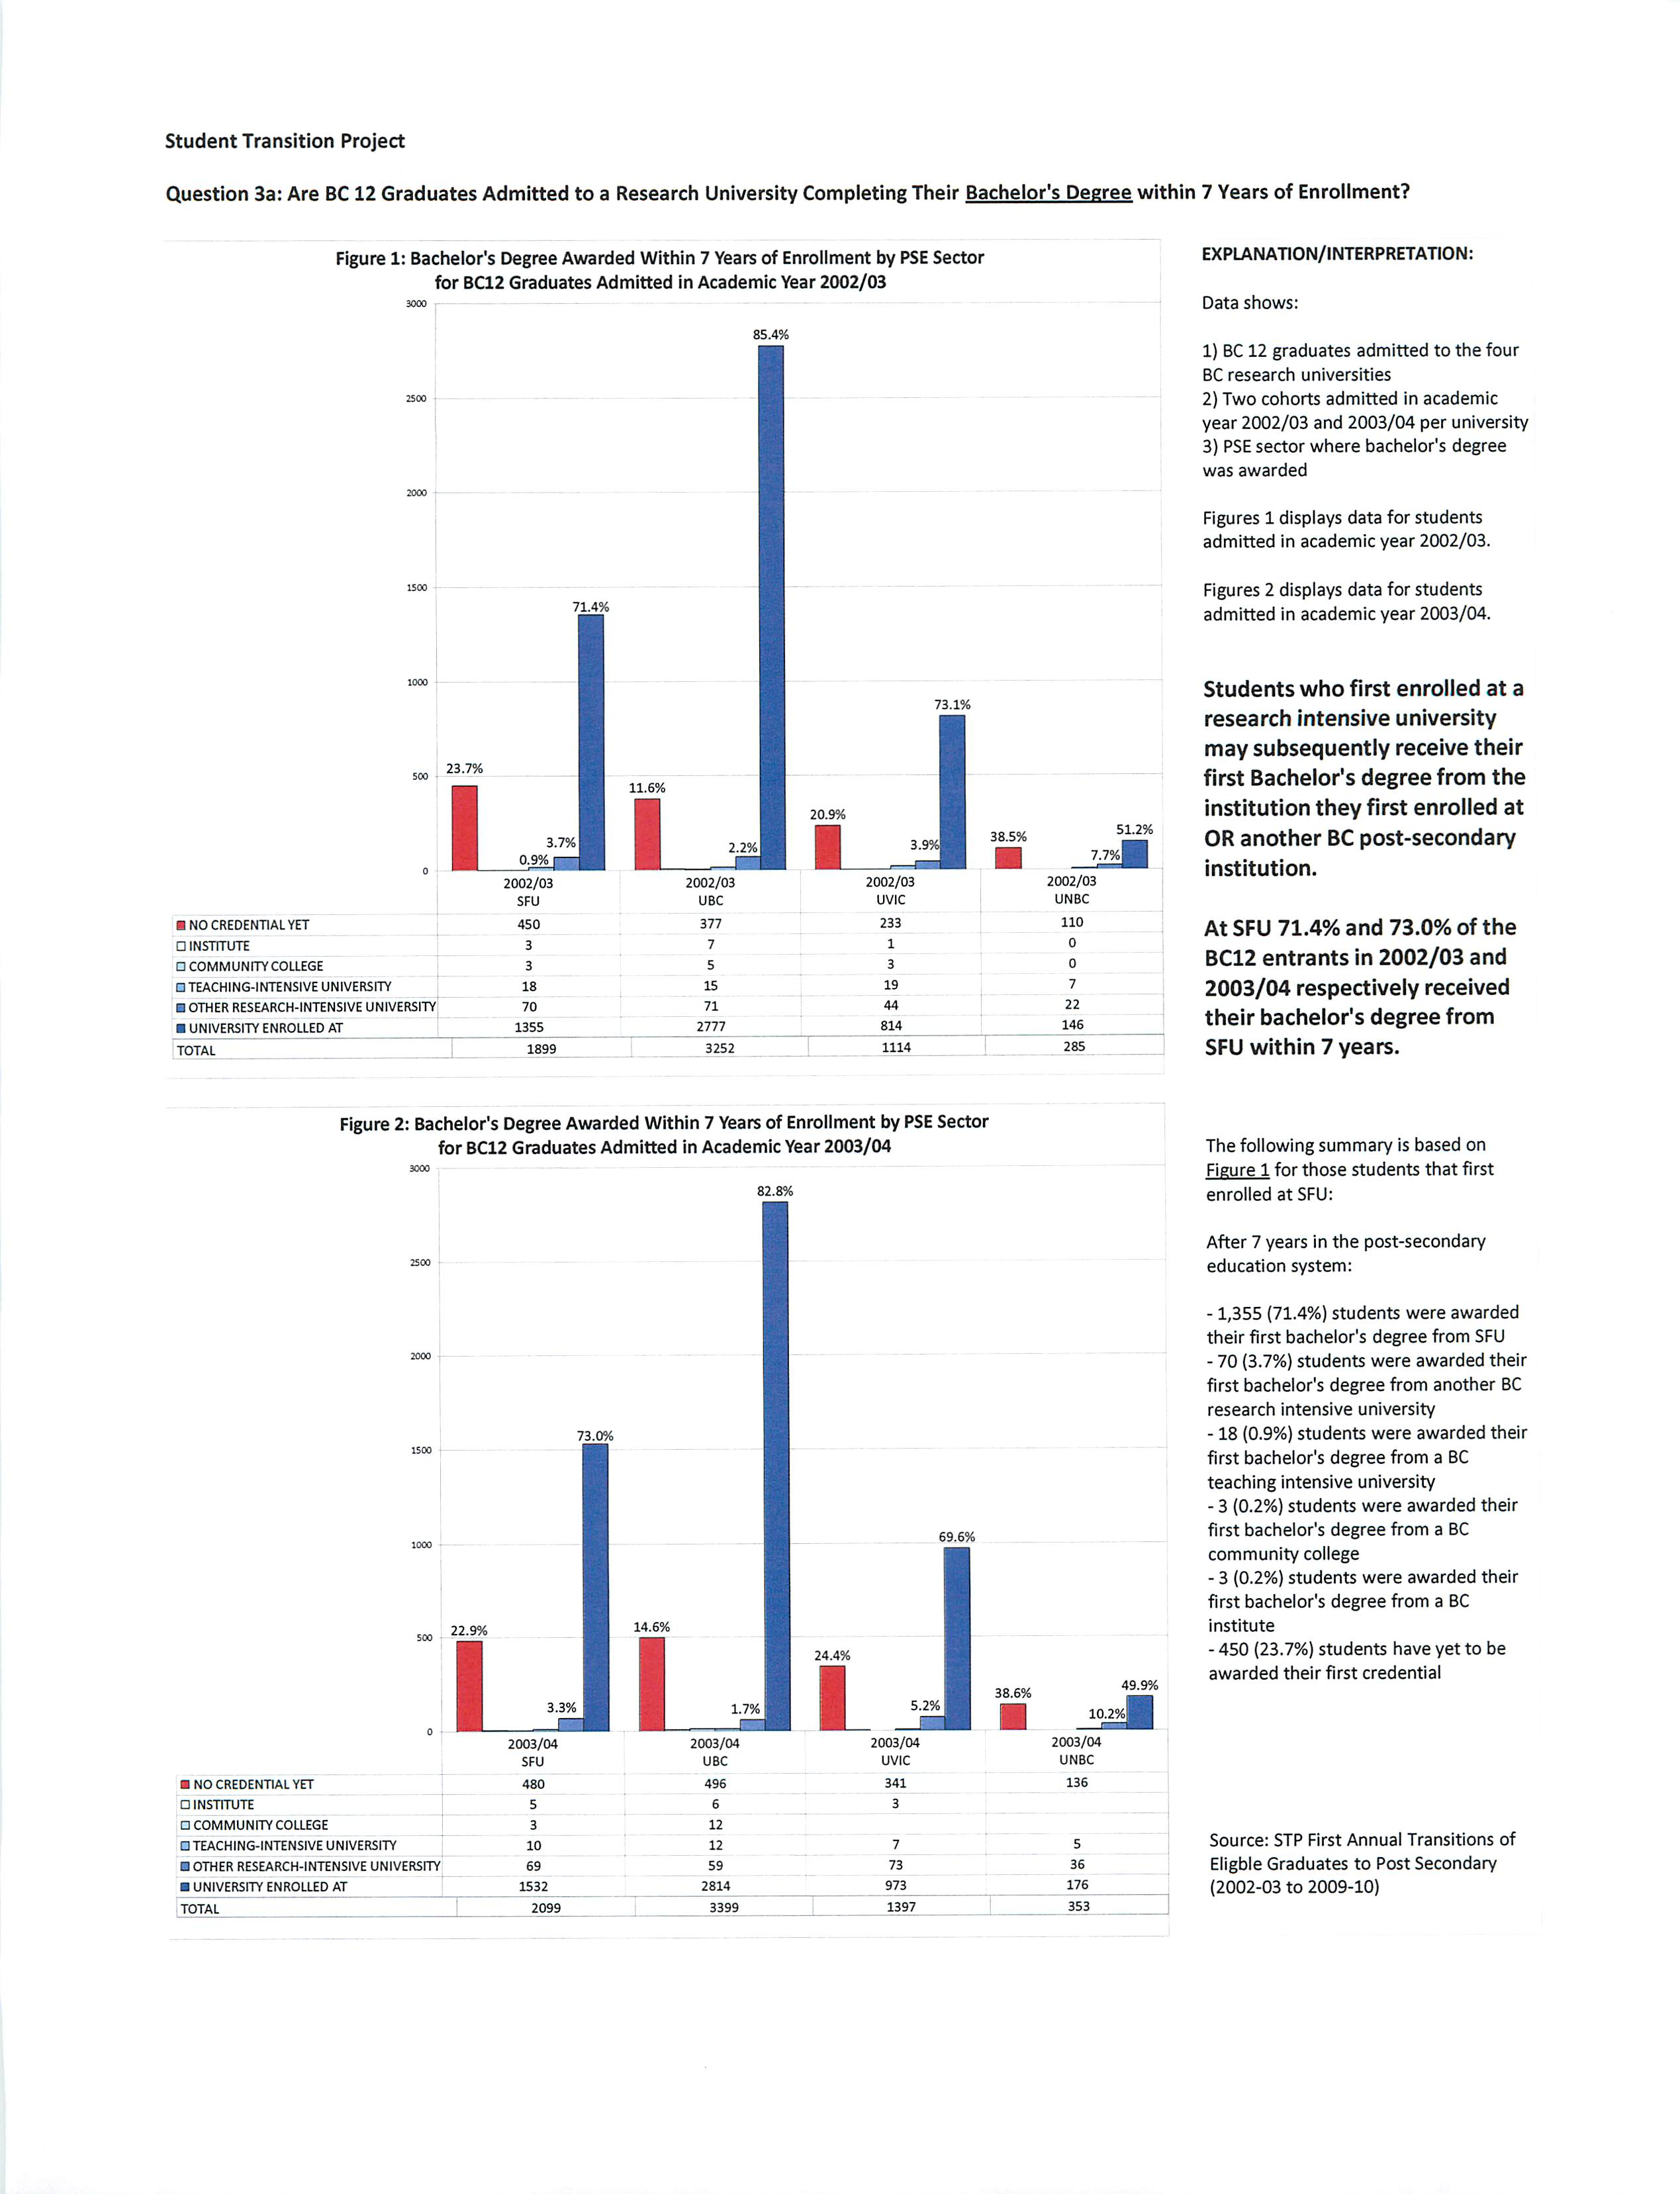
are provided in the second attachment to this document. Just over 70% of high school students entering
SFU complete their degrees at SFU, a rate that is lower than UBC and comparable with UVic. Some
students who start at SFU leave and complete a credential elsewhere, but there are still more than 20%
who start at SFU and do not complete a credential within 7 years.
Again, looking at entering high school students (attachment 3), we see this pattern persisting over a
number of years, with UBC graduating a slighdy higher percentage than SFU, and UVic slighdy lower
than SFU. This attachment also provides some data on first to secondyear retention rates, and shows that
SFU and UBC have similar patterns.
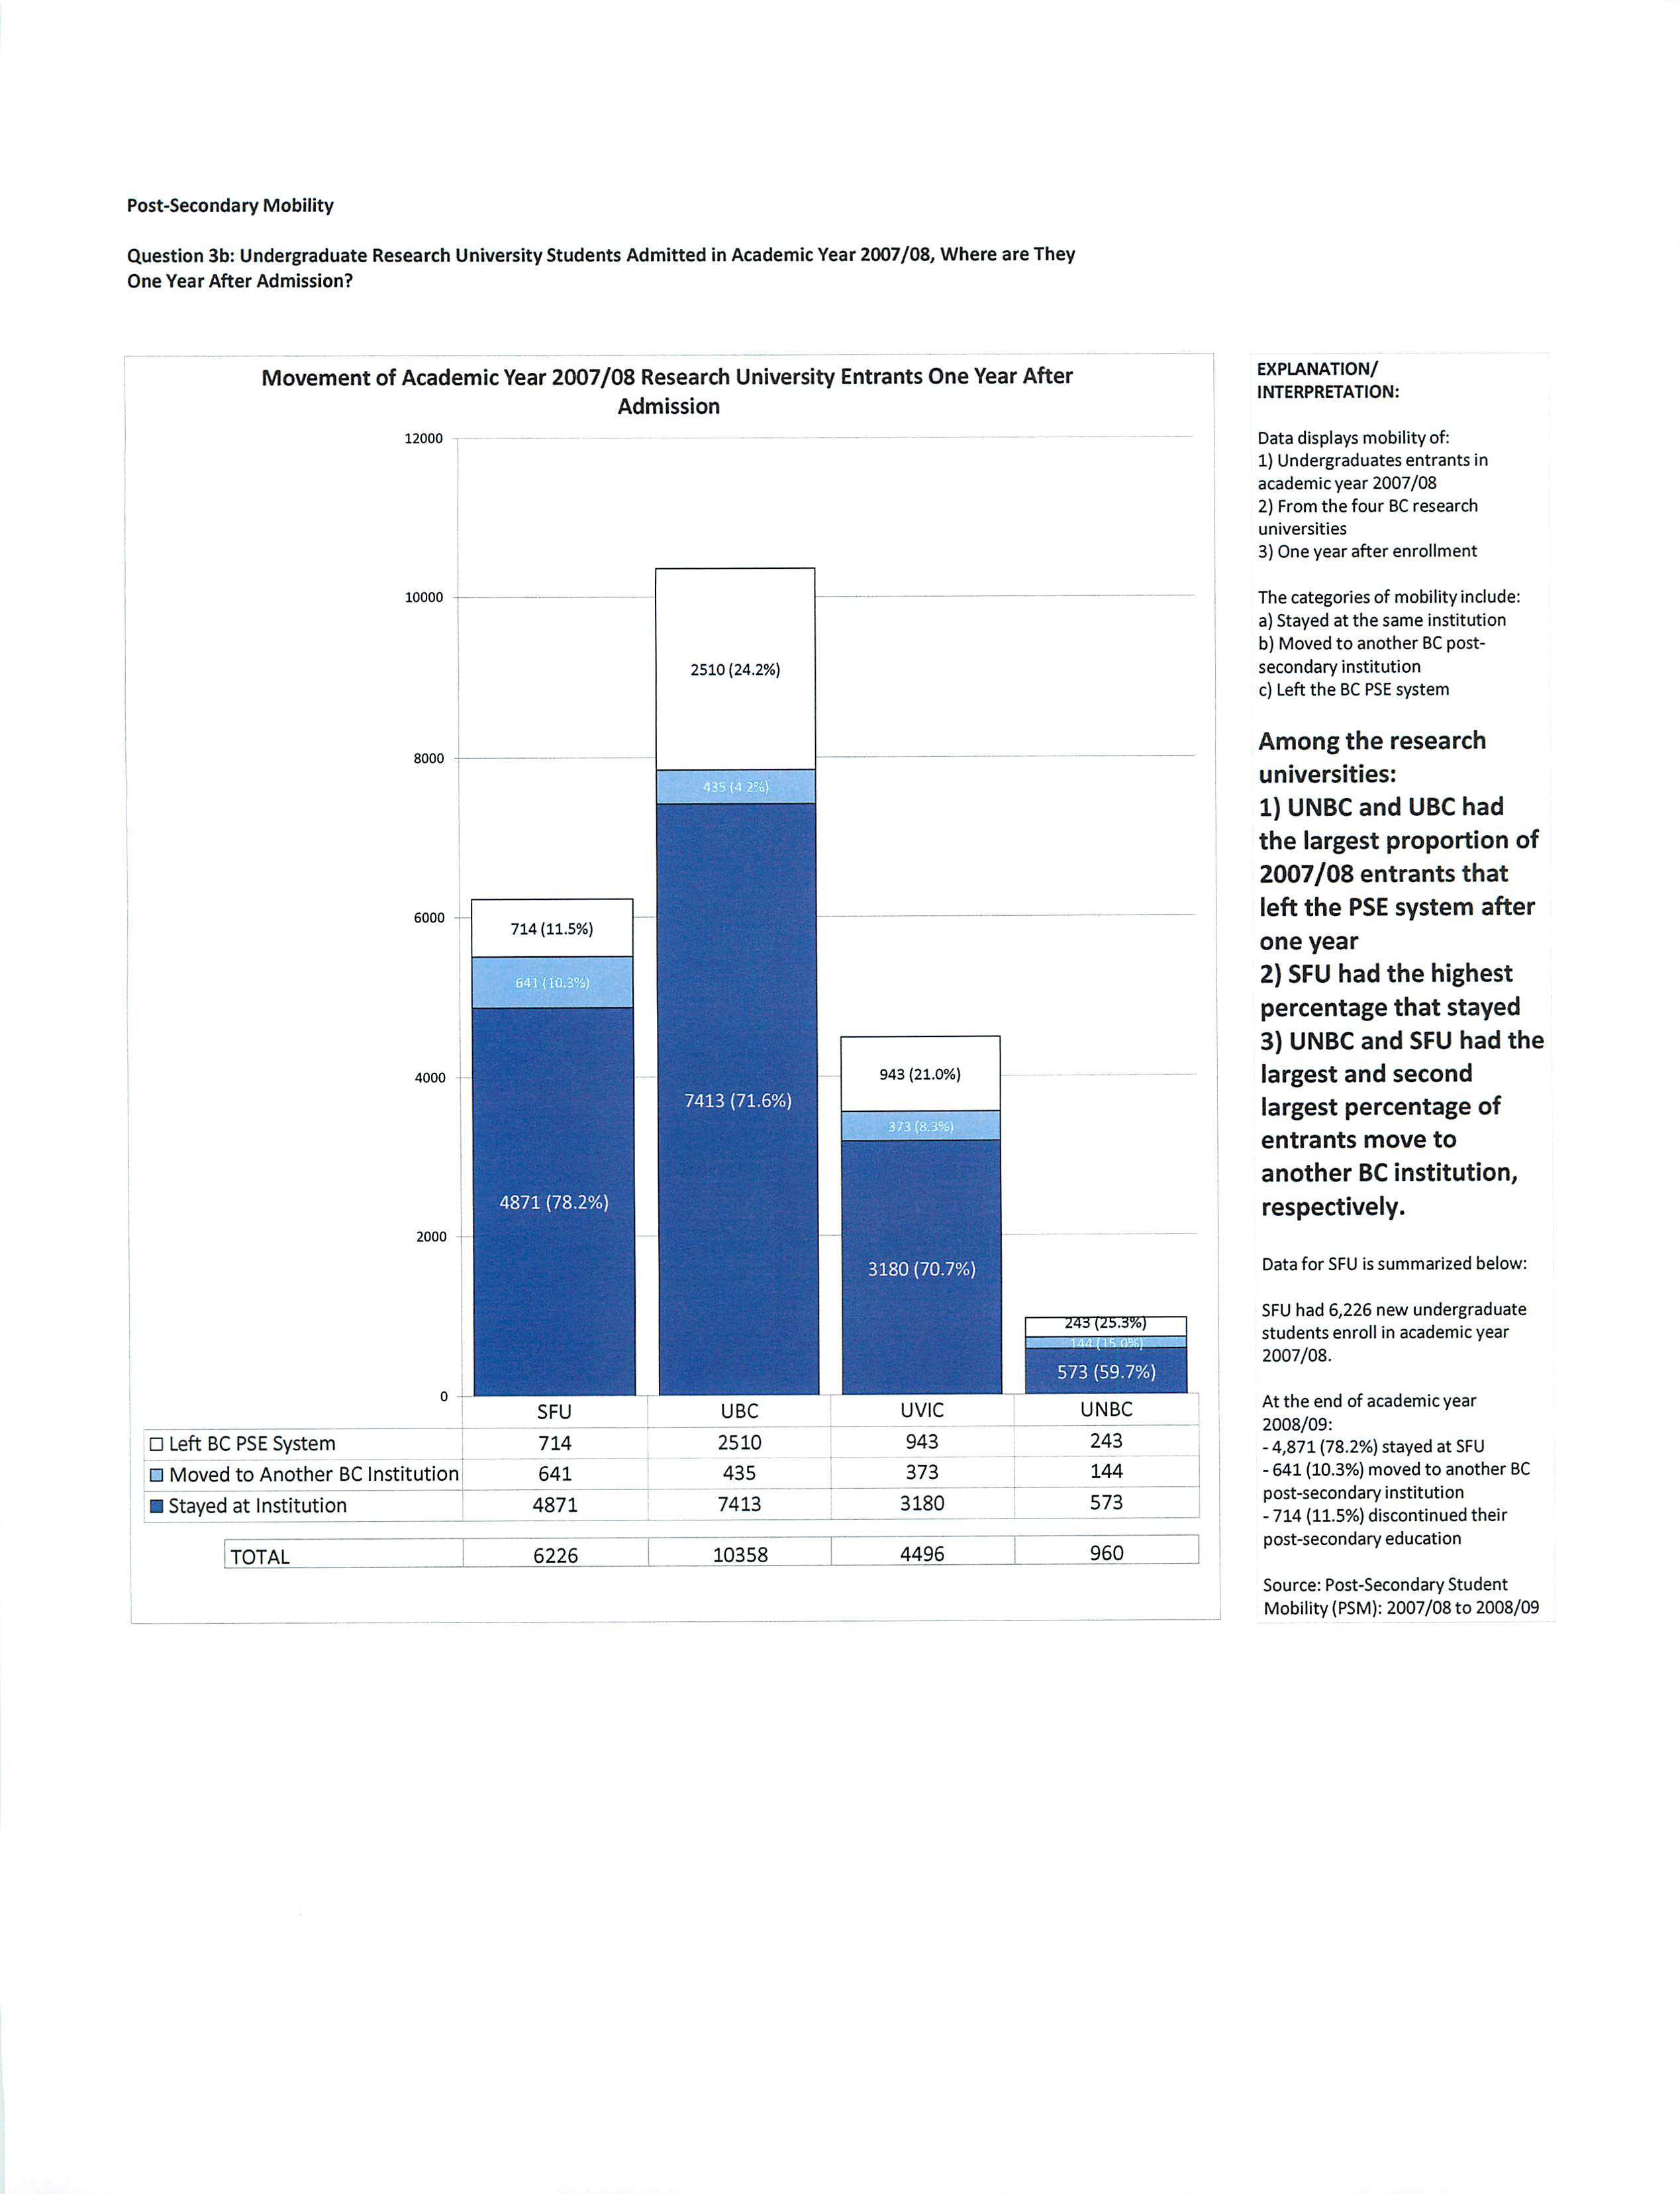
In recent years, BCCAT and the Ministry of Advanced Education, through the Student Transitions
Project, have been collecting data about how students move between institutions. The preliminary results
of this research are showing that students are now "swirling" between institutions to a much greater extent
than was previously understood or expected. This puts the concept of credential completion in a
somewhat different light, and as the STP research continues it will be useful for all post-secondary
institutions in better understanding the choices students are making about their education.
Attachment 1: "Other survey data"
Attachment 2: "Mobility data"
Attachment 3: "High school retention"
Question
1: In
Which
Areas
Does SFU Do
Well
In?
A. Canadian
University
Survey
Consortium
(CUSC)"
Al.
2010
Survey
of
First Year
Students
Figure
la: Please rate your level of satisfaction with:
Services for co-op
program,
internship, and other
practical
experiences related to
your
program
1
9«
S.
80%
f
"8
a
J
™
•S
S
60%
|%
50%
£
~
40%
o
«
0J
t
30%
oo
a,
|>
20%
V
10%
OK
O)
All
students
(N=
1,480)
Source:
CUSC
2010
-
First
Year
Students
3
-a
c
33
o
'
100%
90%
80%
70%
60%
50%
40%
30%
20%
10%
0%
a,
f
2
S
Figure
lc:
Please rate your level of satisfaction with:
Campus
medical
services
Source:
CUSC
2010
-
rirst
Year
Students
SFU
(N = 80)
SFU
(N= 97)
ST3
of;
c
2
60%
50%
DC
S
40%
O
«
"
1-
in%
3
>
e
^0%
Figure
lb:
Please rate your level of
satisfaction
with:
Athletic
facilities
Group
3
(Large Univ)
(N =
2,013)
Source:
CUSC
2010
-
First
Year
Students
80%
c
IB
-a
in
°Tf
a.
~
50%
&
S
3oy°
c
20%
0)
S
io%
Figure
Id:
Please rate
your
level of
satisfaction
with:
Career
counselling
services
Source:
CUSC
2010
- First Year
Students
i
2010,
705
outof
1,000
students
responded
tothe
survey
for
SFU.
Percentages
for
Figures
la, lb, lc,
and
Id
are
based
on
those
respondents
that
offered
a
rating.
SFU
(N=
303)
SFU
(N= 78)
Page
1
A. Canadian University Survey Consortium (CUSC) *
A2. 2009 Survey of Graduating Students
.?s
fig
11
20%
ka
15%
DC o
u r
inn,
554
Figure 2a: How did the following contribute to your personal growth and
development:
Interaction with teaching assistants
Group 3
(Large Univ)
(N =
3,166)
Source: CUSC 2009 - GraduatingStudents
Figure 2c: Please indicate your level of agreement with the following assessments
of faculty
100%
90%
80%
70%
60%
S03S
40%
30%
20%
10%
90%
87%
o
12
*>
c£
85%
85%
^^^^
78%
|
76%
L^
1-
1n%
•_
o
v
a. a)
It
*£
a) c
b0 o
s§
1
ai
o-
0%
11111
All students
Group 1
Group 2
Group3
SFU
(N = 11,642)
(Small Univ)
(Medium Univ)
(Large Univ)
(N = 633)
|N= 5,135)
(N= 3,158)
(N = 3,349)
• Mostof my professors encouraged students to participate in class discussions
• Generally,1am satisfied with my experience with teaching assistants
Source: CUSC2009 - Graduating Students
Figure2b: How did the following contribute to your personal growth and
development:
Participation in international study or exchanges
» £ 80%
o2
| £-70*
g -n
60%
(1)
(!)
c _q 50%
5, 5
a! £ 40%
°
g 30%
at .2
2
S.20%
52
S i io%
0%
All students
(N = 1,467)
Source: CUSC 2009-GraduatingStudents
Group 1
(Small Univ)
(N = 661)
Group 3
(Large Univ)
(N = 460)
SFU
(N = 81)
Figure 2d: Please rate your level of satisfaction with: Library Facilities
frJ
EI
=
%
70%
o
>
a. "a
2
C
2
(u
u £:
10%
All students
(N = 11,492)
Group 1
(Small Univ)
(N = 5,089)
Source: CUSC2009 - GraduatingStudents
Group 2
Group 3
SFU
(Medium Univ)
(Large Univ)
(N= 626)
(N = 3,108)
(N = 3,295)
In 2009, 647 out of 1,000 students responded to the survey for SFU. Percentages for Figures la, lb, and Id are based on those respondents that used or had experience with those facilities/services
Page 2
A. Canadian
University
Survey
Consortium
(CUSC)
*
A2.
2009
Survey
of
Graduating
Students
Figure2e: Please rate your level of
satisfaction
with:
Computing
Services
Source: CUSC2009 -
GraduatingStudents
Figure
2g:
Would You RecommendThis
University
and Reasonsfor
Recommending
80%
I
All
students
Group 1
Group 2
Group 3
SFU
(N=
10,025)
(Small
Univ)
(Medium
Univ)
(Large
Univ)
(N
=
561)
(N= 4,487)
(N= 2,775)
(N= 2,763)
•
Yes,
would recommend this university
Recommend because of the program
Source:
CUSC2009 -
GraduatingStudents
j2
"3oo%
S
i
5
5=90%
=
J2.
01
T380%
>
01
ro
*=
*
g70%
2
I
S
ffi
£«0%
a1
«
.£20%
5
•510%
Figure
2f:
Please rate your level
of
satisfaction
with:
Athletic
Facilities
All
students
(N =
8,358)
Group
3
(Large
Univ)
(N =
2,417)
Source:
CUSC
2009 - Graduating
Students
Please
also
see
Figure
lb
*
In
2009,
647
out
of
1,000
students
responded
tothe
survey
for
SFU.
Percentages
for
Figures
2e
and
2f
are
based
on
those
respondents
that
used
those
services
Percentages
in
Figure
2g
-
"Recommend
because
ofthe
program"
are
based
on
those
respondents
that
said
"Yes,
they
would
recommend
this
university"
SFU
(N
= 354)
Page
3
A. Canadian
University
Survey
Consortium
(CUSC)
*
A2. 2009
Survey
of
Graduating
Students
Figure 2h:
Satisfaction
With
Overall
Quality
of Education
M
C
E
All
students
Group
1
Group
2
Group
3
(N=
12,160)
(Small Univ)
(Medium
Univ)
(Large Univ)
(N=
5,339)
(N = 3,294}
(N
=
3,527)
• VerySatisfied
H
Satisfied
D
Dissatisfied
DVerydissatisfied
Source: CUSC2009 -
Graduating
Students
(N
=
647)
Figure 2i: Satisfaction
With
Decision to
Attend
This University
•
VerySatisfied
a
Satisfied
• Dissatisfied D Verydissatisfied
Source:
CUSC
2009
-
Graduating
Students
'
In
2009,647
out of
1,000
students
responded
to the
survey
for
SFU.
Please
note that
columns
may
not sumto
100%
dueto
rounding.
Page
4
A. Canadian
University
Survey
Consortium
(CUSC)*
A3.
2008
Survey
of
All
Students
Figure 3a: Please
indicate
your
level of
agreement
with
the
following
statement:
Most of my
professors
encourage
students
to
participate
in class
discussions
100%
92%
90%
f
1
80%
0)
S
9
>•
60%
no
c
50%
-C
$
30%
c
20%
-a
E
Q.
10%
2
0%
All
students
(N
=
11,981)
Source:
CUSC
2008
- All
Students
Group
1
(Small Univ)
(N
=
6,861)
Figure 3c: During
the
current
academic
year,
about
how
often
have you:
Attended
campus
lectures
(in
addition
to
regular
classes)
SI
ig
I!
el
so
1
£T
All
students
(N = 11,981)
Source:
CUSC
2008
- All
Students
*
In
2008, 294
students
responded
to the survey for
SFU.
SFU
(N = 294)
i
<
o
.c
a
Figure
3b: Please indicate your level of
agreement
with the following statement:
Teaching
assistants
have
been
helpful
in my
academic
program
All
students
(N =
11,981)
Source:
CUSC
2008
- All
Students
Please
also
see
Figure 2a
Page 5
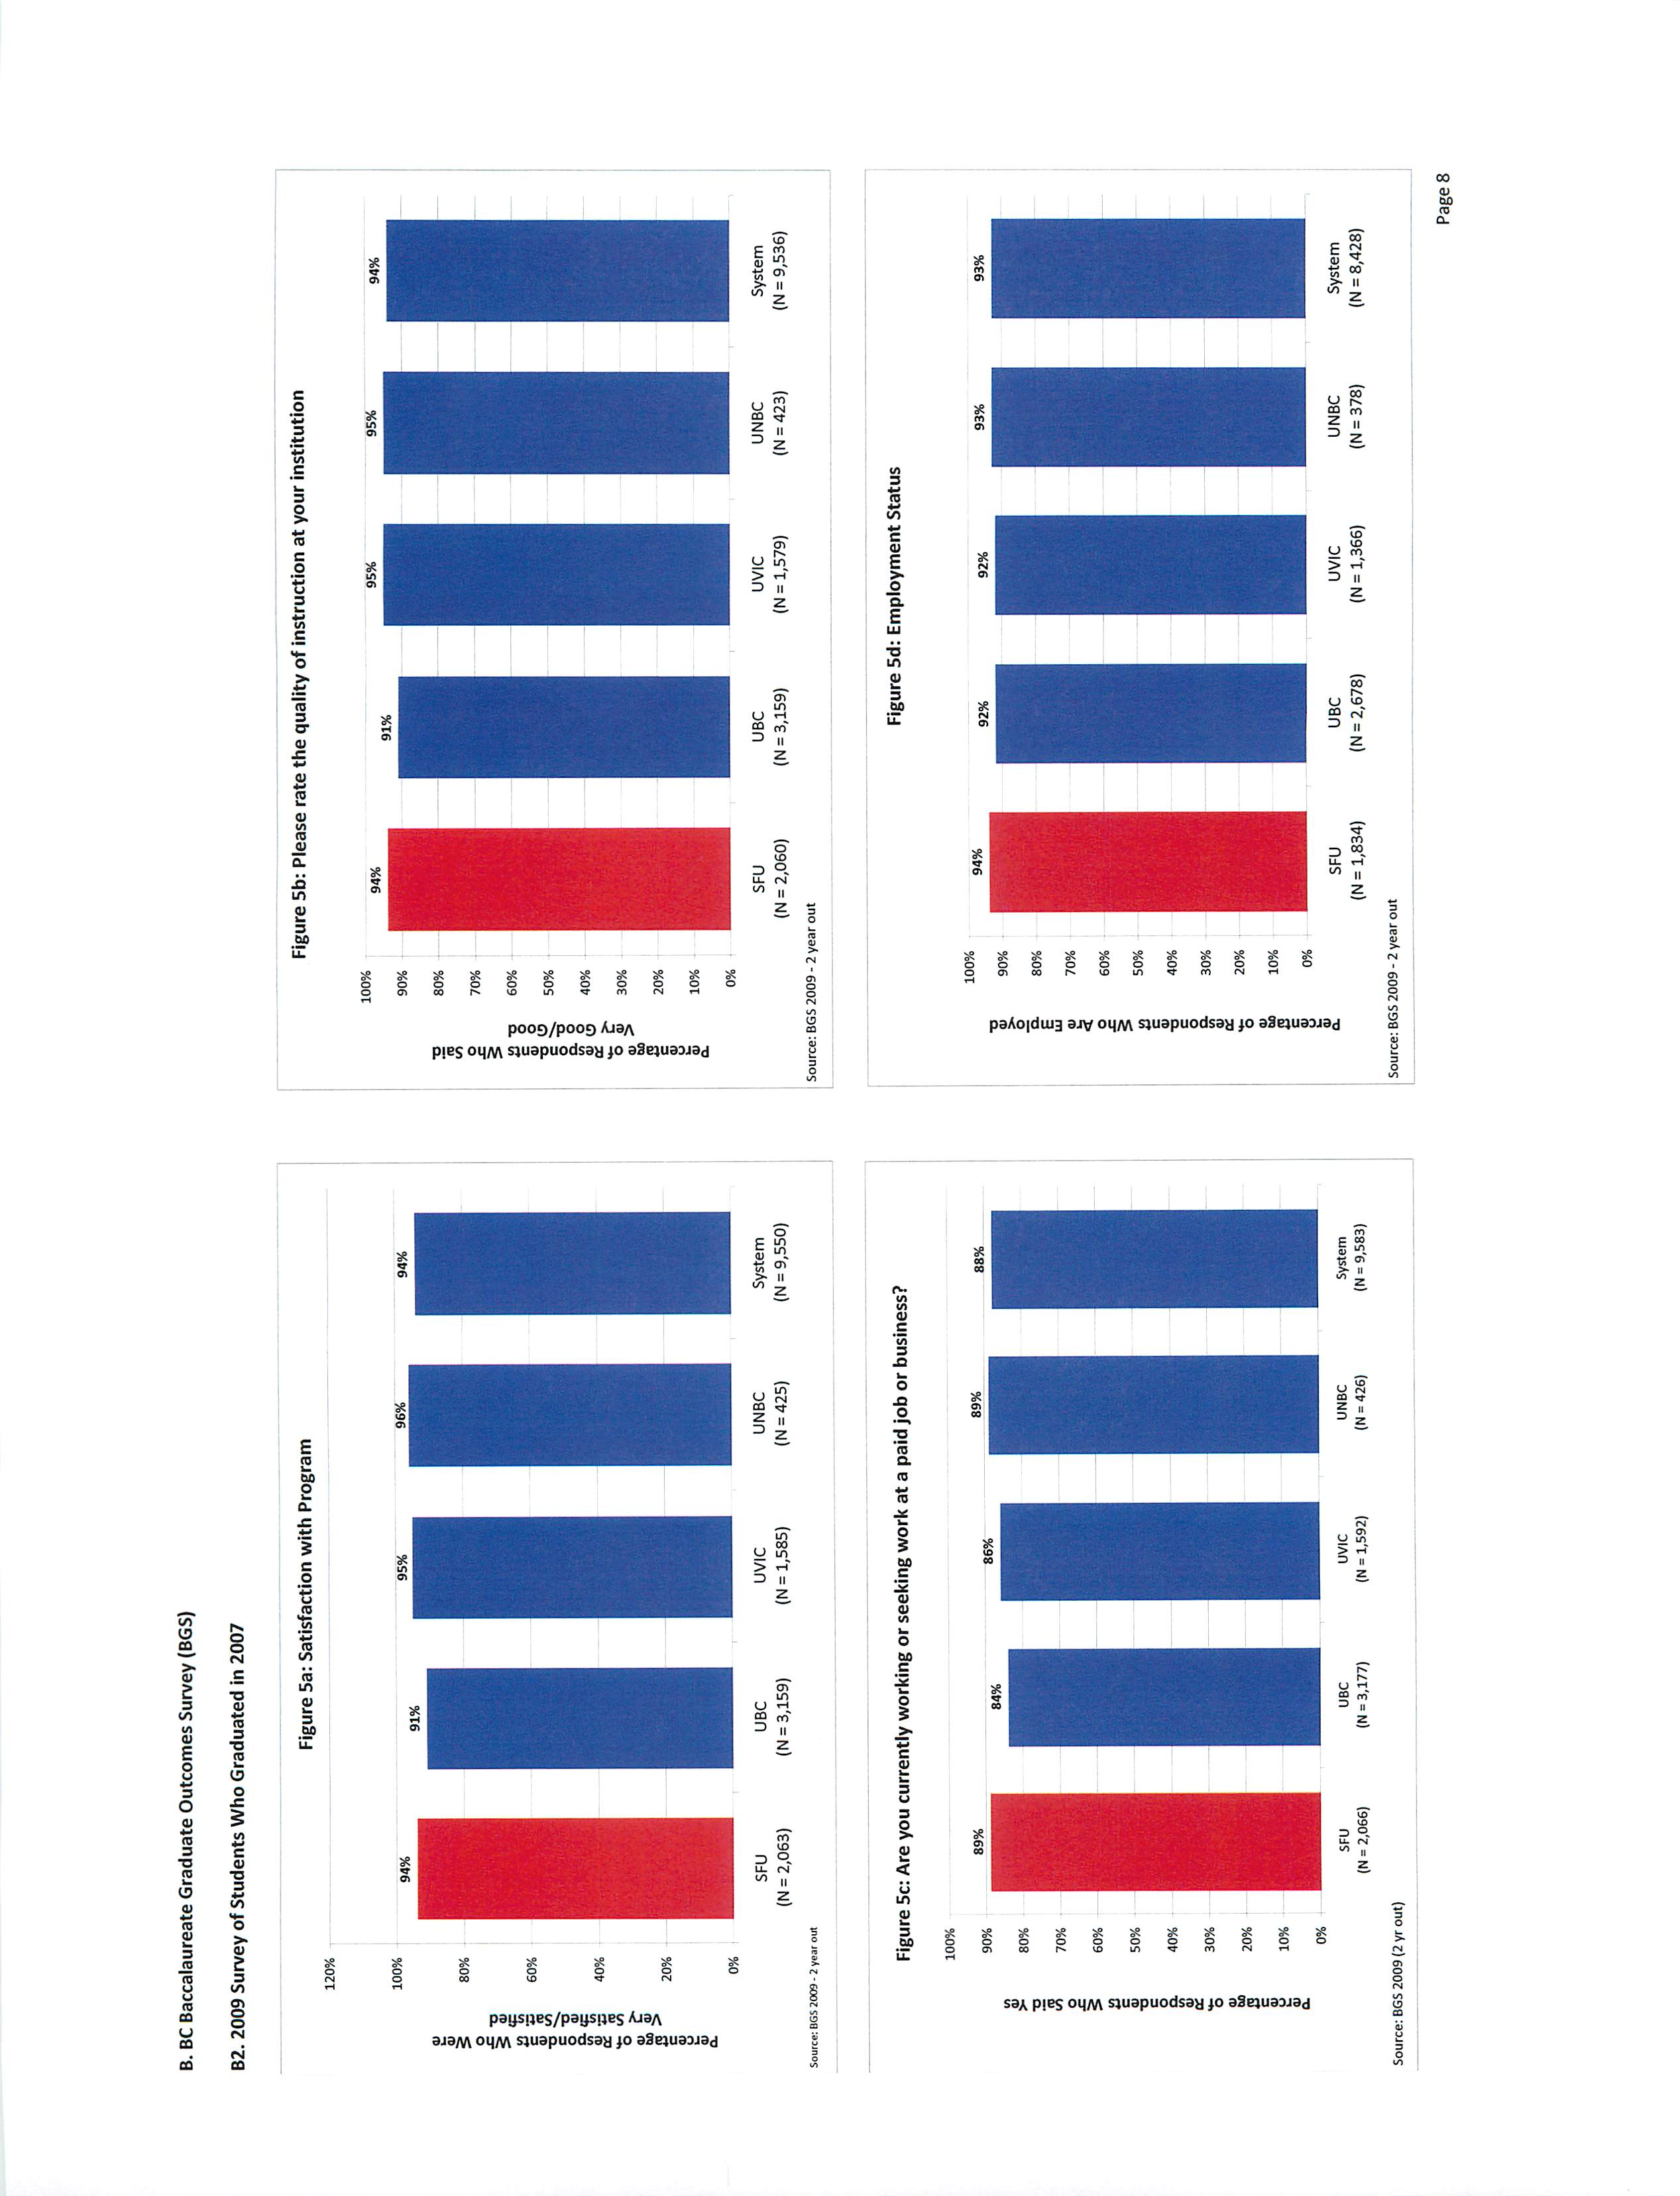
B. BC
Baccalaureate
Graduate
Outcomes
Survey
(B6S)
Bl.
2009
Survey
of
Students
Who
Graduated
in
2004
Figure 4a: To
what
degree did your program help you
develop
the
following
skill:
Use
of
Mathematics
Appropriate
to Field
Source:
BGS
2009
-5
year
out
t
OJ
Figure4c: To
what
degree did your program help you
develop
the
following skill:
Oral
Communication
SFU
(N= 651)
System
(N=
3,011)
Source:
BGS
2009
-5
year
out
Figure
4b: Towhat degree did your program help you develop the following skill:
Use
of
Computers
Appropriate
to Field
40%
•Si
Si
gj
5
30%
20%
Source:
BGS
2009
-5
year
out
3
£•=
or
—
°2
Figure
4d:To what degree did your program help you develop the following skill:
Problem
Resolution
50%
40%
30%
20%
System
(N =
3,028)
Source:
BGS
2009
-5
year
out
Page 6
B. BC
Baccalaureate
Graduate
Outcomes
Survey
(BGS)
Bl.
2009
Survey
of
Students
Who
Graduated
in
2004
Figure 4e: To
what
degree
did your program help you
develop
the
following
skill:
Written
Communication
•D
o
i-s
01
.S*
T3
I
Si
a
w>
8
I
£
£r
SFU
(N = S27)
Source:
BGS
2009
-5
year
out
System
(N=
2,921)
Figure4g:To what degree did your program help you
develop
the
following skill:
Learning
On Your
Own
-a
100%
90%
80%
5
70%
01
•$
60%
||
a.
on
50%
V
M
30%
|
J
20%
10%
SFU
(N
=
658)
Source:
BGS
2009
-5
year
out
5
-=
O.
M
Figure
4f:
To
what
degree did your program help you
develop
the
following skill:
Critical
Analysis
30%
20%
Source:
BGS
2009
-5
year
out
Figure4h: Are you currently working or
seeking
work
at a paid job or a business?
Source:
BGS2009 (5 yr out)
SFU
(N = 700)
UBC
(N = 1,099)
Page
7