S.11-26
DATE: February 1,2011
TO:
Kate Ross, Secretary of Senate
FROM: Sam Black, Faculty Senator
RE:
Questions regarding the grading policy in the Faculty of Health Sciences
Background
A document recently
prepared by SFU Institutional Research and Planning in Summer 2009
(see attachment) identifies some important anomalies in the grades awarded to FRS students.
Examples include:
A)
Since its inception in 2006, 45.S
o
/0 of undergraduate FRS students receive 'A' grades. That
average rises to
47.3% in 200S/9. That is over twice the average for all other Faculties, and
significantly higher than any other Faculty.
B) During that period FHS average undergraduate course grades are about 18% higher than
the average for all other Faculties, and significantly higher than any other Faculty. That is
approximately
an average difference of a full letter grade per student per course.
Questions
The report notes that FRS's results may be distorted as a result of small sample sizes. The
grade
gap between FRS and all other Faculties was actually widening, however, in 200S/9 as
student intake (and sample size) for
FHS increased.
1) Do the figures for
2009/10 reveal that the grade gap between FHS and the University
average for A's awarded
to undergraduates and undergraduate course grades has narrowed
or increased? By how much?
2) Are there mitigating considerations that might explain the grade gap? Is there evidence, for
example,
that FRS undergraduates are significantly more intelligent than other SFU
undergraduates? Do they demonstrate similarly remarkable success in relation to students
from other Faculties
in non-FHS courses?
3) If the grade gap has not significantly narrowed in 2009/10, and there are no mitigating
considerations is the VP A concerned
about its possible implications for the wider University
including:
a. Undermining the perceived value of an SFU degree and the University'S reputation
b. Distorting student
demand patterns for degrees
4) What will be done?
SIMON FRASER UNIVERSITY
I
NS
TI
TUT
I
ONAL RESEAIlC
H
AND PLANN
I
NG
2008/09 Grades Report:
Historical Distribution of
Undergraduate and Graduate Course Grades
1999/00
to
2008/09
Prepared by
Jess
i
ca
Till
ey
,
Ana
l
ysl
Inslilu
ti
onal Research and Plan
ni
ng
S
umm
e
r
2009
Table of Contents
I.
Introduction
...............................................................................................................................................................
4
II.
Definitions
and
Notes
...............................................................................................................................................
4
III.
Analysis
.....................................................................................................................................................................
6
Undergraduate
Course
Grades
...........................................................................................................................
6
Undergraduate Course Grades
by Student Faculty .......................................................................................... 11
Graduate
Course
Grades
.....................................................................................................................................
12
IV.
Tables
and
Graphs
....................................................................................................................................................
14
Appendix A - Undergraduate Course Grades
15
Table 7 - Percentage Distribution of Undergraduate Course Grades by Subject.................................
16
Table 8 - Faculty/University Summary ............................................................................................................... 39
Figure 1 - Percent Distribution of Undergraduate Course Grades by Faculty and Division ....................... 42
Figure 2 - Average Undergraduate Course Grades Awarded by Faculty and Division ................................ 43
Figure 3 - Average Undergraduate Course Grades Awarded by Subject and Division ................................ 44
Appendix
8 - 2005/06
Undergraduate Course Grades by Faculty of Student
51
Table 9 - Percentage Distribution of Undergraduate Course Grades by Faculty of Student.. .................... 52
Figure 4 - Undergraduate Course Grades: Faculty of Course vs. Faculty of Student.. ............................... 54
Appendix C - Graduate Course Grades
55
Table 10- Percentage Distribution of Graduate Course Grades by Subject.. ............................................... 56
TabLe 11 - Faculty/University Summary ............................................................................................................ 66
Figure 5 - Percent Distribution of Graduate Course Grades by Faculty ........................................................ 68
Figure 6 - Average Graduate Course Grades Awarded by FacuLty ................................................................. 69
Figure 7 - Average Graduate Course Grades Awarded by Subject. ............................................................... 70
Appendix P - Subjects by Faculty
74
2:1
'Ilh.
1)1)
'oFLI (,R:\PES
REPl
JR T
I
- Introduction
This report summarizes
student course
grades
at Simon
Fraser
University over the
ten
year
period from
1999/00 to 2008/09.
Grade distributions
are
reported, and
patterns
over
time
are
presented
and discussed. The report is divided
into four sections:
•
The main
section of
the report provides
definitions, and summarizes
the findings.
•
Appendix A provides
inf
ormation on undergraduate course
grades.
Grades are
reported
separately
for lower division and upper division
courses,
first
within
the
subject
in
which
the course
is taught,
and
then
summarized at
the Faculty
and
university levels.
•
Appendix B provides information
on
undergraduate
course
grades at
the
Faculty level,
while controlling
for
the approved
Faculty
of
the
students enrolled
in the courses.
•
Appendix
C
provides information
on
graduate
course grades. Grades are
reported
within
each subject, and
then
at
the Faculty
and
university levels.
In
Appendices
A through
C,
the data
are
displayed
in
both tabular
and
graphical formats.
•
Appendix
0 lists the
subjects
in
each
Faculty.
This report
is available
on
the
Ins
titutional
Research
and
Planning
web
site
at:
p://www.sfu.
c
a
/
i
rp
/
St
ud
e
n
ts
/gr
a
d
es
r
eport/i
n
dex.
ht
m
l
II
- Definitions and Notes
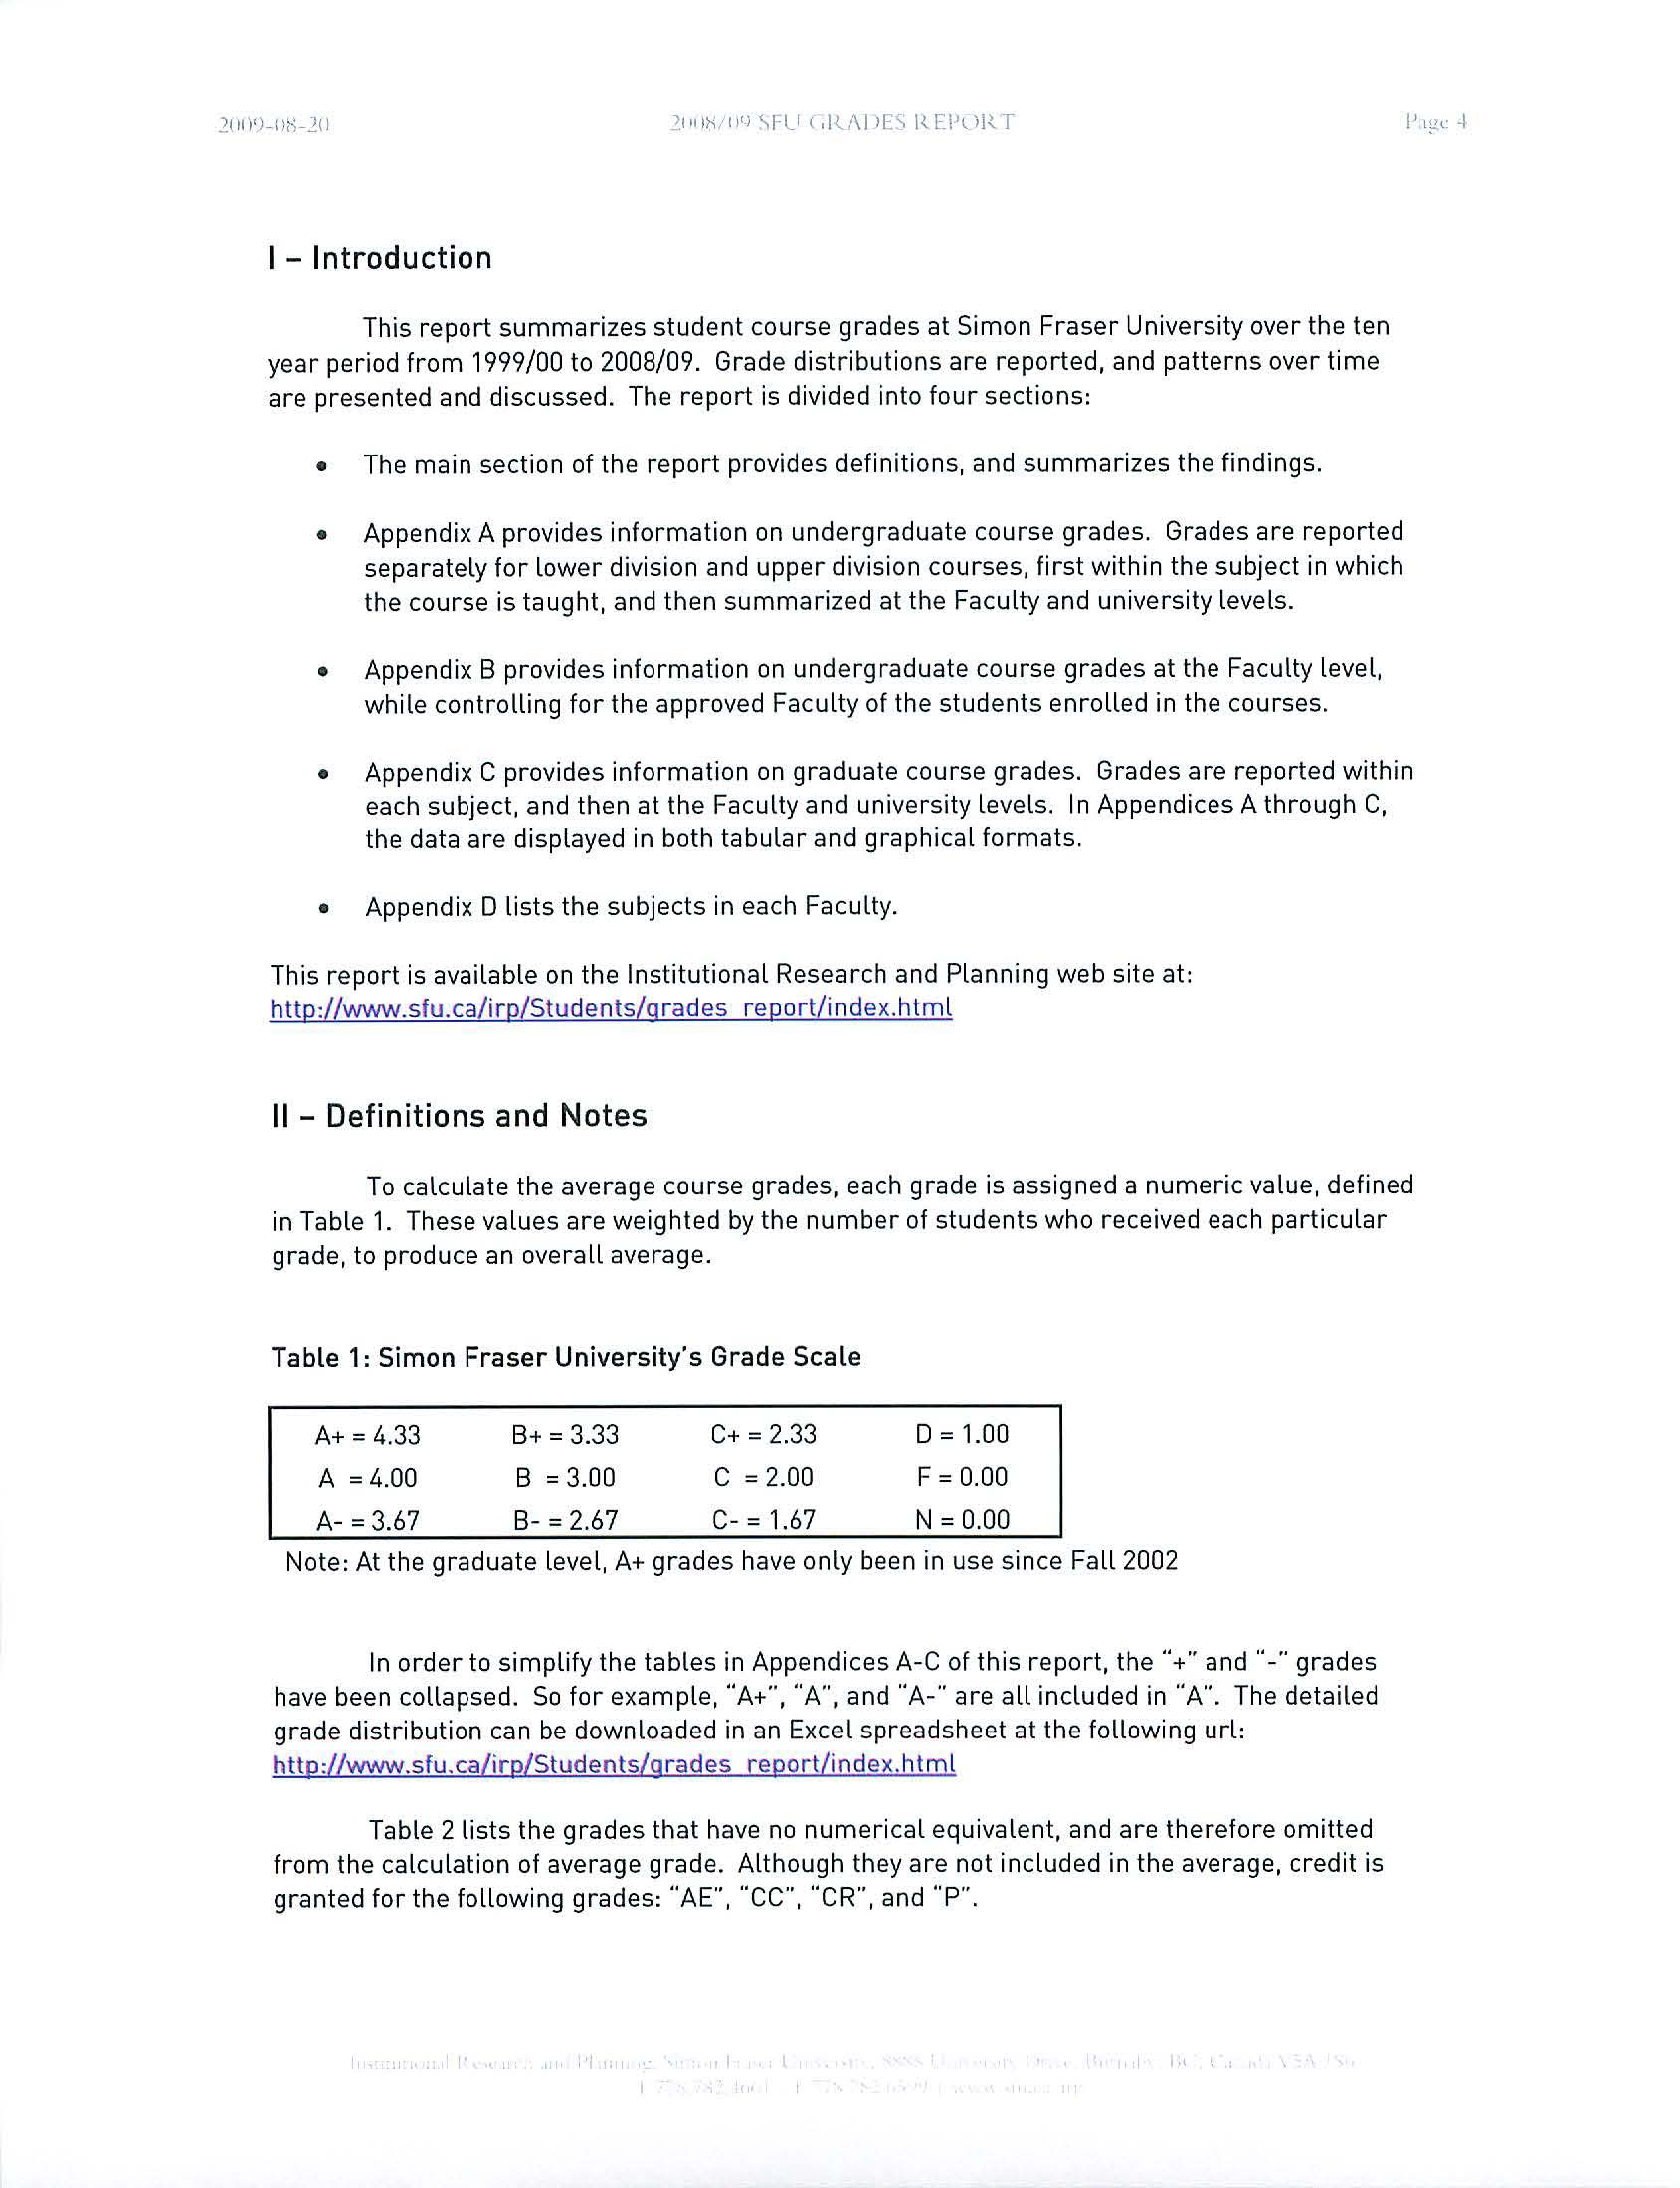
To
calculate
the
average course
grades,
each
grade is assigned a numeric value, defined
in Table
1.
These values are weighted
by the
number of
students who
received
each
particular
grade, to produce
an
overall
average
.
Table 1: Simon
Fraser University.s Grade Scale
A+
=
4.33
B+
=
3.33
C+
=
2.33
A
=
4.00
B
=
3
.00
C
=
2
.00
A-
=
3
.6
7
B-
=
2.67
C-
=
1.67
o
=
1.00
F
= 0.00
N =
0.00
Note: At the graduate level, A+ grades have
only
been in
use
s
ince Fall 2002
In order to
simpl
ify
the tables in
Appendices A-C of
this report, the .. + .
.
and .. _
.
. grades
have been
collapsed.
So for
examp
l
e,
.. A+
..
, ..A
..,
and
..A-..
are all
included in
..A..
The deta
i
l
ed
grade distribution can be downloaded
in
an Excel
spreadsheet at
http:
www.s
f
u
.ca/
i
rp
/
Stu
d
en
t
s
/
g
r
a
d
es report/
i
ndex.
html
Table 2 lists the grades that have no numerical
equ
ival
ent,
and are therefore
omitted
from the
calcu
lation
of average grade. Although they
are
not
includ
ed
in the average, credit is
granted for the following grades:
..AE..,
.
.CC...
..CR"",
and ..
p
.
..
, I
"" 1:-' III) \Fl : ( ;R:\l >E" IZ I 1\ lIZ I
TabLe 2: Grades with No NumericaL EquivaLent
Grade
AE
AU
CC
CF
CN
CR
DE
FX
GN
IP
P
W
WD
WE
Definition
aegrotat standing, compassionate pass
audit
course challenge
course challenge failed
did not complete challenge
credit without grade
deferred grade
formal exchange
grade not reported
in progress
pass,ungraded
withdrawn
withdrawal
withdrawal under extenuating circumstances
Among undergraduate courses,
"lower division" courses are those numbered from 001 to
299 inclusive. "Upper division" courses are numbered 300 to 499 inclusive.
Data reported
on a yearly basis refers to fiscal year. For example, 2008/09 grades are
the grades accumulated over the
2008 summer term (SFU term code: 1084), the 2008 fall term
[SFU term code: 1087). and the 2009 spring term [SFU term code: 1091).
To protect student privacy, grade distributions based on five grades or fewer are not
reported.
The tables in Appendices A-C of this report list subjects alphabetically by their four-letter
abbreviation. Coop courses, work-terms, and practicums are excluded from this report. Where
they could
be identified, courses graded as Pass/Fail are also excluded.
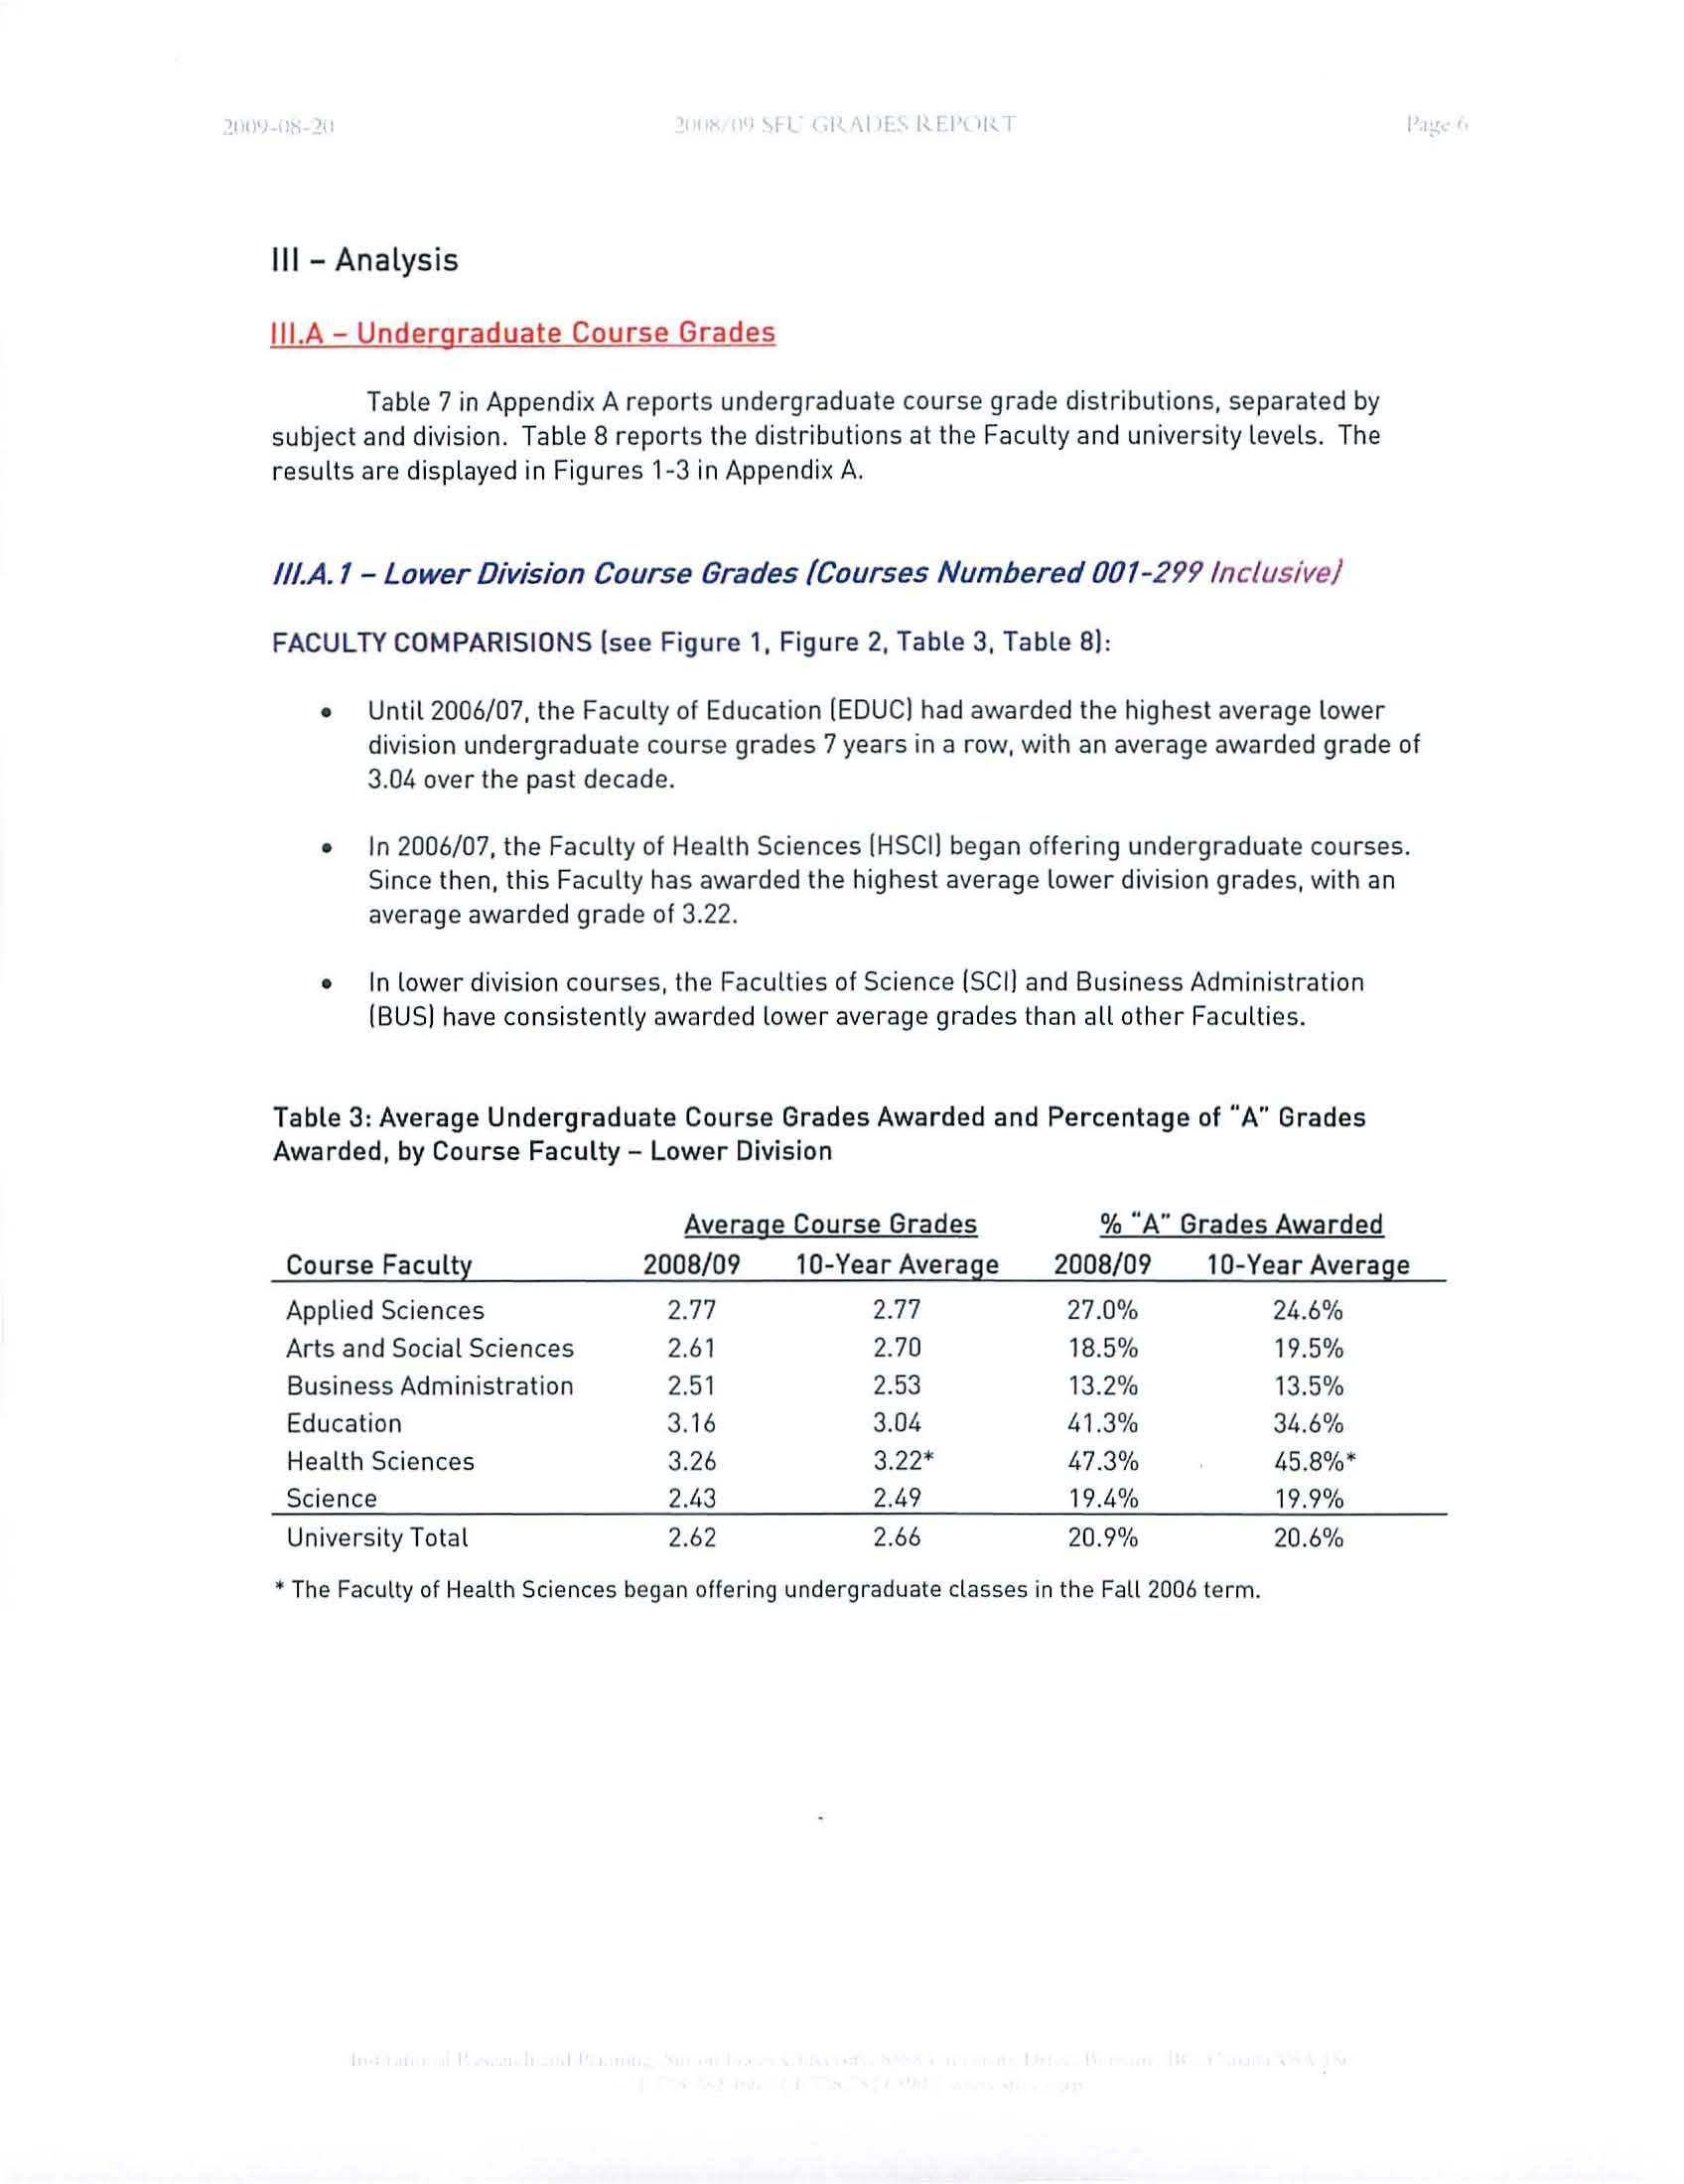
III - Analysis
III.A - Underg
r
aduate Course Grades
Table
7
in
A
pp
end
i
x A
r
epo
rt
s
undergraduate
cou
r
se grade
distributions,
sepa
r
ated by
sub
j
ec
t
and
division. Table
8
report
s
the distributions
at
the Faculty
and
uni
versity
l
evels.
Th
e
results
are
displayed
in Fi
g
ur
es
1
-3
in
Appendix A.
III.A.1
-
Lower Division Course Grades /Courses Numbered 001
-
2
99
I
n
c
/
usiveJ
FACULTY COMPARIS
I
ONS
Isee
Figure 1, Figure
2,
Table
3
,
Table 8
1
:
/',1:-., I
•
Until
2006/07,
the
Fac
ult
y of
Education
lEDU
C
I
had
awar
ded
the h
i
g
h
est average
l
owe
r
division
undergraduate
course g
r
ades 7
years
in a row
,
wit
h
an average awa
rd
e
d grade
o
f
3.04 over t
h
e
p
ast decade.
•
In
2006/07
, th
e Faculty of Health Sc
i
ences [HSCII began offe
ri
n
g und
ergra
du
a
t
e cou
r
ses.
Since
th
e
n
,
this
F
aculty has awarded
the highest
average
l
ower d
i
v
i
s
i
on
gr
ades,
with an
average awa
rd
ed
grade
o
f
3.22.
•
In l
owe
r
division
co
u
rses, the
F
ac
ult
ies o
f
Sc
i
ence
[
SC
II
and
Busin
ess
Adm
ini
stration
[BU
S
I h
ave co
n
s
i
ste
ntl
y awa
rd
ed
lower
average
grades than all
o
th
e
r F
ac
ulti
es.
Table 3: Average Unde
r
graduate Course Grades Awarded and Percentage of
"A"
Grades
Awarded, by Course Faculty -
L
ower Division
Average Course Grades
% "
A" Grades Awarded
Course Facu
l
ty
2008/09
10-Year Average
2008/09
lO
-Y
ear Average
App
li
ed Sc
i
e
nces
2.77
2
.
77
27.0%
24.6%
Arts and Social Sc
i
ences
2.61
2.70
18.5%
19.5%
Busin
ess
Adm
in
istration
2.51
2
.
53
13.2%
1
3.5%
Education
3.
1
6
3.04
41.3%
34.6%
H
ealt
h
Sc
i
e
n
ces
3.26
3.22'
47.3%
45.8%'
Science
2.43
2.49
1
9.4%
19.9
%
University Total
2
.
62
2.66
20.9%
20.6%
...
T
he
Fa
culty
of
H
ealth Sciences began offering undergraduate classes in the Fa
ll
2006
term.
LONG-TERM COMPARISONS WITHIN FACULTIES (see Figure 3):
Comparing the average lower division grades awarded over the last ten years:
•
Applied Sciences (APSC):
o Courses in Interactive Arts & Technology lIAT). Engineering Science (ENSC), and
Resource & Environmental Management
(REM) have awarded considerably
higher grades than other subjects.
o Mathematics & Computing Science (MACM) courses have awarded grades
considerably below the
APSC average.
• Arts and Social Sciences (ARTS):
o Courses in Sustainable Community Development (SCD) have awarded the highest
average grades.
o Economics (ECON) and Philosophy (PHIL) have awarded the lowest average
lower division grades.
•
Science (SCI):
o The highest average lower division grades have been awarded in EnvironmentaL
Science (EVSC) courses.
o Mathematics [MATH) courses have awarded the lowest average grades.
CURRENT COMPARISONS AND TRENDS WITHIN FACULTIES (see Figure 3):
2008/09
Average Course Grades /see Figure
31:
•
Applied Sciences (APSC):
o The highest average lower division grades awarded in 2008/09 were in
Interactive Arts and Technology IIAT).
o The lowest average grades were awarded in Computing Science (CMPT) and
Mathematics & Computing Science (MACM).
•
Arts and Social Sciences [ARTS):
o The highest average grades awarded in 2008/09 were in Language Courses
(LANG).
It should be noted that the average grade for Language (LANG) is
based
on a small sample size (fewer than 50, see Table 7.)
o The lowest average grades were awarded in Economics [ECON) and
Philosophy
(PHIL).
•
Education [EDUC):
o Grades awarded in Foundations of Academic Literacy
(FAll this year were
higher than those awarded in Education classes lEDUC).
•
Science (SCI):
o
The highest average grades in 2008/09 were awarded in Environmental
Science [EVSC) and Physics [PHYS).
o The lowest average grades were awarded in Biological Sciences (BISC).
Mathematics [MATH). and Mathematics & Computing Science (MACM).
I' .
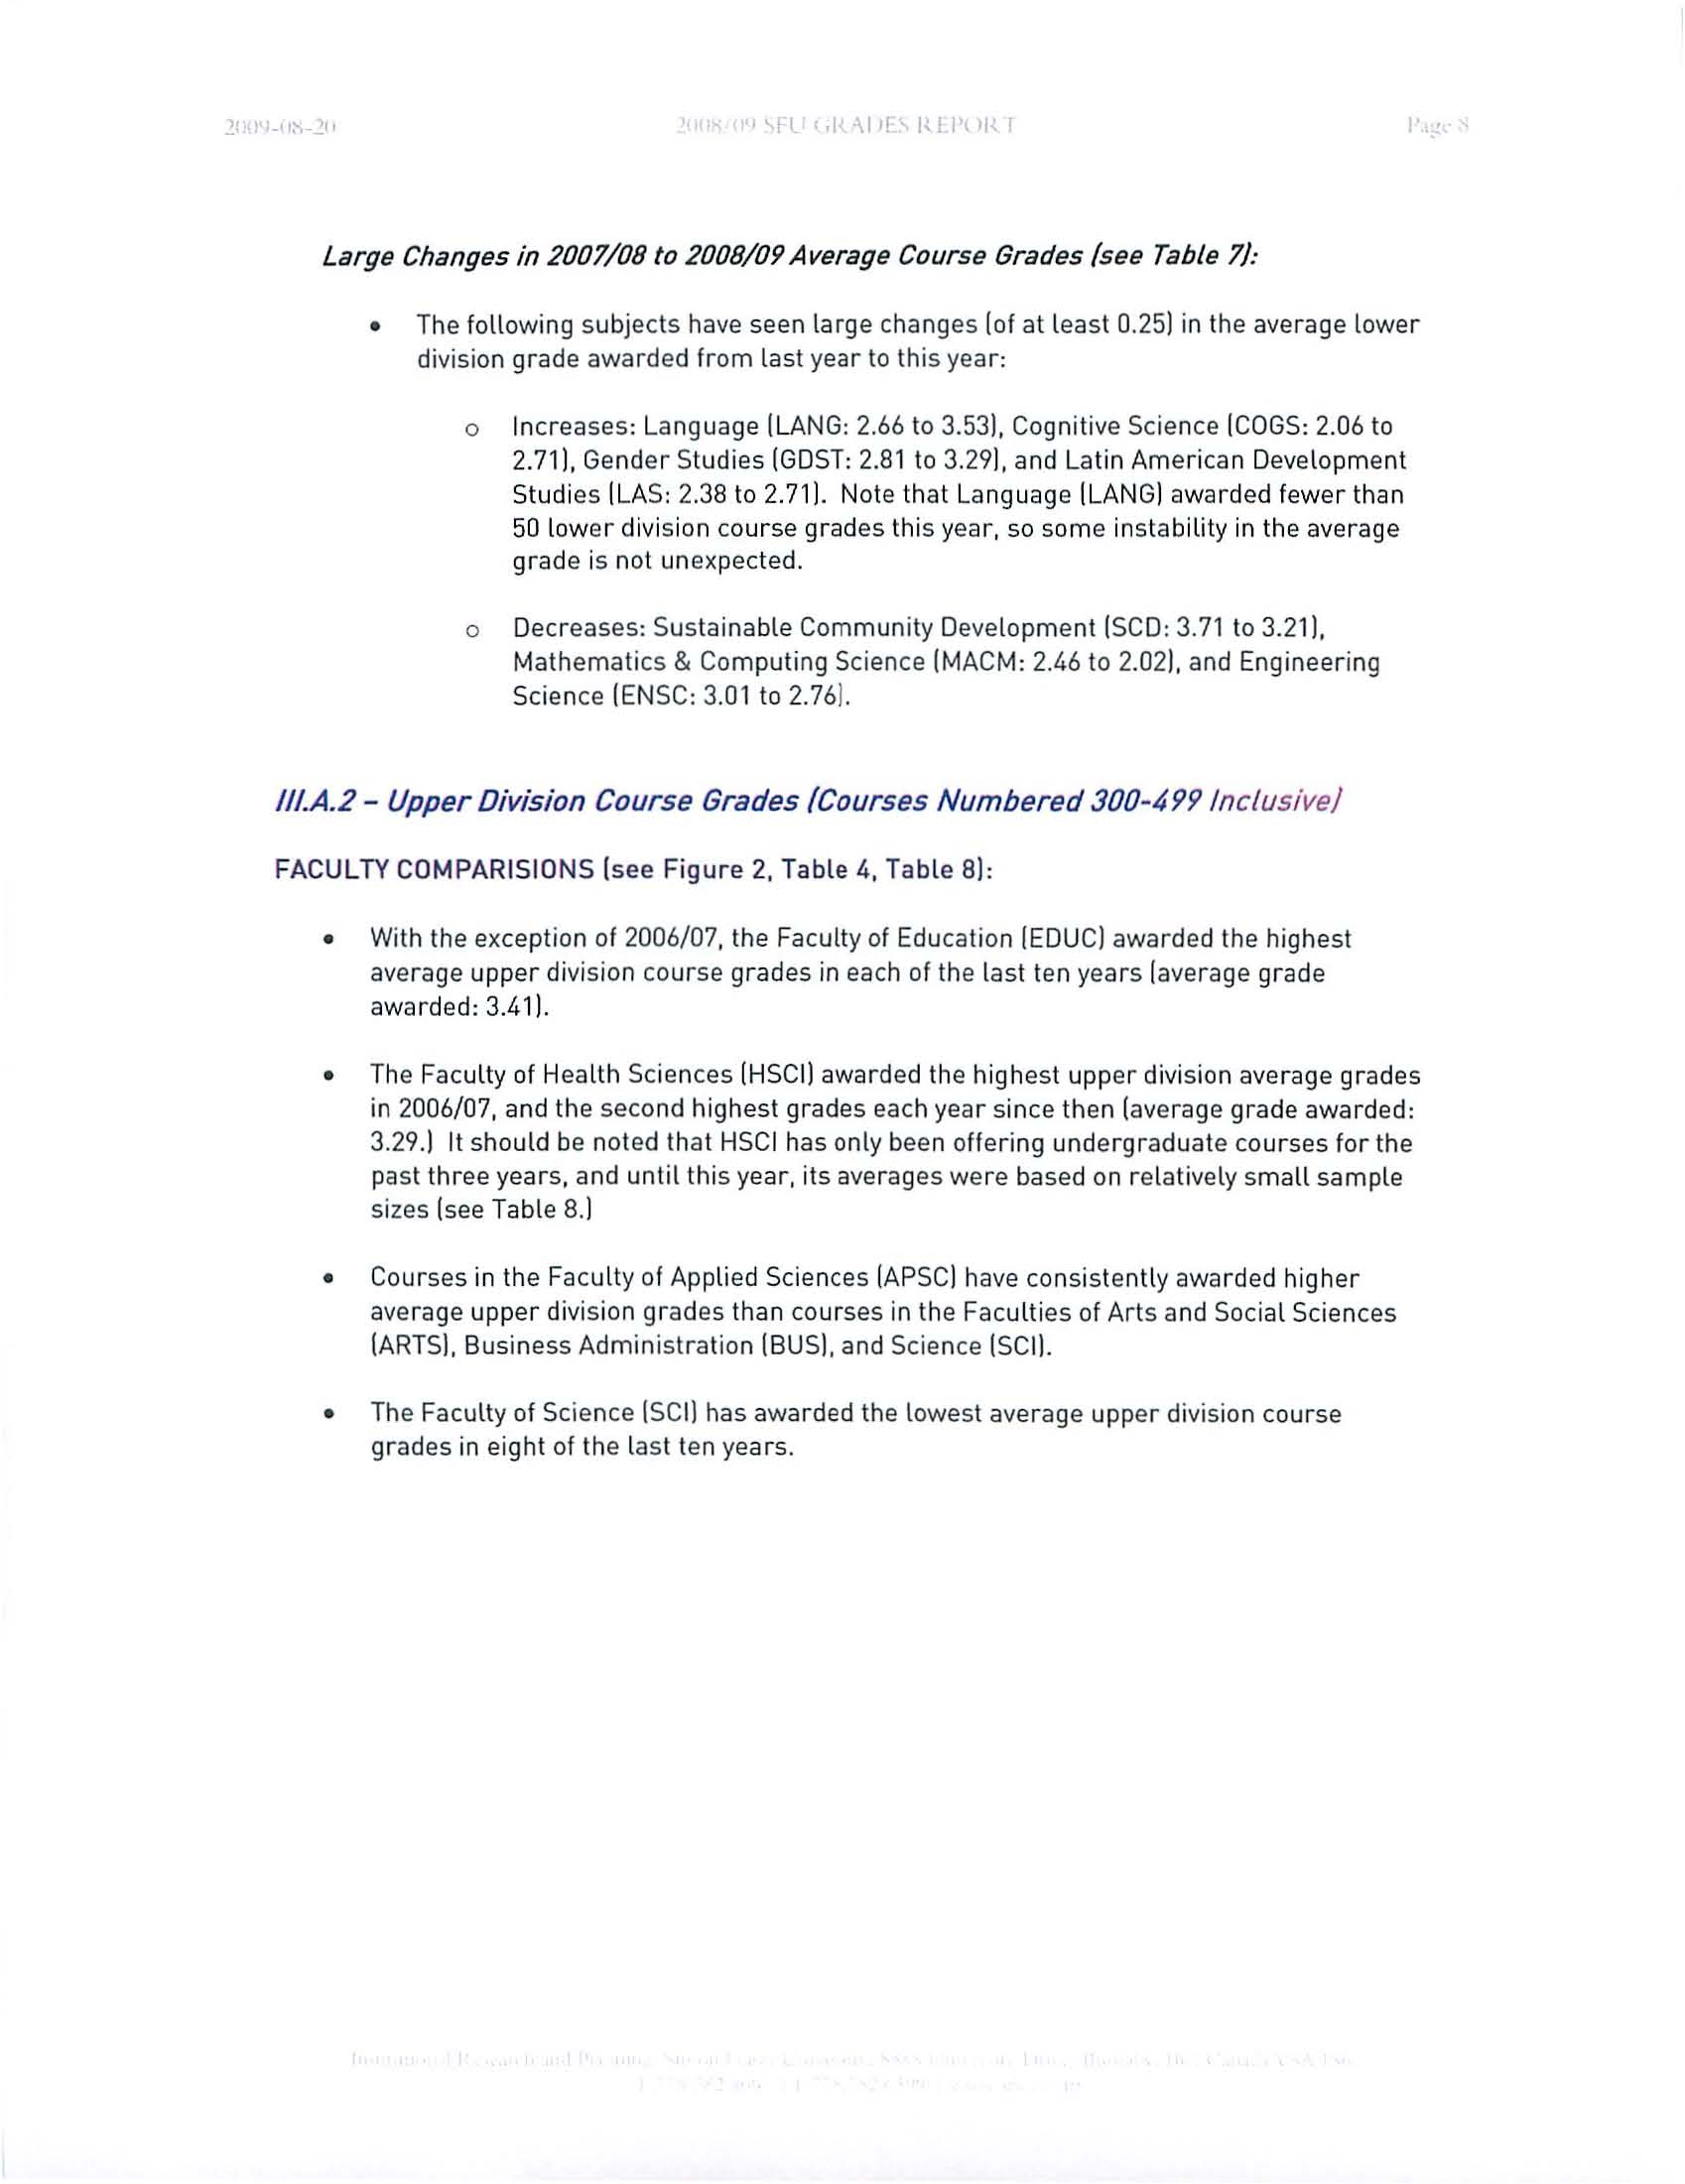
Large Changes
in 2007/08
to
2008/09
Average Course Grades
(see
Table
7/:
•
The
following
s
ubj
ects
ha
ve
seen large c
h
anges
lof
at
l
eas
t 0
.25
1
in
th
e
average lower
division
grade
awarded
from last
yea
r
to this
yea
r:
o
In
c
re
ases:
L
anguage
ILANG
:
2
.
66
to
3.531. Cognit
i
ve Science
ICOGs:
2.06
to
2.711.
Ge
nd
er St
udi
es
IGD
ST: 2.81
to
3.291. and
L
ati
n
Amer
ic
an
Development
Studies
ILA
S: 2.38
to
2
.
711.
N
ote
that
L
a
nguage ILANG)
awarde
d
fewer
than
50 low
er
division
co
urse
grades this year,
so some
in
stab
ility in the
average
grade is not unexpected.
o
Decr
eases
:
Sustaina
bl
e Comm
un
ity
De
ve
lopm
e
nt ISCD
:
3.71
t
o
3.211.
Math
e
mati
cs
&
Com
puting
Science IMACM: 2.46 to
2.02
),
and
Engineering
Science
IENSC:
3.
01 to
2.76
1.
III.A.2
-
Upper Division Course Grades (Courses Numbered
300-499 In
clu
sive/
FACULTY COMPAR
I
SIONS Isee Figure 2, Table 4, Table 81
:
•
With
the
exception of 2006/07,
the Faculty
of
Education
lED
U
C) awarded
the
highest
av
e
rage
upp
e
r
divisi
o
n
cou
r
se grades
in
each
of the last ten
years
l
average
grade
awarded: 3.411
.
• The Faculty of Health
Sciences
IHSCli awarded the highest upper division average grades
in
2006/
07,
and the
seco
n
d
highest grades each year
s
ince
then
l
ave
rag
e
grade awarded:
3.29.
)
I
t
s
hould
be
not
ed t
h
at
H
SC
I h
as only
be
e
n
o
ff
e
ring und
ergrad
u
a
t
e co
ur
ses
for
the
past
thre
e
years,
and
until this
year,
it
s ave
r
a
ges
we
r
e
based
o
n r
e
lati
vely sma
ll
samp
le
sizes
Isee Table
8.)
•
Cou
r
ses
in
the Faculty
of App
li
ed Sc
i
e
n
ces
IAPSC) have
co
n
sisten
tl
y awarded
higher
average upper division
grades
than
courses in
the Faculties of
Arts
and
Socia
l
Sc
i
ences
I
ARTSI.
Business
Adm
in
istra
ti
on
IBUSI. and
Science ISC
II.
•
The
F
acu
lt
y o
f
Science
I
SC
li
has
award
e
d the l
owest
a
v
erage upp
e
r divi
s
i
on course
grades
in
eight
of
the
l
ast
ten
yea
r
s.
]1)1 19-1 IX-21)
TabLe 4: Average Undergraduate Course Grades Awarded and Percentage of "A" Grades
Awarded. by Course FacuLty - Upper Division
Average Course Grades
% nAn Grades Awarded
Course FacuLty
2008/09
10-Year Average
2008/09
10-Year Average
Applied Sciences
3.08
3.10
38.6%
36.7%
Arts and Social Sciences
2.93
2.96
29.5%
29.6%
Business Administration
3.00
2.96
27.2%
25.6%
Education
3.46
3.41
57.0%
54.2%
Health Sciences
3.28
3.29*
46.1%
48.1%*
Science
2.88
2.89
31.2%
31.6%
University Total
3.01
3.01
33.1%
32.4%
* The Faculty of Health Sciences began offering undergraduate classes in the FaLL 2006 term.
LONG-TERM COMPARISONS AND TRENDS WITHIN FACULTIES [see Figure 3):
Comparing
the average upper division grades awarded over the last ten years:
• Applied Sciences [APSC):
o Courses in Resource & Environmental Management (REM) have awarded the
highest average grades.
o Computing Science (CMPT) and Mathematics & Computing Science (MACM)
courses have awarded
the lowest average grades. Note that fewer than
50
upper
division MACM grades have been assigned in courses from the Faculty of Applied
Sciences"
• Arts and Social Sciences (ARTS):
o The highest
upper division grades awarded were in Contemporary Arts [FPA) and
General Studies
(GS).
o Business Administration & Economics (BUEC) courses have awarded grades
considerably
below the Faculty average.
•
Science (SCI):
o The highest average grades have been awarded in Undergraduate Semester in
Dialogue (DIAL), Management & Systems Science (MSSC), Marine Science
(MASC), and Environmental Science (EVSC). Note that MSSC, MASC and EVSC
usually award fewer than
50
upper division grades each year.
o
Mathematics (MATH), Statistics (STAT), and Mathematics & Computing Science
(MACM)
courses have awarded the lowest average upper division grades.
1 In Mathematics
&
Computing Science (MACM), some courses are taught under the Faculty of Applied Sciences, and
others
are taught under the Faculty of Science.
,! I
2(1(1')-11:-,-2(!
CURRENT COMPARISONS AND TRENDS WITHIN FACULTIES:
2008/09 Average Course Grades (see Figure 3J:
• Applied Sciences (APSC):
o The highest average upper division grades awarded in
2008/09
were in
Interactive Arts and Technology (IAT) courses.
o The lowest average course grades were awarded in Mathematics &
Computing Science (MACM). Note that MACM assigned fewer than
50
course
grades in Applied Sciences courses in
2008/09'.
• Arts and Social Sciences (ARTS):
o The highest average grades awarded in
2008/09
were in Explorations (EXPL).
Note that only
13
upper division grades were awarded in Explorations this
year.
o The lowest average grades were awarded in Business Administration &
Economics
[BUEC).
•
Faculty of Science (SCIl:
o The subjects awarding the highest average grades in
2008/09
were
Management & Systems Science
(MSSC), Marine Science (MASC) and
Undergraduate Semester in Dialogue (DIAL). Note that MSSC and MASC
awarded fewer than
50
grades in
2008/09
(see Table
7.)
o The lowest average grades were awarded in Science (SCI), Mathematics
(MATH). Mathematics & Computing Science (MACM), and Nuclear Science
(NUSC: fewer than
50
grades awarded, see Table 7.)
Large Changes in 2007/08 to 2008/09 Average Course Grades {see Table 71:
• The following subjects have seen large changes (of at least
0.25)
this year over last
year's average upper division grade awarded:
o Increases: Nuclear Science
(NUSC:
1.88
to
2.49).
Note that Nuclear Science
awarded fewer than
50
grades in both
2007/08
and
2008/09
[see Table
7),
so
some instability in its average grade is not unexpected.
o Decreases: Cognitive Science
(COGS:
3.75
to
3.22),
Resource &
Environmental Management (REM:
3.49
to
3.16),
and Marine Science (MASC:
4.05
to
3.78J.
Note that very few grades were awarded in Cognitive Science
and in Marine Science [see Table
7.)
")~
"11'1 .... ' t
,l{ -\111
<.:
H. Eh * ,
III
.
A.3
-
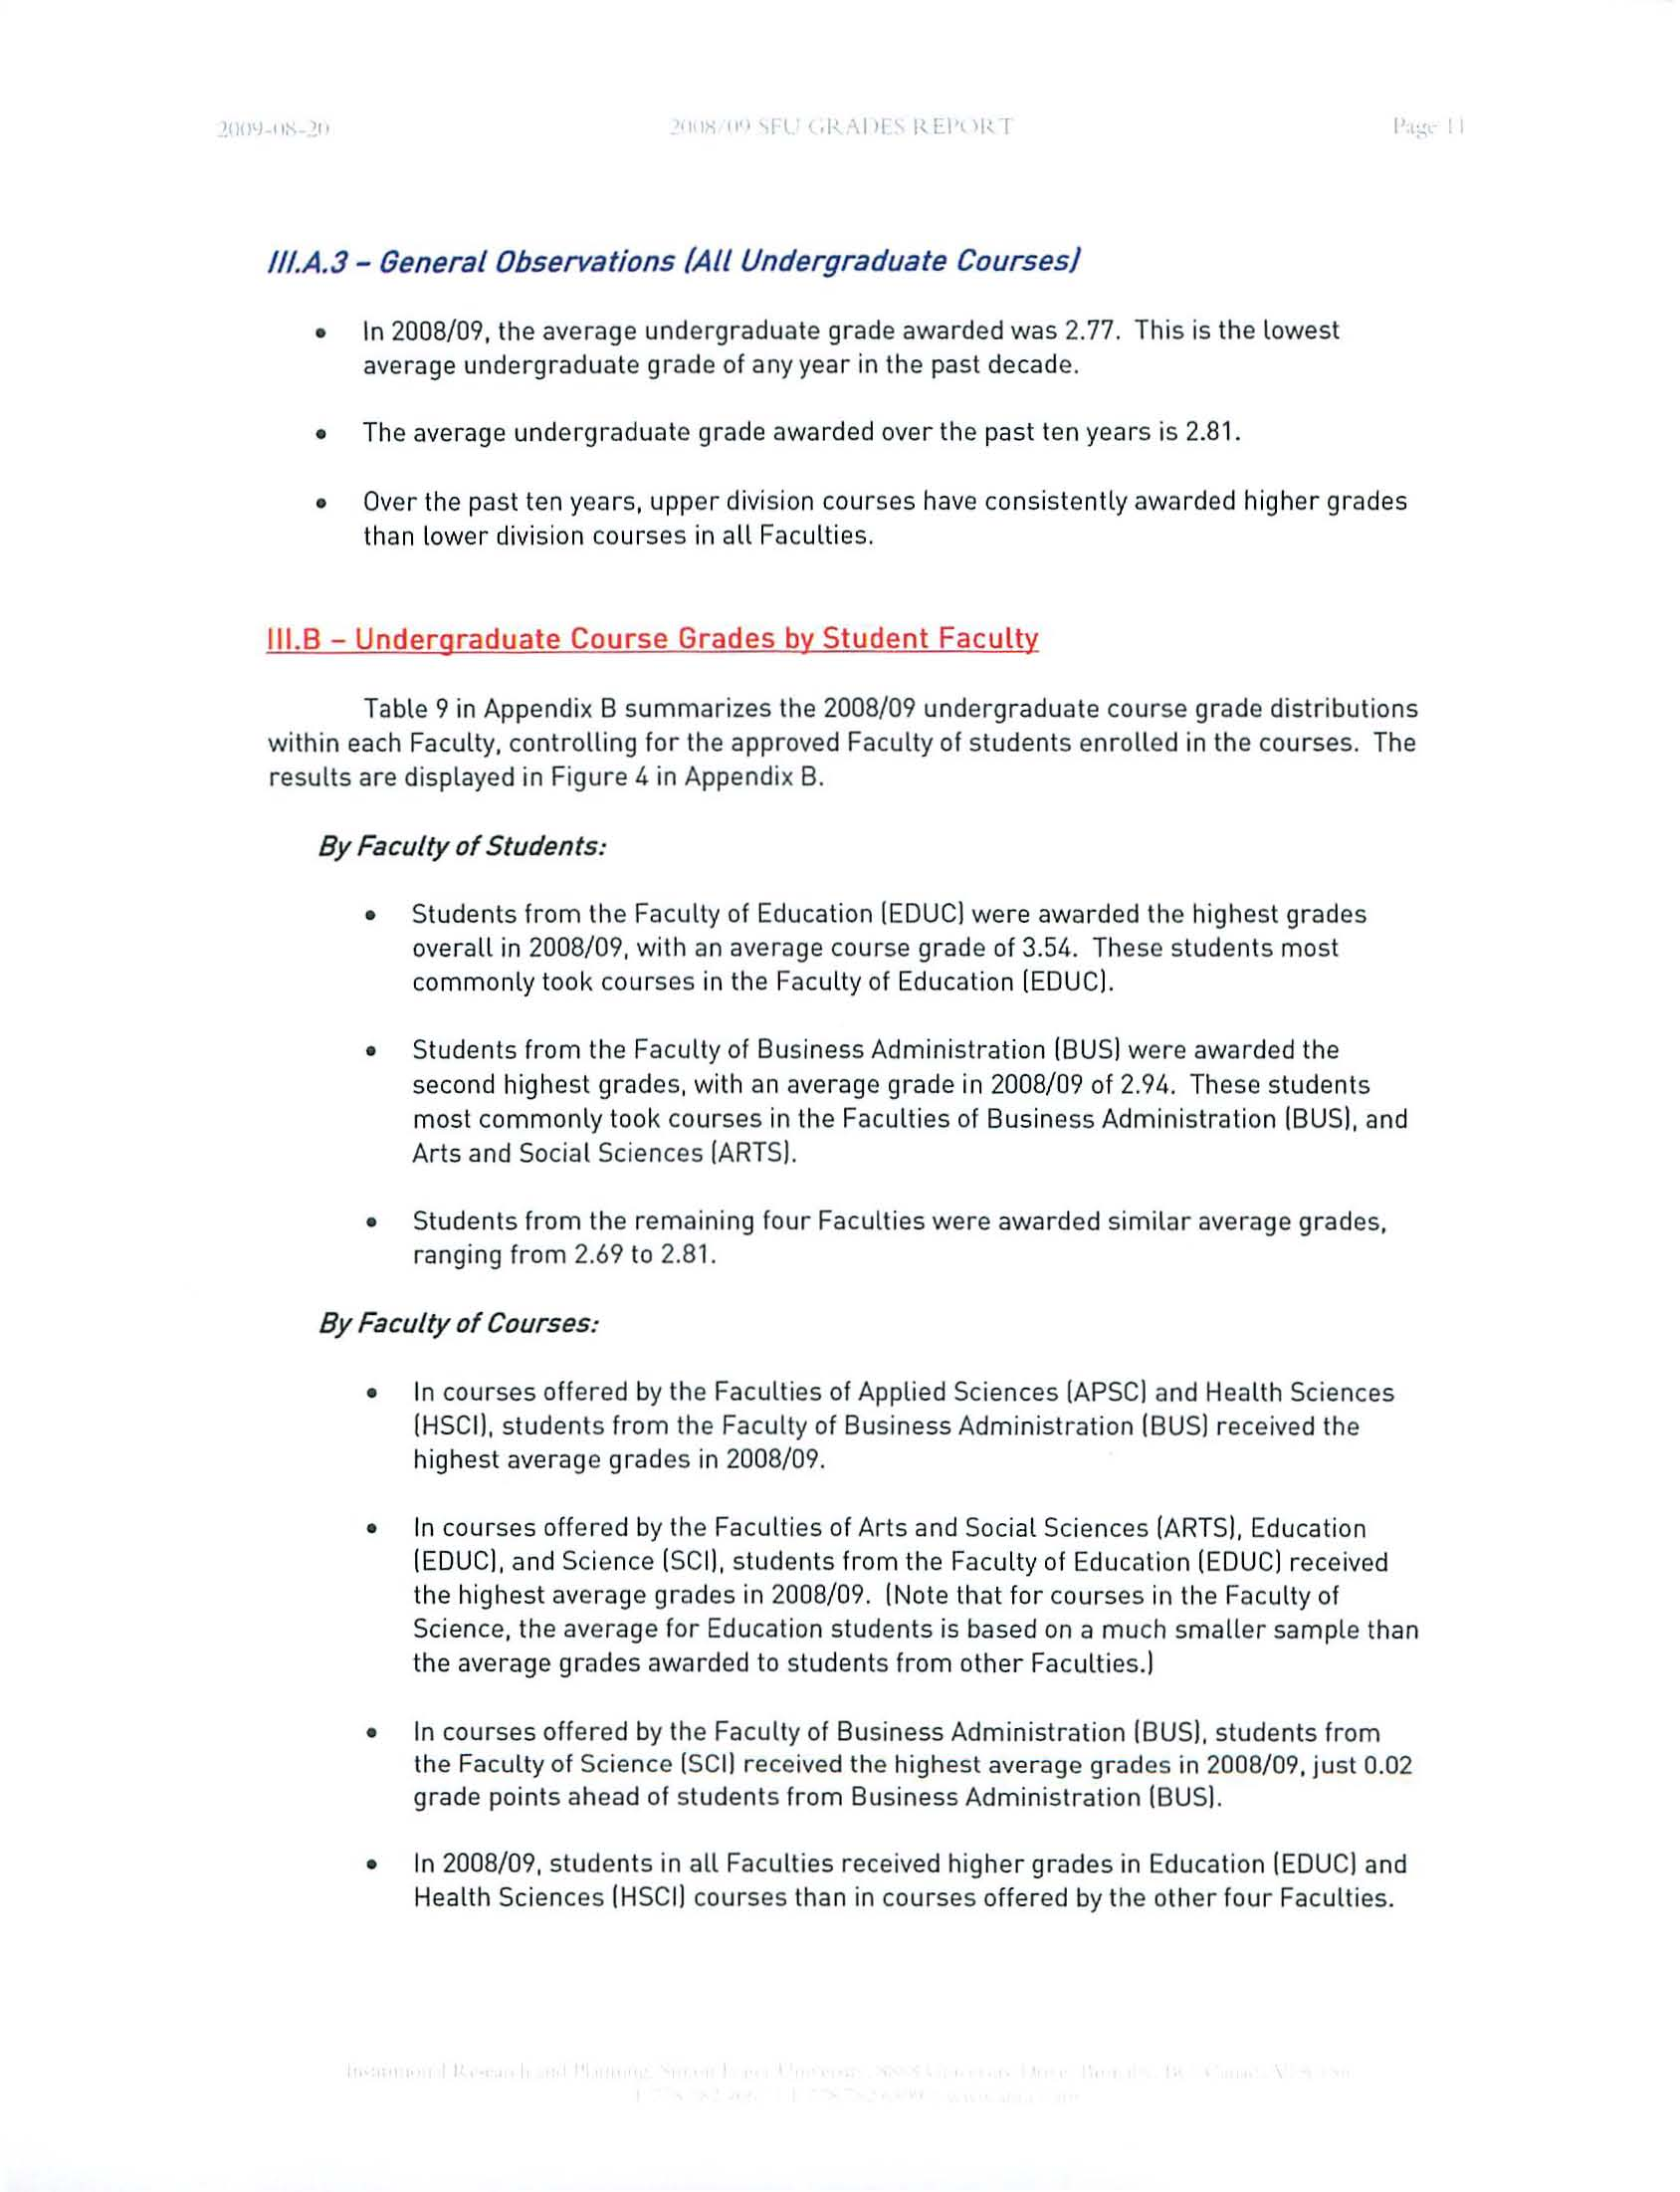
General Observations (All Undergraduate Courses}
•
I
n
2008/09
.
th
e average
und
ergraduate
grade
awarded was
2.77.
This
i
s
the
lowest
average
undergraduate
grade of a
n
y
yea
r in
the past decade.
•
Th
e
average
und
ergrad
uat
e grade awa
rd
ed over
the past ten
yea
r
s
is
2
.
8
1
.
•
Over
the
past
ten
yea
r
s
. upp
er
division
co
ur
ses
have
co
n
s
i
ste
ntly
awarded
high
er
grades
than
lower
division
co
ur
ses
in
al
l
Faculties.
111.8 - Undergraduate Course Grades by Student Faculty
T
ab
l
e
9
in
Append
i
x
B
s
umm
ar
i
zes
the
2008/09
undergraduate
course
grade
d
i
st
r
ibut
i
ons
w
ithin
each
Faculty.
co
n
troll
in
g
for the
app
r
oved
Faculty
of st
ud
e
nt
s enro
ll
ed
in
the cou
rs
es.
The
results a
r
e
displayed in Figure
4
in
Appendix B.
By Faculty of Students
:
•
Students
fr
om
the Faculty
of Education
IEDUCI
were awa
rd
ed
the highest grades
overall
in
2008/09.
with an average course
grade of
3.54.
These
students
most
co
mmonly
took
courses
in the
Faculty of
Education
lEDUC\'
•
S
tud
e
nt
s
from the Faculty
of
Business
Adm
ini
st
r
ation
IBUSI
were awarded
the
seco
nd high
est grades. with an average
grade
in
2008/09
of
2.94.
These students
mo
st
co
mmonl
y
took
co
ur
ses
in the Faculties
of
Bu
siness
Administration
IBU
S
I,
and
Arts and
Social
Sciences IARTS\'
•
Stu
d
e
nt
s
from the
r
e
m
a
ining
four
Facult
i
es were awarded simi
l
ar average grades,
ranging
from
2.69
to
2.81.
By Faculty of Courses:
•
I
n
courses
offered
by
the
Faculties of
App
li
ed Sciences IAPSC
I
and Hea
l
th Sciences
IH
SC
II,
students
from
the
Faculty
of Business Administration IBUSI
received the
highest
average grades
in
2008/09.
•
In
co
ur
ses o
ff
ered
by the Faculties
of A
rt
s a
nd
Social Sc
i
ences
I
AR
T
S
I,
Education
IEDUCI,
and
Sc
i
e
n
ce
ISCII,
st
ud
e
nt
s
fr
om
the Faculty of Education IEDUCI received
the highest
average
grades
in
2008/09.
IN
ote
that for
courses
in the Faculty
of
Science,
the
average for Education students
is based
on a
much
smaller sample than
th
e
a
verage grades awa
rd
ed to st
ud
e
nt
s
from
other
Faculties.1
•
In
courses offered
by
the Faculty of
Business
Administra
tion
IBUS\'
students
from
the
F
ac
ult
y o
f
Sc
i
e
n
ce
(
Se
t! r
ece
i
ved
the
high
est average grades
in
2008/09,
ju
st 0.02
grade
points
ahead of stude
nt
s
f
rom
Business
Adm
in
istrat
ion
IBUS\'
•
In
2008/
0
9,
st
ud
e
nt
s
in
all Facu
lti
es received
higher grades
in
Education IEDUCI
and
Health
Sc
i
ences
IH
SCII courses
than in
cou
r
ses offered by
the
o
th
er four Faculties.
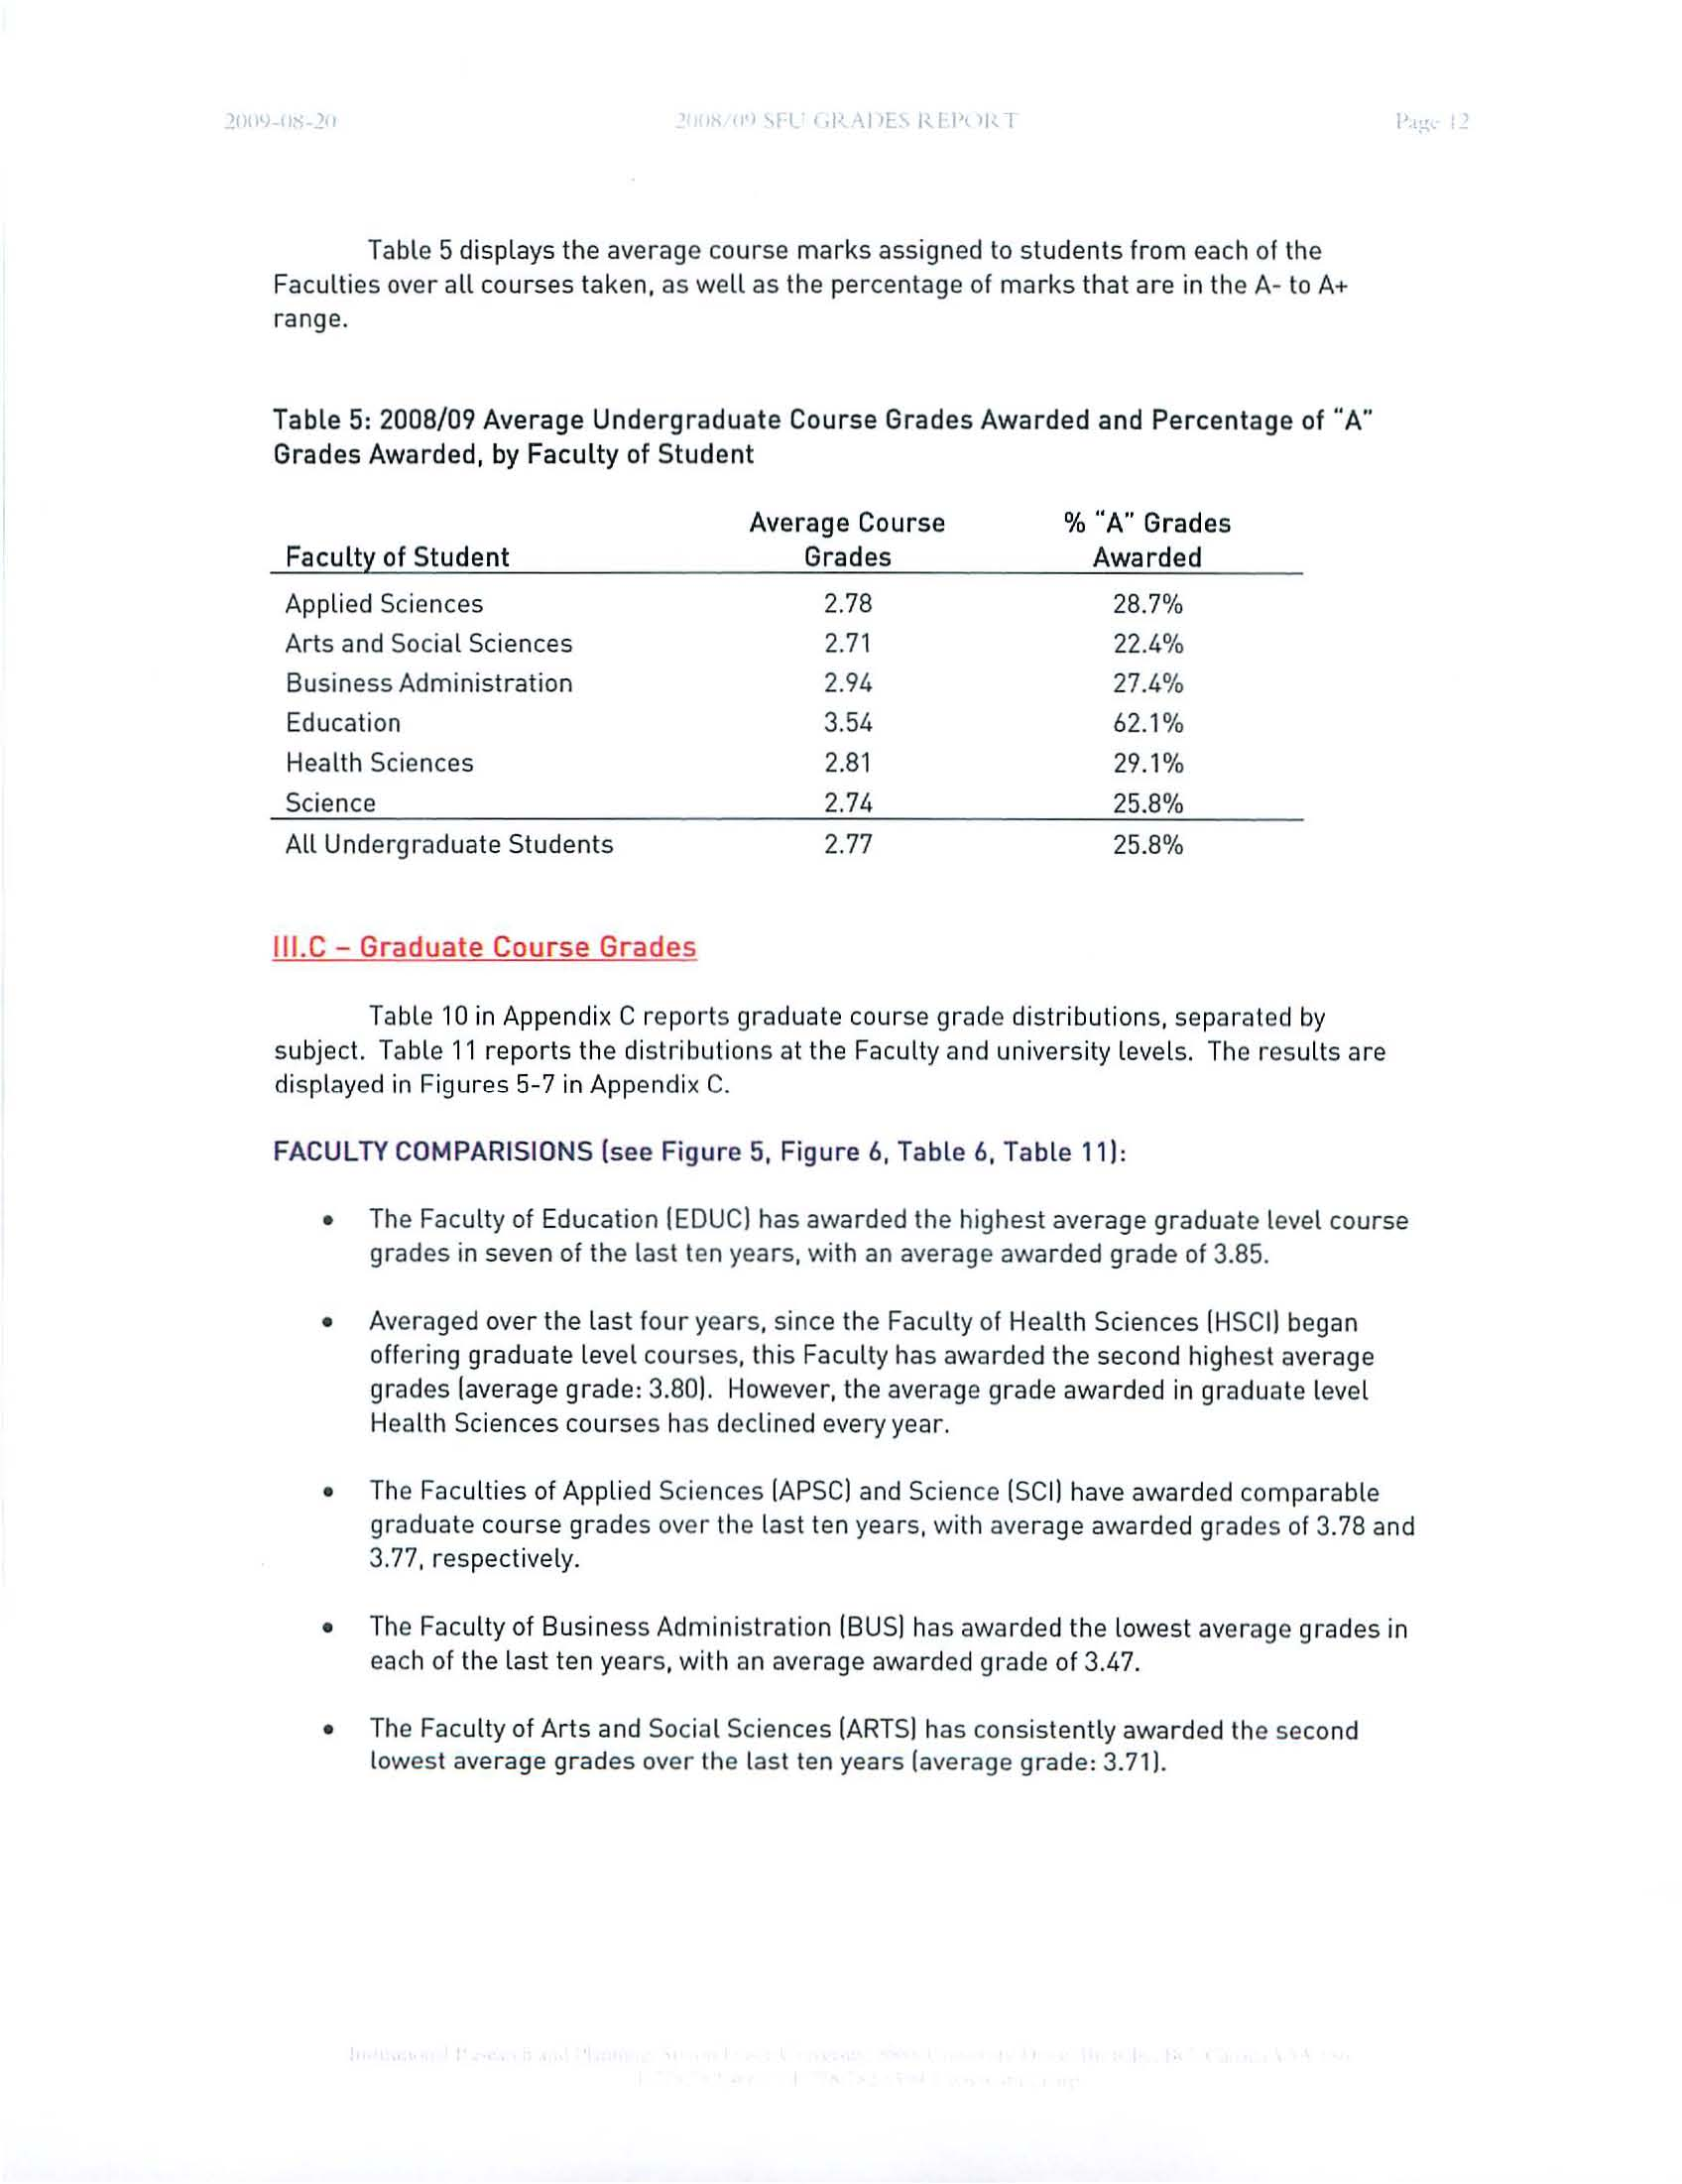
Table 5
displays th
e
average co
ur
se
mark
s
ass
i
g
n
e
d to
s
tud
e
nt
s
from
eac
h
o
f th
e
F
aculties over
all
courses taken,
as
we
ll
as
th
e
p
e
r
ce
n
tage
of
m
arks
that are
in th
e
A- to A+
range
.
Table 5:
2008/09
Average Undergraduate Course Grades
Awarded
and Percentag
e
of "A
"
Grades Awarded, by Faculty of Student
Faculty
of
Student
Applied Sciences
Arts and
Soc
i
al
Sciences
B
usiness Administrat
ion
E
ducation
H
eal
th
Sc
i
e
nces
Scien
ce
A
ll
U
nd
erg
r
a
du
a
t
e S
tud
e
nt
s
III.C
Graduate Course Grades
Average Course
Grades
2.78
2.71
2.94
3.54
2.8
1
2.74
2.77
% "A"
Grades
Awarded
28.7%
22.4%
27.4
%
62.
1
%
29.1%
25.8%
25.8%
Tabl
e
10 in
Appendi
x
C
r
e
p
o
rt
s
g
radu
ate
co
ur
se
grade
distributions,
sepa
r
ated
by
subject.
Table
11
reports the di
s
tribution
s a
t the
F
acu
lt
y a
nd
university
l
eve
l
s
.
Th
e
r
es
ult
s
are
d
i
s
pl
ayed
in Figures 5-7
in
Appendix
C.
FACULTY COMPARISIONS
(
see Figure 5,
Figure 6, Table 6
,
Table 11!:
I'."
•
Th
e
F
ac
ult
y o
f
Edu
cation
(
EDUC!
has
awarded
the
highest average
graduate
l
evel course
grades
in seven
of
the last t
e
n
years
,
w
i
th an average awarded
grade
of 3
.
85
.
•
Averaged
over the
l
ast
f
o
ur
years, since
t
h
e
Facult
y o
f
H
ealt
h
Sciences
(H
SCI
!
began
off
e
ring graduate
le
vel
co
ur
ses,
thi
s
Faculty ha
s
awa
rd
ed
the
seco
nd high
es
t
ave
r
age
grad
es
(a
verage
grade:
3.80
!
.
How
eve
r,
t
h
e average grade awarded i
n
gr
ad
u
a
t
e
l
eve
l
H
ea
lth
Sc
iences
courses
h
as
decl
in
e
d
every
year.
•
The Facu
lti
es of
Appli
ed Sc
i
e
n
ces
[AP
SC
!
and
Sc
i
e
n
ce
(
SC
II
have award
e
d
compa
r
ab
l
e
graduate course grades
over
the last ten
years
,
w
i
th
average
awa
rd
ed grades
of 3.78 and
3.7
7,
r
espec
ti
ve
l
y.
•
Th
e
F
ac
ulty
of
Bu
siness Administrat
i
o
n [BU
S
!
h
as awar
d
e
d the lowest
ave
r
age
grades in
each of
the l
ast
te
n
years
,
with
a
n
average
awa
rded
grade of 3.47.
•
Th
e
Fac
u
l
t
y of A
rt
s and
Soc
i
a
l
Sc
i
e
nce
s
(
AR
T
S
! h
as co
n
s
i
s
tentl
y
awa
rd
e
d th
e seco
nd
t
owest ave
r
age
grades over
th
e
t
ast ten years [average g
r
ade:
3
.
71
J.
TabLe 6: Average Graduate Course Grades Awarded and Percentage of "A" Grades Awarded,
by Course Faculty
Average Course Grades
% "A" Grades Awarded
Course Faculty
2008/09
1 O-Year Average
2008/09
10-Year Average
Applied Sciences
3.84
3.78
86.1%
82.7%
Arts and Social Sciences
3.69
3.71
78.3%
78.9%
Business Administration
3.47
3.47
50.2%
50.3%
Education
3.88
3.85
88.6%
88.2%
Health Sciences
3.76
3.80*
83.9%
83.5%*
Science
3.83
3.77
84.9%
80.3%
University TotaL
3.70
3.68
74.6%
72.2%
* The FacuLty of HeaLth Sciences began offering graduate classes in the Fall 2005 term.
LONG-TERM COMPARISONS AND TRENDS WITHIN FACULTIES (see Figure 7):
Comparing the average graduate course grades awarded over the
Last ten years:
• Applied Sciences (APSC):
o Resource & Environmental Management (REM) and Communications (CMNS)
have awarded
the highest average grades.
o Engineering Science
(ENSC) has awarded the lowest average grades.
• Arts and SociaL Sciences [ARTS):
o
Criminology (CRIM), Psychology (PSYC). and Linguistics [LING) have awarded
reLatively high average grades
over the past decade. Note that Linguistics (LING)
awarded
fewer than
50
upper division grades each year.
o Economics
(ECON) and Applied Legal Studies (ALS) have awarded reLatively low
average grades. Note that Applied Legal Studies (ALS) only began offering
graduate Level courses
this year.
•
Science (SCI):
o Molecular Biology & Biochemistry (MBB) has awarded the highest average
grades.
o
Physics [PHYS) has awarded the lowest average graduate course grades.
CURRENT COMPARISONS AND TRENDS WITHIN FACULTIES (see Figure 7):
2008/09 Average Course Grades (see Figure
7/:
• Applied Sciences (APSC):
o The highest average grades awarded in
2008/09
were in Resource &
Environmental Management [REM) and Communications [CMNS).
o Computing Science (CMPT) awarded the Lowest graduate course grades this
year.
• Arts and Social Sciences (ARTS):
o The highest average grades were awarded in Psychology (PSYC),
Archaeology (ARCH: fewer than 50 grades assigned), and Criminology
(CRIM).
o The lowest average grades were awarded in Applied Legal Studies (AlSI and
International Leadership (Mil). Note that the average grade in MIL is based
on a very small sample size (see Table 10.)
•
Science (SCIl:
o The highest average grades in 2008/09 were awarded in Molecular Biology &
Biochemistry (MBB), Biological Sciences (BISC), and Applied &
Computational Mathematics (APMA:
small sample size.)
o The lowest average course grades were awarded in Actuarial Mathematics
(ACMA). Note that average grades in ACMA courses are based
on small
sample sizes (see Table 10.)
Large changes in 2007/08 to 2008/09 Average Course Grades {see Table 10/:
• The following subjects have seen large changes (of at least 0.25) in the average
graduate grade awarded from last year to this year:
o
Increases: Archaeology [ARCH: 3.75 to 4.02). Note that this subject has awarded
fewer than
50 lower division course grades in each year, so some instability in
the average grade is not unexpected.
o Decreases: International Leadership
(MIL: 3.72 to 2.78), Actuarial Mathematics
(ACMA: 3.81 to 3.40], French (FREN: 4.00 to 3.72), and Contemporary Arts (FPA:
3.93 to 3.67). Note
that the average grades for all of these subjects are based on
very small sample sizes (see Table 10), so a certain amount of instability is not
unexpected.
GENERAL
OBSERVATIONS:
• In 2008/09, the average graduate grade awarded was 3.70. Although this is slightly lower
than last year, the average graduate grade awarded at the university has been
generaLLy
increasing since 2001/02.
•
The average graduate grade awarded over the past ten years is 3.68.
....
-"
SIMON FRASER UNIVERSITY
THINKING OF THE WORLD
FACULTY OF HEALTH SCIENCES
OFFICE OF THE DEAN
DATE:
TO:
FROM:
RE:
MEMORANDUM
February 14, 2011
Jon Driver, Vice President Academic
Mario Pinto, Vice President Research
John
O'Neil,
Dean,
Faculty of Health ScienM
Gniding
Policy
in PHS
)I \
FEB 1 7 2011
I am responding to Senator Black's question regarding apparent grade inflation
in
FHS
courses. Senator Black has identified an important issue that FHS has addressed with the
development and ratificaiion
of the attached ''FIlS Grading Policy" document. It is useful
to
remember that FRS was created in late 2004 and although faculty had yet to be hired,
programs were still to
be
designed and courses
had
yet to be developed, we began
to
admit
students
in
fall 2005. PHS has met this cballenge with extraordinary success. Five years
later we exceed our enrollment targets with approximately 1200 students enrolled as FHS
majors and our admission requirement from high school has risen from 75% to 88% this
year. However this success has not come without growing pains. Nearly two
thirds
of our
faculty members are pre-tenure
in
their first teaching experience. The field of population
health is normally taught at
the
graduate level and our faculty have had to develop
undergraduate courses for
which there are
few
precedents in Canadian or US universities.
In the context of these challenges it
is
not at all surprizing that
our
faculty members have
required
some time to calibrate grading standards
in
their courses. However the trend is
encouraging. The percentage of A's
in
lower division courses fell from 44.4%
in
06107
to
34.5%
in
09/10.
Similarly the average course grade fell over
this
same period from 3.29
to
3.04. Data on upper division courses is probably not useful because upper division courses
in PHS are only now becoming fully enrolled.
. Nonetheless,
we fully appreciate Senatorts Black's concerns and we continue to work with
our faculty members to ensure that the guidelines outlined
in
the PHS Grading Policy
document
are implemented.
Blusson Hall, Office of the Dean. Room 11300
8888
University
Drive.
Burnaby.
Be
VSA IS6
Phone:
778-782-4821
Fax: 778-782-5927
. .
Version 4 - Ratified by Faculty Council May 31,2010
FHS Grading Guidelines
Rc:!lationship of these Guideline'S to SFLJ Policy
This document is based on SFU policy T 20.01. If these gradine guidelines are determined to be
inconsistent with this or other SFU policies, then SFU policy shall in all cases prevail.
Reason for these Guidelines:
Over the past four years the program chairs in FHS have had to deal with
a
number of grading issues, in
some cases this has required (on consultation with the instructor) changing a large number of grades.
Most of these issues appear to stem from differences in understanding as to the meaning of grades and
relative revels of inexperience in regard to assessment tools. The problems are two-fold: a) providing
grades that are scaled too high (i.e., too many A+'s, etc.); and b) not submitting grades in a timely
manner.
At SFU Program Directors/Chairs and the Dean are charged with overseeing and grading practices and"
approving grades. Yet within the Faculty there are no clear procedures, guidelines or processes for
doing so. It is the purpose of this document to produce clear and transparent guidelines an"d procedures
for giving grades and managing conflicts over grades.
The purpose of this guideline to: a) to provide information to faculty (tenure-track, lecturers, sessionals,
TAs,
etc.) regarding grading guidelines and grade distributions; and b) to provide a clear process for and
guidance to Program Directors and the Dean in managing grading issues.
Principles Governing these Guidelines:
Grades are very important to students. They provide information on how a student performed in a
course, and provide a metric used by others to gauge a student's performance in relationship to other
students. Marking and assessment schemes should convey to students detailed information about their
performance, where they did well, and where they did not do as well.
Grading should ideally provide an accurate, reliable and fair way of representing performance in a
course, and it must be understood to do so by students. Grade distributions should be consistent for
the same course across terms, and generally consistent for courses offered at the same level across the
Faculty. Students should have confidence that the instructor has been thorough and accurate in marking
and recording at every stage of the evaluation process.
Grades are especially meaningful to those who evaluate student performance outside of the course and
Faculty. Admissions committees, fellowship/scholarship committees, granting councils, financial aid
offices, etc. must have the same level of confidence in grading that the student should have about
accuracy, reliability, and fairness. Remember that a reputation for grading too high, which can spread
very quickly within and across Universities, can have serious negative consequences for our students.
-1-
Version 4 - Ratified
by
Faculty Council May 31, 2010
Marks
and
grades
must be confidential.
While
fa~ulty
autonomy in marking is an Important standard, and will be respected in nearly all cases, in
the end such autonomy must be balanced against the principles articulated here.
Course Requirements and Evaluation/Assessment Procedures:
As is noted in FHS' Syllabus Policy, and in SFU Policy T 20.01, instructors must be very clear
abou~
how
they intend
to assess student performance. At minimum, the following elements must be distributed to
students prior
to the beginning of a course:
• A statement of course
objectives
• A linking of course objectives to relevant core competencies (primarily for MPH courses)
• A list of required readings and other course materials
• An indication of how and when students can have access to the instructor(s)
• Identification of all course requirements that will be assessed, and how this assessment
will be undertaken
• The manner in which marks will be used to determine the final grade (may be
distributional, a fixed scale, or a combination of the two)
• A qualitative statement describing the key differences between, A, S, C, and etc., for
major assessments or coursework
• Reference to important SFU policies defining and addressing academic dishonesty and
student misconduct
Instructor
Responsibilities:
Instructors should ensure that students receive timely feedback on assignments submitted for marking.
Assessments
of work should be clear and meaningful to students: they should understand why they
received a particular mark, and
what they can do, or could have done, to improve it.
Instructors must comply with University and Faculty regulations regarding submission
of final grades to
the Graduate or Undergraduate Program Director. Generally-speaking, final grades must be submitted
within
96 hours of the end of the final examination period. Because marks are needed for students who
intend
to graduate, for financial aid purposes, or, on the graduate level, for students hoping to compete
for fellowship or scholarship awards, timely submission of grades is especially important.
Final grades should not be released
to
students be/ore these grades have been approved
by
the
relevant Program Director.
The Faculty of Health Sciences Grading System:
Consistent with SFU policy, FHS uses a letter grading system ranging in half-steps from A+ to C-, D, and F.
No percentage grades are reported externally
to
a
course.
It is up to an instructor whether s/he
chooses
to release percentage marks to students during the course. We advise against it, unless the
-2-
. .
Version 4 - Ratified by Faculty
C~uncil
May 31, 2010
instructor is very confident that the course marks will produce a distribution that is consistent with the
guidelines provided below. Instead,
we advise instructors
to
release interim marks as letter grades.
Some Universities and Programs have chosen to implement policies mandating specific grading
distributions. [For example, at York University the following
rule applies:
(Ina
more than 65% of grades
may be higher than C+, and usually not more than 10% of erades can be A's".] In FHS we prefer to
provide
guidelines
or
rules of thumb
for the distribution
of
grades that are given in
a
particular class,
taught at a particular lev!;!1. These guidelines should not be interpreted as mandating the scaling of
grades. In FHS we consider the question of whether or not to scale or curve grades to be the faculty
member's prerogative.
A
Rule of thumb
In the Appendix we cite two widely used, and detailed, distributional schemes, one from the University
of Washington and one from the University of Alberta (Table 1). In the far right column of the table we
also
list
actual
SFU grading distributions for 1998-2008 (for undergraduate students), and 2002-2008
(for graduate students). See http://www.sfu.ca/irp/Students/gradesreport/index.htmlfor the SFU
Grading Report. These schemes are
useful
as a reference point when thinking about final grades, but
since
they show means from many courses rather than variability, they have limitations for applying to
individuaJ courses. In general, the more important figure
is
the median grade given in a class. In most
public,
~omprehensive
universities like SFU (i.e., who admit a more academically diverse range of
students than would be the casein elite research/U.S. private institutionsL students in lower division
courses receive a median grade
of B- or B; in upper division courses a median grade of B or B+; and in
graduate courses a median grade
of B+ or A-.
For undergraduate courses, the following rule of thumb accommodates diverse grade
distributions but achieves the Faculty's objective:
Lower division
(100- and 200-level) undergraduate courses should, in general, have no more
than
5% A+'s, and the median letter grade should be a 8-/B. Upper division (300- and 400-level)
undergraduate courses should in general have no more than 8% A+'s, and the median letter
grade should be a B/B+, or
it
might be a bit higher
(B+/A-)
for some 4th year seminars.
Note that SFU tends to grade higher in graduate programs than many other institutions. This may be an
artifact of SFU's small graduate program, with relatively few professional programs. Many professional
programs (e.g., Business) tend
to use a wider grade distribution than do research programs.
As
we build
our own research programs we'll want to. keep this in mind. A median grade of A-/A for courses at the
Masters level
is probably typical but for the MPH a median of B+/A- may be a better target.
As stated
above~
we do not intend this guideline
to
imply
that instructors are required
to
implement a
strict system of scaling or "curving."
We would expect that once instructors have taught a course a few
-3-
Version 4 - Ratified
by
Faculty Council May 31, 2010
times and developed assignments, marking schemes, and rubrics appropriate to the level of the course
and
difficulty-of material, they will naturally achieve a meaningful distribution of grades which is
approximately consistent with the guideline. However, if an instructor is using a new assignment or
marking scheme, s/he may wish to use a scaling system until the new scheme is adequately calibrated.
You should tell students in advance that you are doing this.
In any case, we recommend that instructors think carefully before they provide an absolute grading
scheme in
their syllabi. An alternative is to use qualitative descriptors and a statement that grades will
be distributed appropriate to the level of the course. For
e~ample,
an instructor may sketch out what an
A+, A, etc. grad,e would mean in. their class with regard to specific assignments, in-class activities, etc.
Qualitative descriptors
can be found in the first column of Table 1 in the Appendix. An instructor may
also wish
to indicate that
"In
accordance with SFU practice, I expect that the median grade given in this
class will be _
"
Responsibilities of Program Directors:
At SFU
it
is the responsibility of Chairs/Program Directors to approve all grades before they are
submitted
to the Registrar. If a grading distribution deviates significantly from the distributions listed
belo.w, especially at the upper levels of the distribution, the Director may consult with an instructor to
discuss the distribution before issuing an approval. This discussion
will aim to produce an agreement
between
the Director and the instructor with regard to the distribution of grades. If this discussion does
not produce
an agreement, and in accordance with SFU policy T 20.01, the Director may refuse to issue
an approval. In this case the matter goes to the Dean for deliberation and final decision.
At
the end of the semester, if the grade distribution does not conform to these guidelines (see box on
page
3), the instructor may wish to seek a resolution that may involve scaling or rescaling grades before
submitting
the grades for approval. An instructor may also make a case (to the Directors of
Undergraduate or Graduate Studies who approves grades) for a different distribution if there is a really
good reason for it.
Waiver of Grade Distribution Targets
Before the beginning
of the semester (and prior to the publication of a course outline), instructors may
apply in writing
to the undergraduate or graduate studies committee (as appropriate) for a waiver of the
grade distribution targets specified in this guideline for pedagogical or other reasons. The written
application
should state the rationale for the waiver and the proposed alternative grade distribution
target for
the course (if any). The committee will vote to approve or not such requests.
-4-
. ,
Version 4 - Ratified by Faculty Council May 31, 2010
Appendix
Table 1: SFU Mean Grade Distributions with Peer Comparisons
r---
._--
-
-----~
-
!-----
---r----
Percent of Class
U Alberta (UA Senate.
U
Washil1~ton
SFU Distribution (10
Prescribed Policy)
(general guidelines;
yrs avg for llndergrad;
widely cited
~cr~ss
6 yrs avg for Grad)
the U.S.)
Lower division: B./8
Lower division:
B~
Lower division: B-/8
Median Grades
Upper division: B to B+
Upper division: B
Upper division: B to B+
Graduate: A- to 8+
Graduate: B+
Graduate: A to A-
Lower division: 12%
Lower division: 8%
Lower division: 11%
UNo
more than._% A's" (i.e., A's and A+'s) Upper division: 18%
Upper division: 12%
Upper division: 17%
Graduate: 30%
Graduate: 17%
Graduate: 51%
Qualitative Descriptor
(this Is an
Grade
example only, drawn from the U
Alberta and U Washington
documents)
Excellent. Superior performance in
lower division: 5%
[No
A+
glTldes are
lower division: 3%
A+
all elements of the course. A+
=
Upper division: 7%
given at UWj
Upper division: 4%
work exemplifying the highest
Graduate: 15%
lower division: 8%
Graduate: 12%
quality possible. Unquestionably
Lower division: 7%
Upper division: 12%
Lower division: 8%
A
prepared for subsequent courses in
Upper division: 11%
Graduate: 17%
Upper division: 13%
field.
Graduate: 15%
Graduate: 39%
Superior performance in most
lower division: 11%
Lower division: 10%
lower division: 10%
A-
aspects of the course.
Upper division: 16%
Upper division: 14%
Upper division: 15%
Unquestionably prepared for
Graduate: 15%
Graduate: 21%
Graduate: 22%
subsequent courses in field.
Good. High quality performance in
lower.division: 13%
Lower division: 12%
Lower division: 14%
B+
all or most elements of the co urse.
Upper division: 16%
Upper division: 16%
Upper division: 17%
Very
good chance of success in
Graduate: 17%
Graduate: 25%
Graduate: 15%
subsequent courses.
High quality performance in some of
Lower division: 15%
Lower division: 14%
lower division: 15%
B
the course; satisfactory in others.
Upper division: 17%
Upper division: 18%
Upper division: 17%
Good chance of success in
Graduate: 16%
Graduate: 22%
Graduate: 8%
subsequent courses.
Satisfactory performance in the
Lower division: 14%
lower division: 16%
lower division: 13%
course. Evidence of sufficient
Upper division: 13%
Upper division: 15%
Upper division: 12%
B-
learning to succeed in subsequent
Graduate: 10%
Graduate: 12%
Graduate: 2%
courses. At the graduate level, this is
typically the minimally acceptable
grade.
Satisfactory performance in most of
lower division: 11%
Lower division: 14%
Lower division: 12%
the course, with the remainder
Upper division: 8%
Upper division: 9%
Upper division: 8%
being somewhat substandard.
Graduate: 7%
Graduate: 3%
Graduate: 1%
C+
Evidence of sufficient learning to
succeed in subsequent courses, with
effort. At the graduate level, this is
an unacceptable (failing) level of
performance.
Evidence of some learning, but
Lower division: 9%
Lower division: 9%
Lower division: 10%
generally marginal performance.
Upper division: 6%
Upper division: 7%
Upper division: 6%
C
Marginal chance of success in
Graduate: 2%
Graduate: 0%
Graduate: 1%
subsequent courses. At the
graduate level, this is an
unacceptable (failing) level of
-5-
..
•
4
Version 4 - Ratified by Faculty Council May 31, 2010
performance.
Poor. Minimal learning and
lower division: 5%
lower division: 5%
lower division: 6%
substandard performance
Upper division: 3%
Upper division: 3%
Upper division: 3%
throughout the course. Doubtful
Graduate: 1%
Graduate: 0%
Graduate: 0%
C-
cnance of success in subsequent
courses.' At the graduate level, this is
an unacceptable (failing) level of
performance .
.
Poor. Minimal learning and low
Lower diVision:
4%
Lower division: 4%
(Grade not given]
quality performance. Doubtful
Upper division: 2%
Upper division: 2%
D+
chance of success in subsequent
Graduate:
0%
Graduate: 0%
courses. Grade not given at the
graduate level.
Poor. Very minimal learning and
lower division: 2%
Lower division: 2%
lower division: 4%
very low quality performance in all
Upper division: 1%
Upper division:
1%
Upper division: 2%
D
aspects of the course. Highly
Graduate: 0%
Graduate: 0%
Graduate: 0%
doubtful chance of success in
subsequent
courses. Grade not
given at the Naduate level.
n/a
[Grade not given]
Lower division:
2%
[Grade not given]
D-
Upper division: 1%
Graduate: 0%
Failure. Complete absence of
Lower division: 4%
Lower division: 4%
Lower division: 6%
evidence of learning. Totally
Upper
division: 1%
Upper division: 1%
Upper .division: 3%
F
unprepared for subsequent
courses.
Graduate: 1%
Graduate: 0%
Graduate:. 1%
At the graduate level, this grade
would
be
assigned
for incomplete
work or academic dishonesty.
-6-