SIMON FRASER UNIVERSITY
MEMORANDUM
0
TO:
Senate
FROM:
J. H. Waterhouse, Chair,
Senate Committee on Enrollment Man
SUBJECT:
Undergraduate Admission Targets for
S.06-36
4
DATE:
February 17, 2006
Action undertaken by the Senate Committee on Enrollment Management and Planning
(SCENT) gives rise to the following motions:
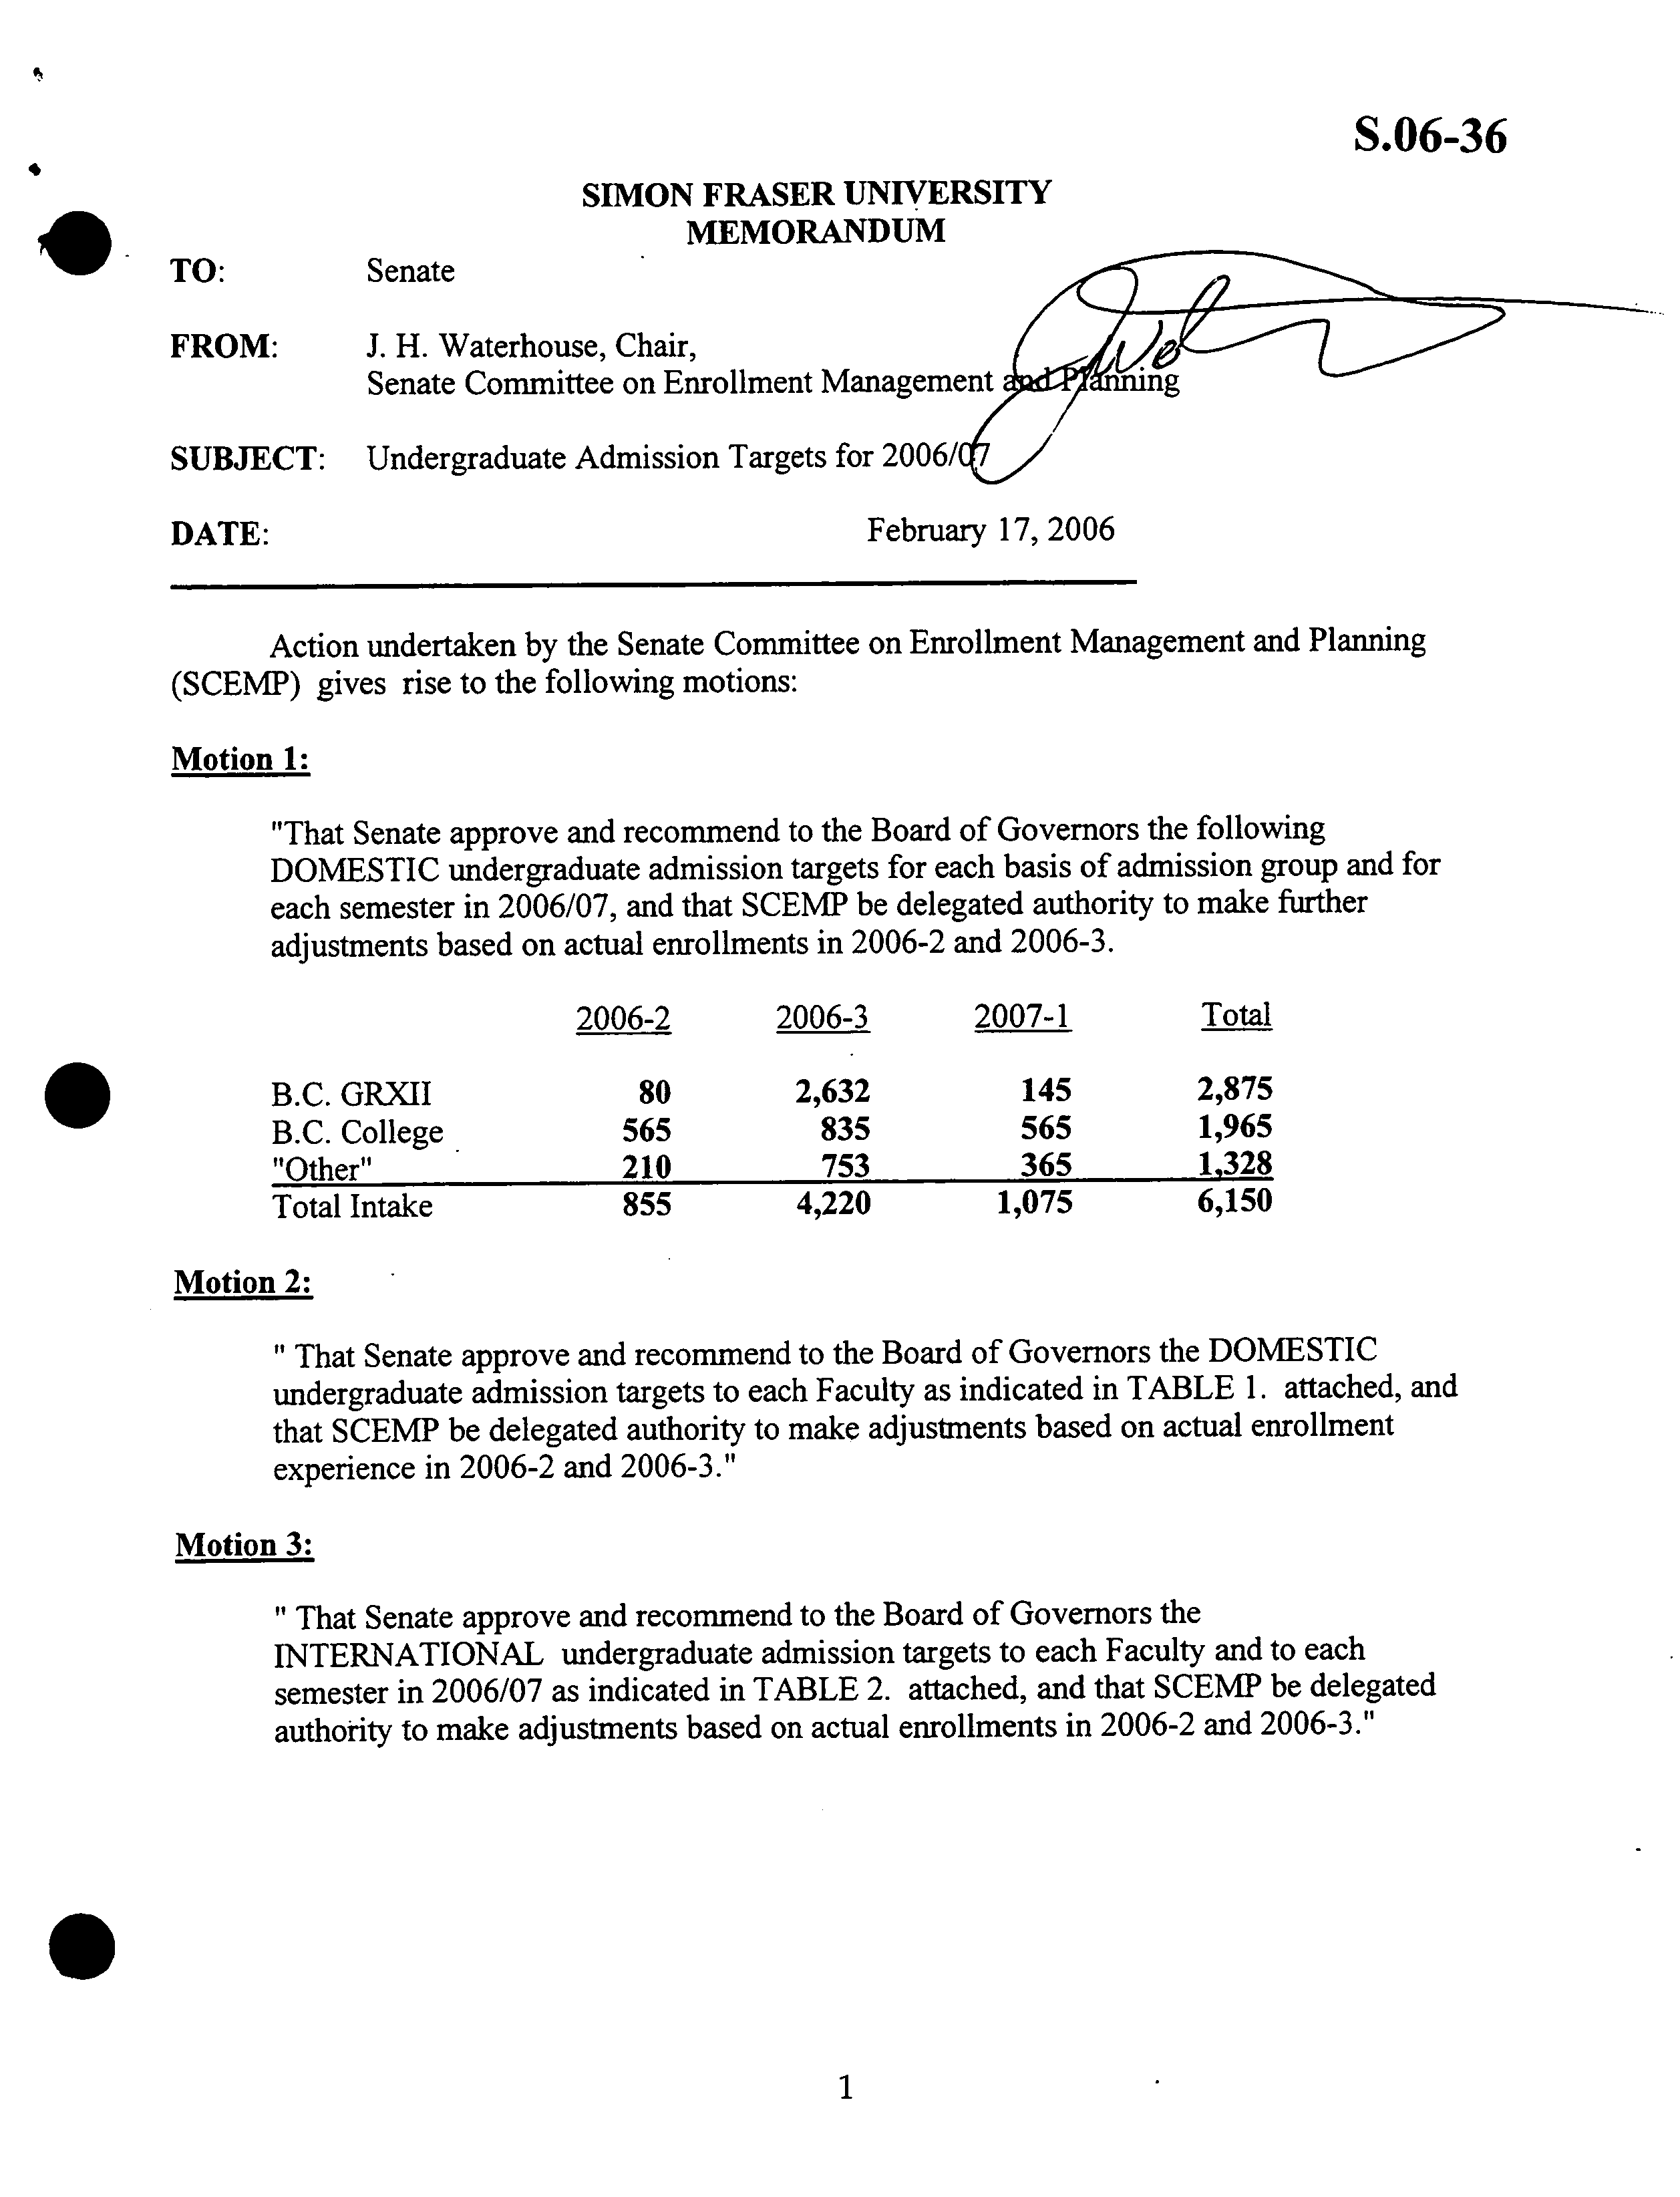
Motion 1:
"That Senate approve and recommend to the Board of Governors the following
DOMESTIC undergraduate admission targets for each basis of admission group and for
each semester in 2006/07, and that SCENT be delegated authority to make further
adjustments based on actual enrollments in 2006-2 and 2006-3.
2006-2
2006-3
2007-1
Total
B.C. GRXII
80
2,632
145
2,875
B.C. College
•
565
835
565
1,965
"Other"
210
753
365
1,328
Total Intake
855
4,220
1,075
6,150
Motion
2:
"That Senate approve and recommend to the Board of Governors the DOMESTIC
undergraduate admission targets to each Faculty as indicated in TABLE 1. attached, and
that SCEMP be delegated authority to make adjustments based on actual enrollment
experience in 2006-2 and 2006-3."
Motion
3:
That Senate approve and recommend to the Board of Governors the
INTERNATIONAL undergraduate admission targets to each Faculty and to each
semester in 2006/07 as indicated in TABLE 2. attached, and that SCENT be delegated
authority to make adjustments based on actual enrollments in 2006-2 and 2006-3."
0
.
BACKGROUND
Enrollment Status for 2005/06 - Domestic Students
SFU was funded for 16,234 full-time equivalent (FTE) undergraduates in 2005/06. This
includes approximately 296 FTE of "grandfathered" international students who were admitted
prior to 2003-3. Based on actual enrollments, we will miss our funded enrollment target by
approximately
64
FTE.
Enrollment Funding for 2006/07 - Domestic Students
The Provincial Government has increased our enrollment target by 334 FTh in 2006/07 to
a total of
16,568
FTE students. This includes a final increment of
26
FTh in "New Era or DTO"
programs (Computing Science and Engineering Science), a general access increase of
58
FTE
students, and an increase of
250
FTE students at SFU Surrey.
Meeting our funded enrollment target will require an intake of approximately 6,150 new
domestic undergraduates in 2006/07.
Admission Targets for 2006/07 b
y
Semester, Basis-of Admission, and Facult
y
- Domestic
Students
The global admission targets for each semester are determined by first allocating
FTE capacity to undergraduates continuing from previous semesters. Retention rates and course
loads for continuing students are assumed to remain the same as in the previous year. The
remaining FTE capacity determines how many new students are to be admitted. The specific intake
targets for Faculties are determined by further taking into account the University Enrollment Plan
which specifies the number of FTE program Majors required in each Faculty in 06/07. The targets
are constrained by requiring that minimum admission GPAs are roughly stable over the three
semesters, that historical proportions of new students by basis of admission do not change sharply,
and that adequate course supply is available in each semester to meet student demand.
Within each semester, there are three groups of students for which separate basis of
admission targets are identified. These are students entering from BC secondary schools, transfer
students from BC colleges and university colleges, and a collection of groups labeled as "Other."
"Other" includes students transferring from other universities, students pursuing a second degree,
mature students, secondary school graduates from other Canadian provinces, visiting, special
entry, concurrent studies, BC Grade 11, BC technical schools, etc.
The target for the Faculty of Applied Sciences is the sum of new-to-SFU students entering
each of Computing Science, Communications, Engineering Science, Kinesiology, and the
TechOne program at Surrey. The Education intake quota is an estimate of the number of new-to-
SFU students who will be primarily admitted into the BED, PDP and PBD programs. The quotas
for Business includes students who will be admitted to the main campus as well as into the Surrey
programs. The quotas for Arts and Science include students who will be admitted to the main
campus as well as into the Surrey programs in Explorations and Science.
0
Tables 3. below provides information on the actual intake of new students in previous
years.
International Students
9
In 2003-3, SFU began to admit full-cost recovery international students into undergraduate
programs. These students are outside the provincial funded target umbrella and are required to pay
higher tuition fees. Senate approved an admission target of
650
students in
05/06
and 626
students registered. The FTE of all full-cost recovery international students in
05/06
is estimated
to be 1,157F1'E.
For 2006/07 the proposed target is 815 new international students and should result in a
total enrollment of 1,500 FTE. Our enrollment plan calls for an increase of
375
FTE per year to
approximately 1,700 FTE by 07/08 (10% of our funded FTE target).
Table 4. below provides information on the actual intake of new international students.
.
.
3
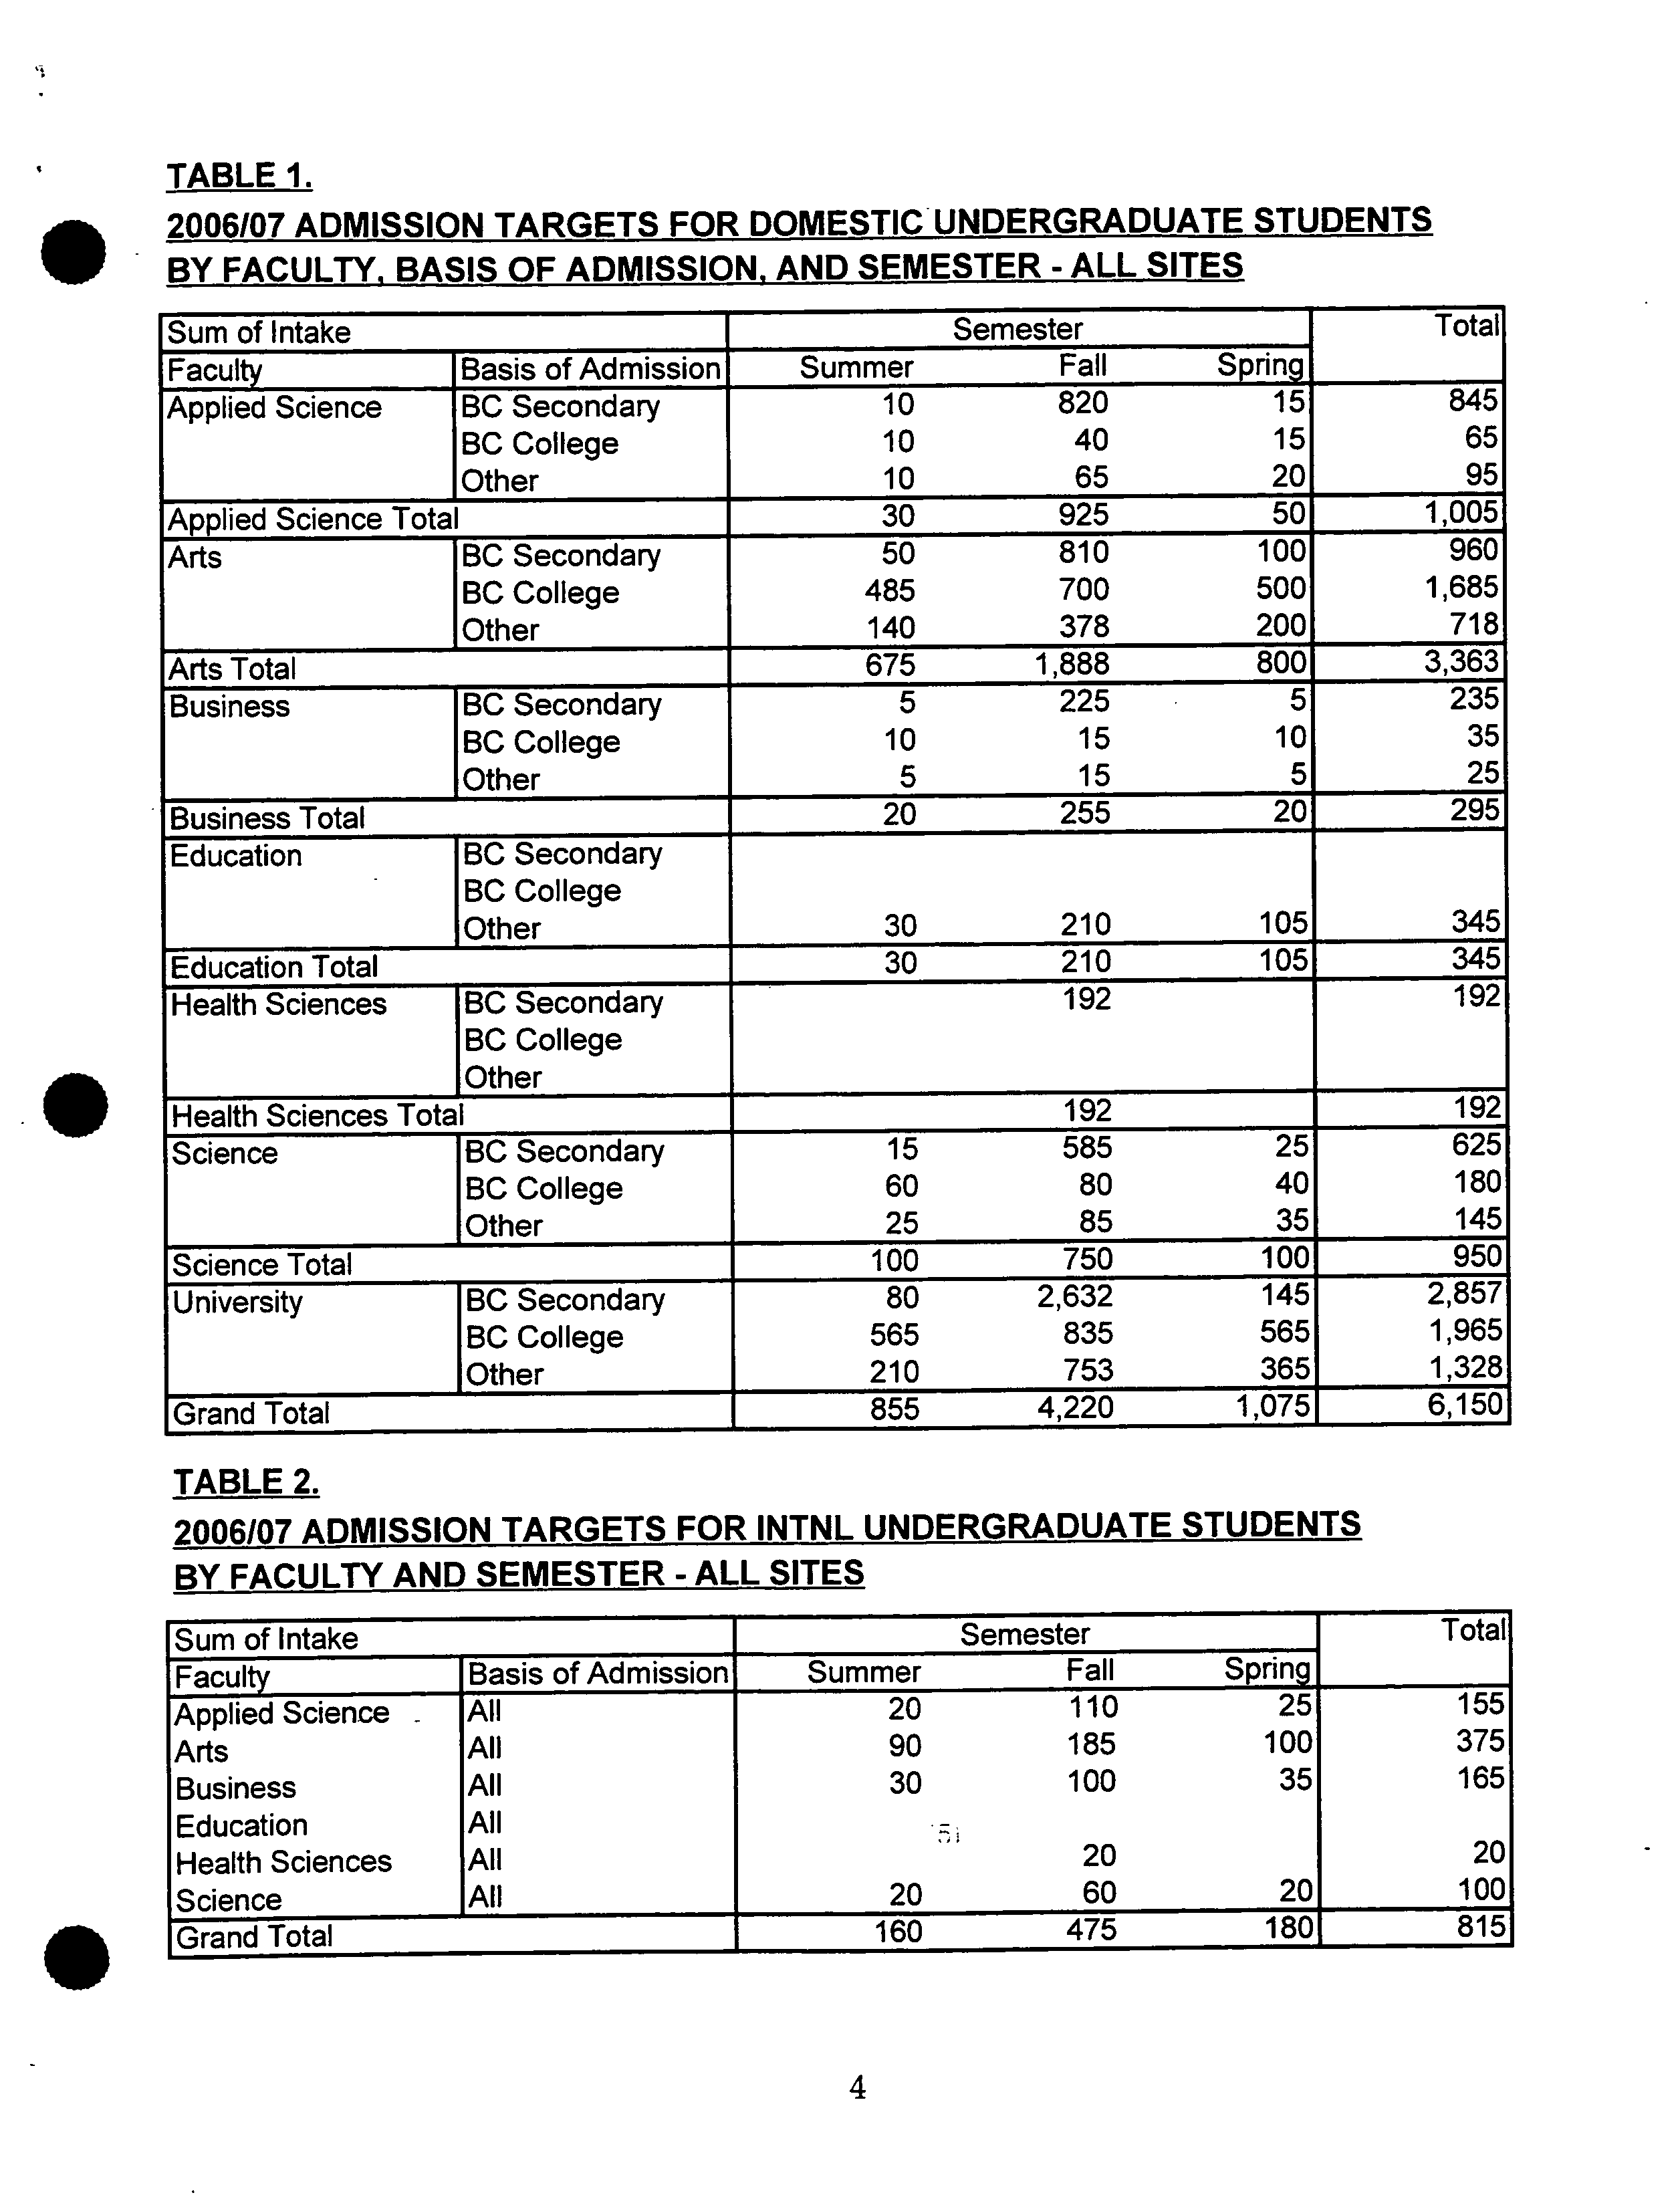
TABLE 1.
.
2006107 ADMISSION TARGETS FOR DOMESTIC UNDERGRADUATE STUDENTS
BY FACULTY, BASIS OF ADMISSION, AND SEMESTER -
ALL
SITES
.
Sum of Intake
Semester
Total
_
Faculty
Basis of Admission
Summer
Fall
Spring
Applied Science
BC Secondary
10
820
15
845
BC College
10
40
15
65
Other
10
65
20
95
Applied Science Total
30
925
50
1,005
Arts
BC Secondary
50
810
100
960
BC College
485
700
500
1,685
Other
140
378
200
718
Arts Total
675
1,888
800
3,363
Business
BC Secondary
5
225
5
235
BC College
10
15
10
35
Other
5
15
5
25
Business Total
20
255
20
295
Education
BC Secondary
BC College
Other
30
210
105
345
Education Total
30
210
105
345
Health Sciences
BC Secondary
192
192
BC College
Other
Health Sciences Total
192
192
Science
BC Secondary
15
585
25
625
BC College
60
80
40
180
Other
25
85
35
145
Science Total
100
750
100
950
University
BC
Secondary
80
2,632
145
2,857
BC College
565
835
565
1,965
Other
1
210
753
365
1,328
Grand Total
1
855
4,220
1,0751
6,150
TABLE 2.
2006/07 ADMISSION TARGETS FOR INTNL UNDERGRADUATE STUDENTS
BY FACULTY AND SEMESTER - ALL SITES
0
Sum of Intake
Semester
Total
_
Faculty
Basis of Admission
Summer
Fall
Spring
Applied Science
-
All
20
110
25
155
Arts
All
90
185
100
375
Business
All
30
100
35
165
Education
All
Health Sciences
All
20
20
Science
IAII
1
20
60
20
100
Grand Total
1
160
475
180
815
TABLE 3.
2005/06
INTAKE OF NEW DOMESTIC UNDERGRADUATE STUDENTS - ACTUAL
AND TARGET BY FACULTY, BASIS OF ADMISSION, AND BY SEMESTER
Sum of Intake
Target
Total
Faculty
Basis of Admission
Sum.
Fall
Spring
Applied Science BC Secondary
5
725
12
742
BC College
20
45
22
87
Other
20
60
25
105
Applied Science Total
45
830
59
934
Arts
BC Secondary
60
790
97
947
BC College
455
700
596
1,751
Other
180
380
274
834
Arts Total
695
1,870
967
3,532
Business
BC Secondary
5
270
11
286
BC College
20
20
21
61
Other
5
20
13
38
Business Total
30
310
45
385
Education
BC Secondary
0
0
BC College
5
5
Other
30
130
70
230
Education Total
30
130
75
235
Science
BC Secondary
15
520
35
570
BC College
60
65
51
176
Other
25
75
43
143
Science Total
100
660
129
889
Unspecified
BC Secondary
0
BC College
0
Other
0
Unspecified Total
0
0
0
0
University
BC Secondary
85
2,305
155
2,545
BC College
555
830
695
2,080
Other
260
665
425
1,350
Grand Total
900
3,800
1,275
5,975
Actual
Total
Sum.
Fall
Spring
7
790
20
817
5
25
9
39
9
61
21
91
21
876
50
947
38
838
116
992
472
717
555
1,744
86
380
188
654
596
1,935
859
3,390
4
293
14
311
11
20
17
48
4
17
5
26
19
330
36
385
0
0
1
1
2
16
146
76
238
16
147
77
240
8
470
26
504
51
73
39
163
20
65
41
126
79
608
106
793
1
1
5
5
2
2
8
0
0
8
58
2,391
176
2,625
544
836
621
2,001
137
669
331
1,137
739
3,896
1,1281 5,763
.
TABLE 4.
2005/06 INTAKE OF NEW INTN'L UNDERGRADUATE STUDENTS - ACTUAL
AND TARGET BY FACULTY, BASIS OF ADMISSION, AND BY SEMESTER
Sum of Intake
Target
Total
Faculty
Basis of Admission
Sum.
Fall
Spring
Applied Science All
20
90
25
135
Arts
All
70
160
70
300
Business
All
30
50
35
115
Education
All
0
Science
All
20
50
30
100
Unspecified
All
0
Grand Total
140
350
160
650
Actual
Total
Sum.
Fall
Spring
14
74
13
101
91
161
116
368
18
48
35
101
1
1
9
28
17
54
I
I
133
312
181
626
S