FOR INFORMATION
?
S.91-17
0 ?
SIMON FRASER UNIVERSITY
Senate Graduate Studies Committee
REPORT TO SENATE
?
graduate
The Dean
work
of Graduate
at the University
Studies
is
and
responsible
Chairs of
for
the
the
Senate
general
Graduate
supervision
Studies
of
?
Committee. This report outlines the position of graduate studies at Simon Fraser
University, describes some changes made in 1990 and makes recommendations for
future directions.
The enclosed copy of the Simon Fraser University Graduate Studies Fact Book
describes, in quantitative terms, the graduate student body in Fall 1990. It is the
first edition. As stated in the preface, suggestions for improvement would be
welcome. It is designed to complement information in the Simon Fraser
University Fact Book, produced by the Office of Analytical Studies.
I. ?
Enrolments and De2rees
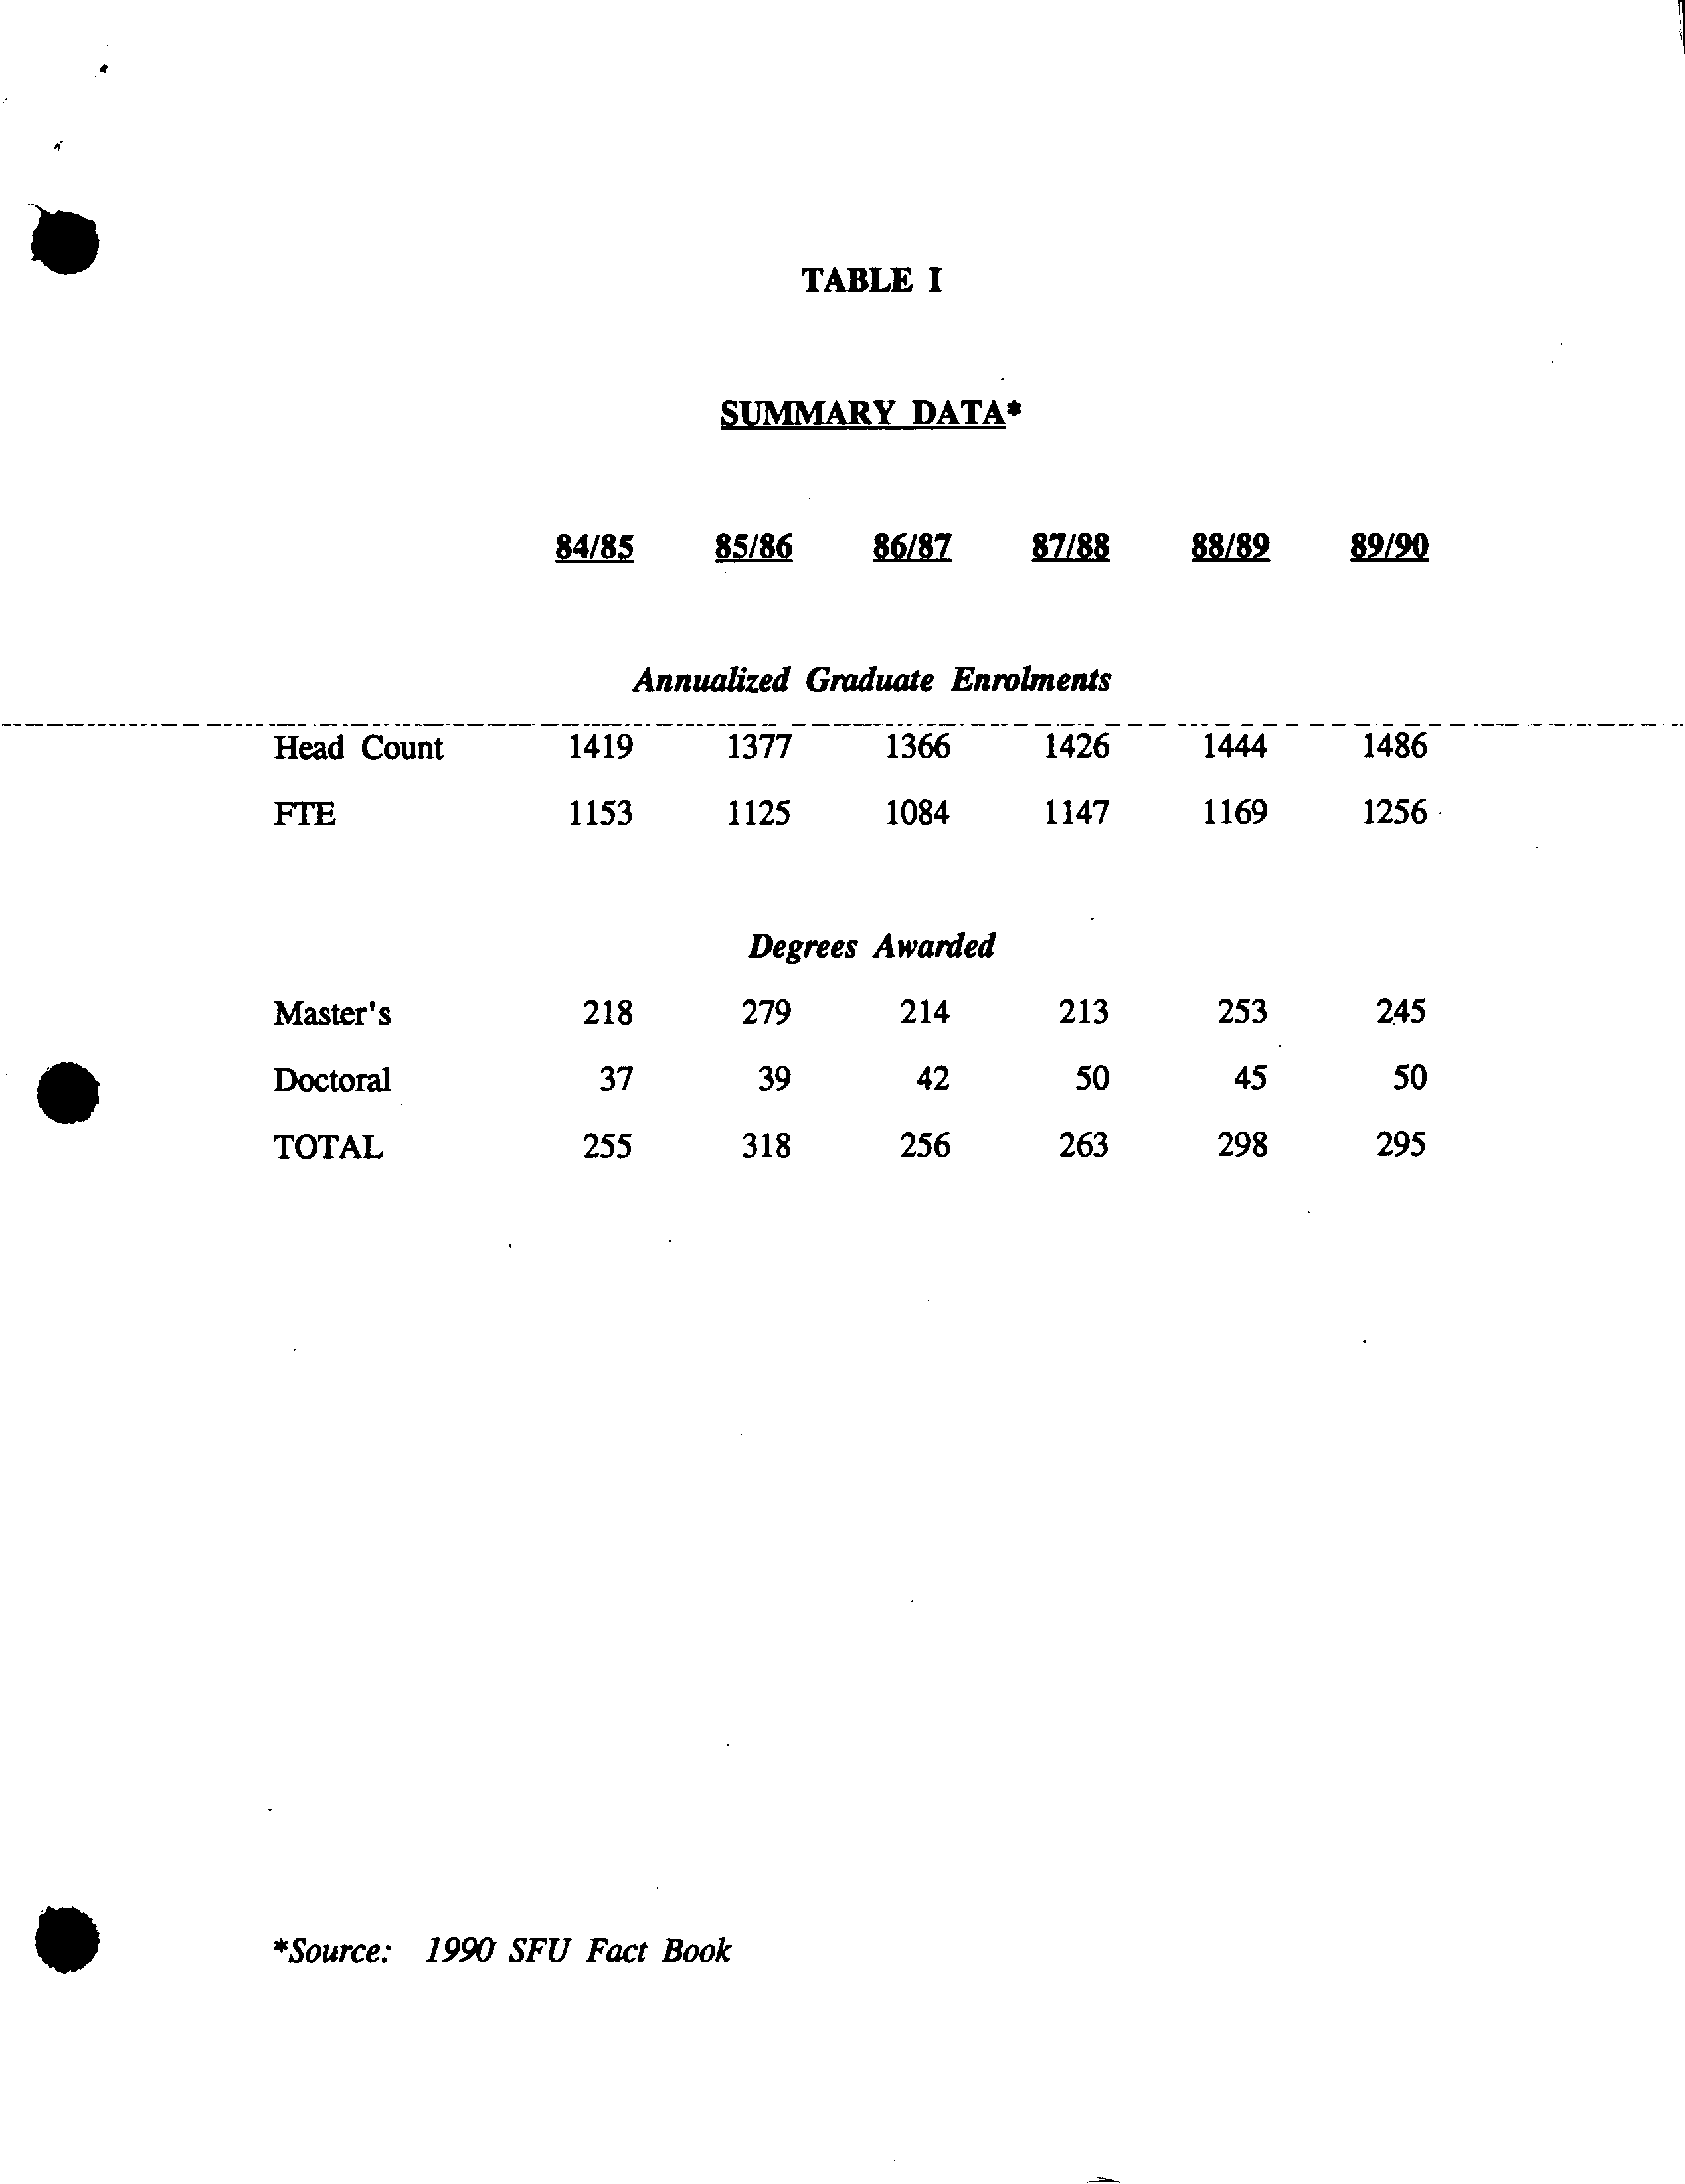
Table I shows the recent history of graduate enrolments and degrees granted. The
VIE enrolment figures should be treated with caution on two grounds. Prior to
the Fall 1989, they were determined through a reporting process which was
subject to considerable variation between departments. Starting in the Fall 1989, a
new, rigorous definition of Part-time status was adopted; this was primarily
responsible for the large change in the (Head Count)/FTE ratio between 1988/89
and 1989/90. The official recognition of Part-time status and the introduction of a
reduced semester tuition fee for Part-time students were major advances in
improving the accessibility of our graduate programs. Program approved for part-
time study are listed in Appendix A.
As requested by Senate its meeting of January 9, 1989, I can report that the
introduction of a formal requirement of competence in the English language has
proceeded very smoothly. A very small fraction of applicants recommended for
admission whose first language is not English did not produce TOEFL scores of
at least
570.
Of these, a large majority submitted satisfactory other evidence of
their English language competence.
H.
?
De gree
Completion/Withdrawal
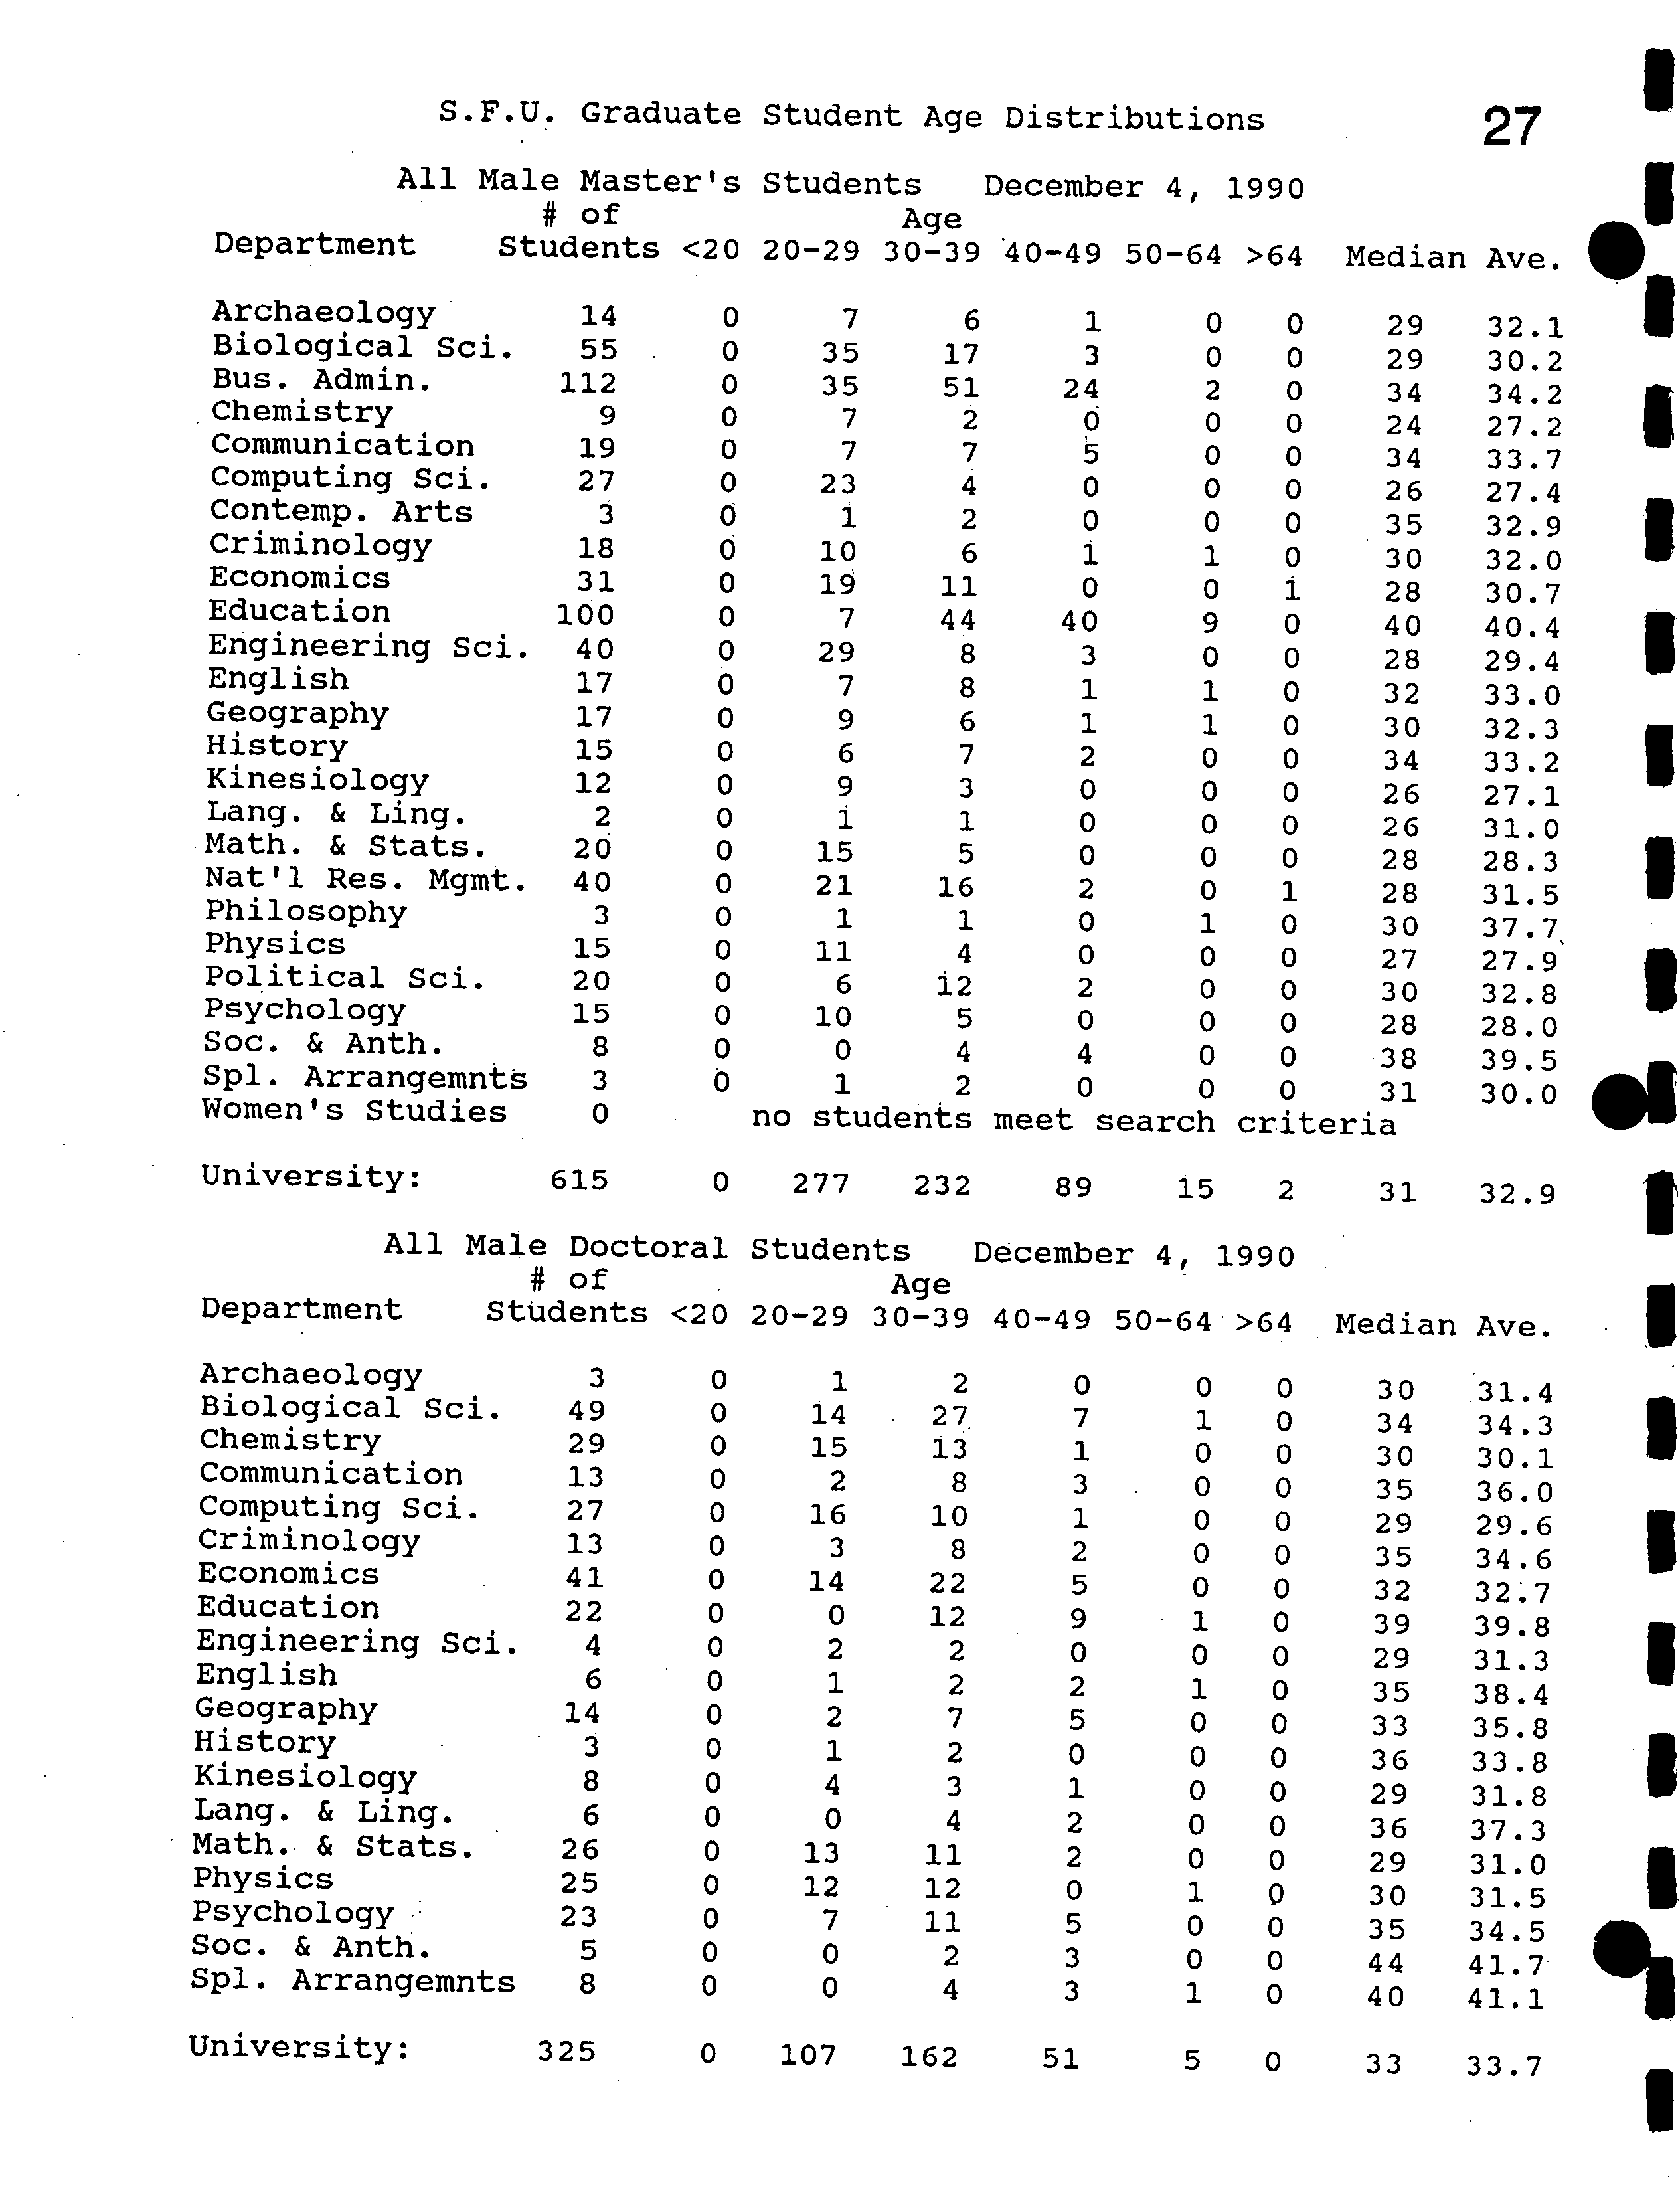
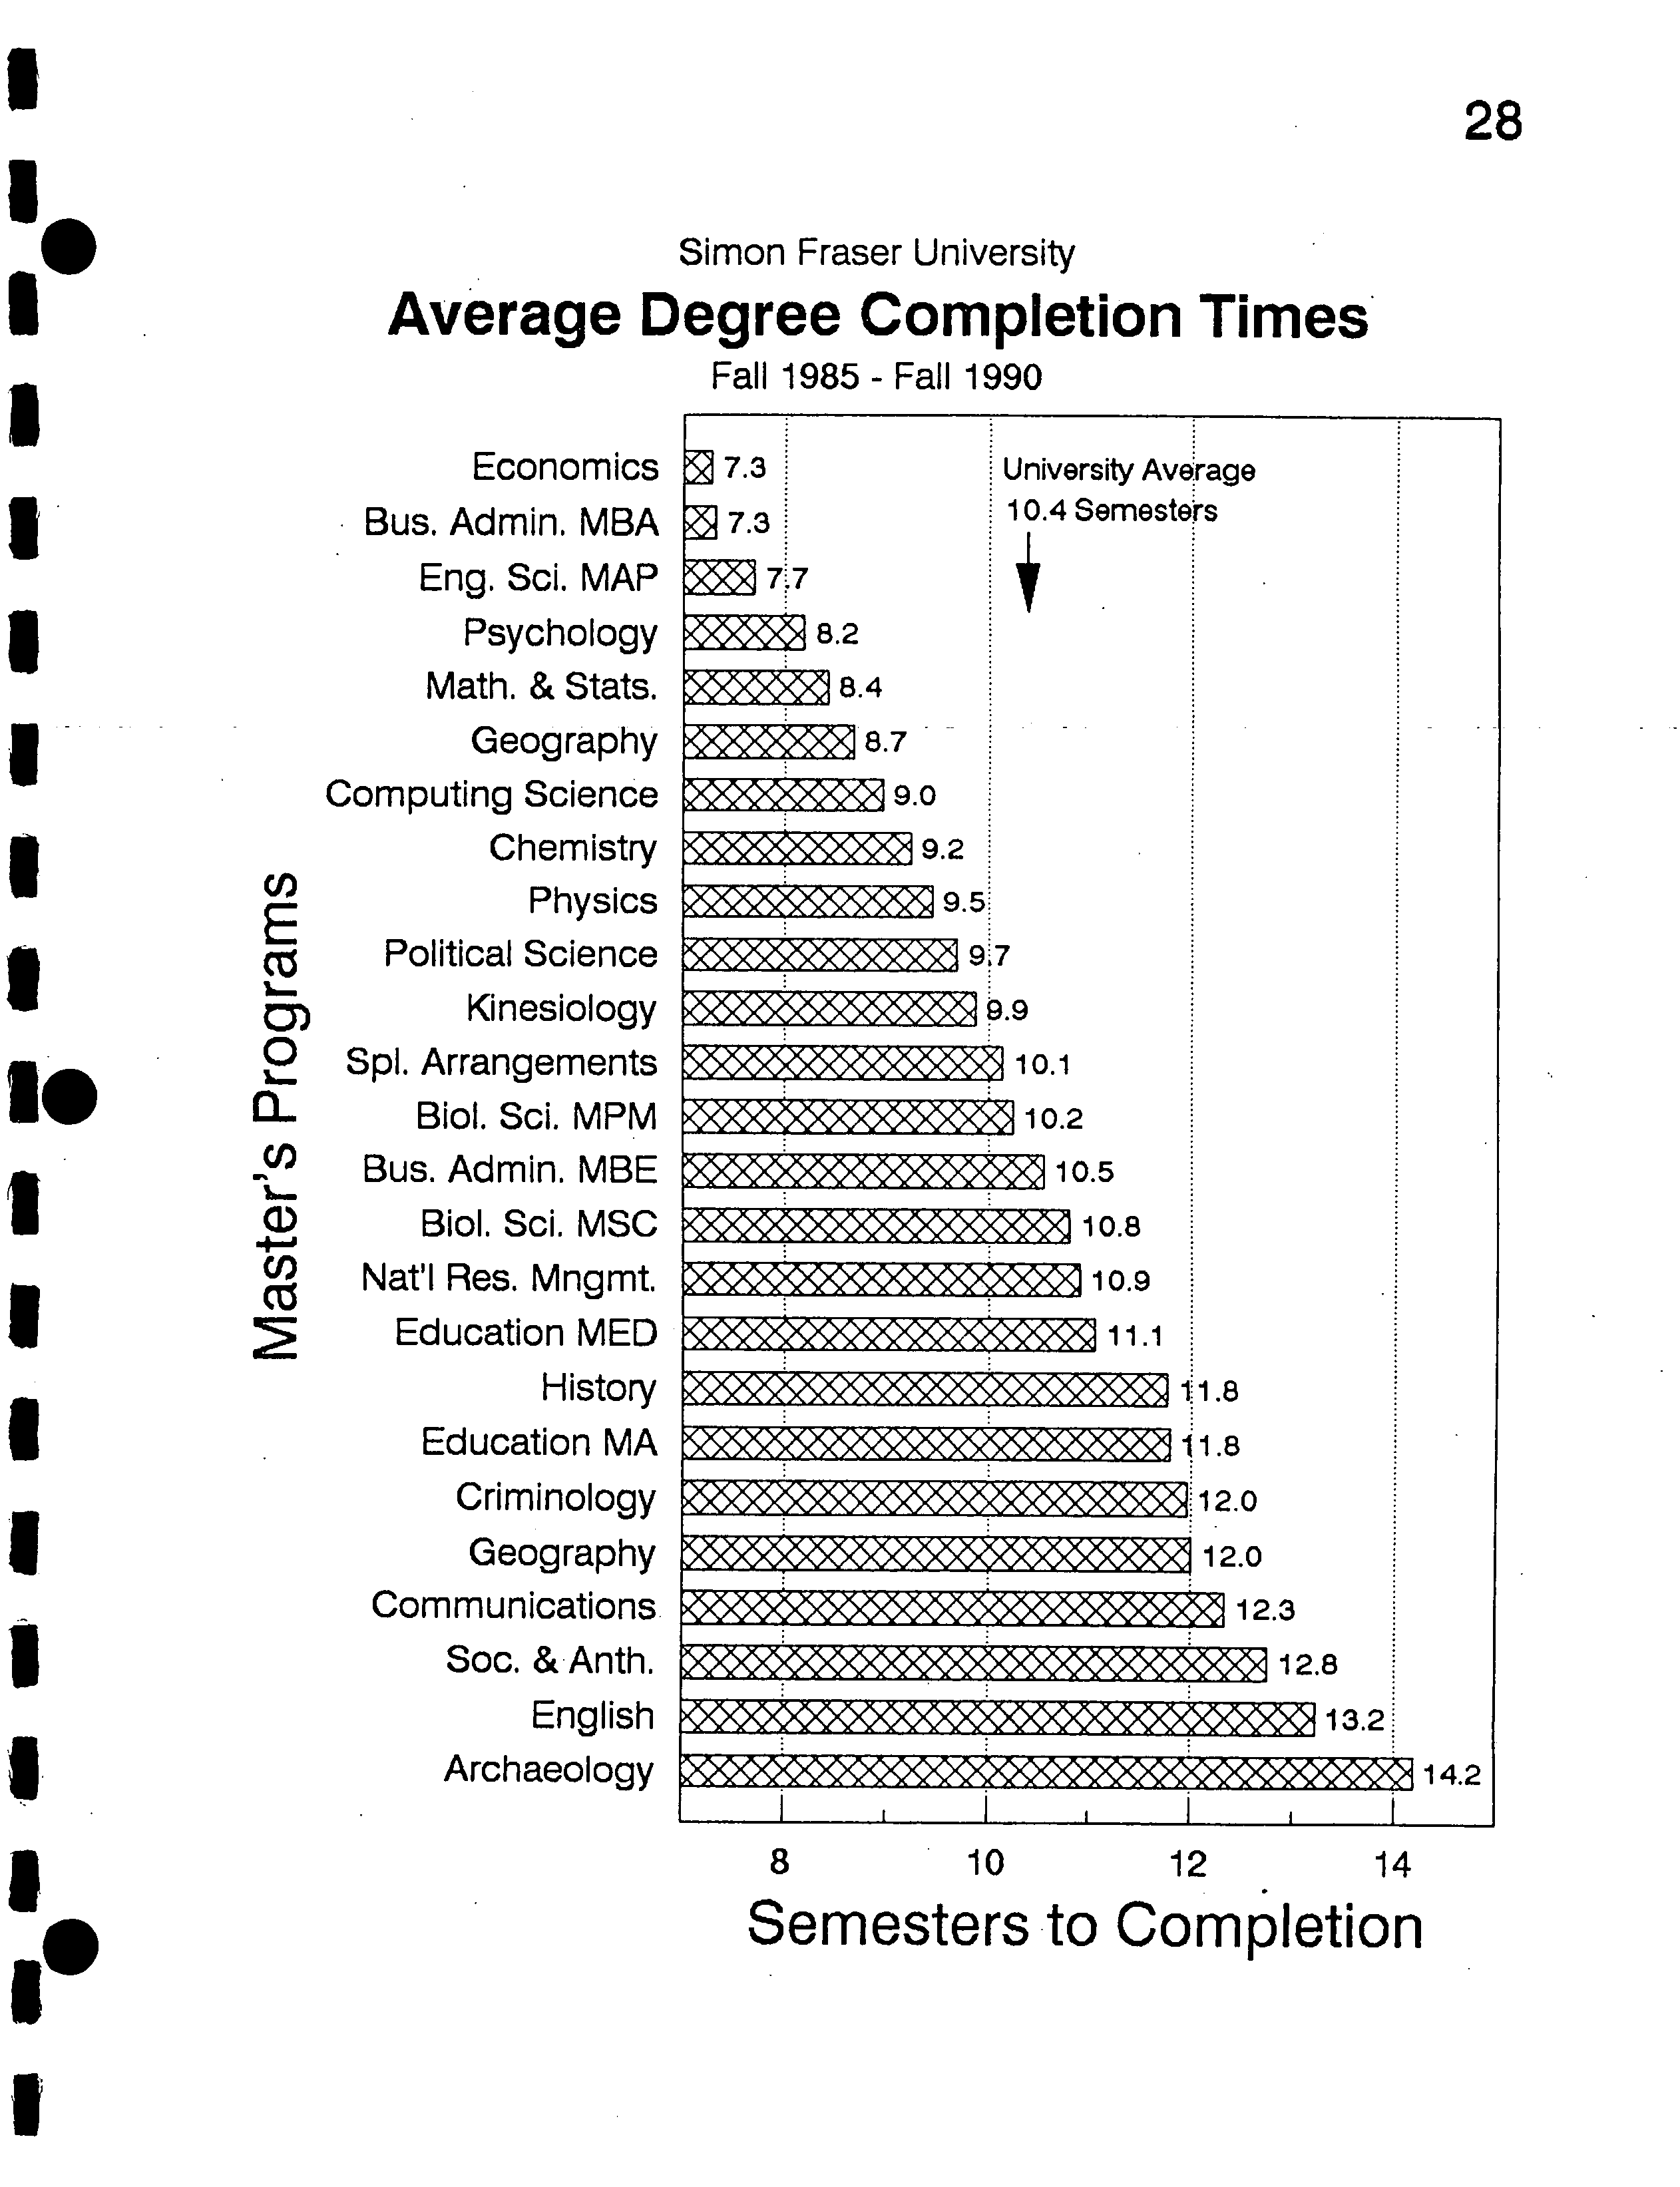
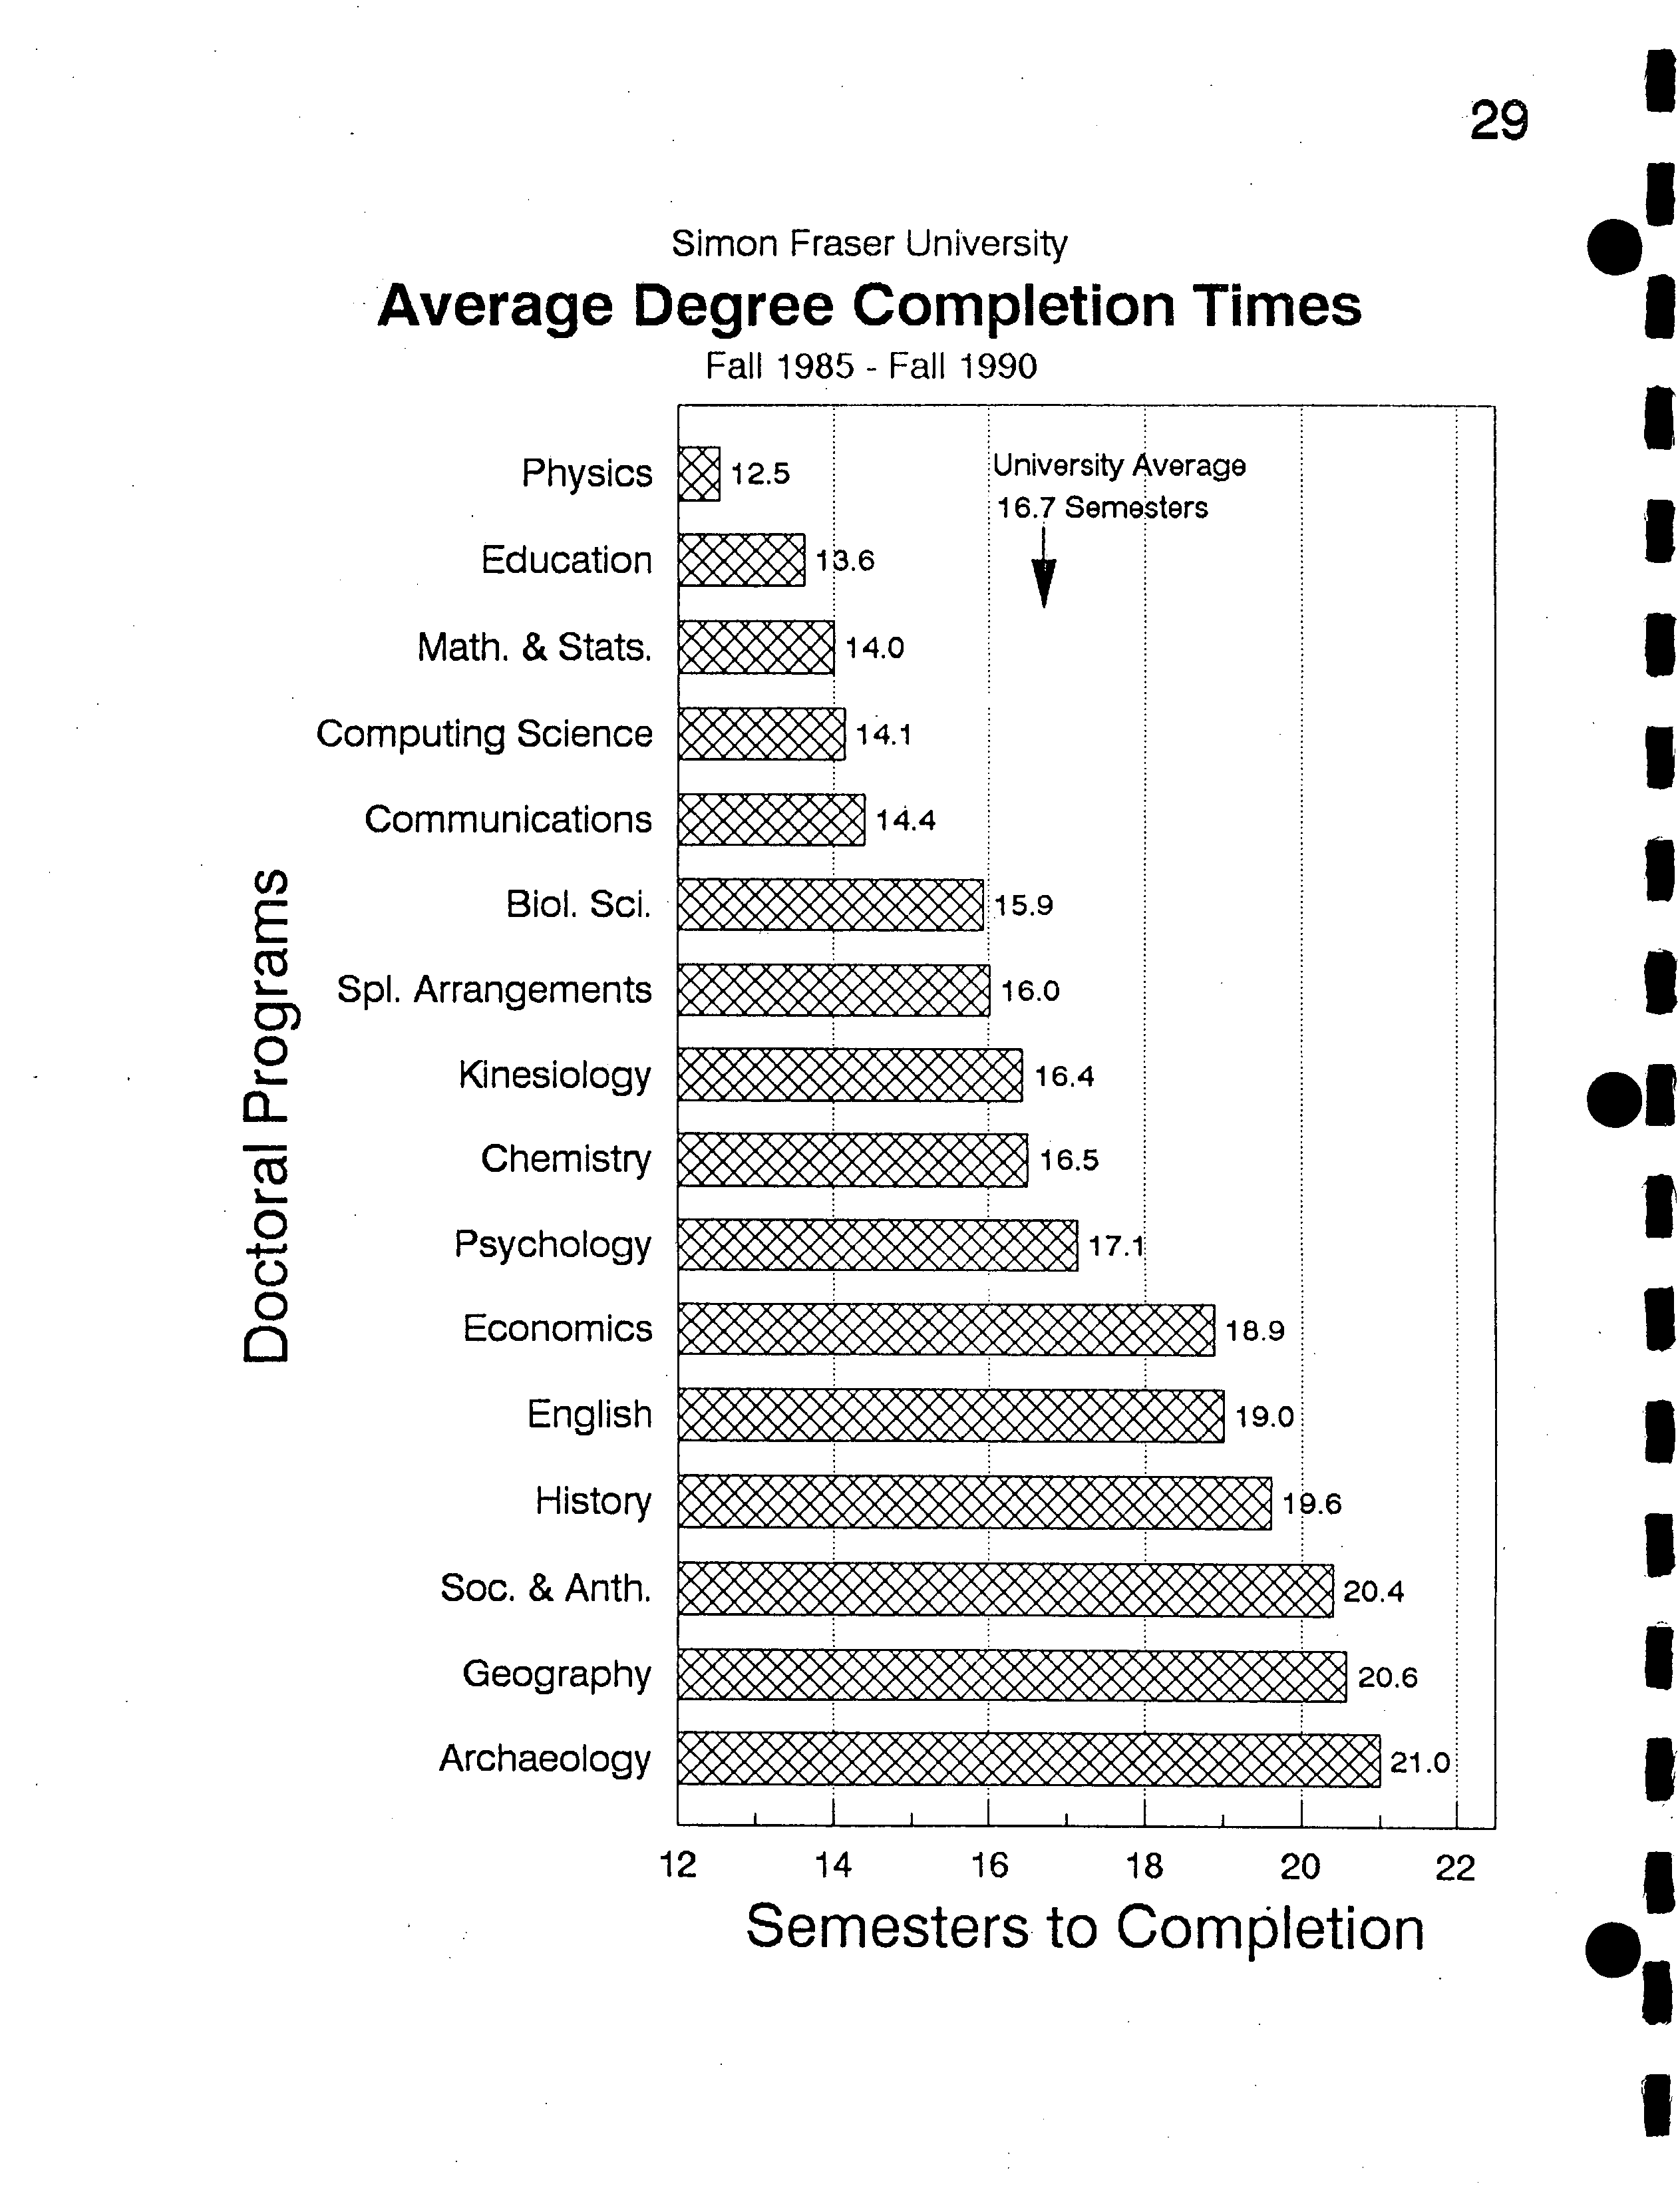
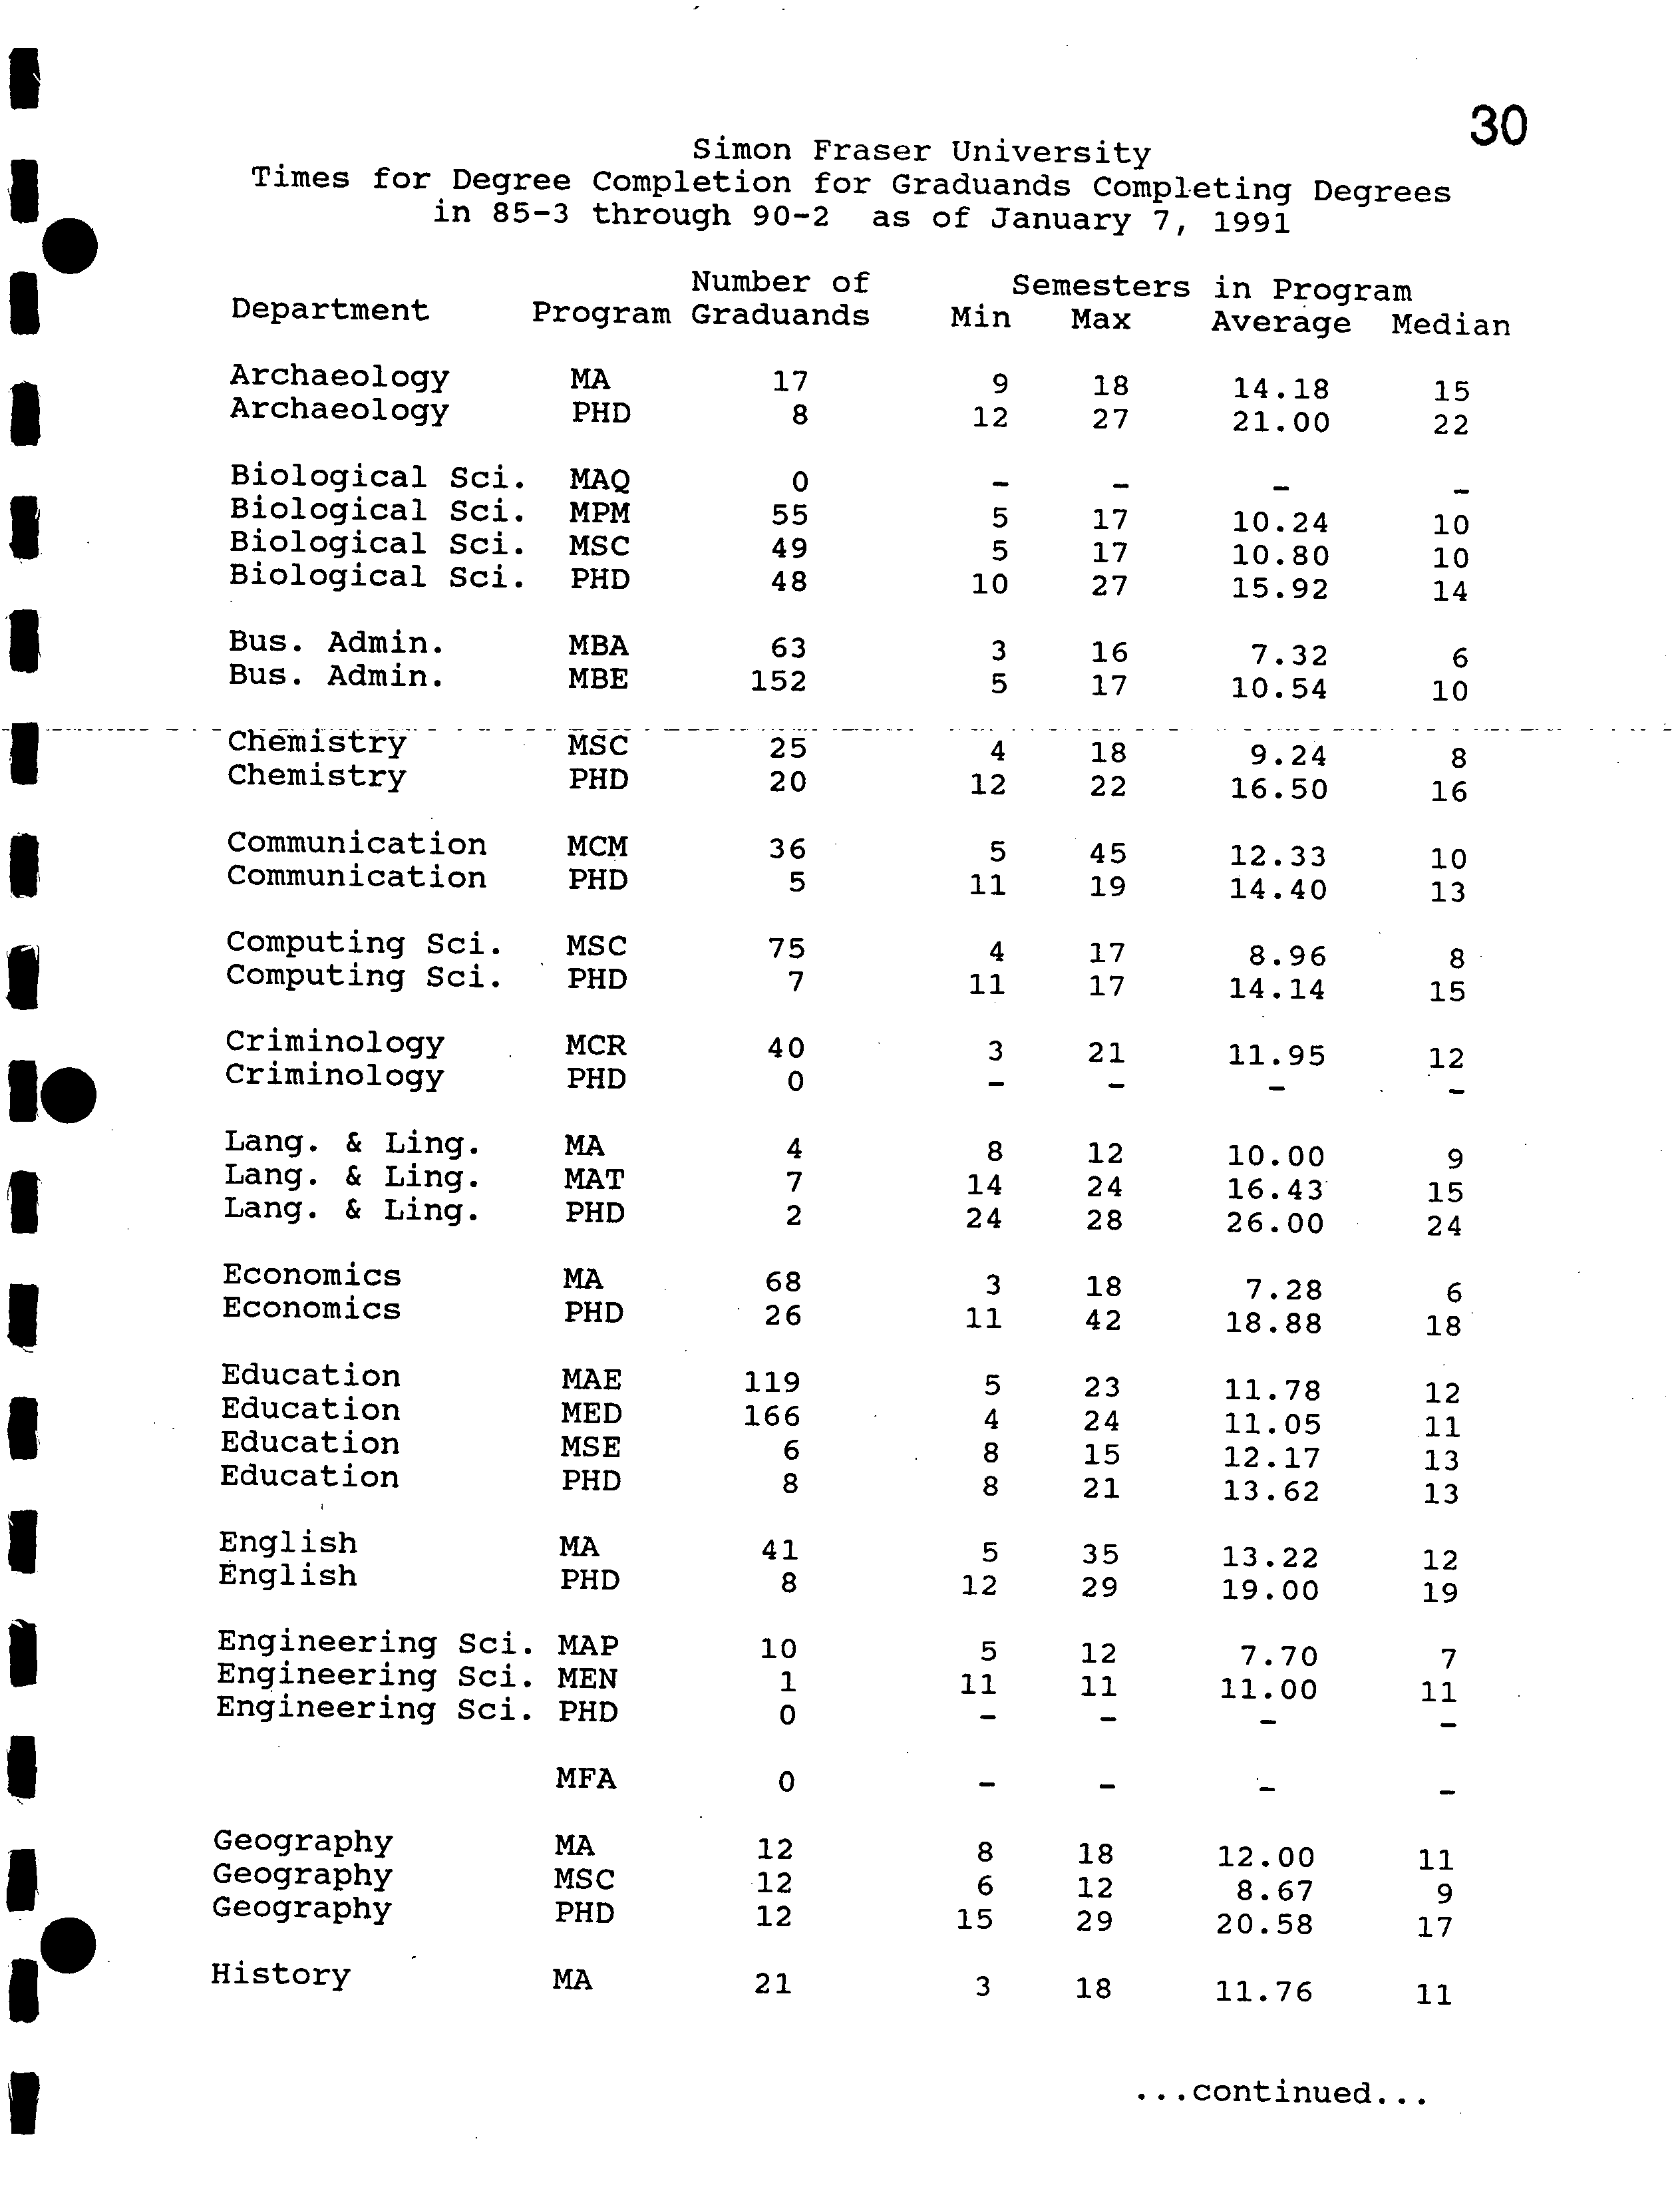
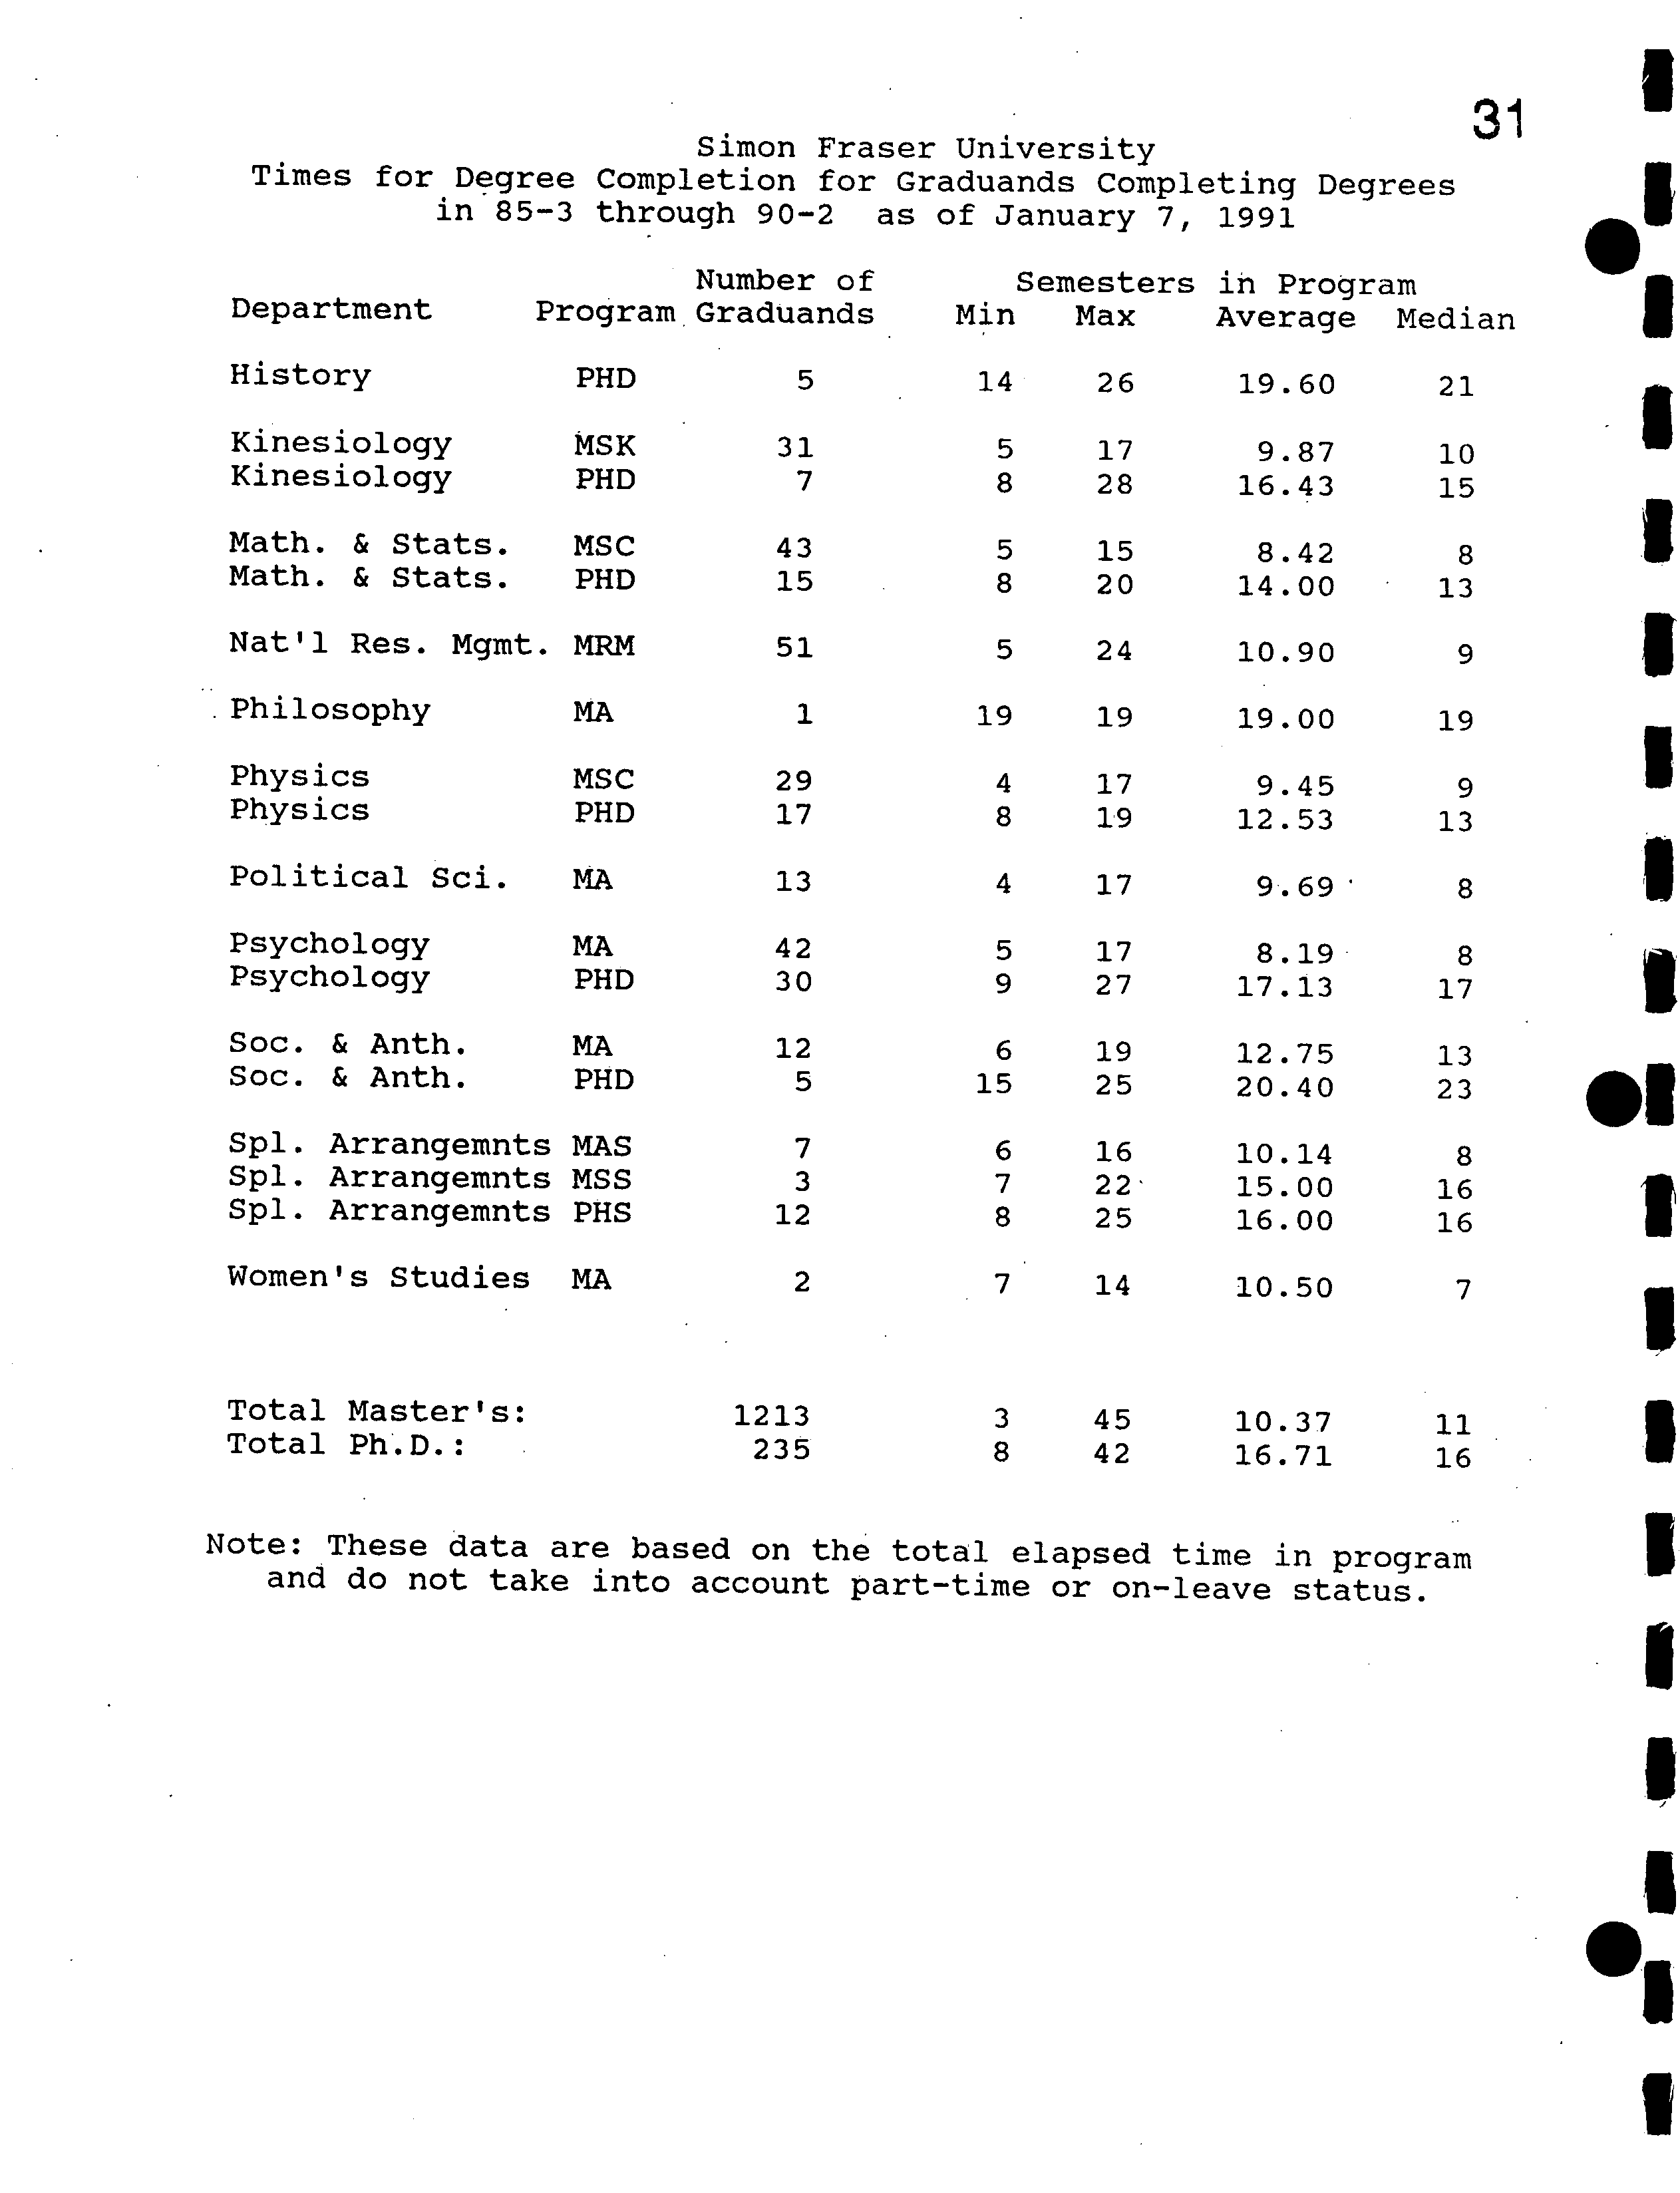
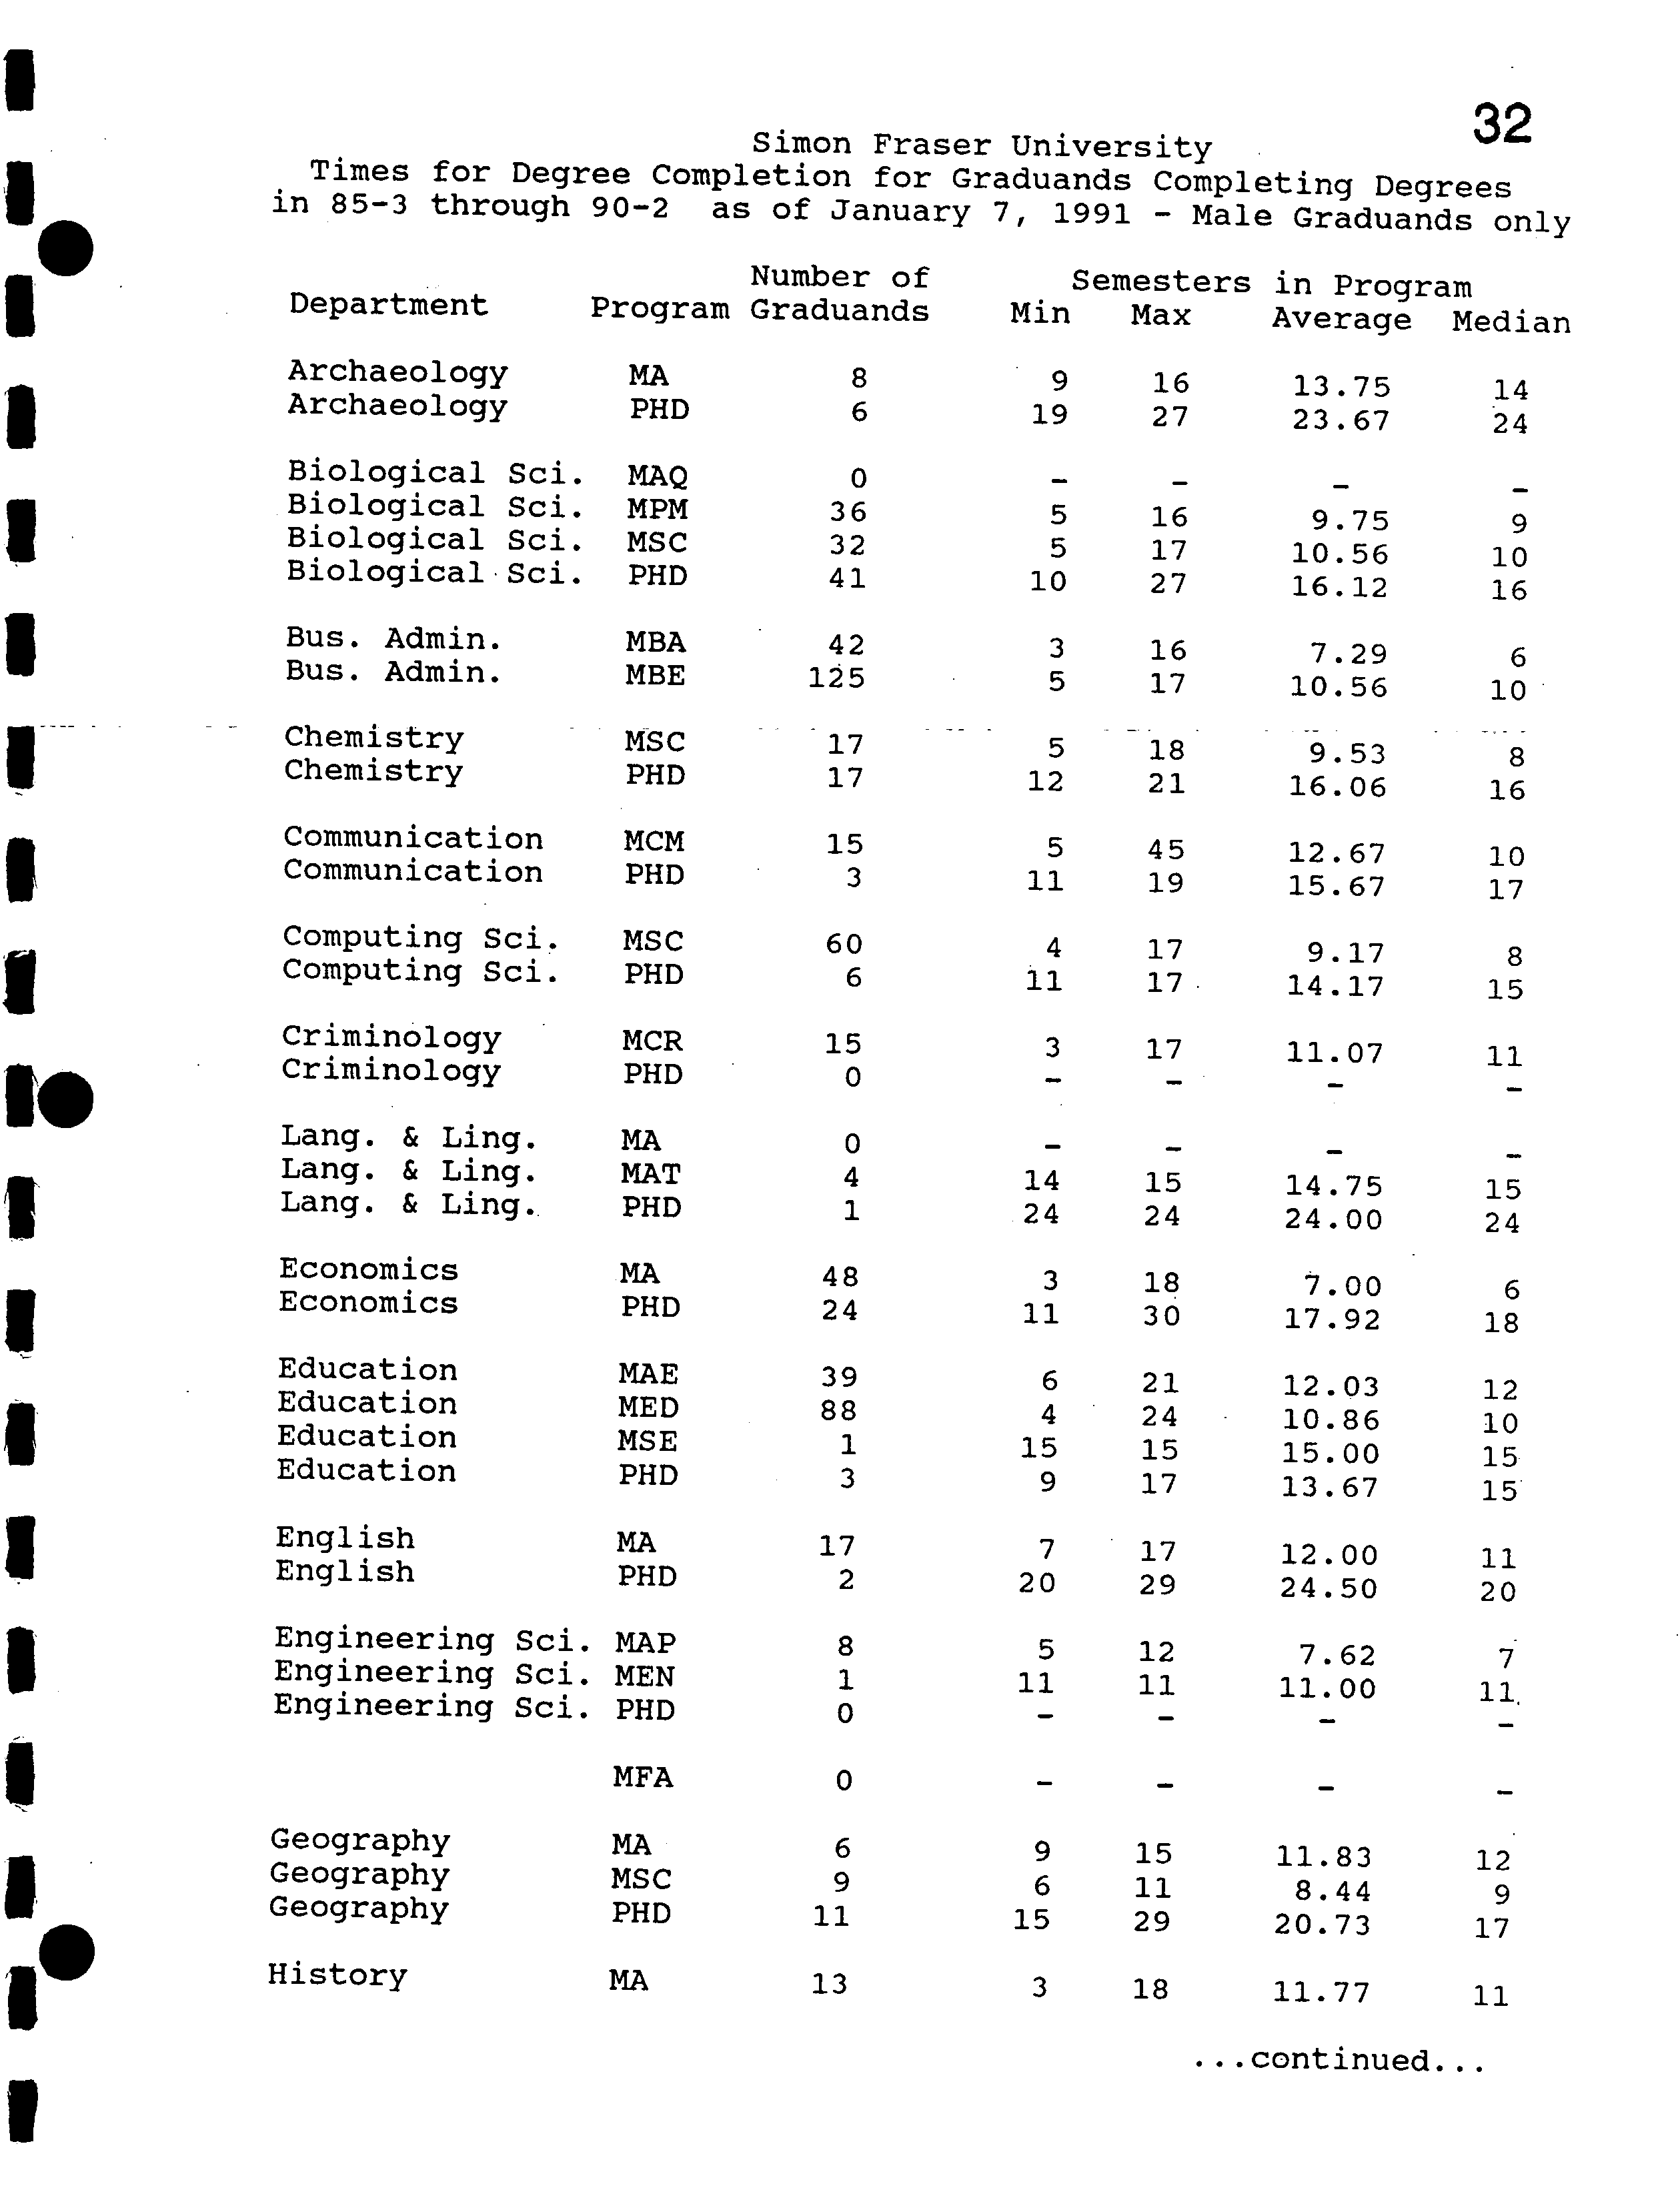
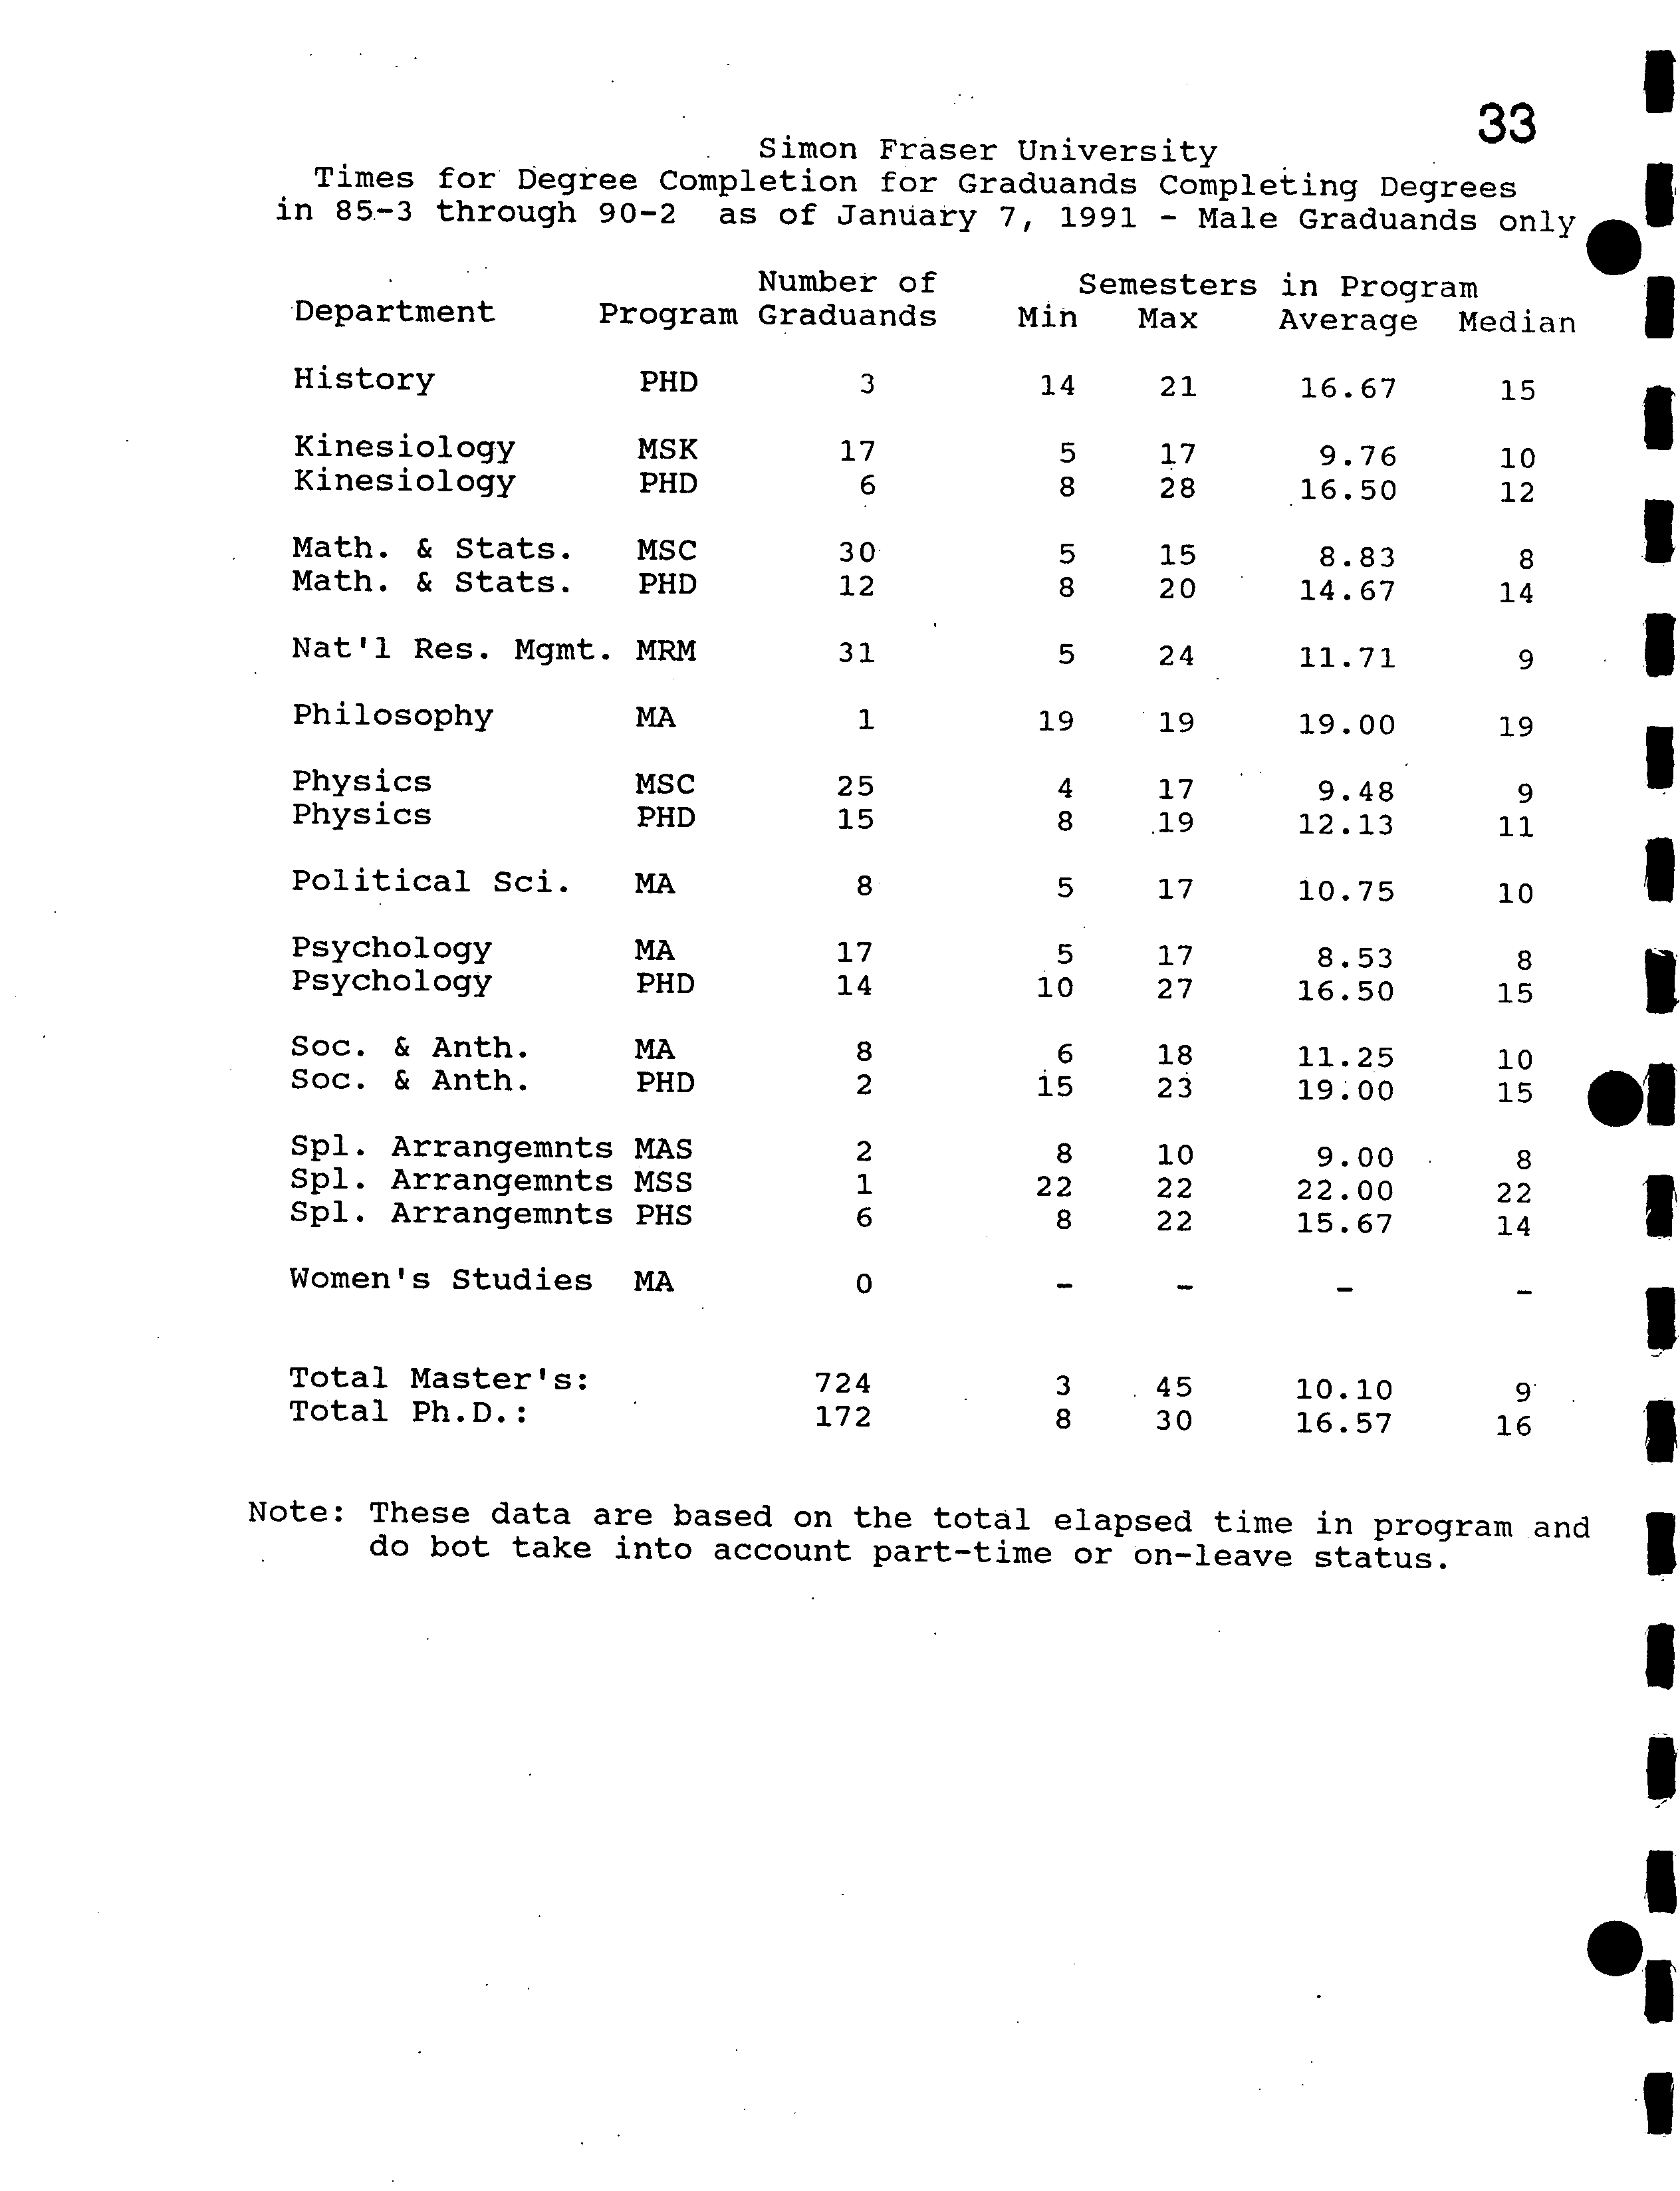
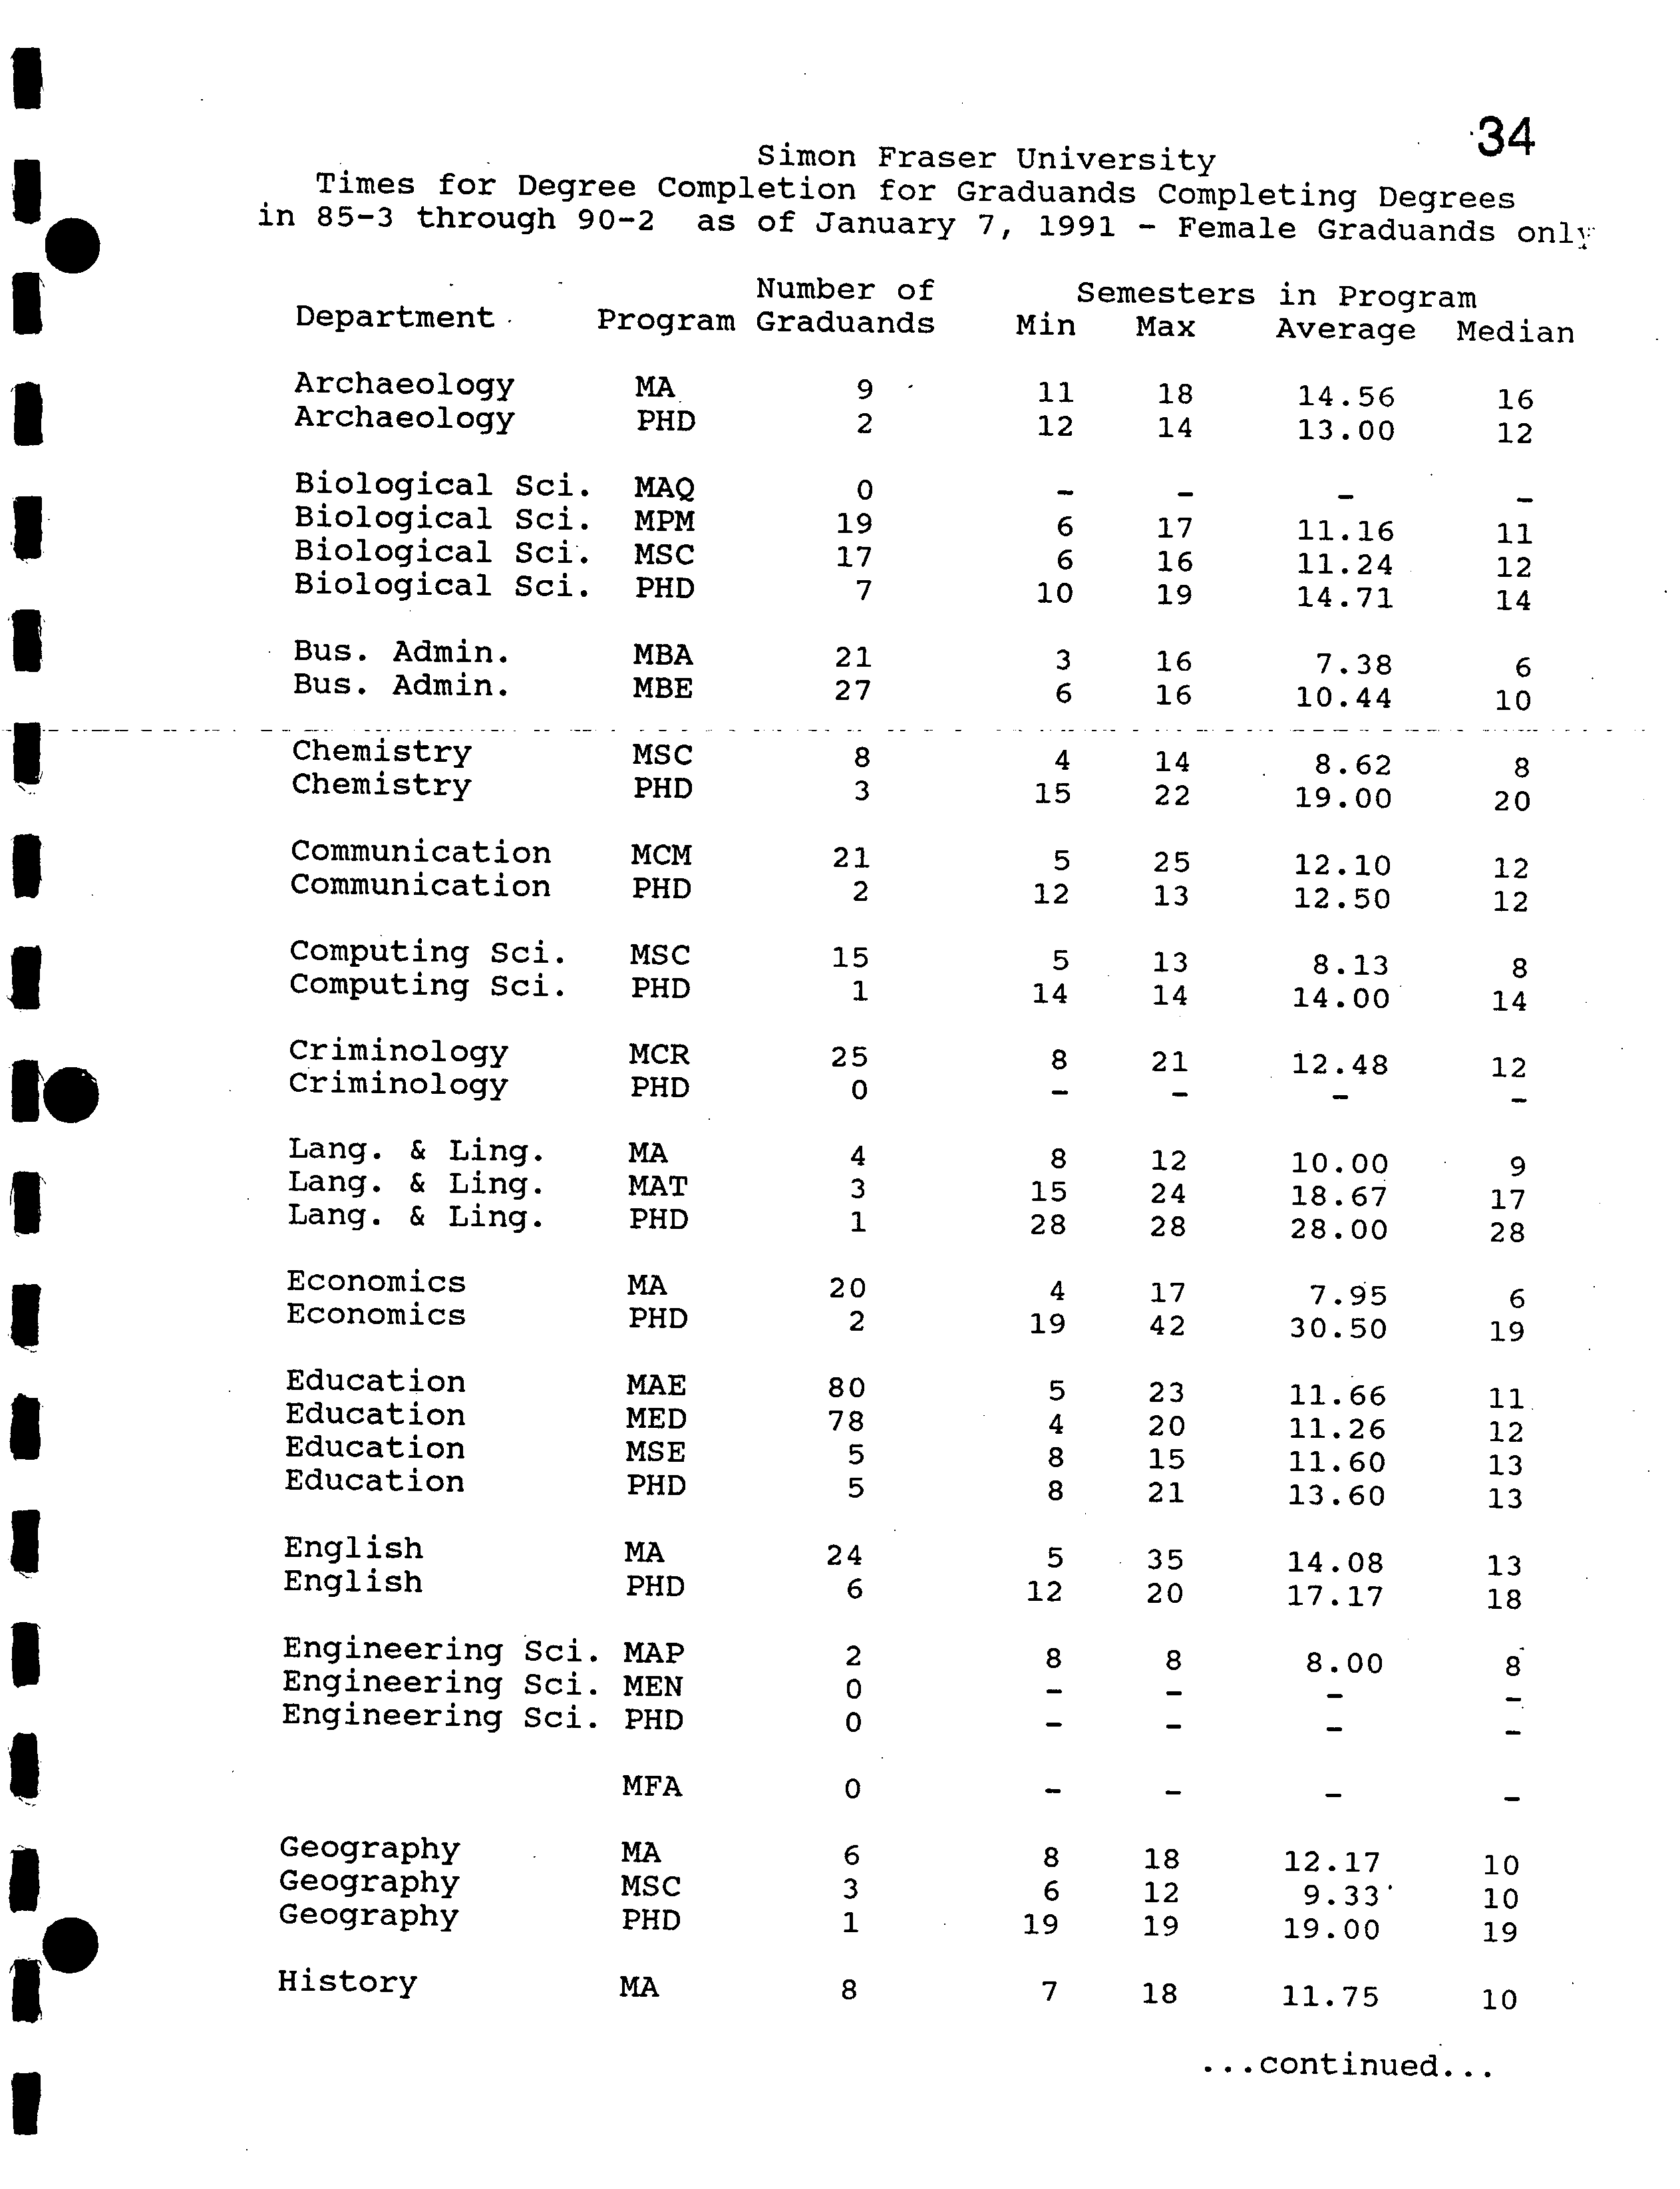
Degree completion times are presented, starting on page 28, in the Graduate
Studies Fact Book. It should be noted that these data do not take into account
the possibility that a student may have been enrolled part-time for all or part of
the program and thus overstate completion times, especially for programs with
large numbers of part-time students.
Report to Senate
02/04/1991
Page 2
I remain concerned by what appear in many cases to be excessive times for
degree completion. When resources are limited, it is especially important that
they be used effectively. I am actively encouraging departments to ensure both
that their degree requirements are realistic and that their students make
satisfactory progress, as required by Senate regulations, toward meeting those
requirements. I am also considering more rigorous enforcement of the regulations
requiring annual progress reports.
I am also pressing for timely appointments of supervisory committees. In
establishing the Graduate Studies Database, I encountered many students who had
been here for several years, yet apparently had no supervisory committees. This
situation has largely been remedied; each semester, reminders about 'delinquent'
students are sent to departments by my office; a minor flood of committee
recommendations follows.
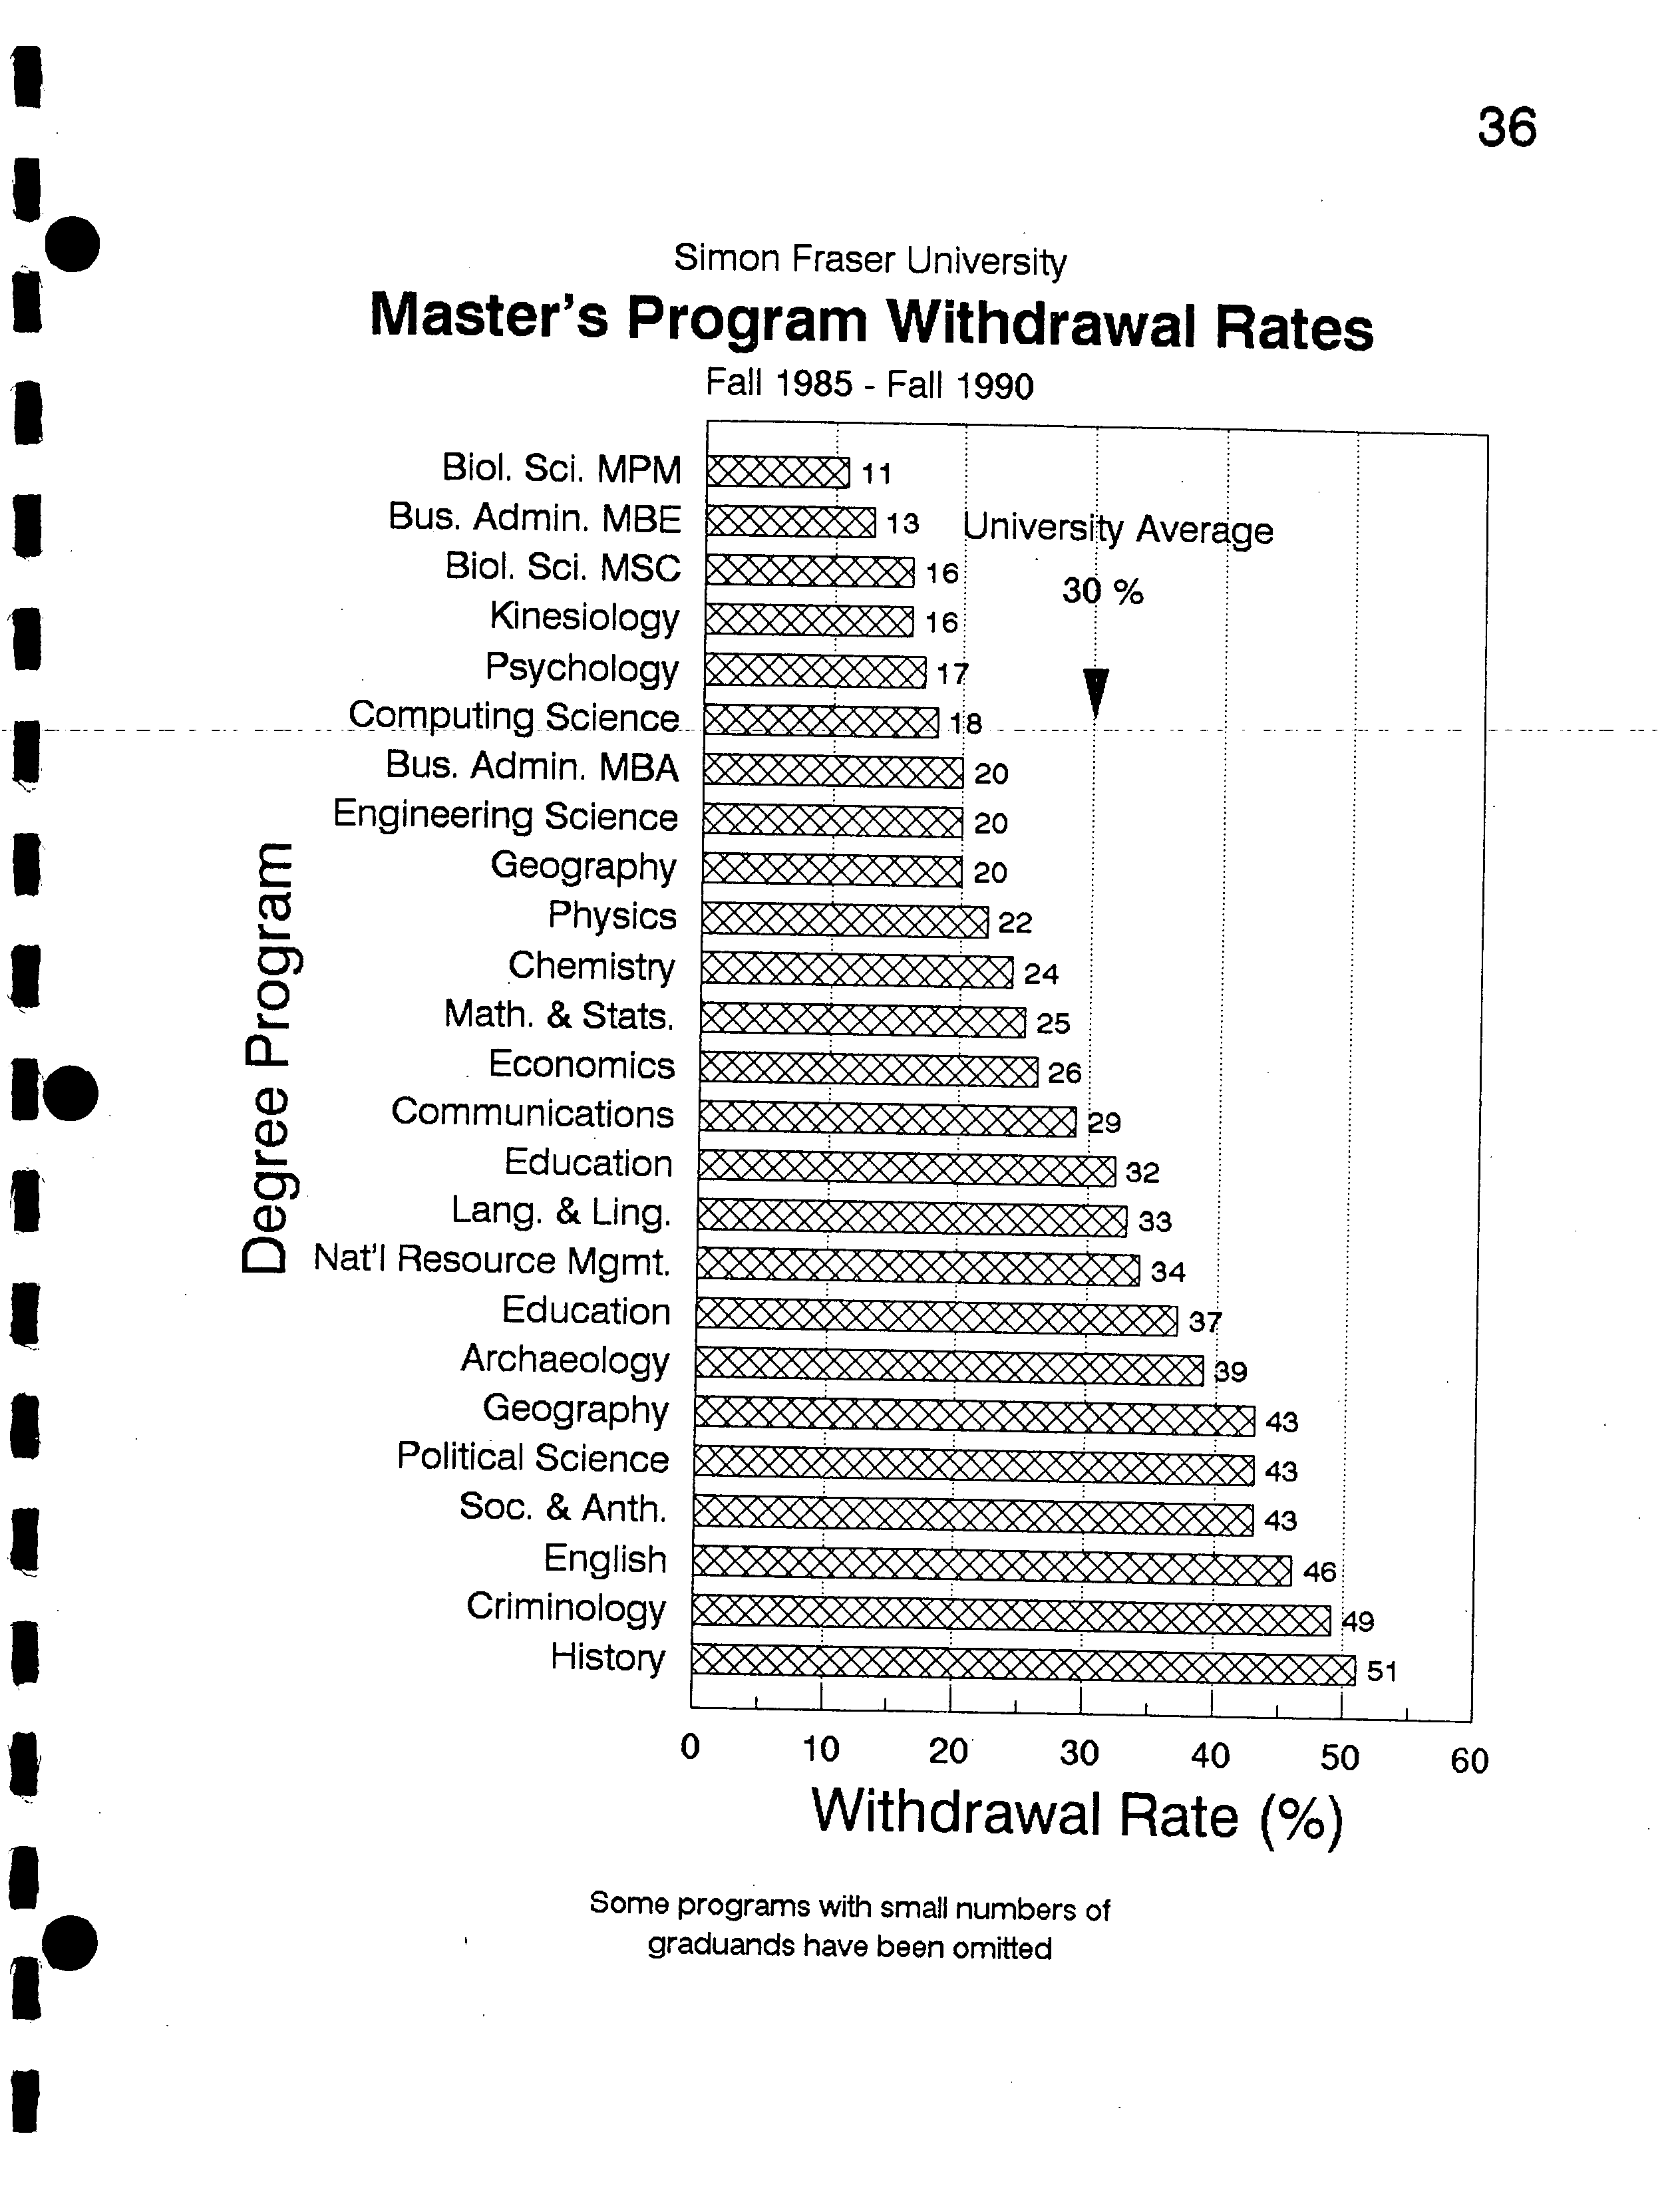
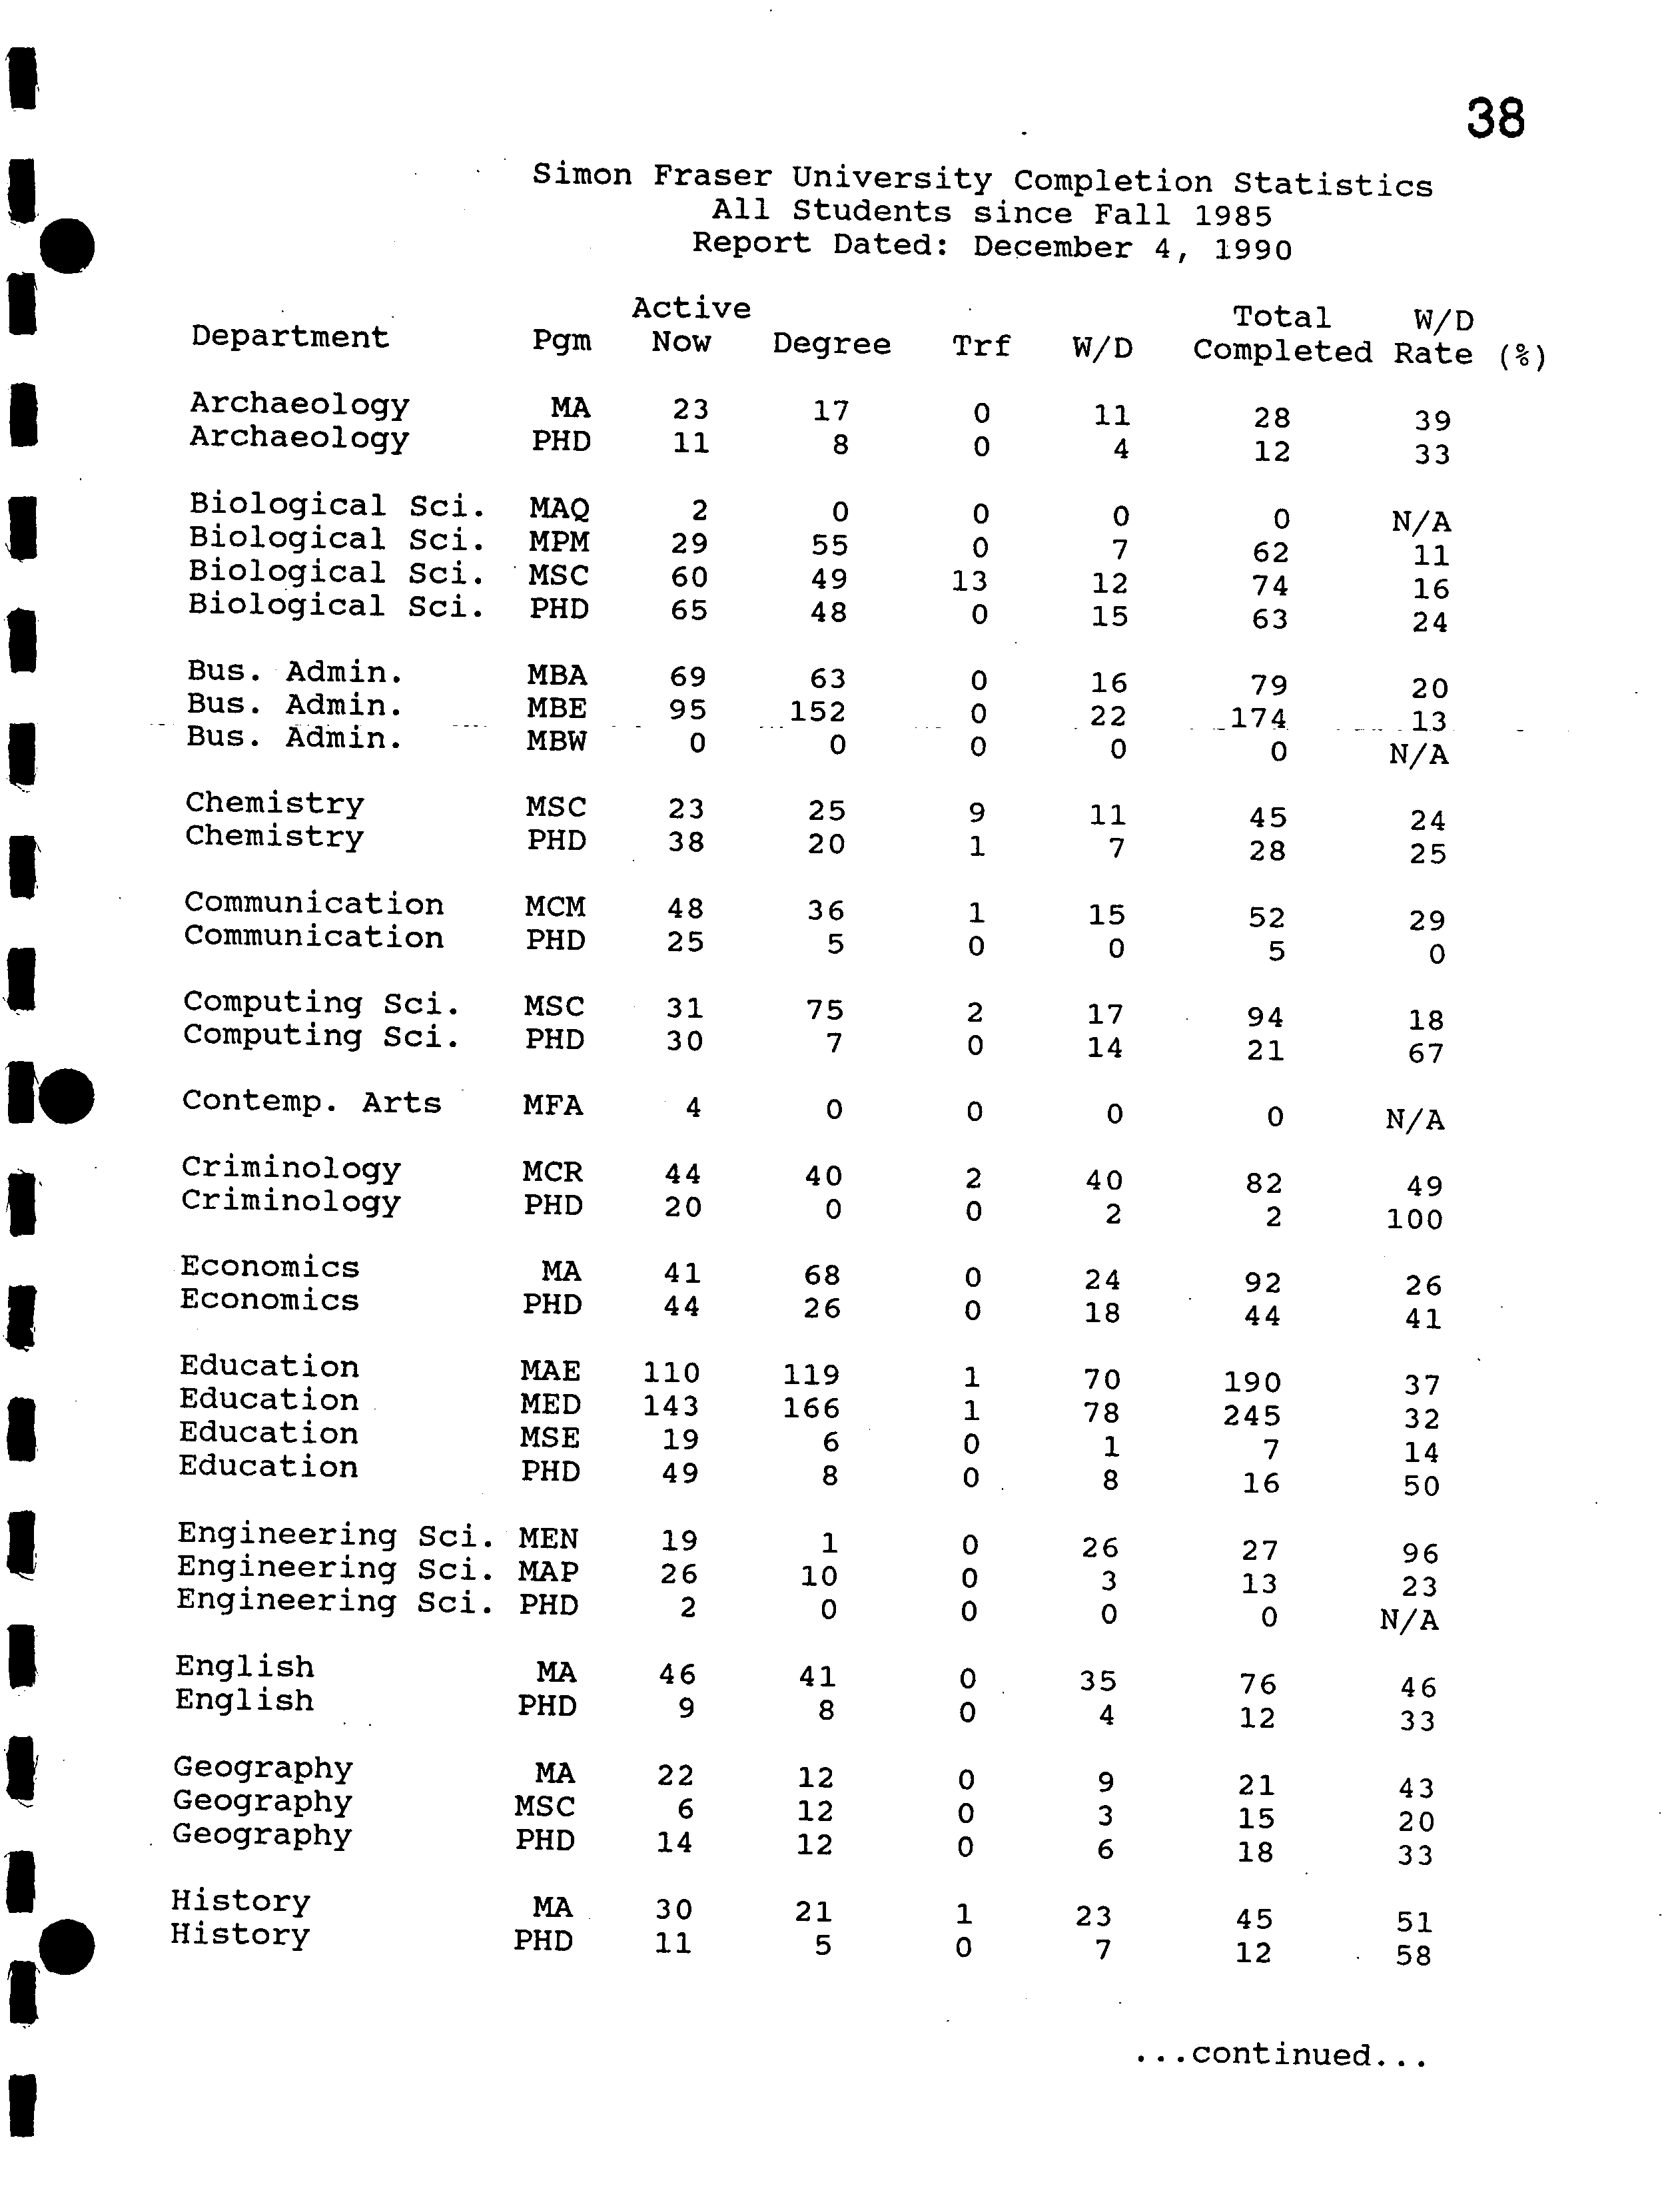
Withdrawal rates are presented, starting on page 36, in the Graduate Studies Fact
Book. There are tremendous variations in rates between programs. The overall
rates for the University as a whole are in line with the results of similar studies
performed in the U.S. I know of no comparable studies yet completed in
Canada, although the Western Canadian Deans of Graduate Studies have now
initiated a project to compile these data.
I am very concerned about the low completion rates in our graduate programs.
Withdrawal may be due to any one of or a combination of factors including:
lack of ability, lack of motivation, lack of financial resources, health problems,
and deficiencies in the graduate programs and/or their implementation. I am
assisting a graduate student who is, as her Master's project, is performing a
study of a sample of students who withdrew; I hope to have the results within a
year. Other analyses of the dataset used to generate the reports in the Graduate
Studies Fact Book are on-going. I also plan to initiate an exit questionnaire.
Meanwhile, I am continuing to press for improved funding for graduate financial
aid. There have been very substantial increases to the graduate scholarships
budget in the last two years. I am very pleased that the recently concluded
agreement with Teaching Support Staff Union increases the Teaching Assistant
stipend and reduces the workload. The latter factor will both allow students more
time for their studies and will create additional teaching assistant positions,
allowing more graduate students to receive appointments.
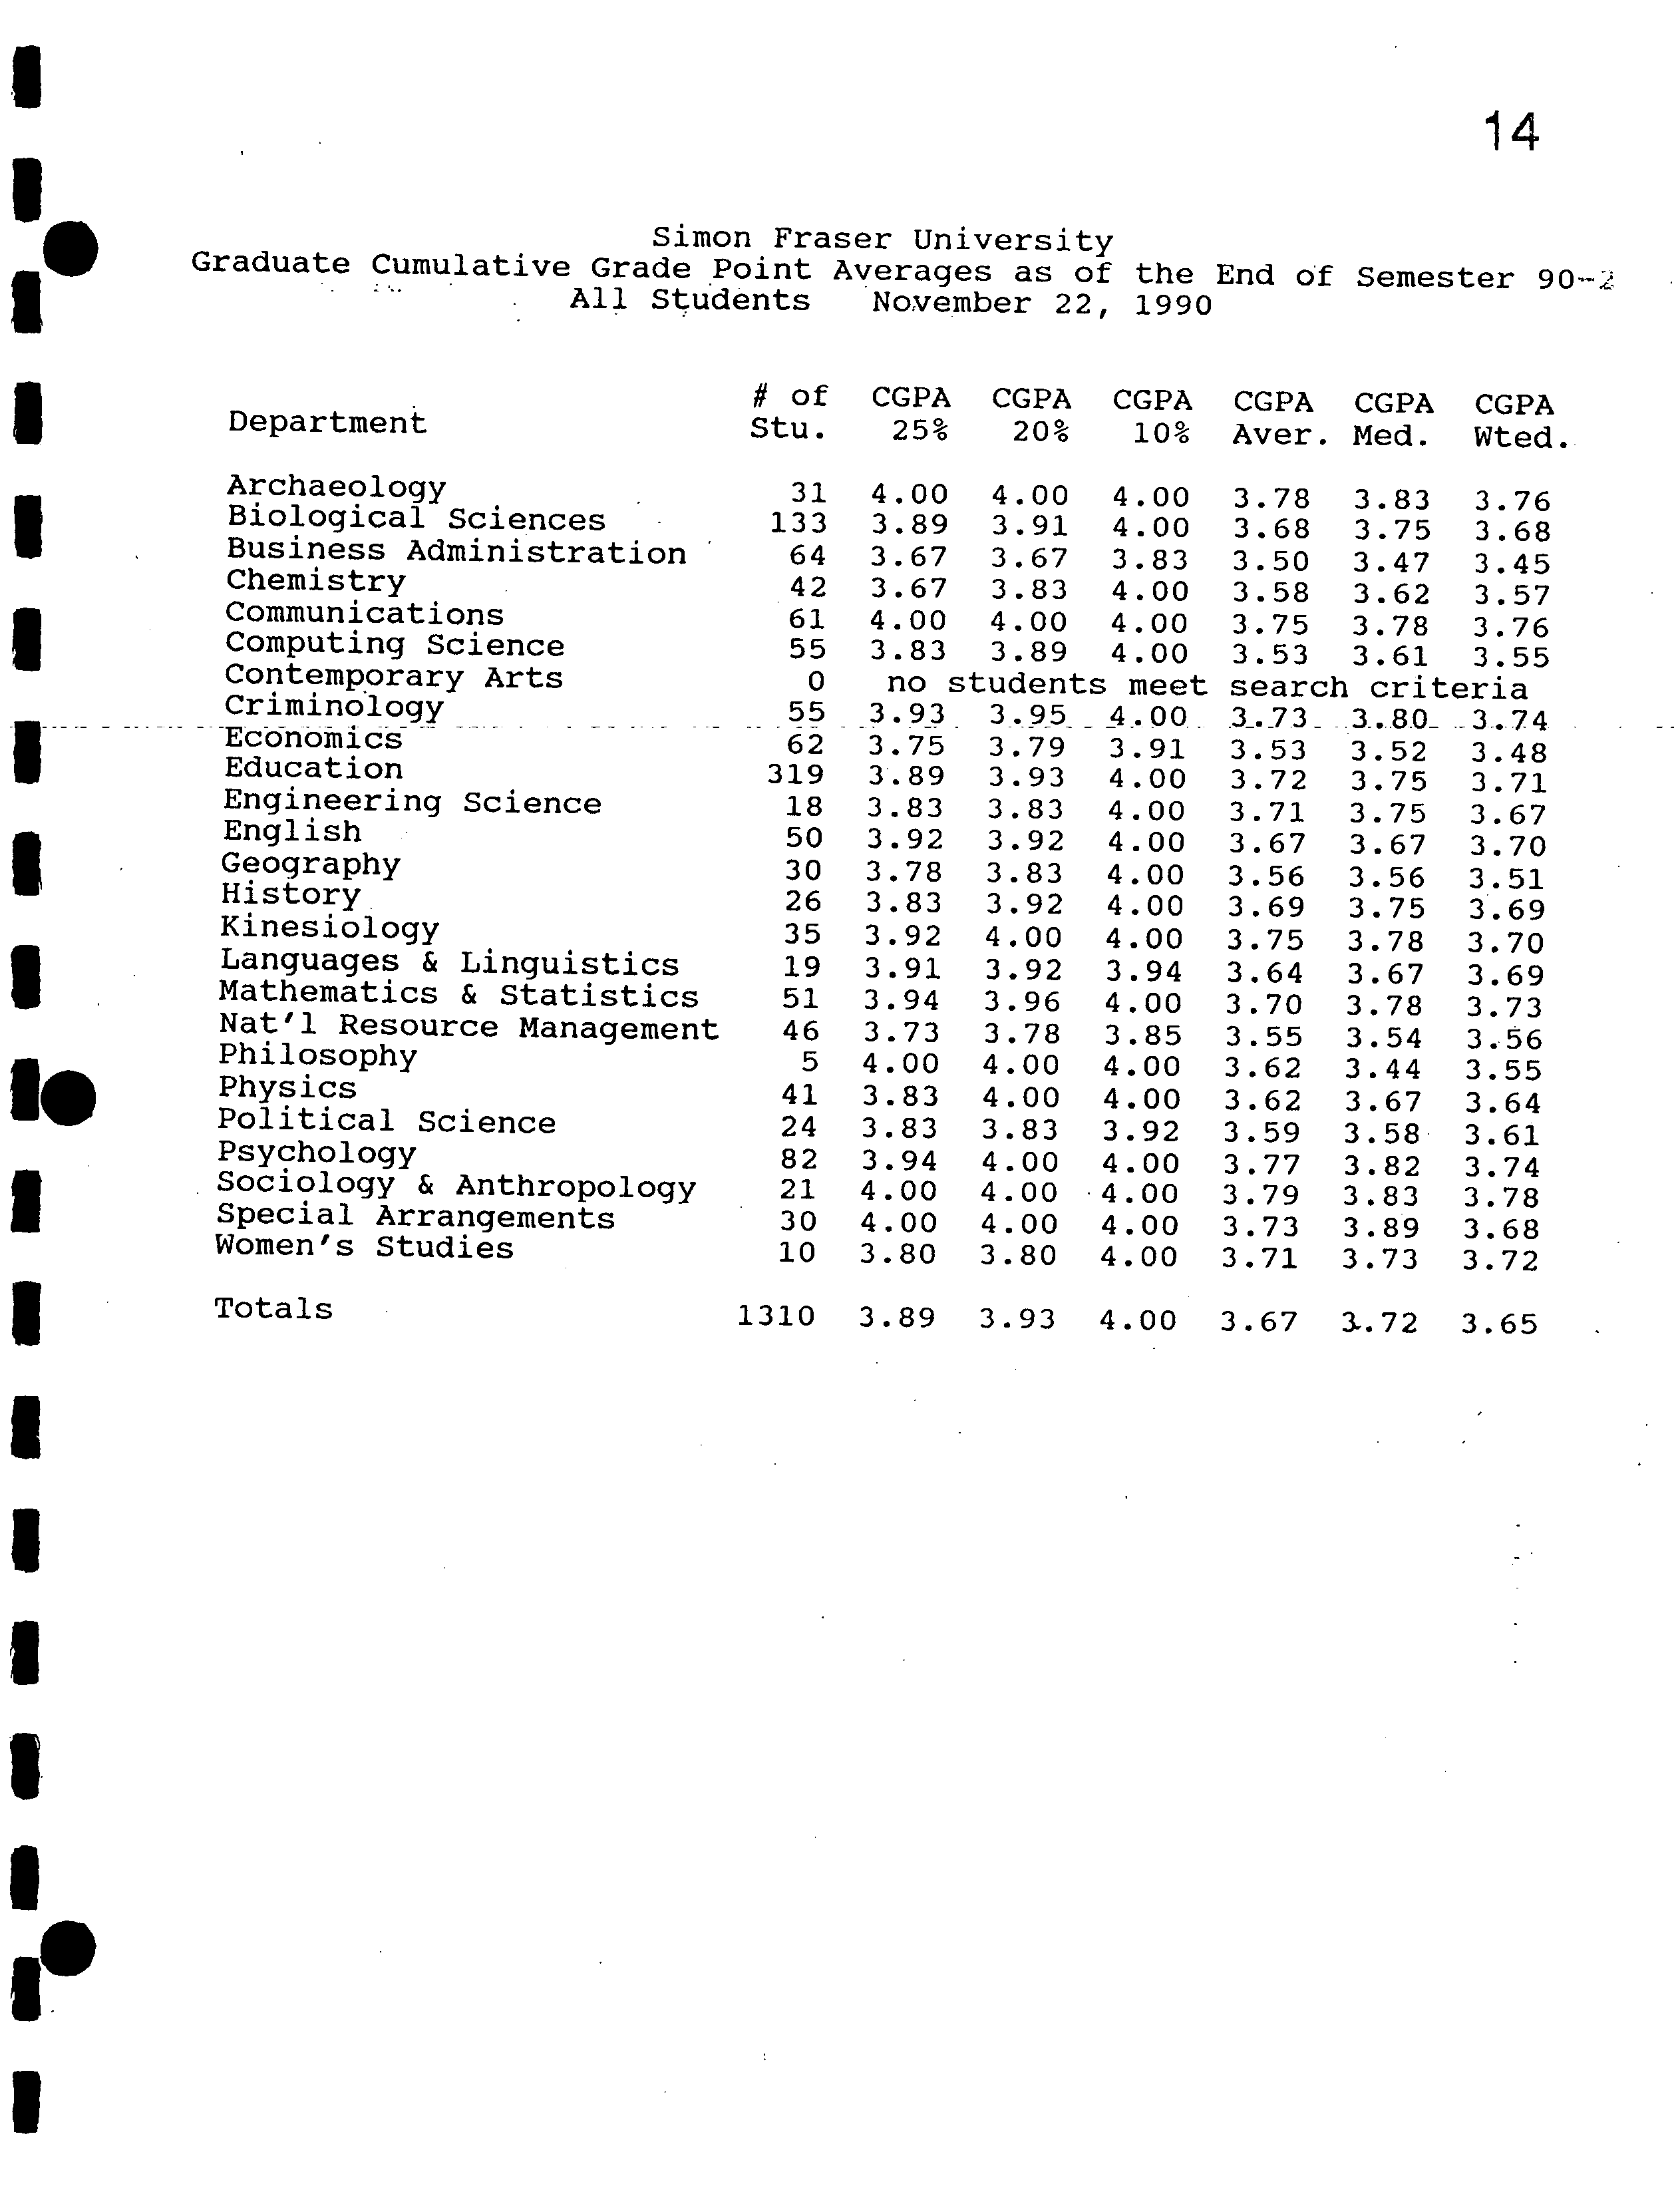
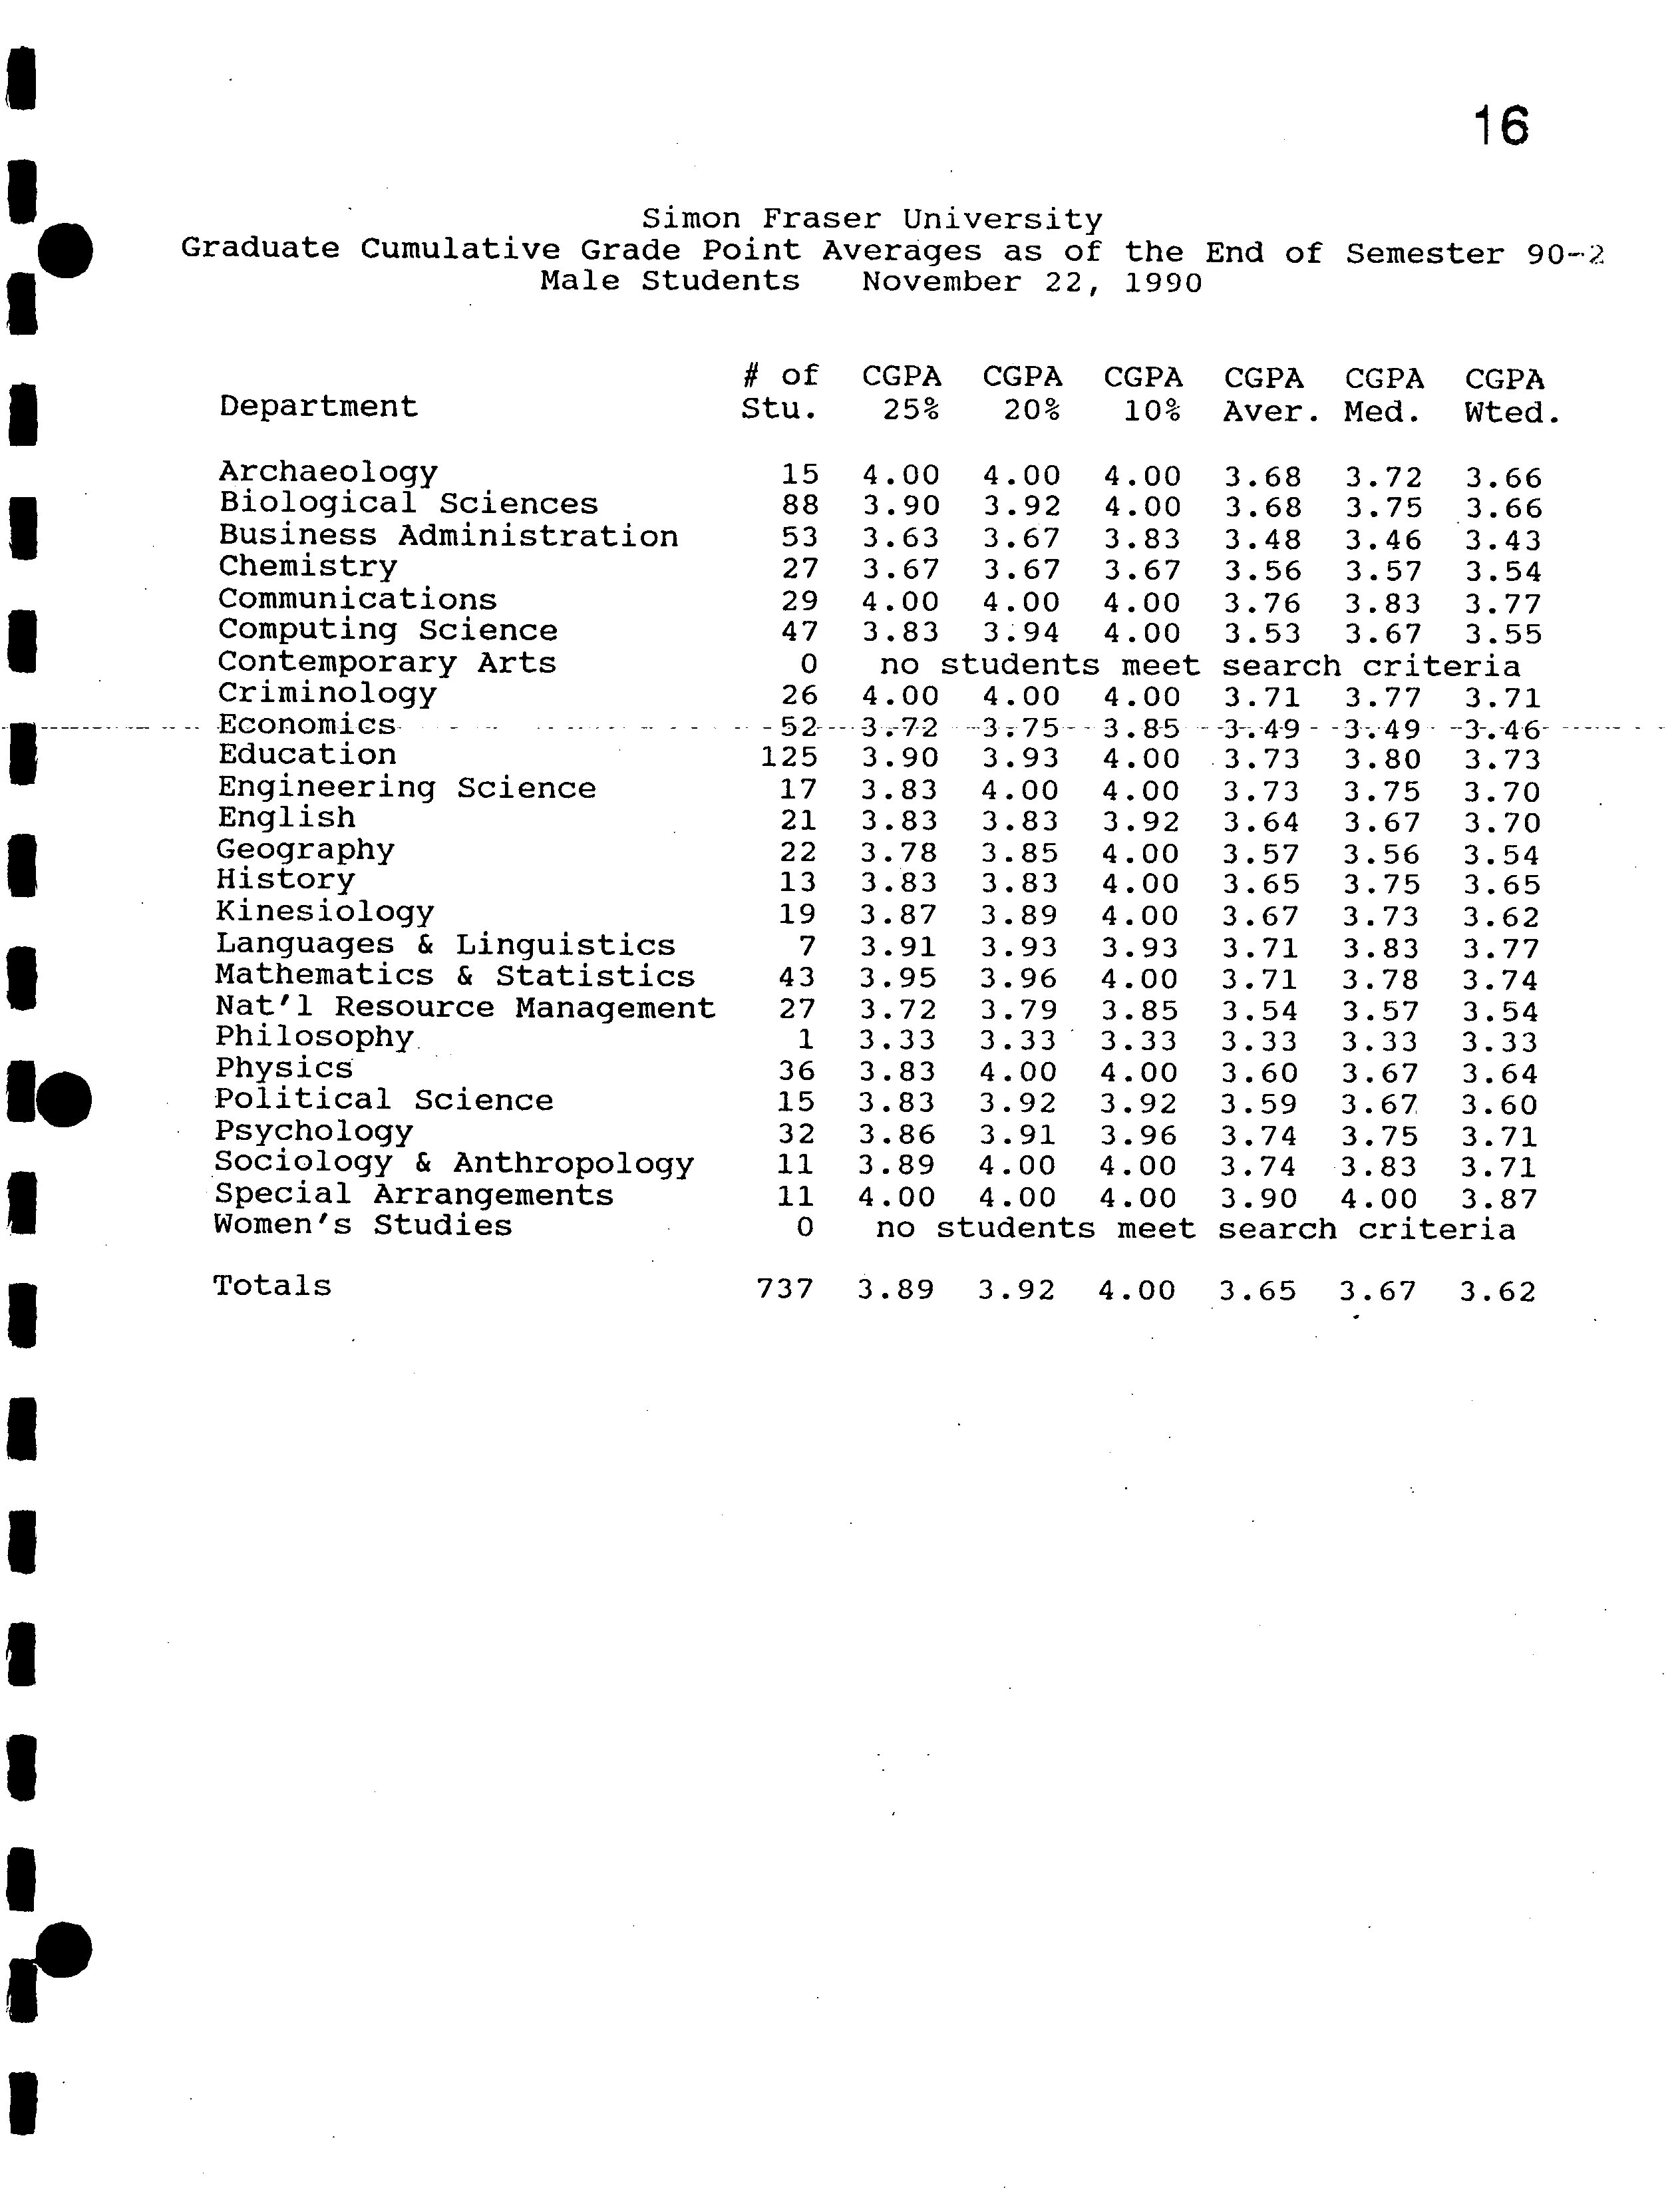
M. Grades
Page 13 of the Graduate Studies Fact Book gives information on the S.F.U.
graduate grades of the end of the Summer 1990 semester; it excludes students
who had not yet taken an S.F.U. graduate course. Data were taken from the
Registrar's data files and incorporated into and processed within the Graduate
Studies Database system.
?
0
4
Ki
Report to Senate
02/04/1991
Page 3
The tremendous range in the grade distributions among departments may stem
from two causes: (1) differences in grading practices and (2) differences in the
abilities of students. I believe that, most likely, it is a mixture of these with the
former a larger contributor than the latter. This range is one of the reasons that
I have moved away from interdepartmental comparisons of CGPA in the ranking
of applicants for S.F.U. graduate scholarships.
IV.
Special Arranaements
The Senate Graduate Studies Committee serves as the Graduate Program
Committee of students enrolled under Special Arrangements. I have given special
attention to these students. With the goal of ensuring their satisfactory progress, I
have brought all their supervisory committees into compliance with Senate's
regulations and require up-to-date progress reports as a condition of registration.
The response of students and supervisors has been excellent.
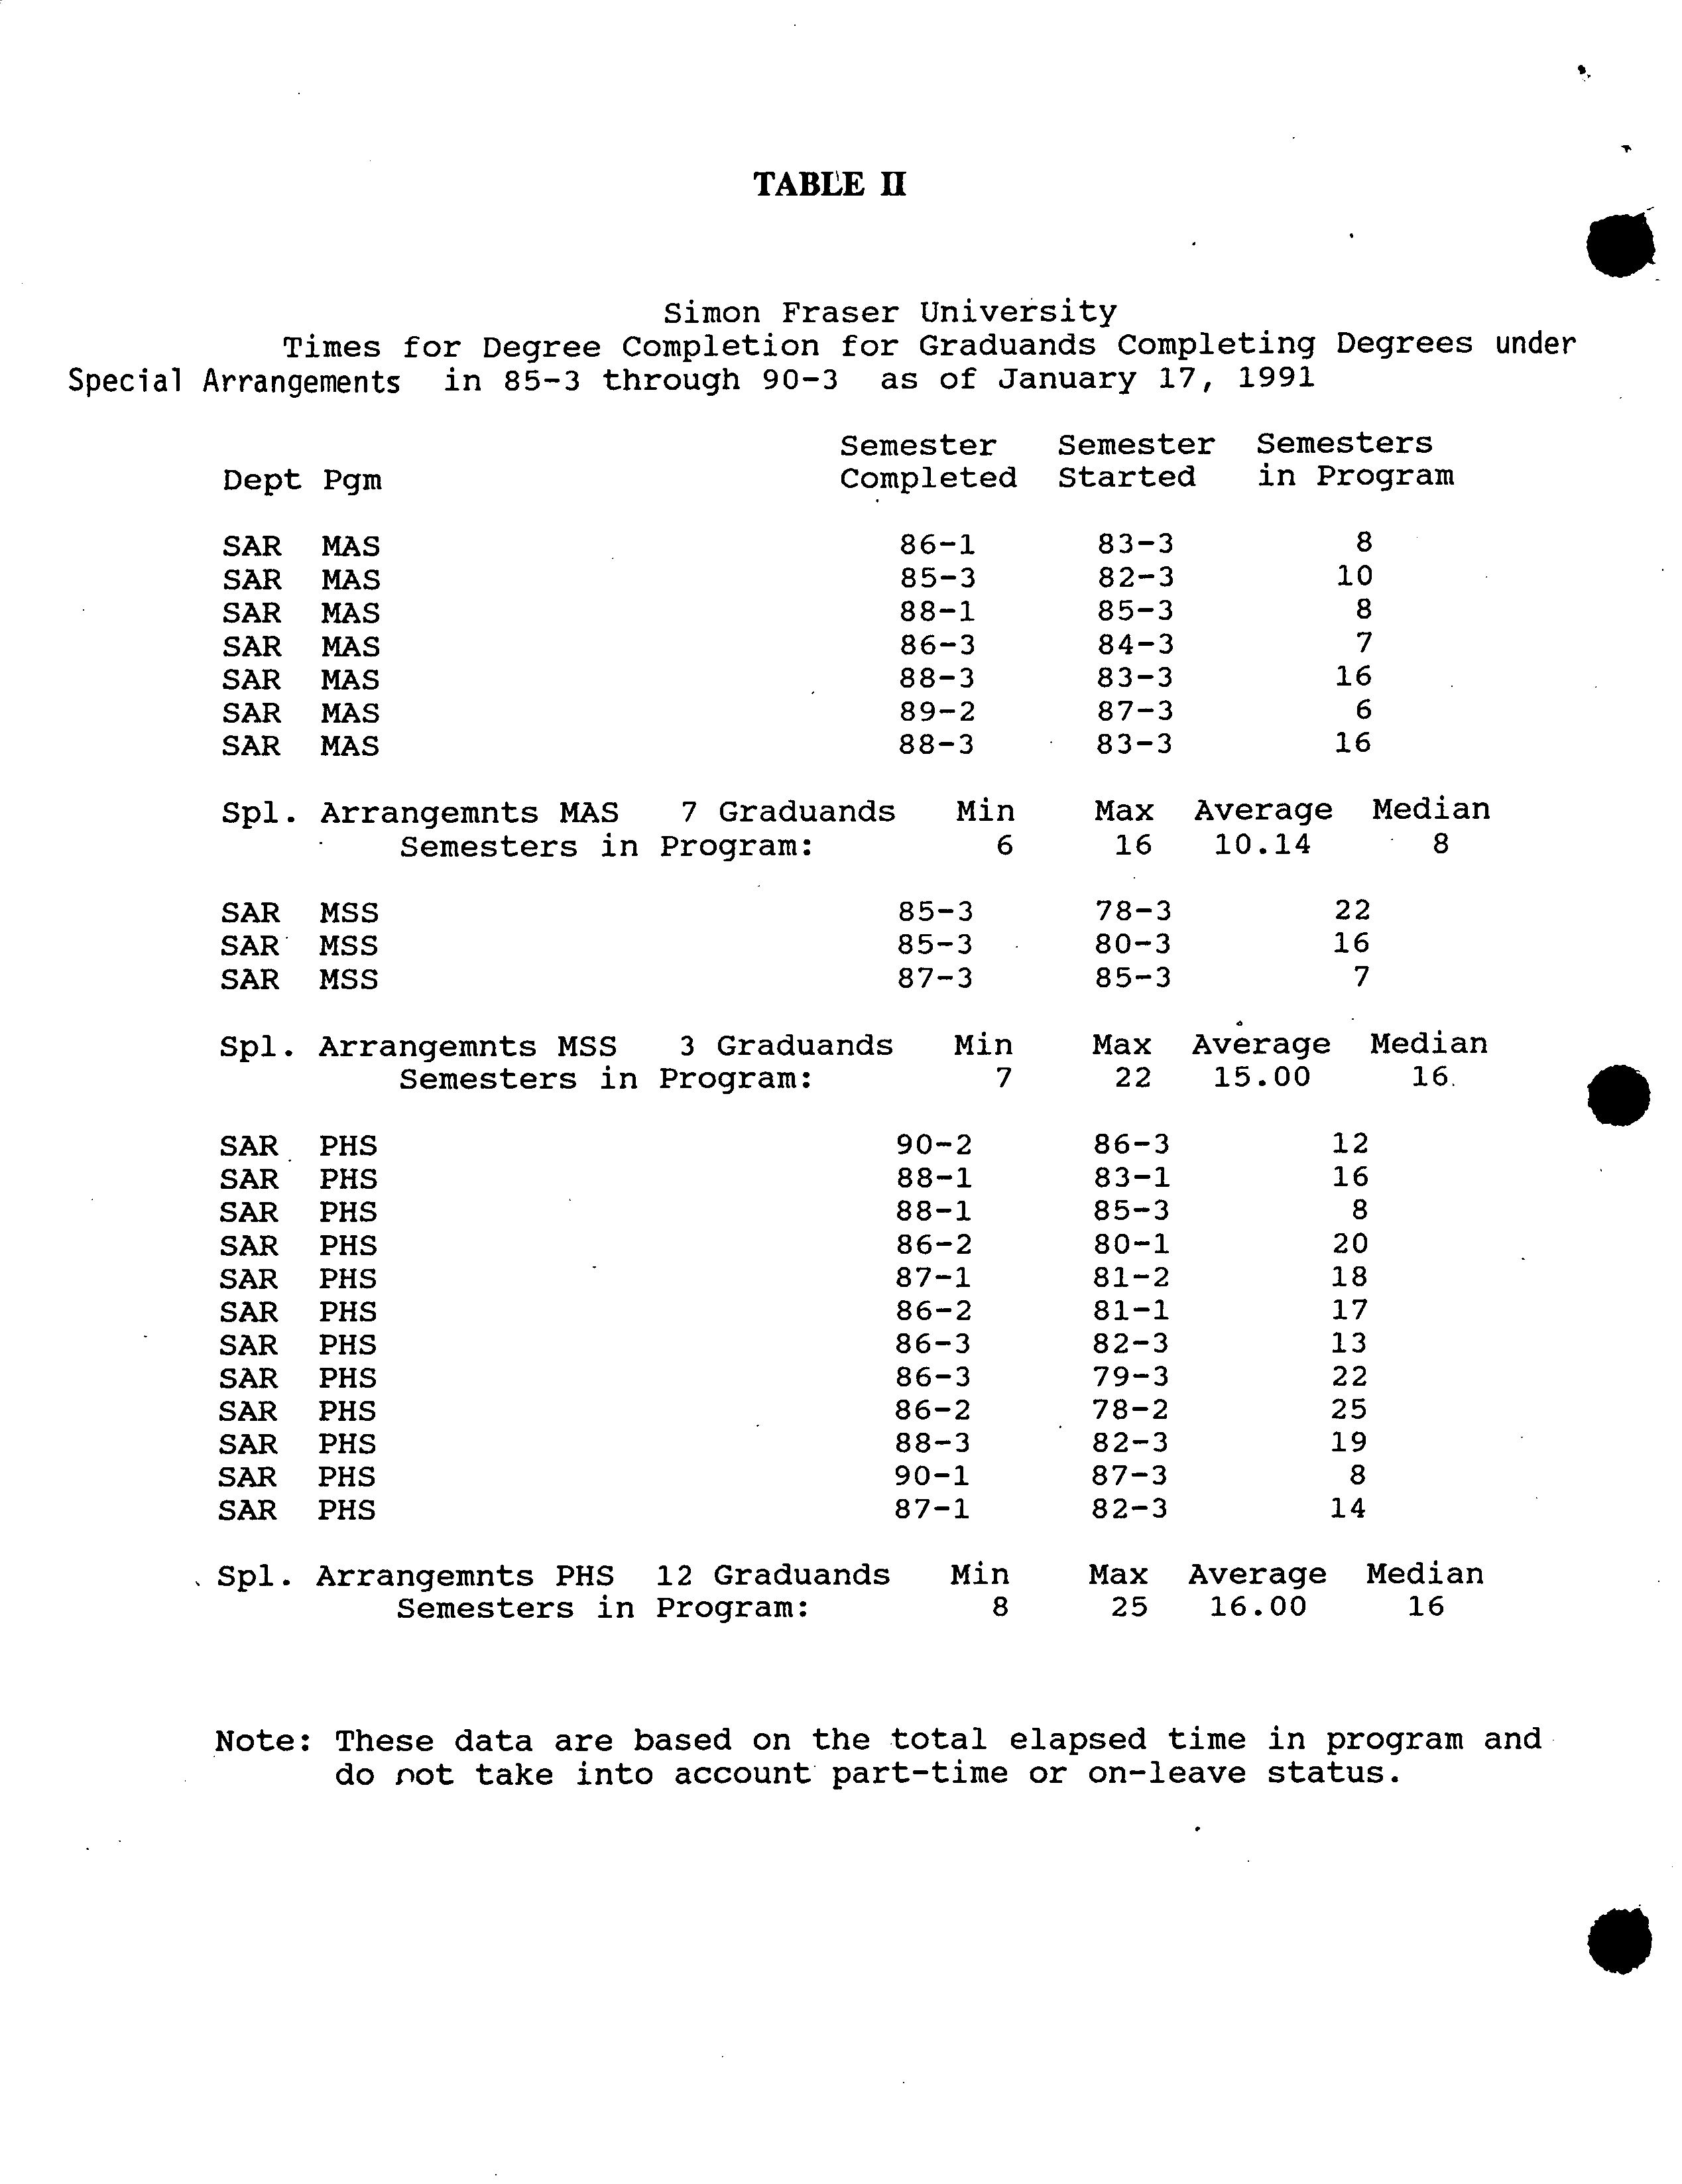
I am pleased to report that the defences of theses completed under Special
Arrangements, which I chair, have all been quite successful. Table
II
provides
some data on degree completion.
Historically, Special Arrangements have been a high risk area; students either
succeed or fail spectacularly. The number of students enrolled have remained
roughly constant around
25.
Degree completion has been highly variable: 2 in
1990, 3 in 1989, 4 in 1988, 7 in 1987, 6 in 1986, 2 in
1985,
6 in 1984, 1 in
1983, 2 in 1982, and 4 in 1981. Some other students have dropped out and
others encountered health problems. By the' steps outlined above and by rigorous
adherence to the criteria for entrance into Special Arrangements, I hope to
improve the success rate.
V.
S.G.S.C. Motions
A summary, prepared by the Office of the Registrar, of the motions passed by
the S.G.S.C. is presented in Appendix
B.
VI.
The Future
I remain optimistic about the future of graduate studies at SFU. We have
introduced a number of new programs which are in the process of implementa-
tion. Several other exciting new program initiatives are presently in the planning
process; some of these have received approval from the Senate Committee on
Academic Planning approval to proceed with detailed planning. Substantial growth
0
Report to Senate
02/04/1991
Page ?
V
in
graduate
programs is a component of the University's strategic plan. It
will
be
essential
to ensure that sufficient resources
are allocated
to support
this
growth
while
maintaining
high quality. ?
V
The
quality
of our existing programs remains high
and
the
quality
of most of the
thesis defences which I have attended
has been
high. With
rare
exception,
applicants recommended by departments for entry into Ph.D. programs have been
very strong. Through aggressive, recruiting of excellent applicants with the
aid
of
entrance scholarships, rigorous enforcement of the present requirements for
satisfactory
progress, improved financial
aid and careful
monitoring of student
supervision, it should be possible to improve
further
the
quality
of our graduate
programs,
and
to
decrease
degree completion times
and
withdrawal rates, thus
making more effective
use
of our resources.
^^ ^^-) caoj^
B.P. Clayman
Dean
of
Graduate
Studies
LM
BPC:vb
Attachments
\REPORTS\9 1-SENATE
El
4
?
TABLE I
SUMMARY DATA*
?
84/85 ?
85/86
?
86/87
?
87/88 ?
88/89 ?
89/90
Annualized Graduate Enrobnents
Head Count ?
1419 ?
1377 ?
1366 ?
1426 ?
1444 ?
1486
FTE ?
1153 ?
1125 ?
1084 ?
1147 ?
1169 ?
1256
Degrees Awarded
Master's ?
218 ?
279 ?
214
Doctoral ?
37 ?
39
?
42
TOTAL ?
255
?
318 ?
256
213
253
245
50
45
50
263
298
295
0 ?
*Source. 1990 SFU Fact Book
im
TABLE II
0
Simon Fraser University
Times for Degree Completion for Graduands
Completing
Degrees
under
Special Arrangements ?
in 85-3 through 90-3
?
as of January
17, ?
1991
Semester
Semester ?
Semesters
Dept Pgm
Completed
Started ?
in Program
SAR MAS
86-1
83-3
8
SAR
MAS
85-3
82-3
10
SAR
MAS
88-1
85-3
8
SAR
MAS
86-3
84-3
7
SAR
MAS
88-3
83-3
16
SAR
MAS
89-2
87-3
6
SAR
MAS
88-3
83-3
16
Spl. Arrangenints MAS
7 Graduands
?
Min
Max ?
Average ?
Median
Semesters in
Program: ?
6
16 ?
10.14
8
SAR
MSS
85-3
78-3
22
SAR MSS
85-3
80-3
16
SAR MSS
87-3
85-3
7
Spi. Arrangemnts MSS
3 Graduands
?
Min
Max ?
Average
Median
Semesters in
Program: ?
7
22 ?
15.00 16.
SAR
PHS
90-2
86-3
12
SAR
PHS
88-1
83-1
16
SAR
PHS
88-1
85-3
8
SAR
PHS
86-2
80-1
20
SAR
PHS
87-1
81-2
18
SAR
PHS
86-2
81-1
17
SAR
PHS
86-3
82-3
13
SAR
PHS
86-3
79-3
22
SAR
PHS
86-2
78-2
25
SAR
PHS
88-3
82-3
19
SAR
PHS
90-1
87-3
8
SAR
PHS
87-1
82-3
14
Spl. Arrangemnts PHS
12 Graduands
?
Min Max ?
Average Median
Semesters in
Program: ?
8 25 ?
16.00 16
Note: These data are based on the total elapsed time in program and
?
do not take into account part-time or on-leave status.
6
?
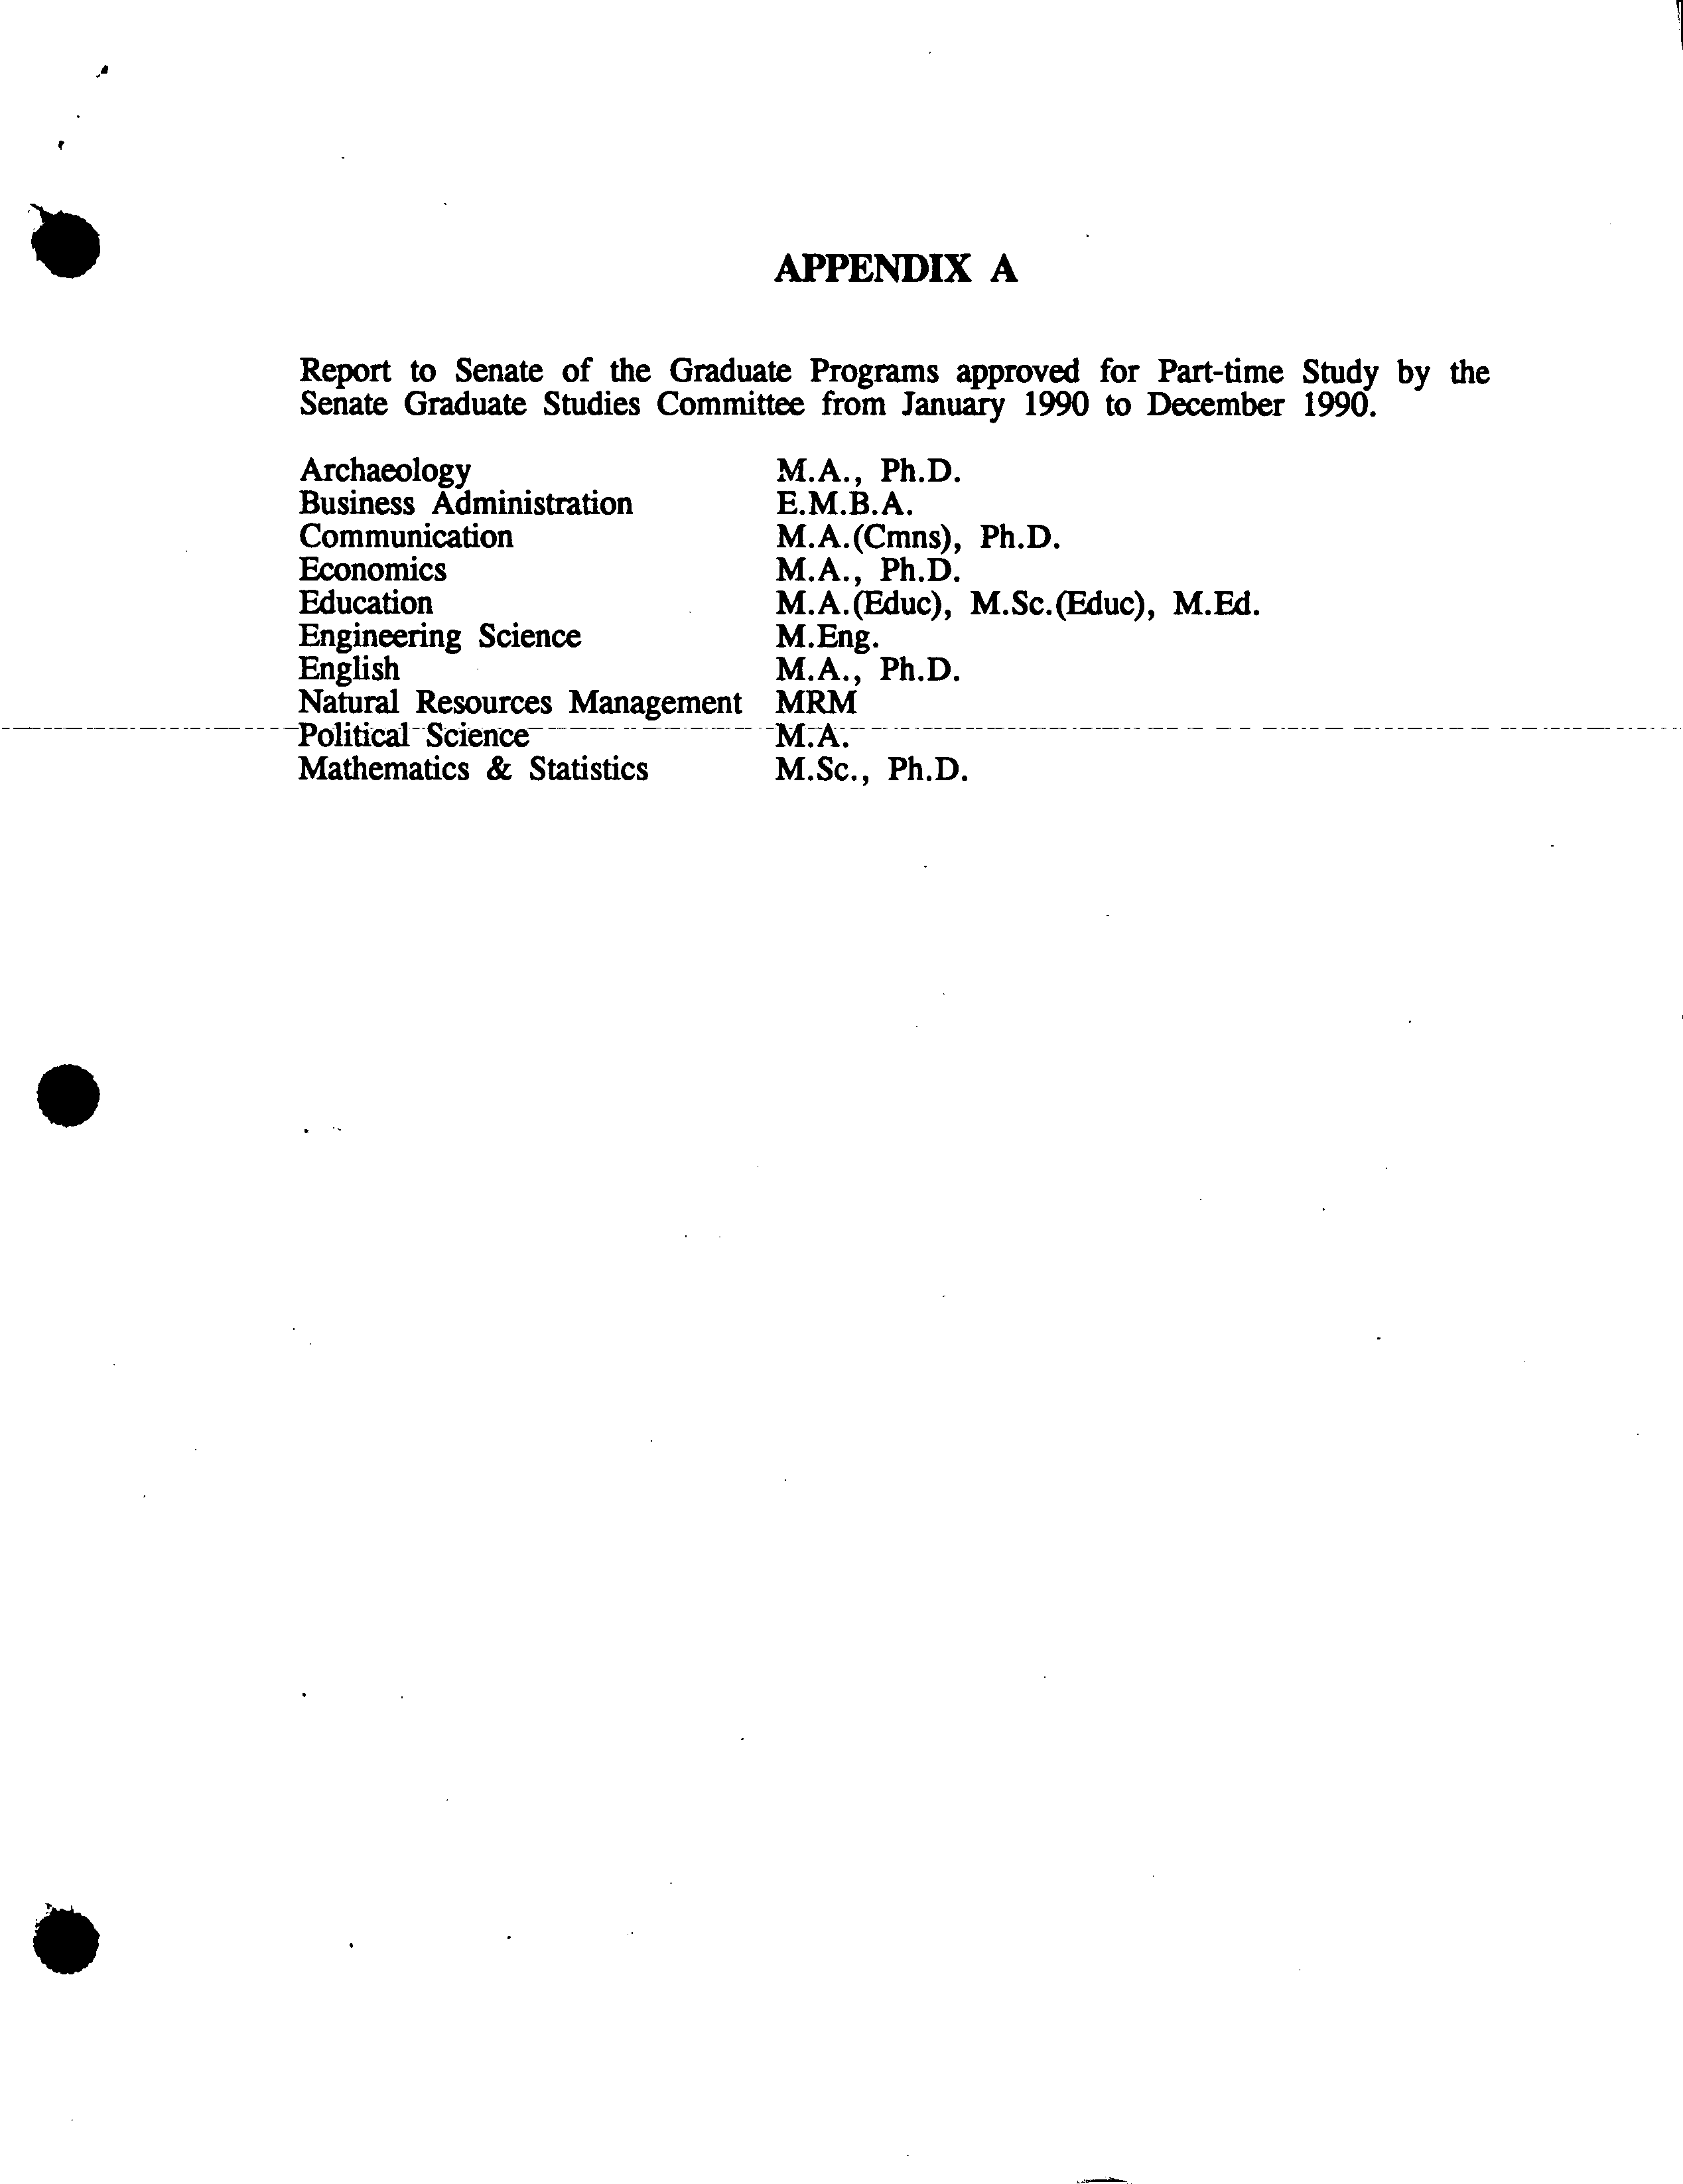
APPENDIX A
Report to Senate of the Graduate Programs approved for Part-time Study by the
Senate Graduate Studies Committee from January 1990 to December 1990.
Archaeology
M.A.,
Ph.D.
Business Administration
E.M.B.A.
Communication
M.A.(Cmns), Ph.D.
Economics
M.A., Ph.D.
Education
M.A.(Educ), M.Sc.(Educ),
M.Ed.
Engineering Science
M.Eng.
English
M.A.,
Ph. D.
Natural Resources Management
MRM
Po1itica1Scieice
F-
-M.-A:.-
- -
Mathematics & Statistics
M.Sc., Ph.D.
11
Ij
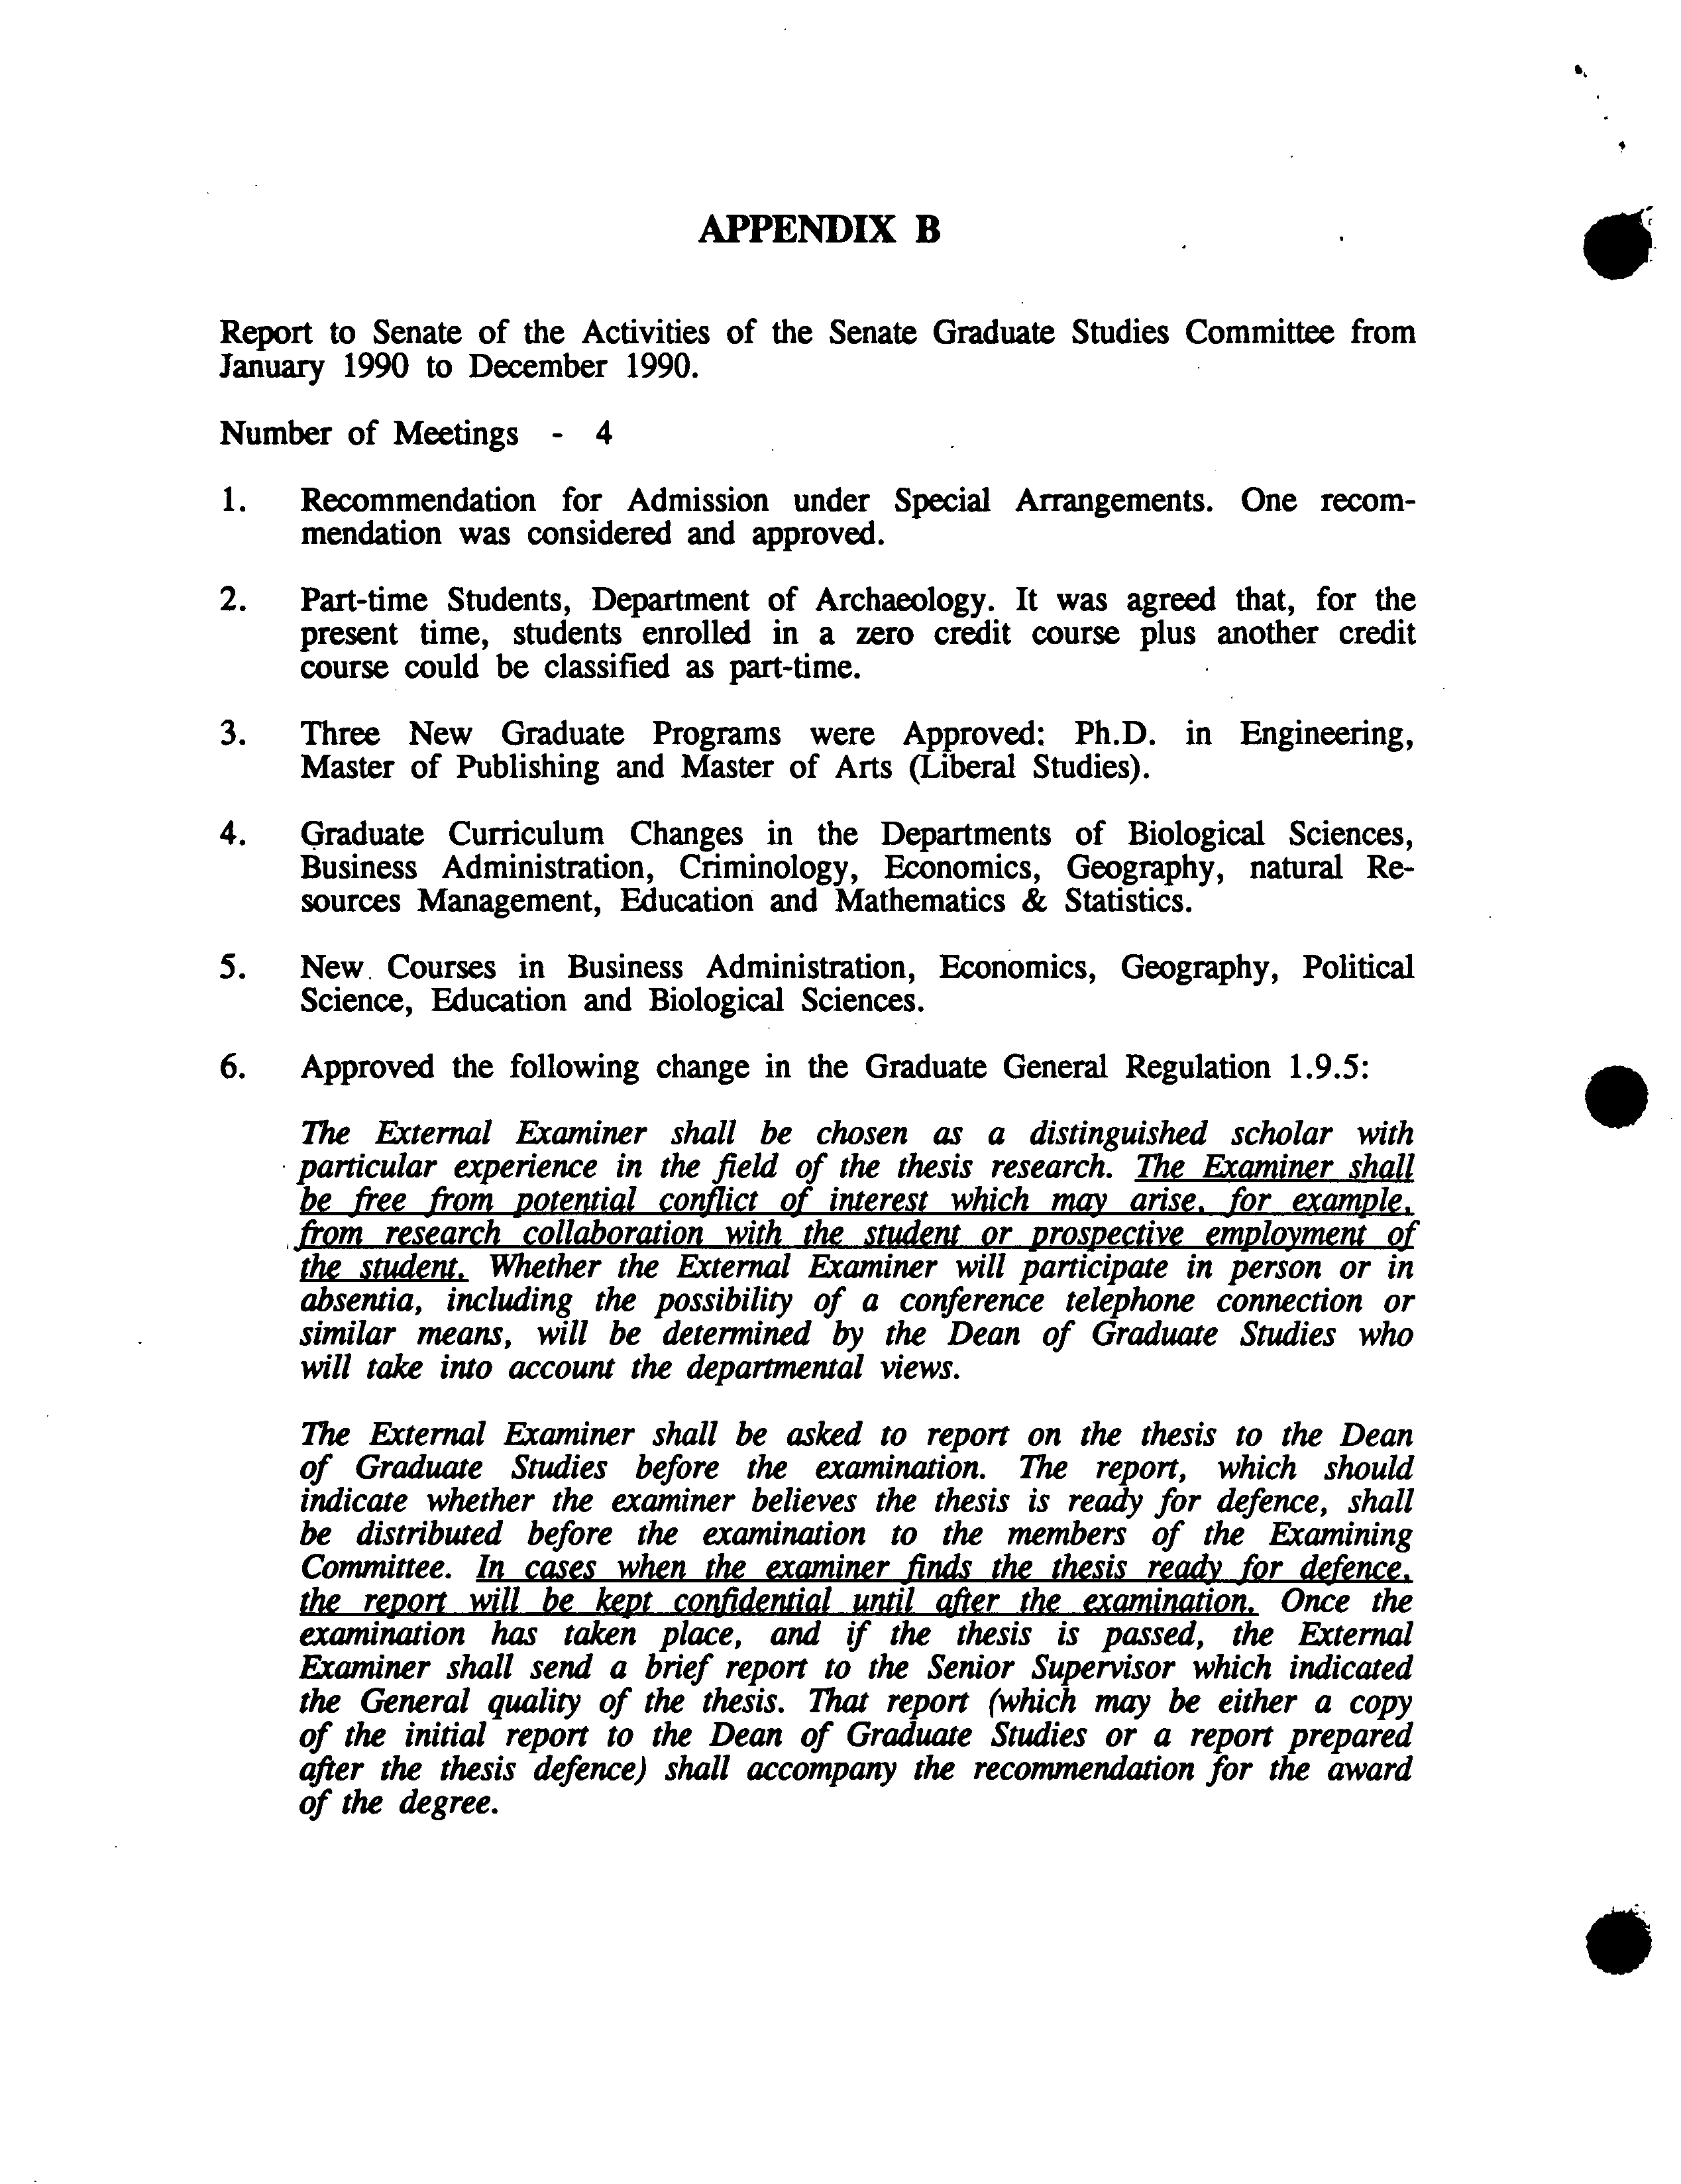
APPENDIX B
Report to Senate of the Activities of the Senate Graduate Studies Committee from
January 1990 to December 1990.
Number of Meetings - 4
1.
Recommendation for Admission under Special Arrangements. One recom-
mendation was considered and approved.
2.
Part-time Students, Department of Archaeology. It was agreed that, for the
present time, students enrolled in a zero credit course plus another credit
course could be classified as part-time.
3.
Three New Graduate Programs were Approved: Ph.D. in Engineering,
Master of Publishing and Master of Arts (Liberal Studies).
4.
Graduate Curriculum Changes in the Departments of Biological Sciences,
Business Administration, Criminology, Economics, Geography, natural Re-
sources Management, Education and Mathematics & Statistics.
5.
New. Courses in Business Administration, Economics, Geography, Political
Science, Education and Biological Sciences.
6.
Approved the following change in the Graduate General Regulation
1.9.5:
The External Examiner shall be chosen as a distinguished scholar with
particular experience in the field of the thesis research. The Examiner shall
from research collaboration with the student or vrosvective emvlovment of
the student. Whether the External Examiner will participate in person or in
absentia, including the possibility of a conference telephone connection or
similar means, will be determined by the Dean of Graduate Studies who
will take into account the departmental views.
The External Examiner shall be asked to report on the thesis to the Dean
of Graduate Studies before the examination. The report, which should
indicate whether the examiner believes the thesis is ready for defence, shall
be distributed before the examination to the members of the Examining
Committee. In cases when the examiner finds the thesis rec4v for defence.
the report will be kept
confidential
until after the examination. Once the
examination has taken place, and if the thesis is passed, the External
Examiner shall send a brief report to the Senior Supervisor which indicated
the General quality of the thesis. That report (which may be either a copy
of the initial report to the Dean of Graduate Studies or a report prepared
after the thesis defence) shall accompany the recommendation for the award
of the degree.
January 1991
Office of the Dean of Graduate Studies
?
Simon Fraser University
?
Burnaby, British Columbia
?
V5A1S6
SIMON FRASER UNIVERSITY
Graduate Studies Fact Book
1
I
Simon Fraser University
I ?
Graduate Studies Fact Book
I
The Graduate Studies Fact Book provides a snap-shot of the Fall
Semester student population as well as retrospective data on
-I
---program completion— The information Is derived from enrolment - - -
data provided by the Office of the Registrar supplemented by
I ?
information gathered and processed by this office. It is
complementary to the S.F.U. Fact Book prepared by the Office of
i ?
Analytical Studies.
Each section is headed by a graphical summary. In some cases,
lie ?
the summaries omit programs where the numbers reported are too
small to be significant; the tabular data which follow are
I
complete.
I ?
It is hoped that this Fact Book will be a useful source of
information for the campus community. It is the first edition
I ?
and may contain errors or other deficiencies. Suggestions for
improvements would be welcomed.
I
Bruce P. Clayman
I
Dean of Graduate Studies
Simon Fraser University
I
?
Burnaby, B.C. V5A
Phone: (604) 291-4255
I
?
?
Fax: (604) 291-3080
userbclb@SFU. BITNET
1
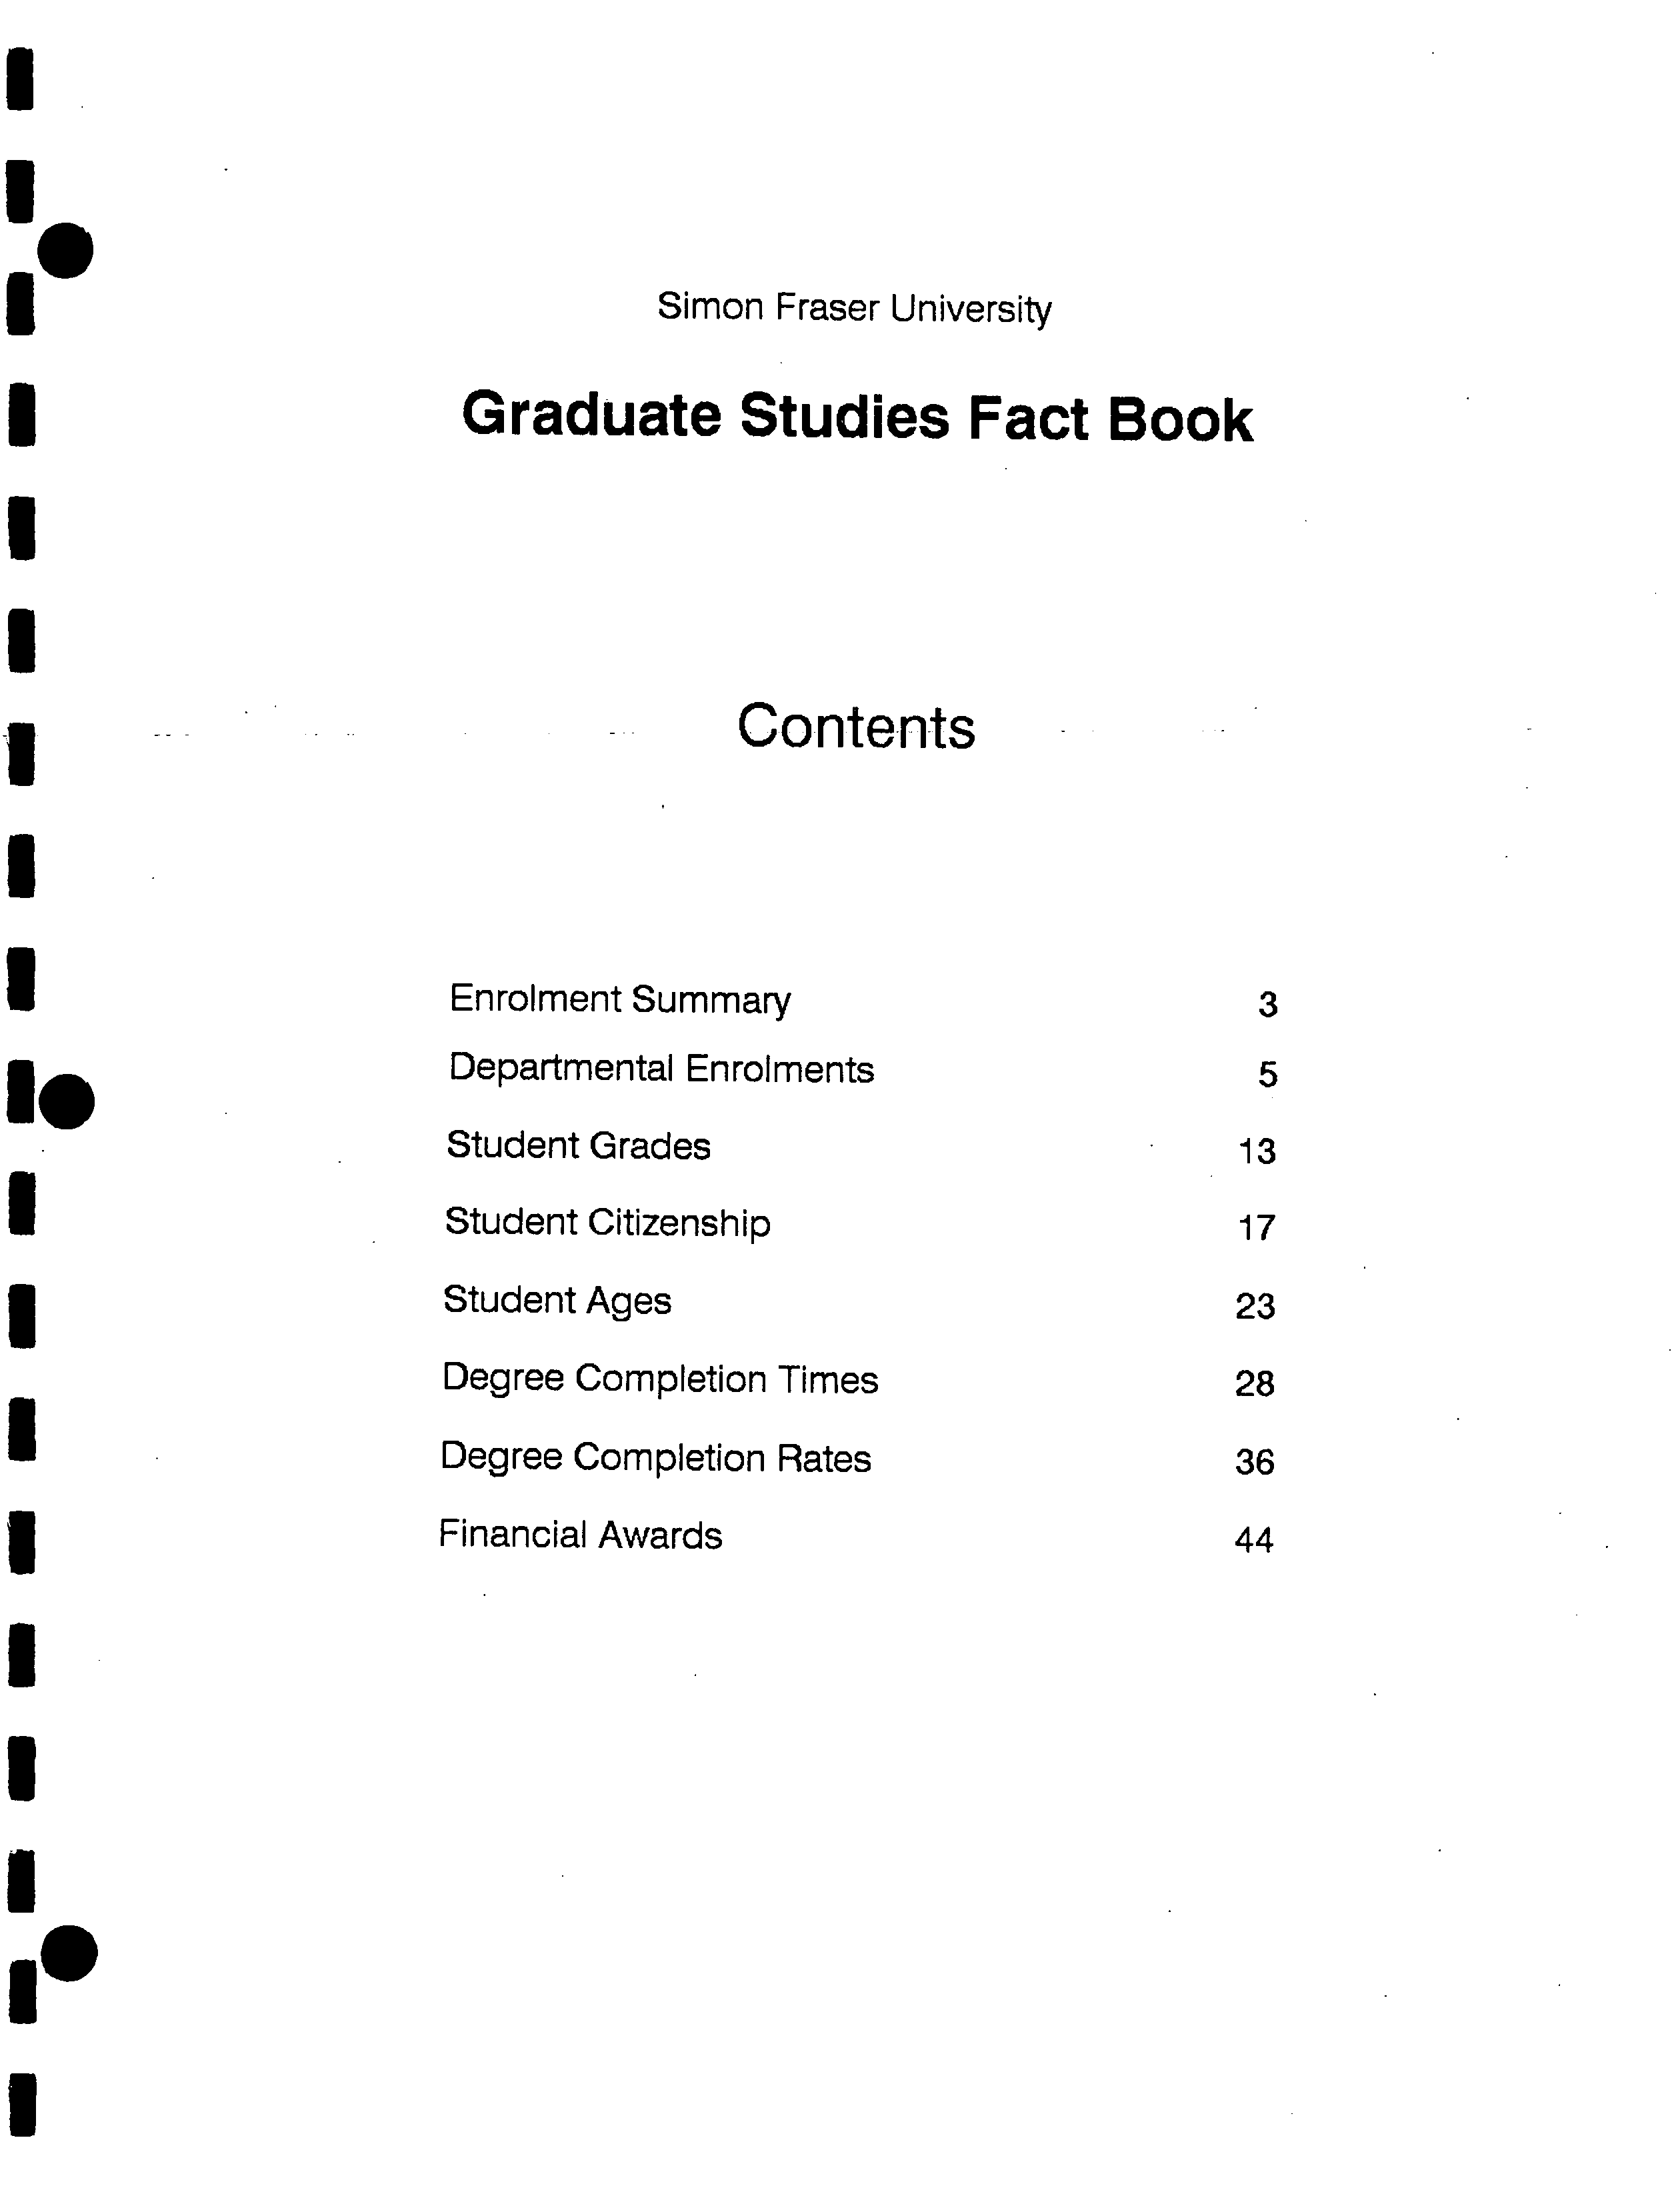
Simon Fraser University
Graduate Studies Fact Book
Contents
Enrolment Summary
3
Departmental Enrolments
5
Student Grades
13
Student Citizenship
17
Student Ages
23
Degree Completion Times
28
Degree Completion Rates
36
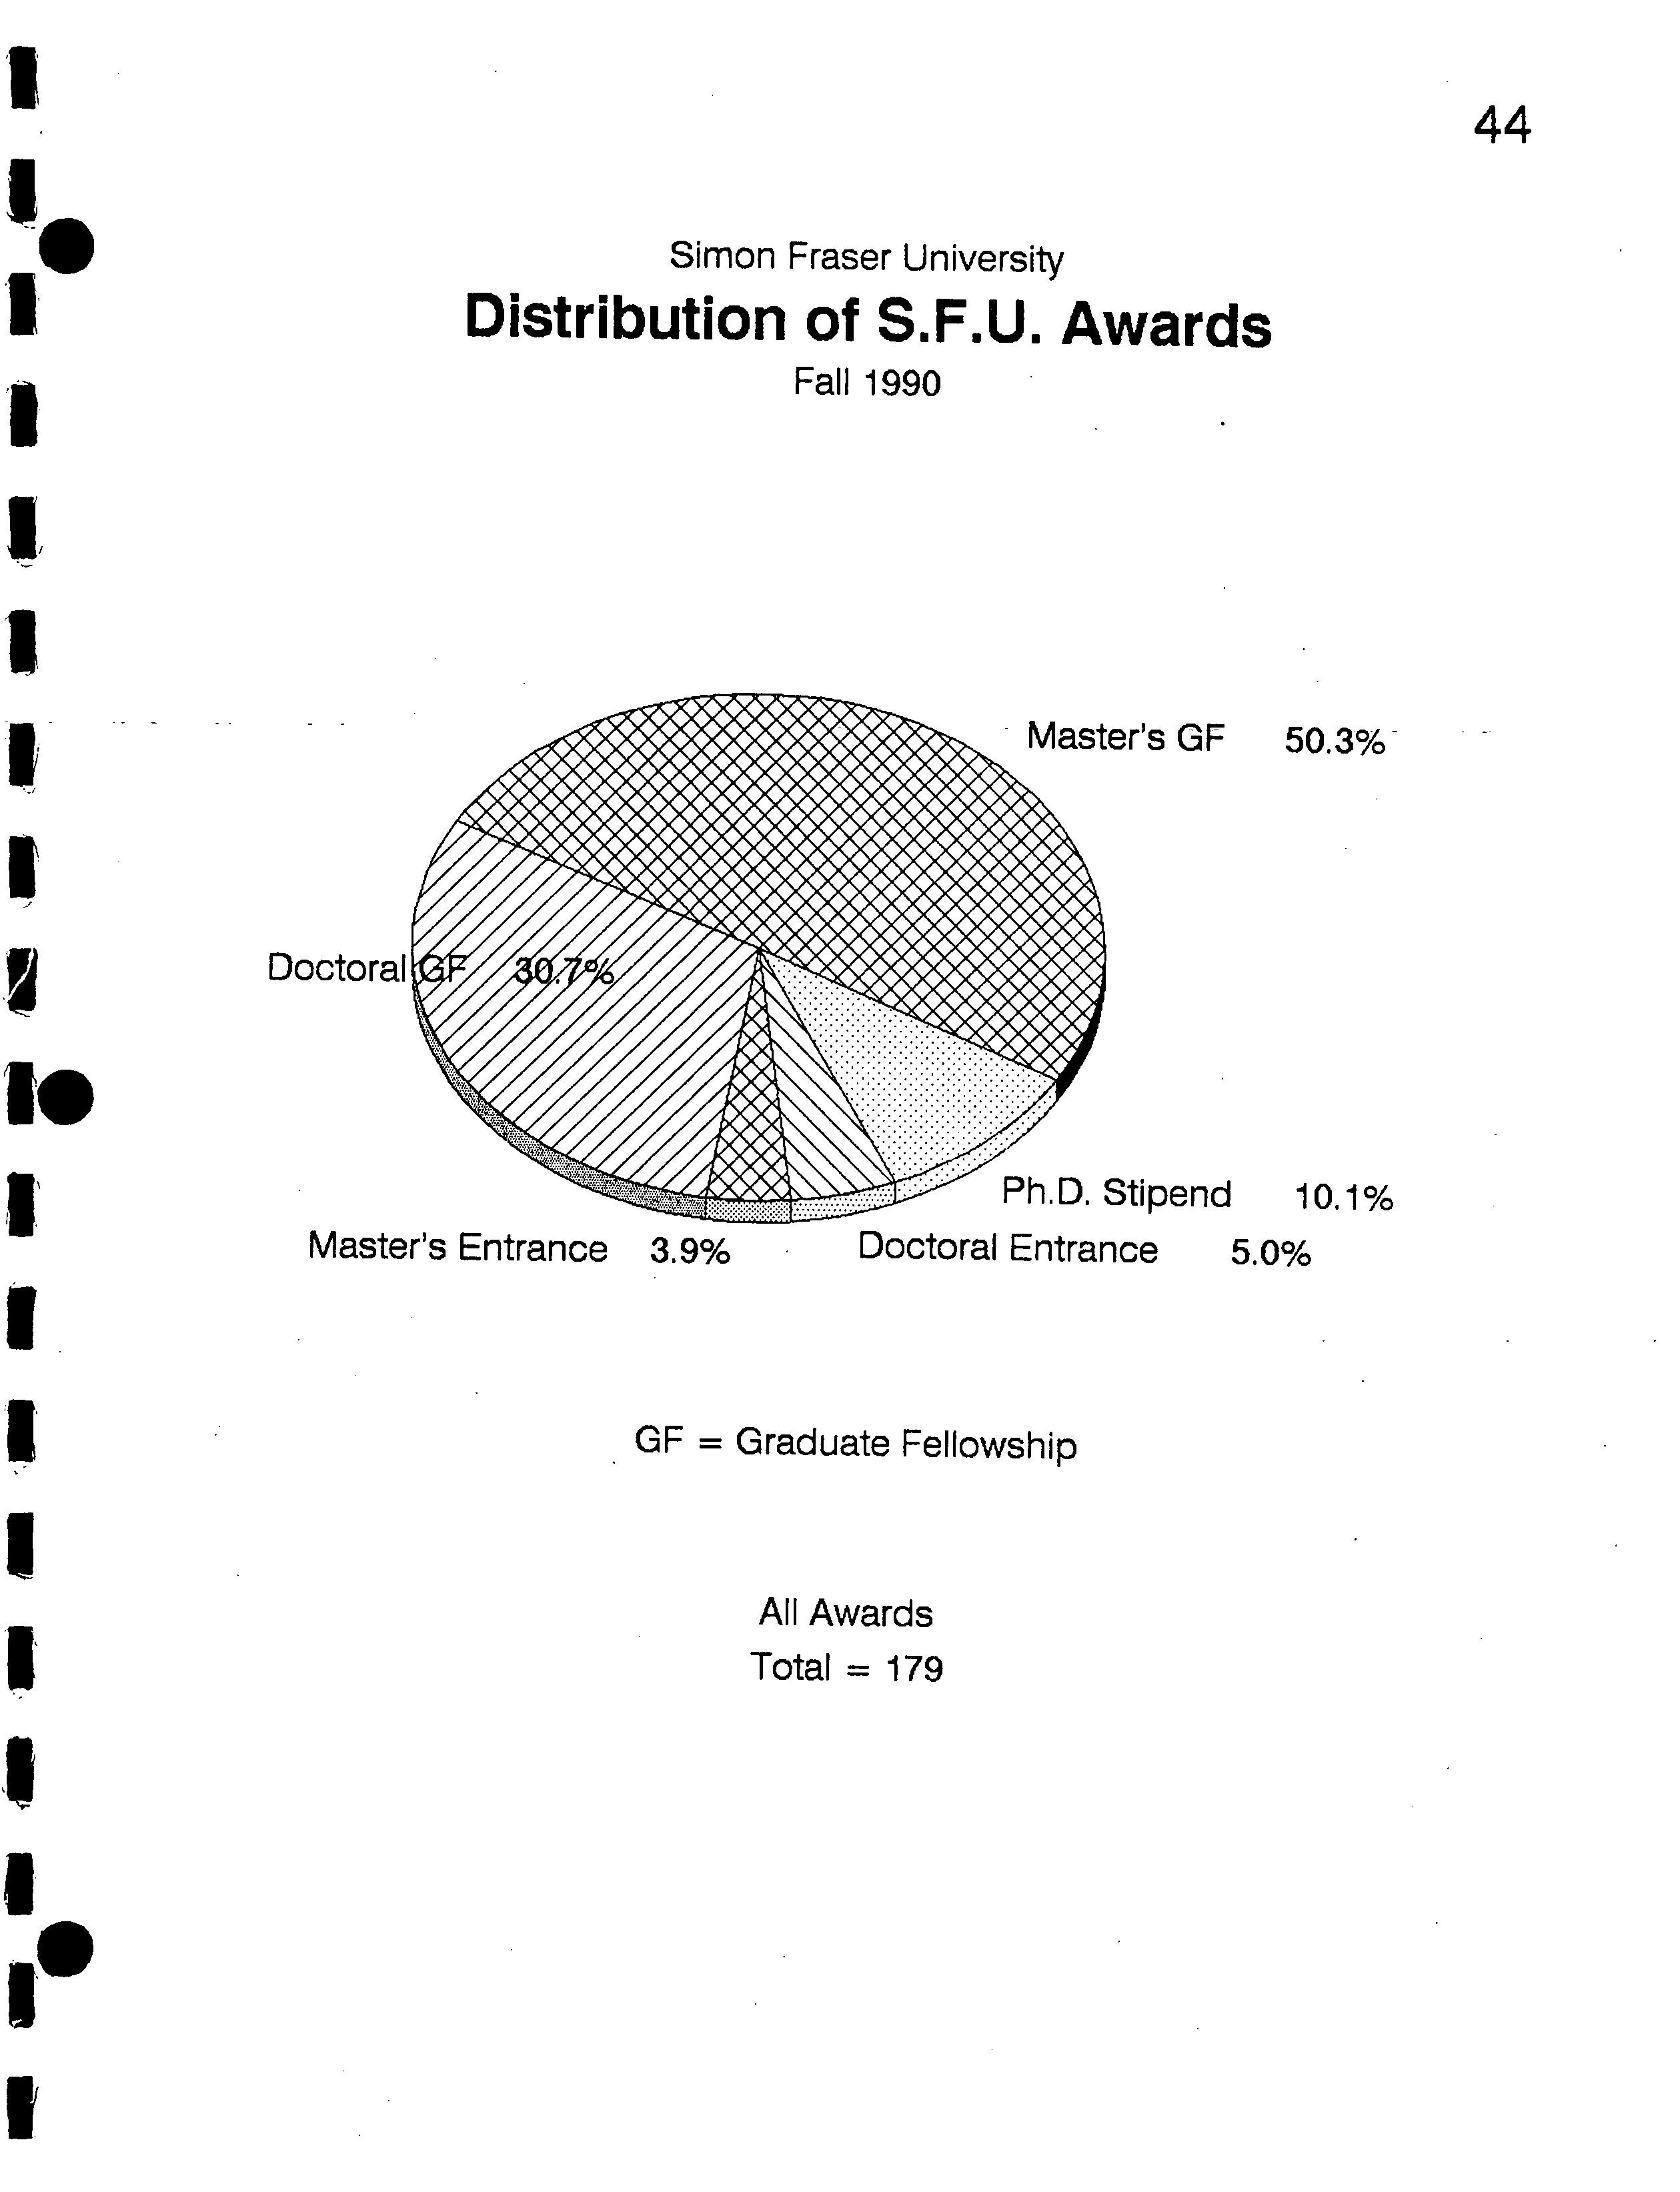
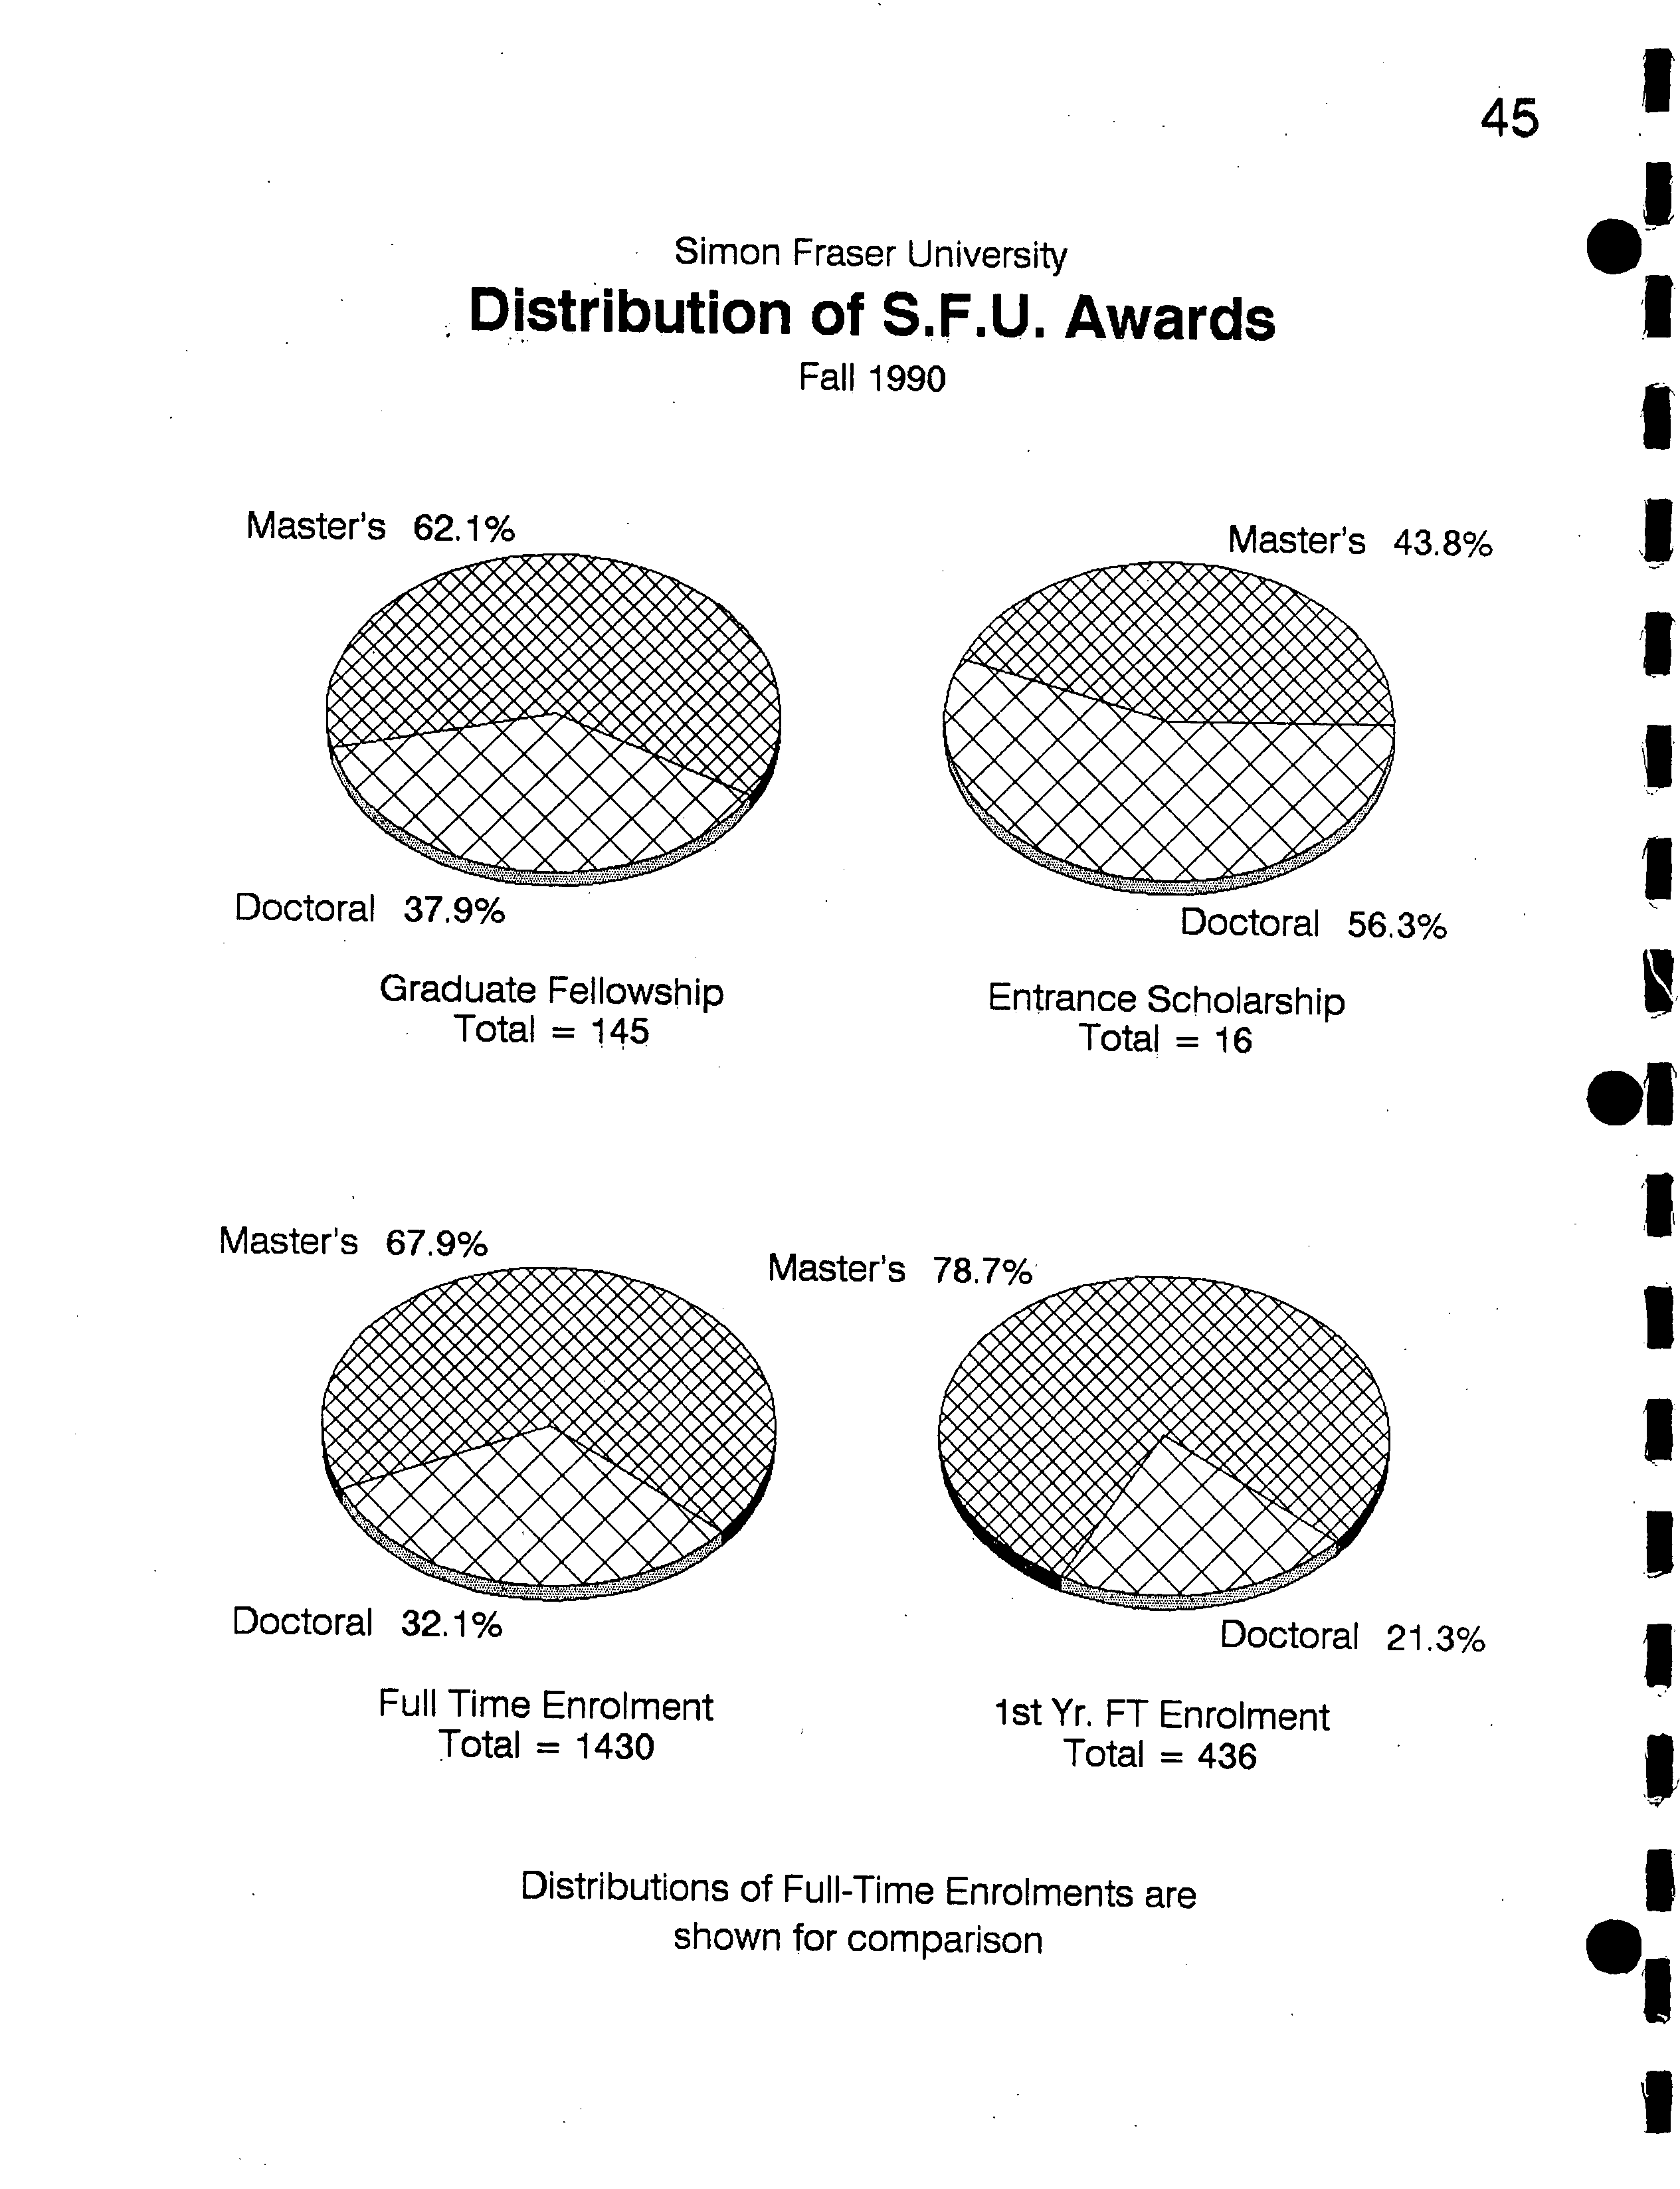
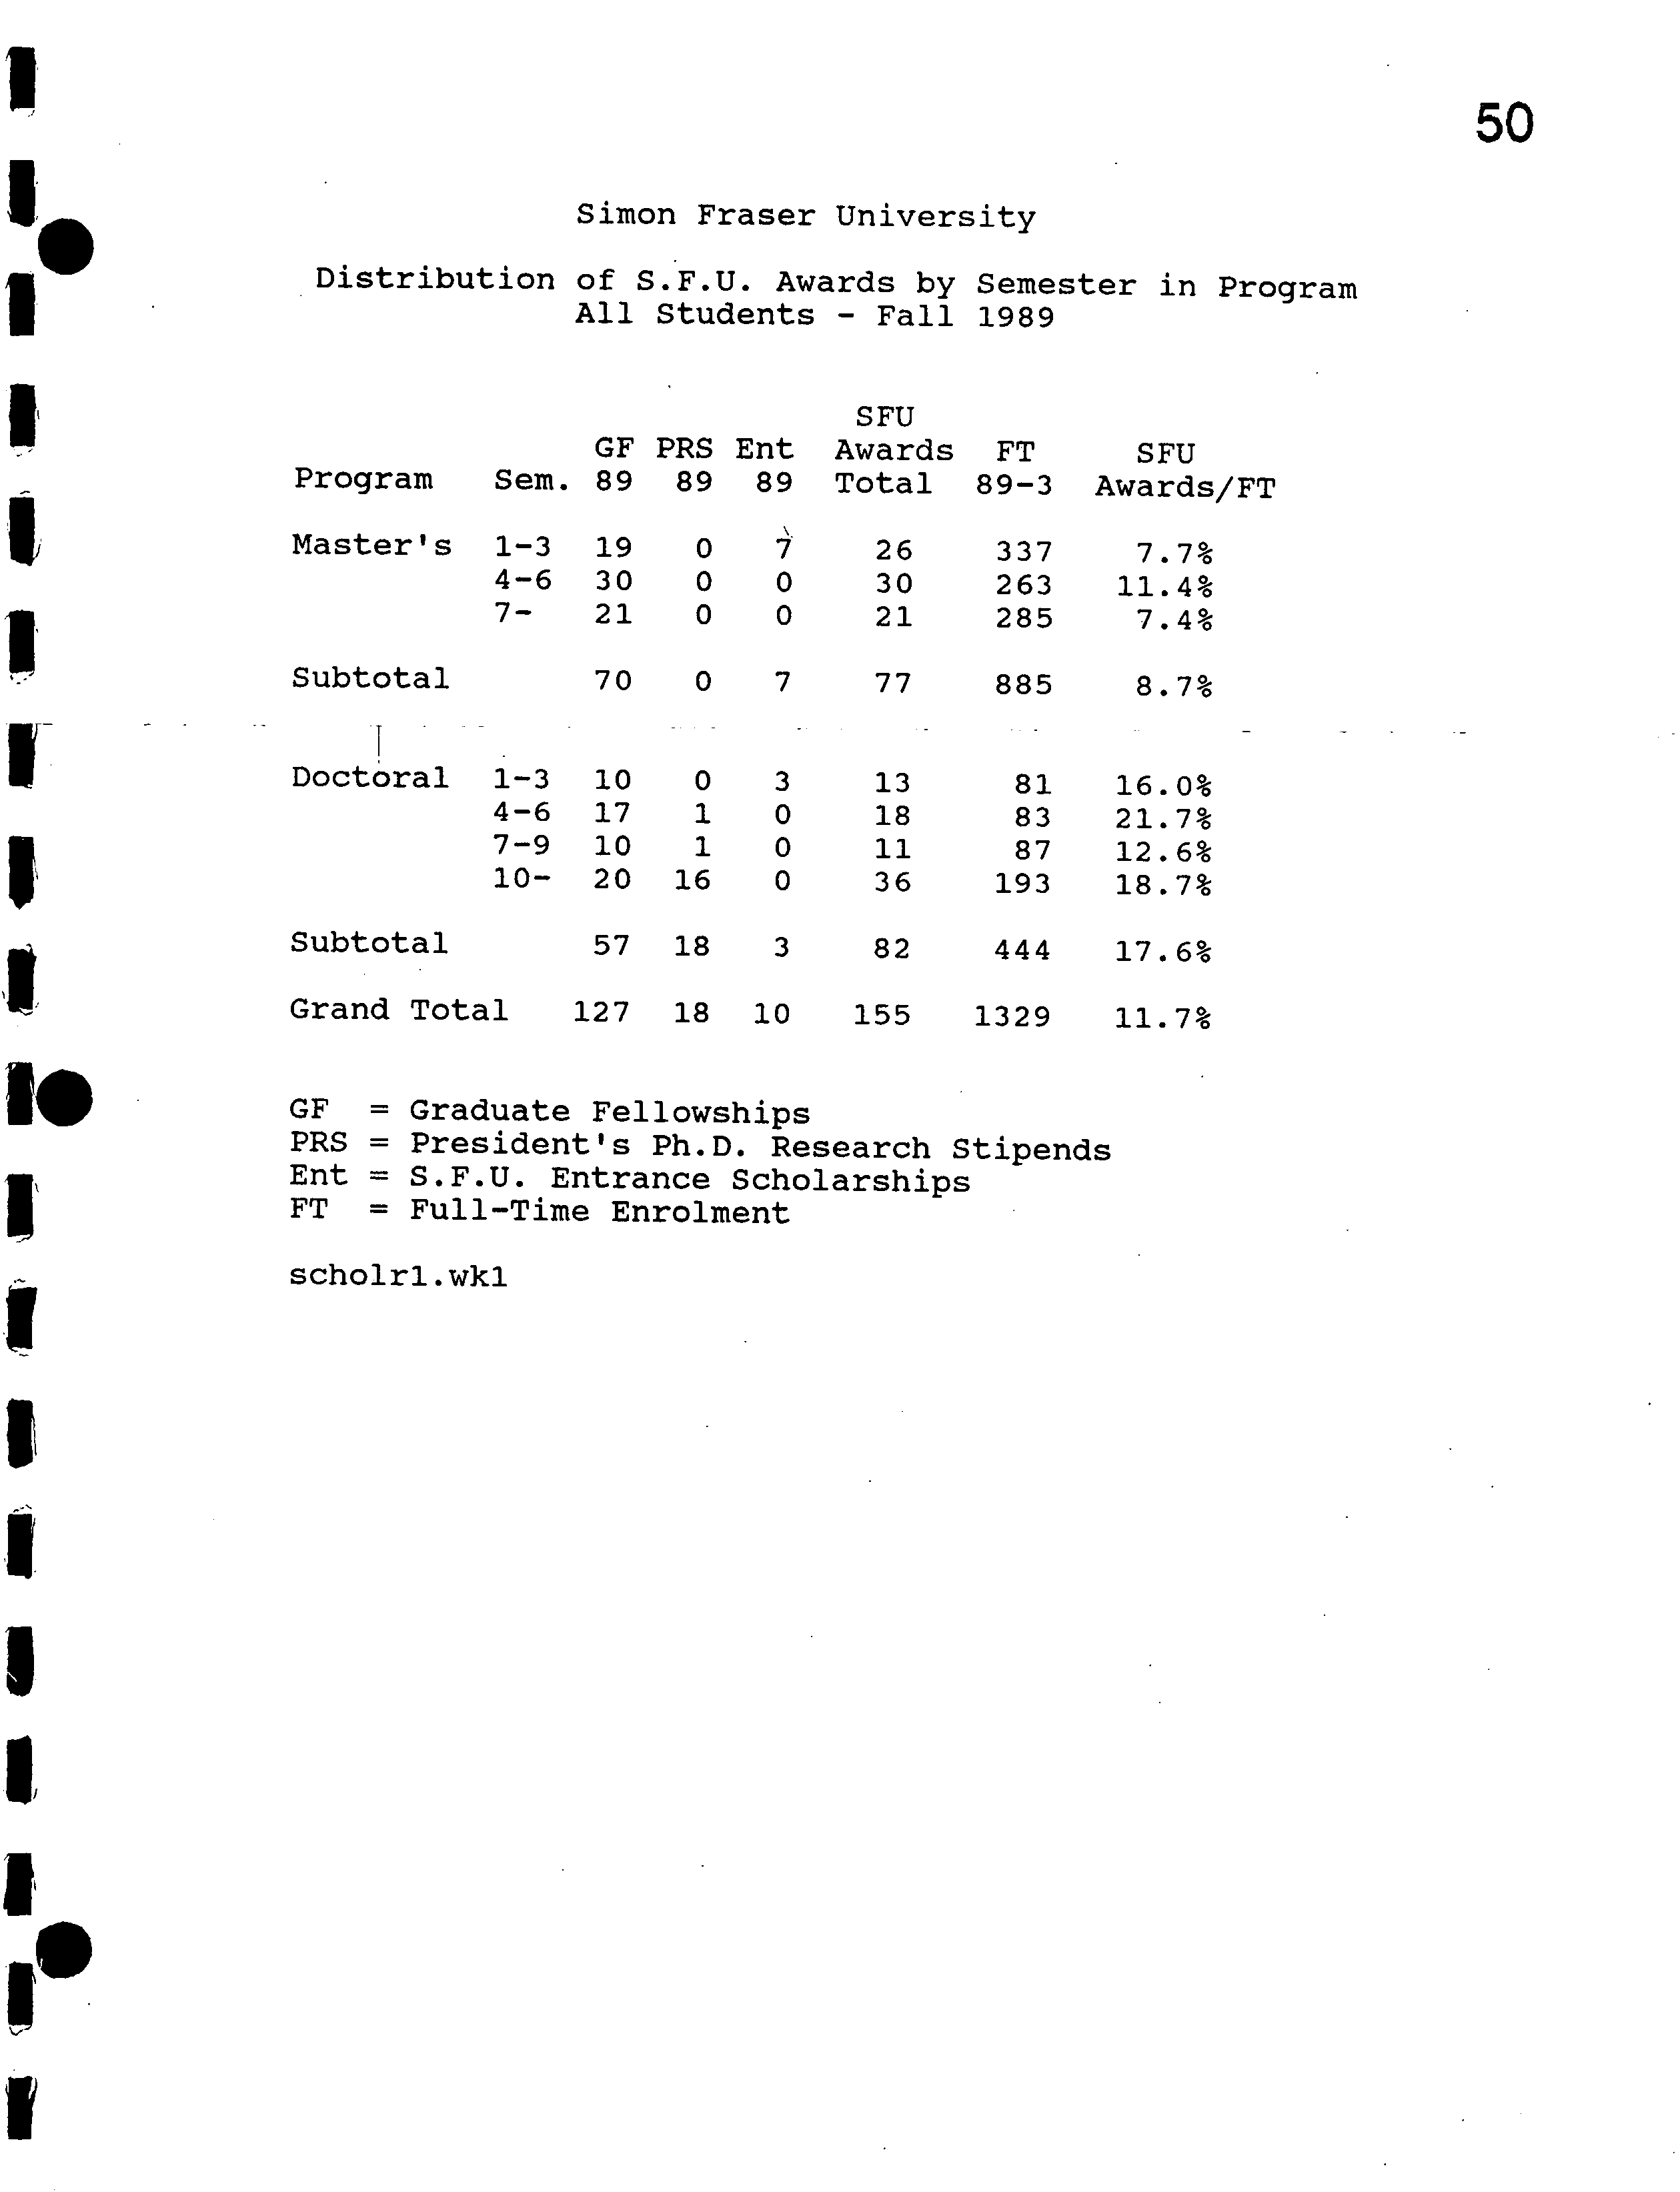
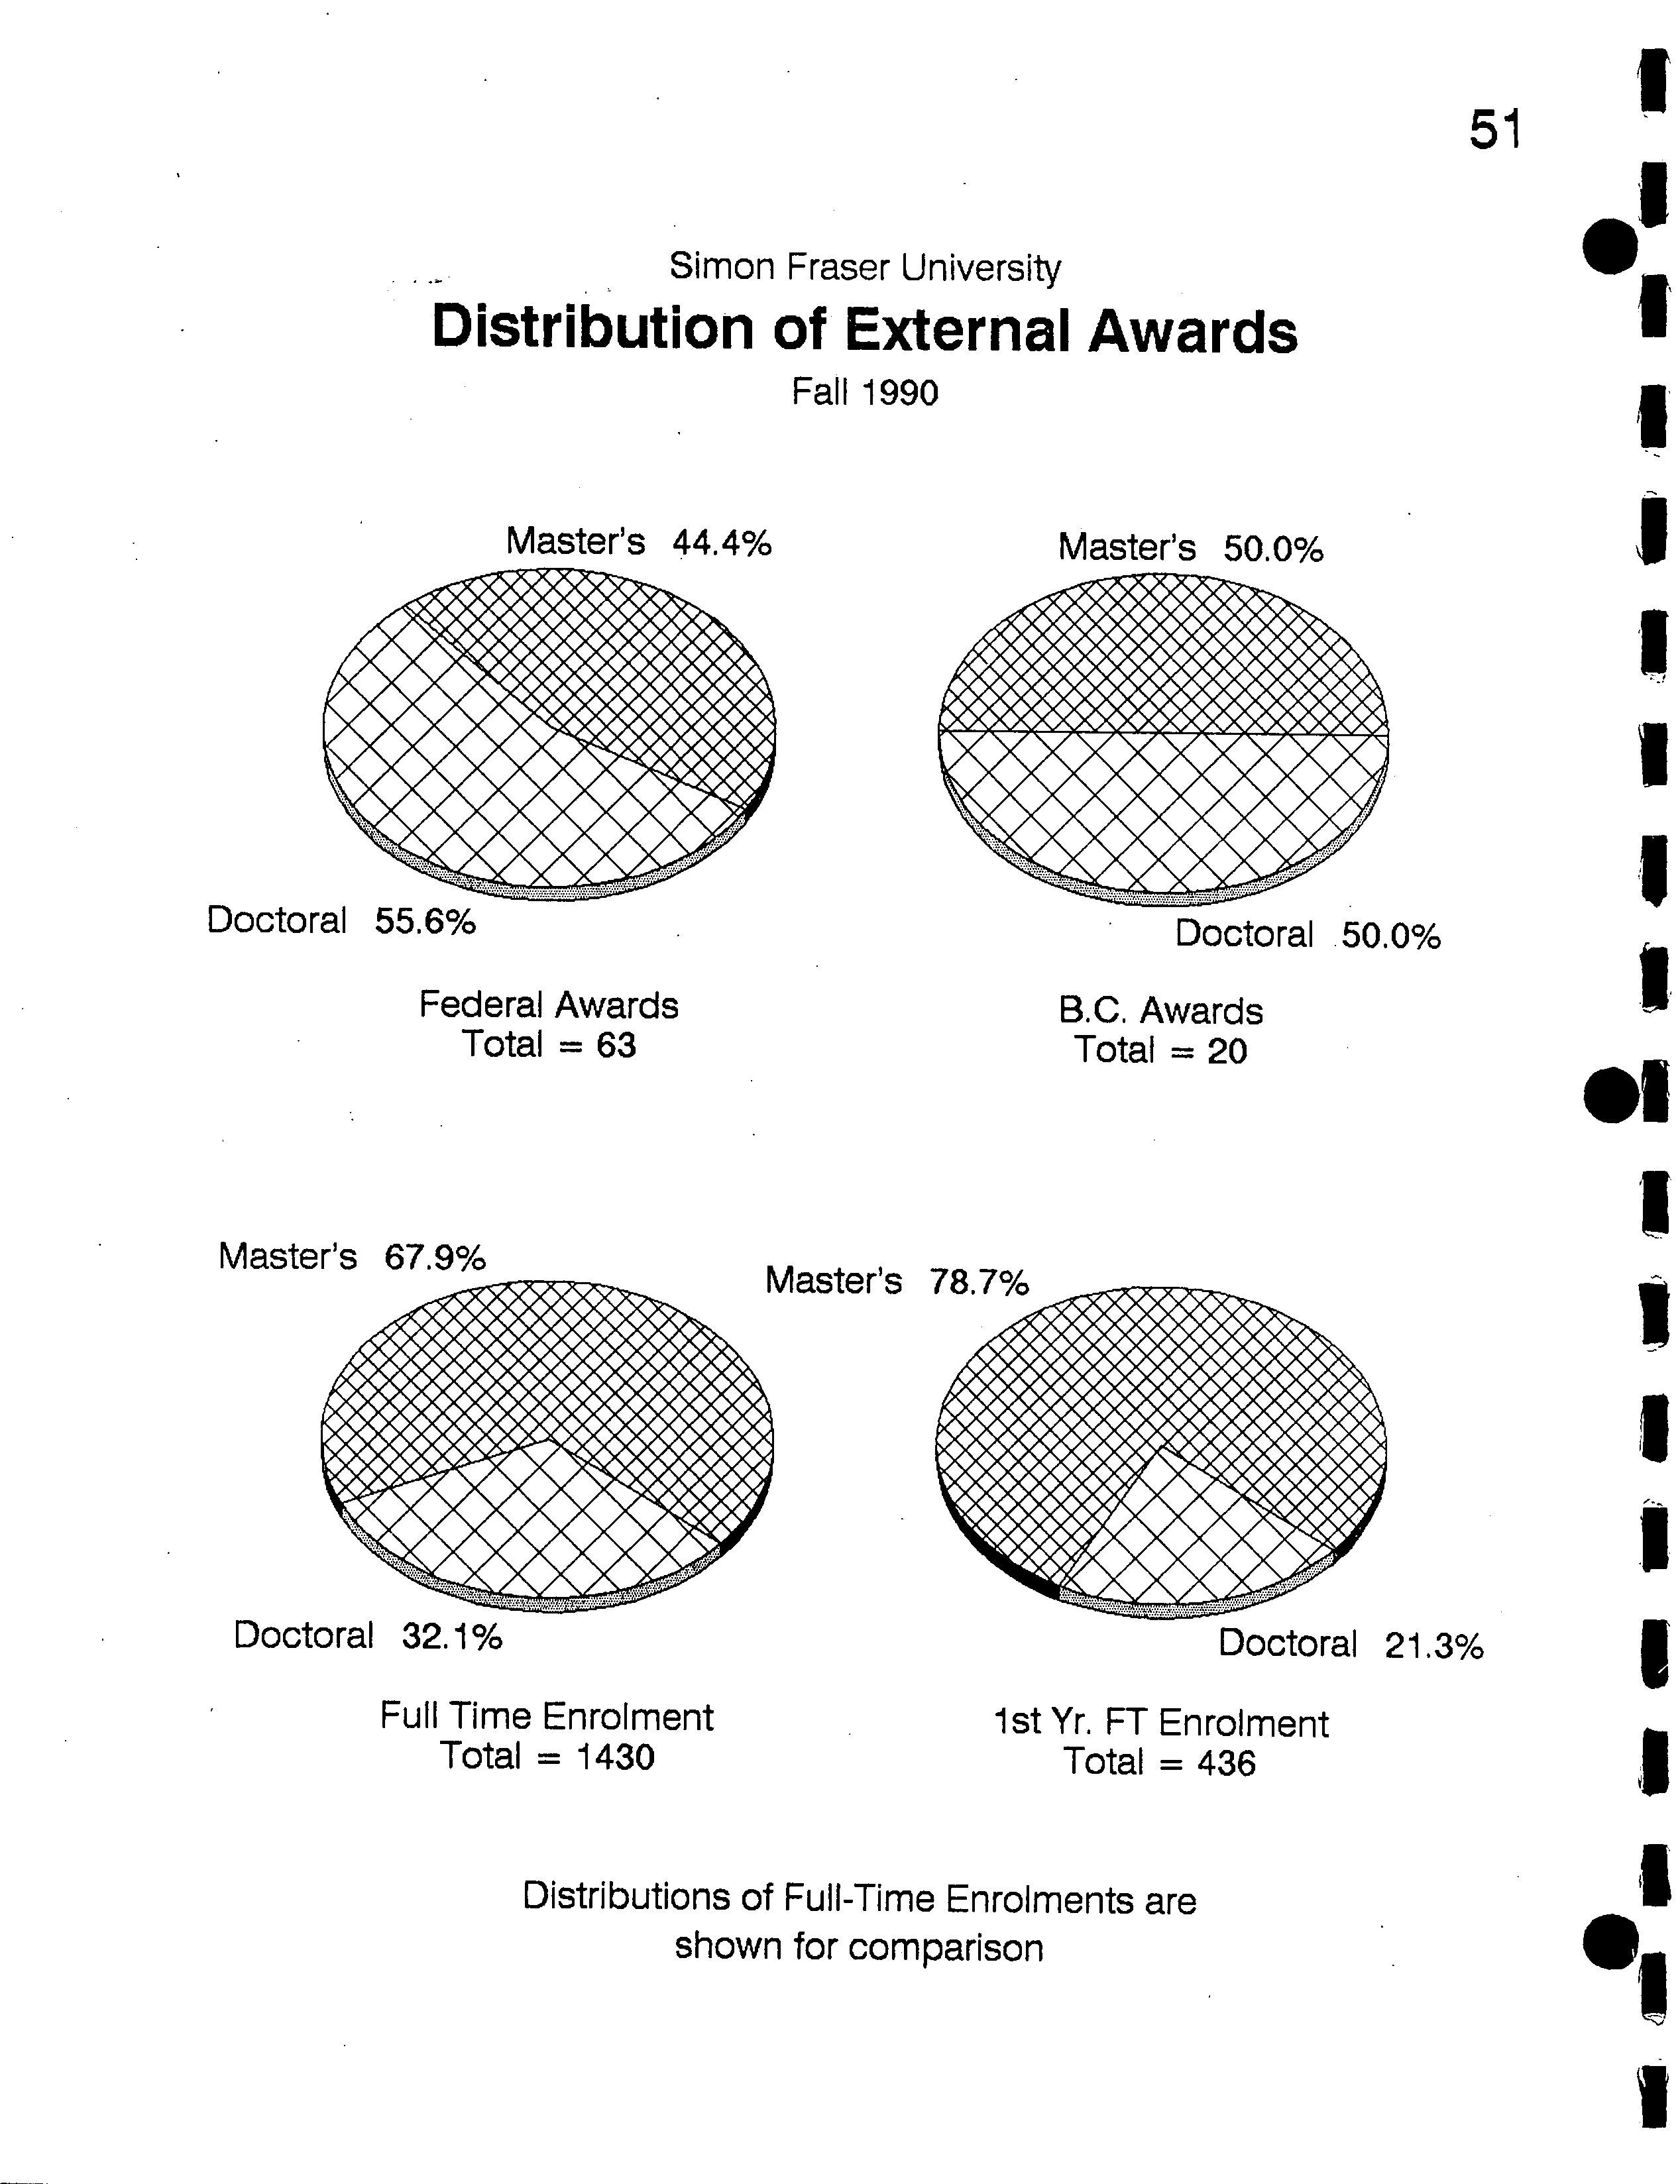
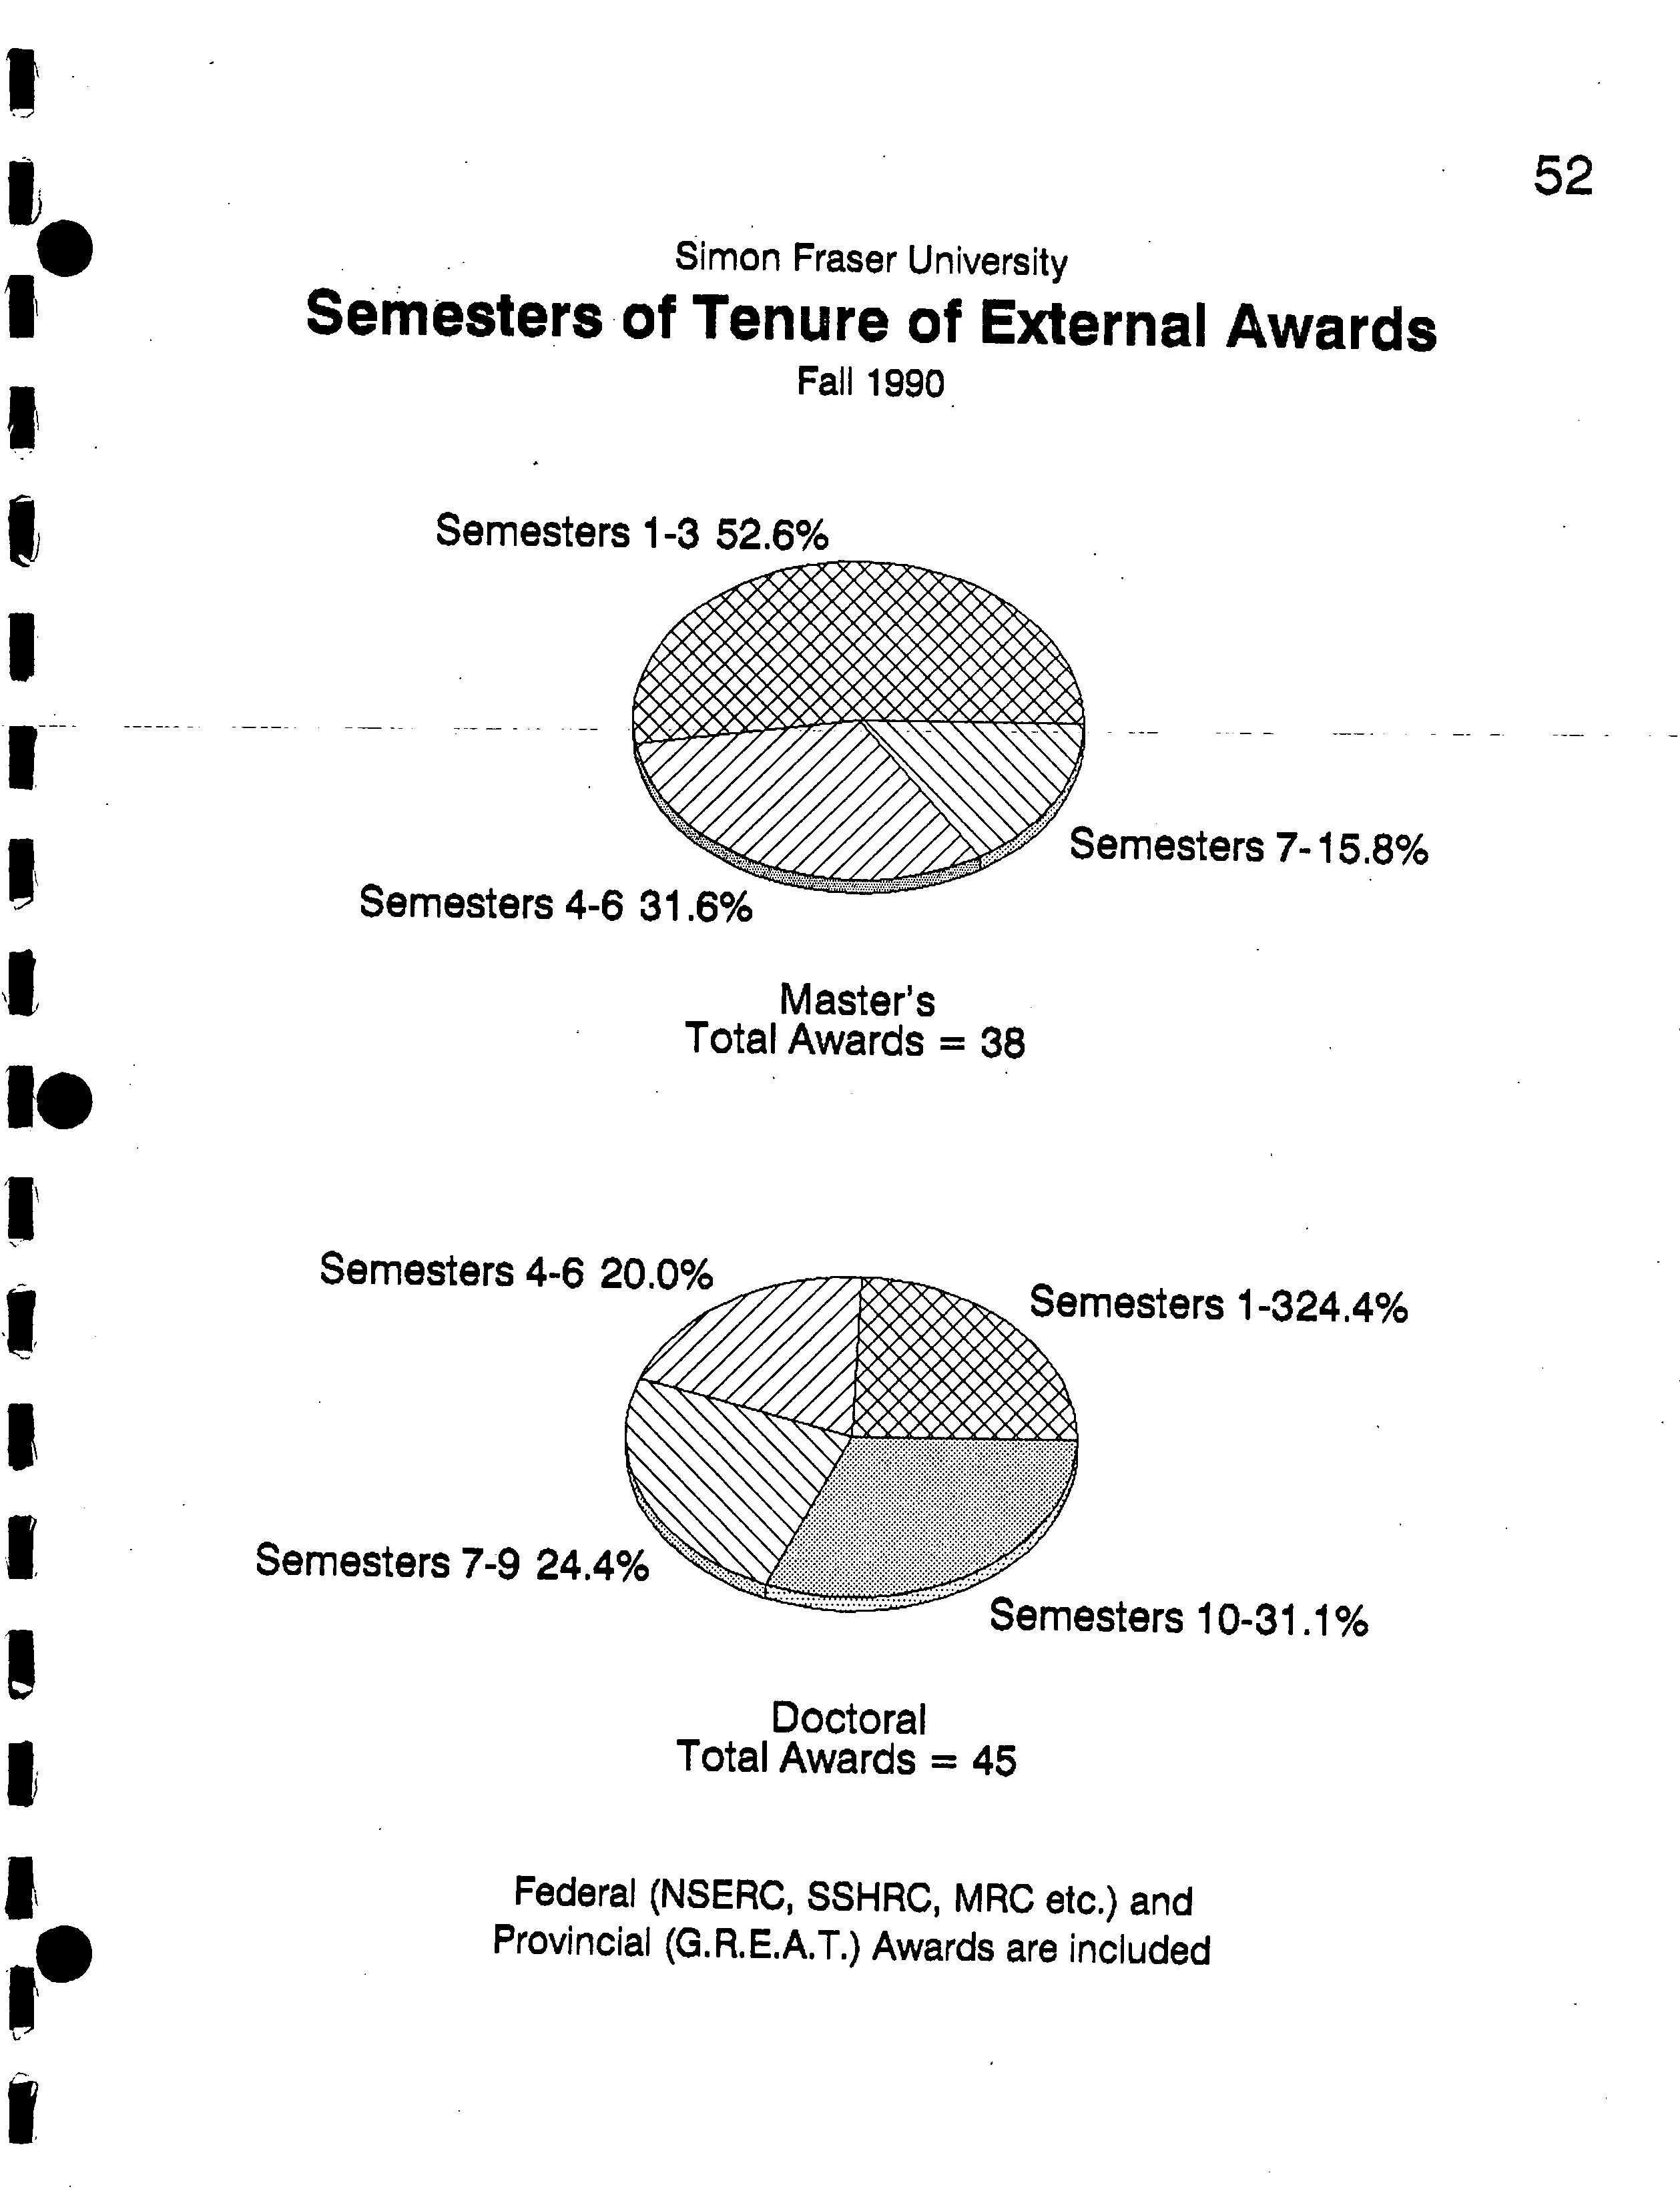
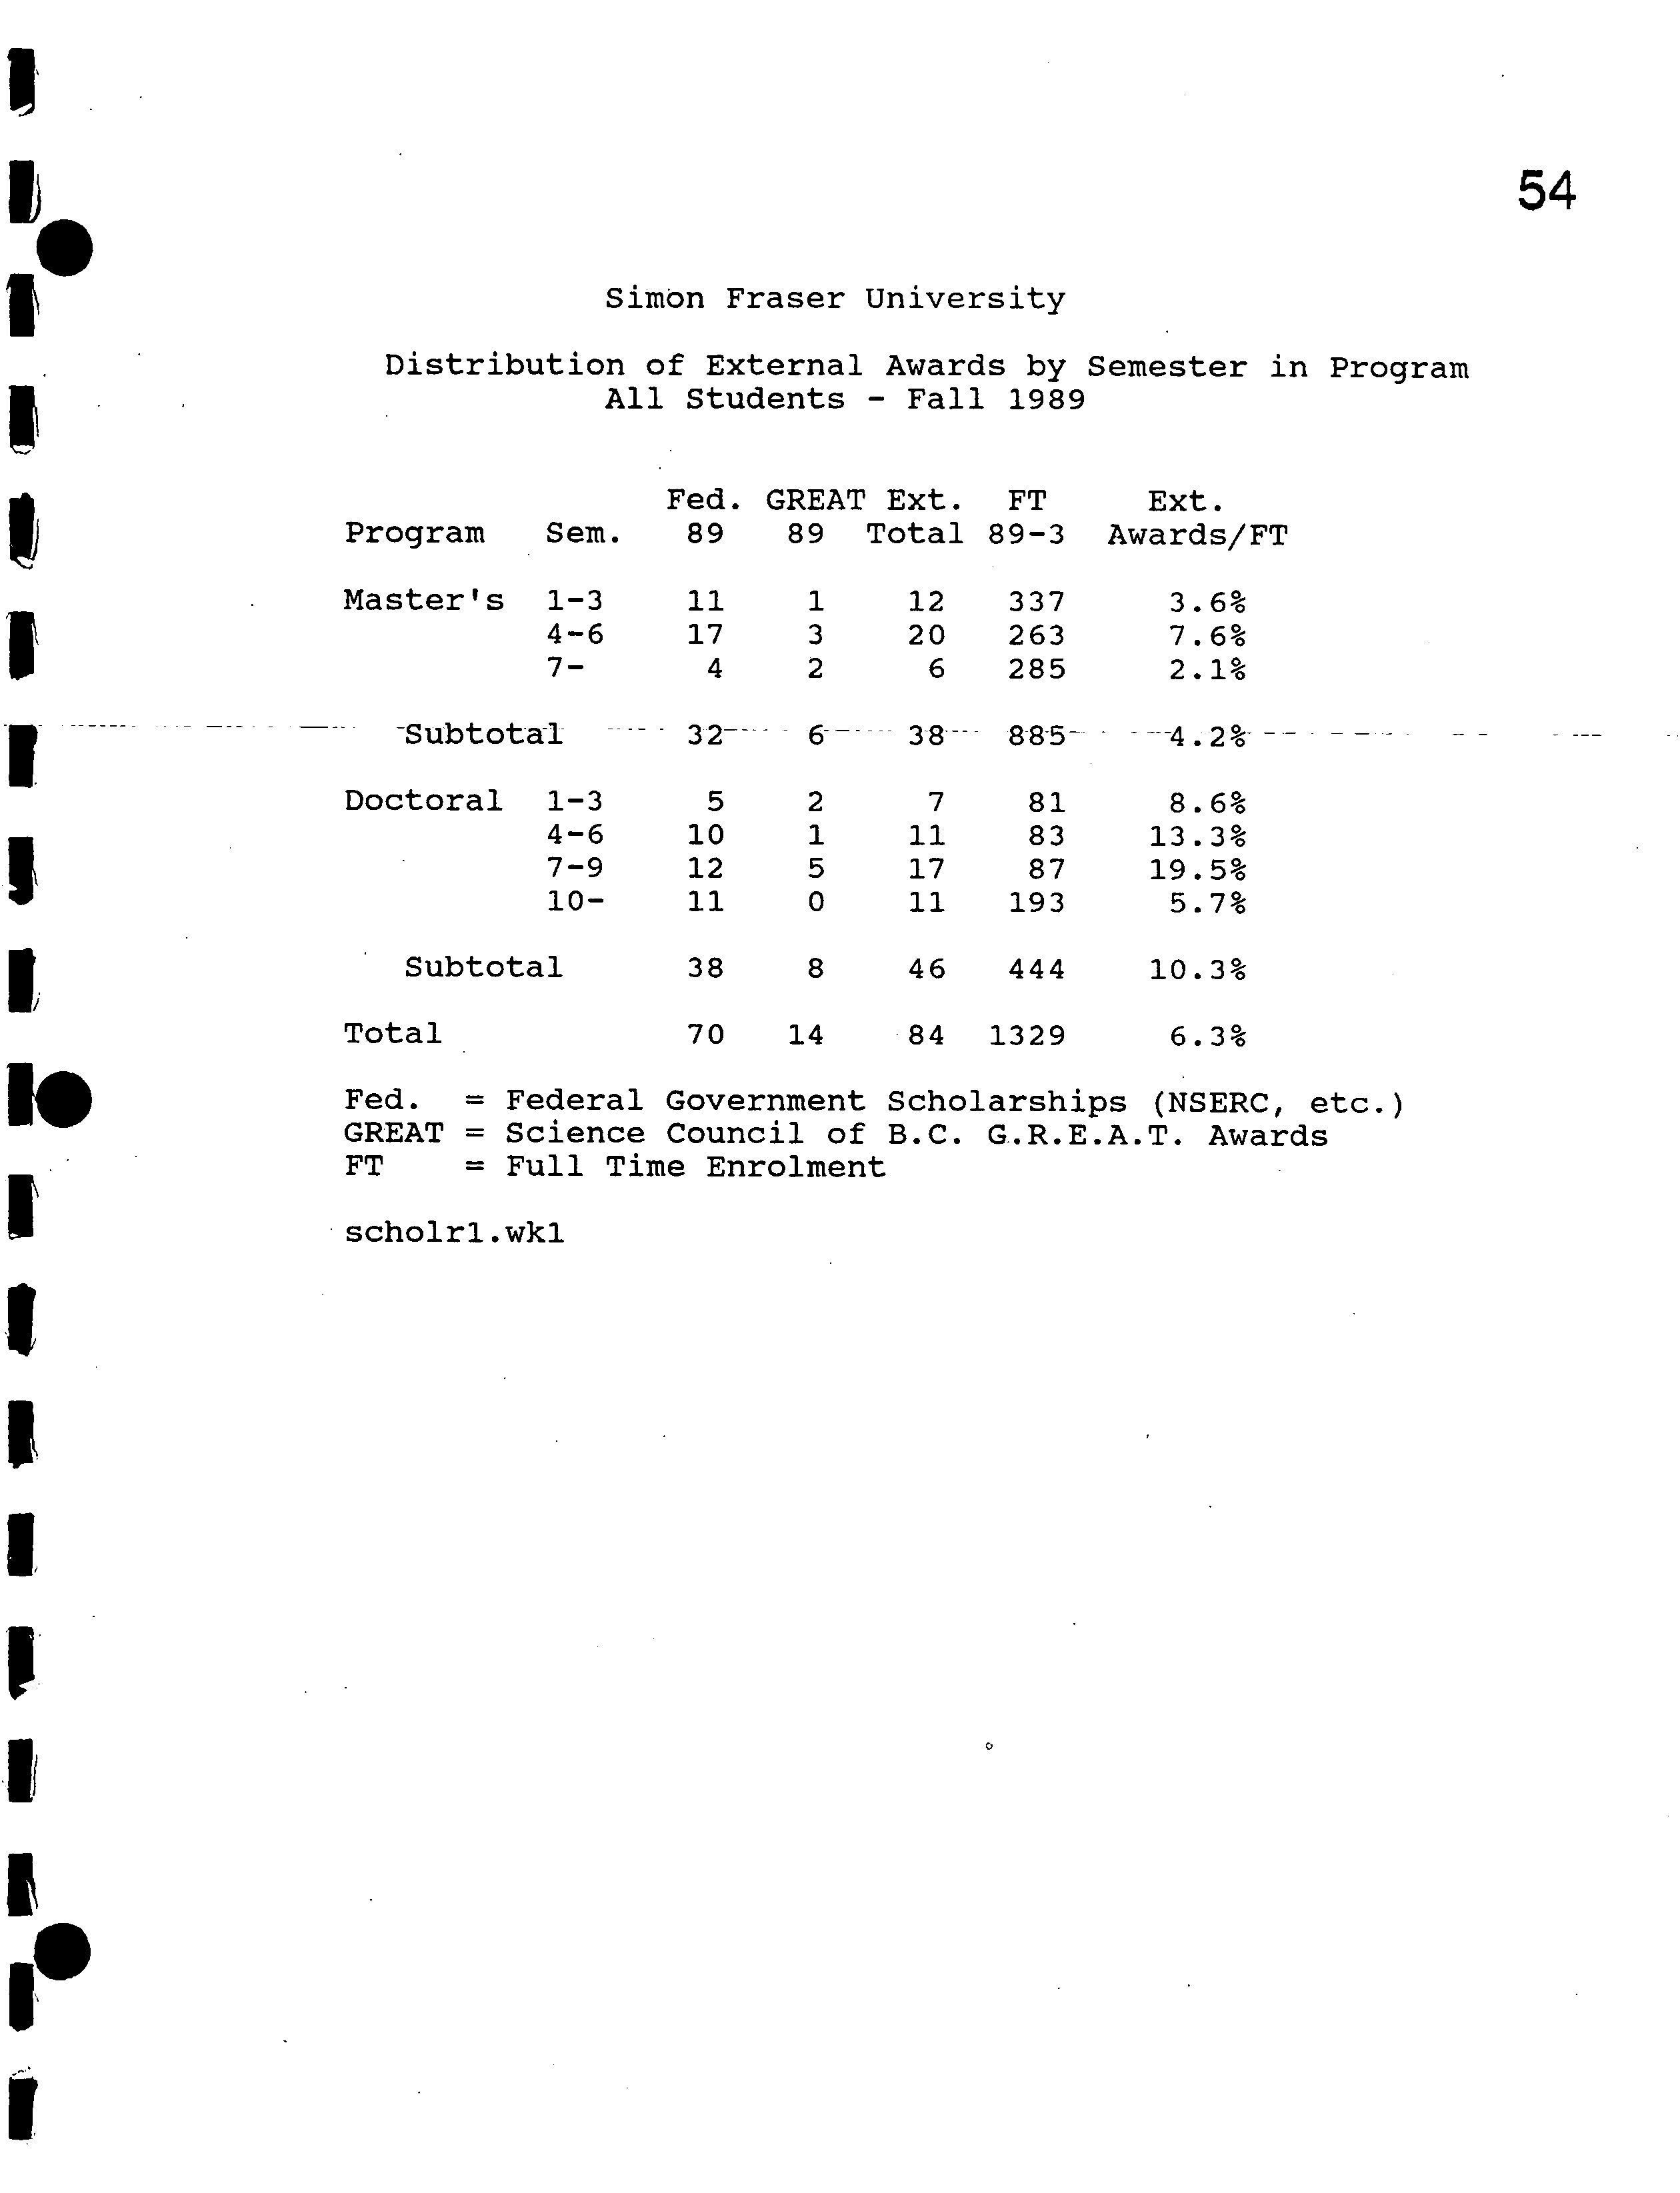
Financial Awards
44
remate
166 33.8%
Female 537 46.6%
Simon Fraser University
Total Enrolments
Fall 1990
Total Enrolment = 1697
Male 615 53.4%
?
Male 325 66.2%
KI
Master's Enrolment
?
Doctoral Enrolment
Total 1,152
?
Total 491
All SFU Students Registered in
Semester 90-3
December 5, 1990
Status
Masters
PhD Qualifying Special Other Total
FT
970
460
26
26
2
1484
PT
121
4
0
0
0
125
OL
61
27
0
0
0
88
Totals
1152
491
26
26
2
1697
Female SFU Students Registered
in Semester
0-3
Status
Masters
PhD
Qualifying Special Other Total
FT
432
159
9
13
1
614
PT
73
1
0
0
0
74
OL
32
6
0
0
0
38
Totals
537
166
9
13
1
726
Male SFU Students Registered in Semester 90-3
Status
Masters
PhD Qualifying Special Other Total
FT
538
301
17
13
1
870
PT
48
3
0
0
0
51
OL
29
21
0
0
0
50
Totals
615
325
17
13
1
971
IH
I
11
Female S.F.U. Students by Time in Program - Enrolment Status: All ?
Date: January 7, 1991
?
Semester of Interest: 90-3
Year in Program
De p artment
?
Level ?
1 ?
2 ?
3 ?
4 ?
5 ?
6 >6 Tot
Archaeology
Master's
2
3 _O
3
1
0
0
9
Biological Sci.
Master's
11
8 10
6
0
0
0
35
Bus. Admin.
Master's
29 12 10
1
0
0
0
52
Chemistry
Master's
6
2
4
2
0
0
0
14
Communication
Master's
10
9
4
2
2-
2
0
29
Computing Sci.
Master's
1
1
1
1
0
0
0
4
Conternp. Arts
Master's
1
0
0
0
0
0
0
1
Criminology
Master's
7
9
5
3
1
1
0
26
Economics
Master's
9
0
1
0
0
0
0
10
Education
Master's 57
32 36 22 21
3 1
172
Engineering Sci.
Master's
1
2
0
0
0
0
0
3
English
Master's
8
8
9
2
2
0
0
29
Geography
Master's
3
3
3
1
0
1
0
11
History
Master's
4
6
2
2
1
0
0
15
Kinesiology
Master's
5
4
3
2
1
0
0
15
Lang. ?
& Ling.
Master's
1
7
2
0
1
1
0
12
Math. ?
& Stats.
Master's
2
3
3
0
0
0
0
8
Nat'l Res. Mgrnt.
Master's
10
7
2
2
3
1
0
25
Philosophy
Master's
3
2
1
0
0
0
0
6
Physics
Master's
2
1
0
0
0
0
0
3
Political Sci.
Master's
3
4
0
1
0
0
0
8
Psychology
Master's
9
5
6
3
0
0
0
23
Soc. ?
& Anth.
Master's
4
1
1
1
3
0
0
10
Spi. Arrangenints
Master's
0
1
0
2
0
0
0
3
Women's Studies
Master's
6
0
2
3
3
0
0
14
Totals
Master's
194
130 105
59 39 9
1
537
•I
Year in Program
Department, ?
Level ?
1 ?
2 ?
3 ?
4 ?
5 ?
6 ?
7
?
8 ?
9 >9 Tot
Archaeology
Doctoral
C
Biological Sci.
Doctoral
2
Chemistry
Doctoral
3
Communication
Doctoral
4
Computing Sci.
Doctoral
1
Criminology
Doctoral
C
Economics
Doctoral
1
Education
Doctoral
6
Engineering
Sd.
Doctoral
0
English
Doctoral
0
Geography
Doctoral
0
History
Doctoral
2
Kinesiology
Doctoral
1
Lang. ?
& Ling.
Doctoral U
Math.
?
& Stats.
Doctoral
1
Physics
Doctoral
2
Psychology
Doctoral
7
Soc. ?
& Anth.
Doctoral
1
Spl. Arrangeinnts
Doctoral
0
Totals
Doctoral
31
1
1
1
2
0
1
0
2
0
8
6
0
4
4
0
0
1
0
0
17
2
0
0
1
0
2
1
0
0
9
2
0
4
1
1
0
0
0
0
12
0
1
0
0
1
0
0
0
0
3
1
1
1
2
2
0
0
0
0
7
0
1
1
0
0
0
0
0
0
3
5
5
2
6
2
1
0
0
0
27
0
0
0
0
0
0
0
0
0
0
1
1
1
0
0
0
0
0
0
3
0
0
0
0
0
0
0
0
0
0
0
3
0
2
0
1
0
0
0
8
1
1
0
0
0
0
1
0
0
4
0
0
0
0
1
0
0
0
0
1
1
1
0
1
0
0
0
0
0
4
31
24
22
31
11
9
4
2
1
166
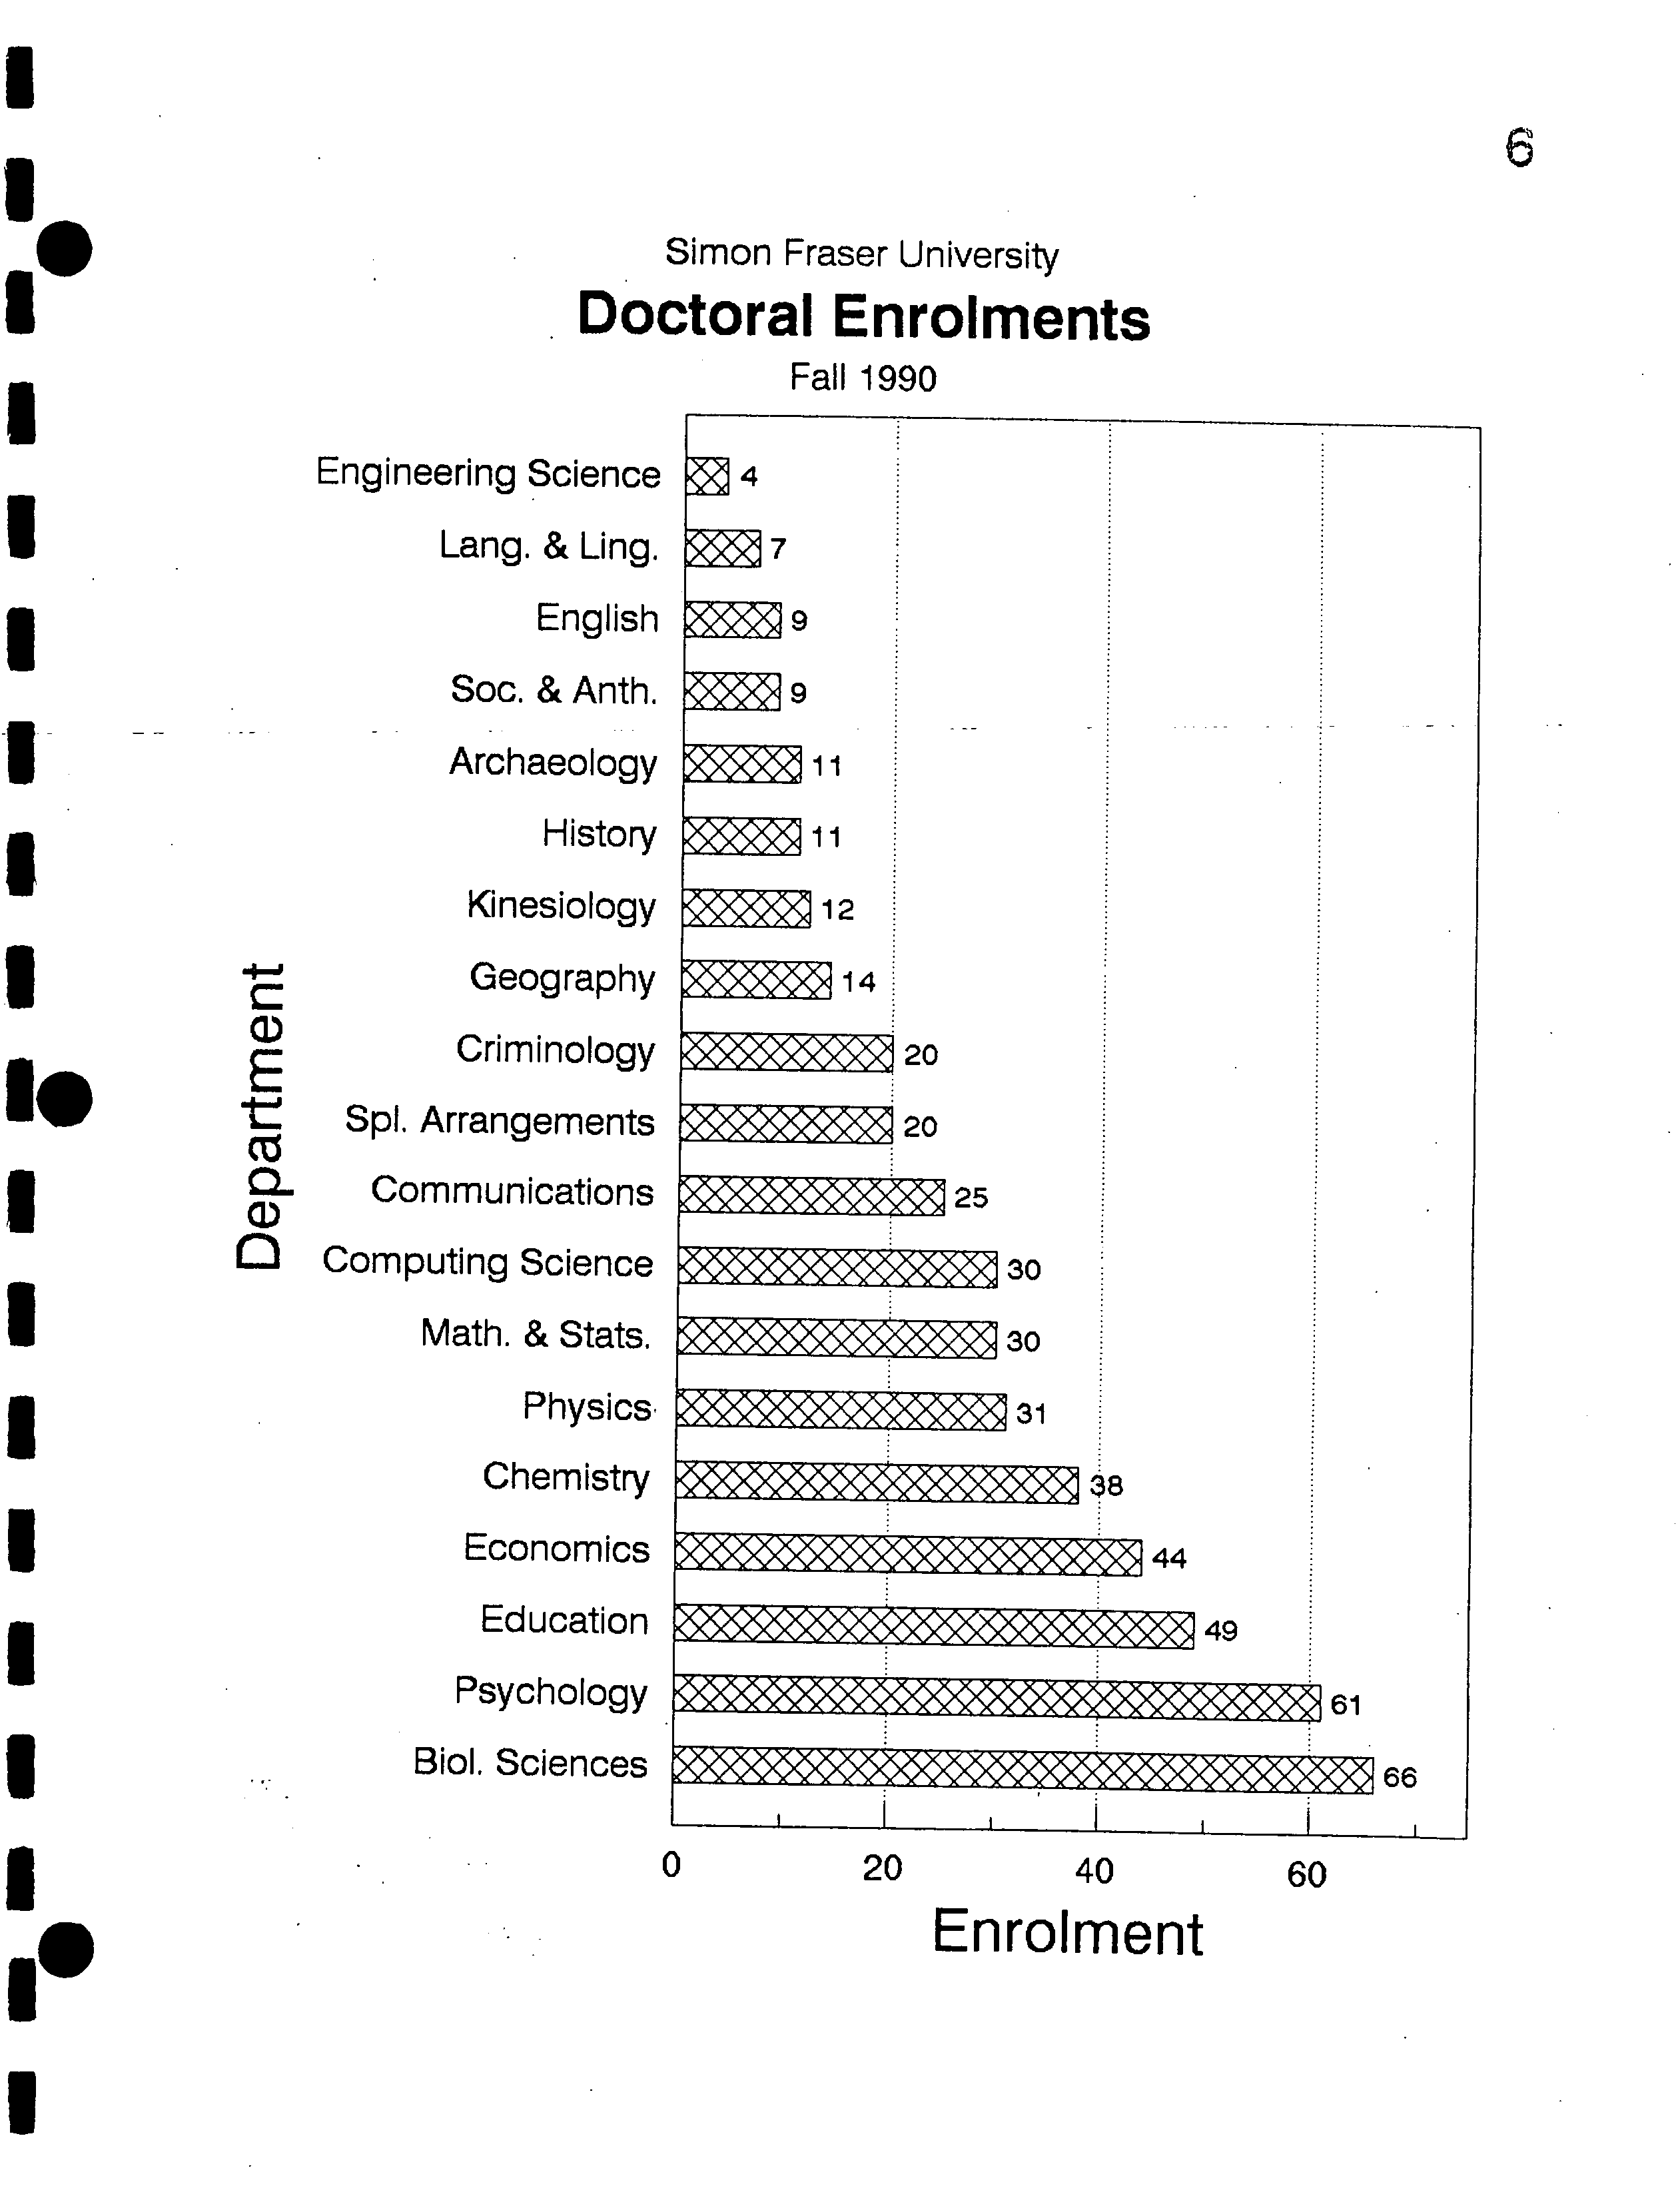
Simon Fraser University
Doctoral Enrolments
Fall 1990
Engineering Science
Lang. & Ling.
English
Soc. & Anth.
- -
Archaeology
History
Kinesiology
-
Geography
Criminology
t
Spl. Arrangements
0-
a)
Communications
O
Computing Science
Math. & Stats.
Physics
Chemistry
Economics
Education
Psychology
Biol, Sciences
44
49
S6e
0
?
20
?
40
?
60
Enrolment
Simon Fraser University
Master's Enrolments
Fall 1990
7
Contemporary Arts
?
Spi. Arrangements ?
Philosophy ?
Lang. & Ling.
?
Women's Studies
?
Physics ?
Soc. & Anth.?
Archaeology ?
Chemistry
-
I -,
?
Kinesiology
Geography
E ?
Math. & Stats.
V- ?
Political Science
?
Cz
CL
?
History
Computing Science
?
Psychology ?
Economics ?
Engineering Science
?
Criminology?
English?
Communications
?
Nat'l Resource Mgrnt.
?
Biol. Sciences ?
Bus. Admin.?
Education
0 ?
50 ?
100 ?
150 ?
200 ?
250
?
300
Enrolment
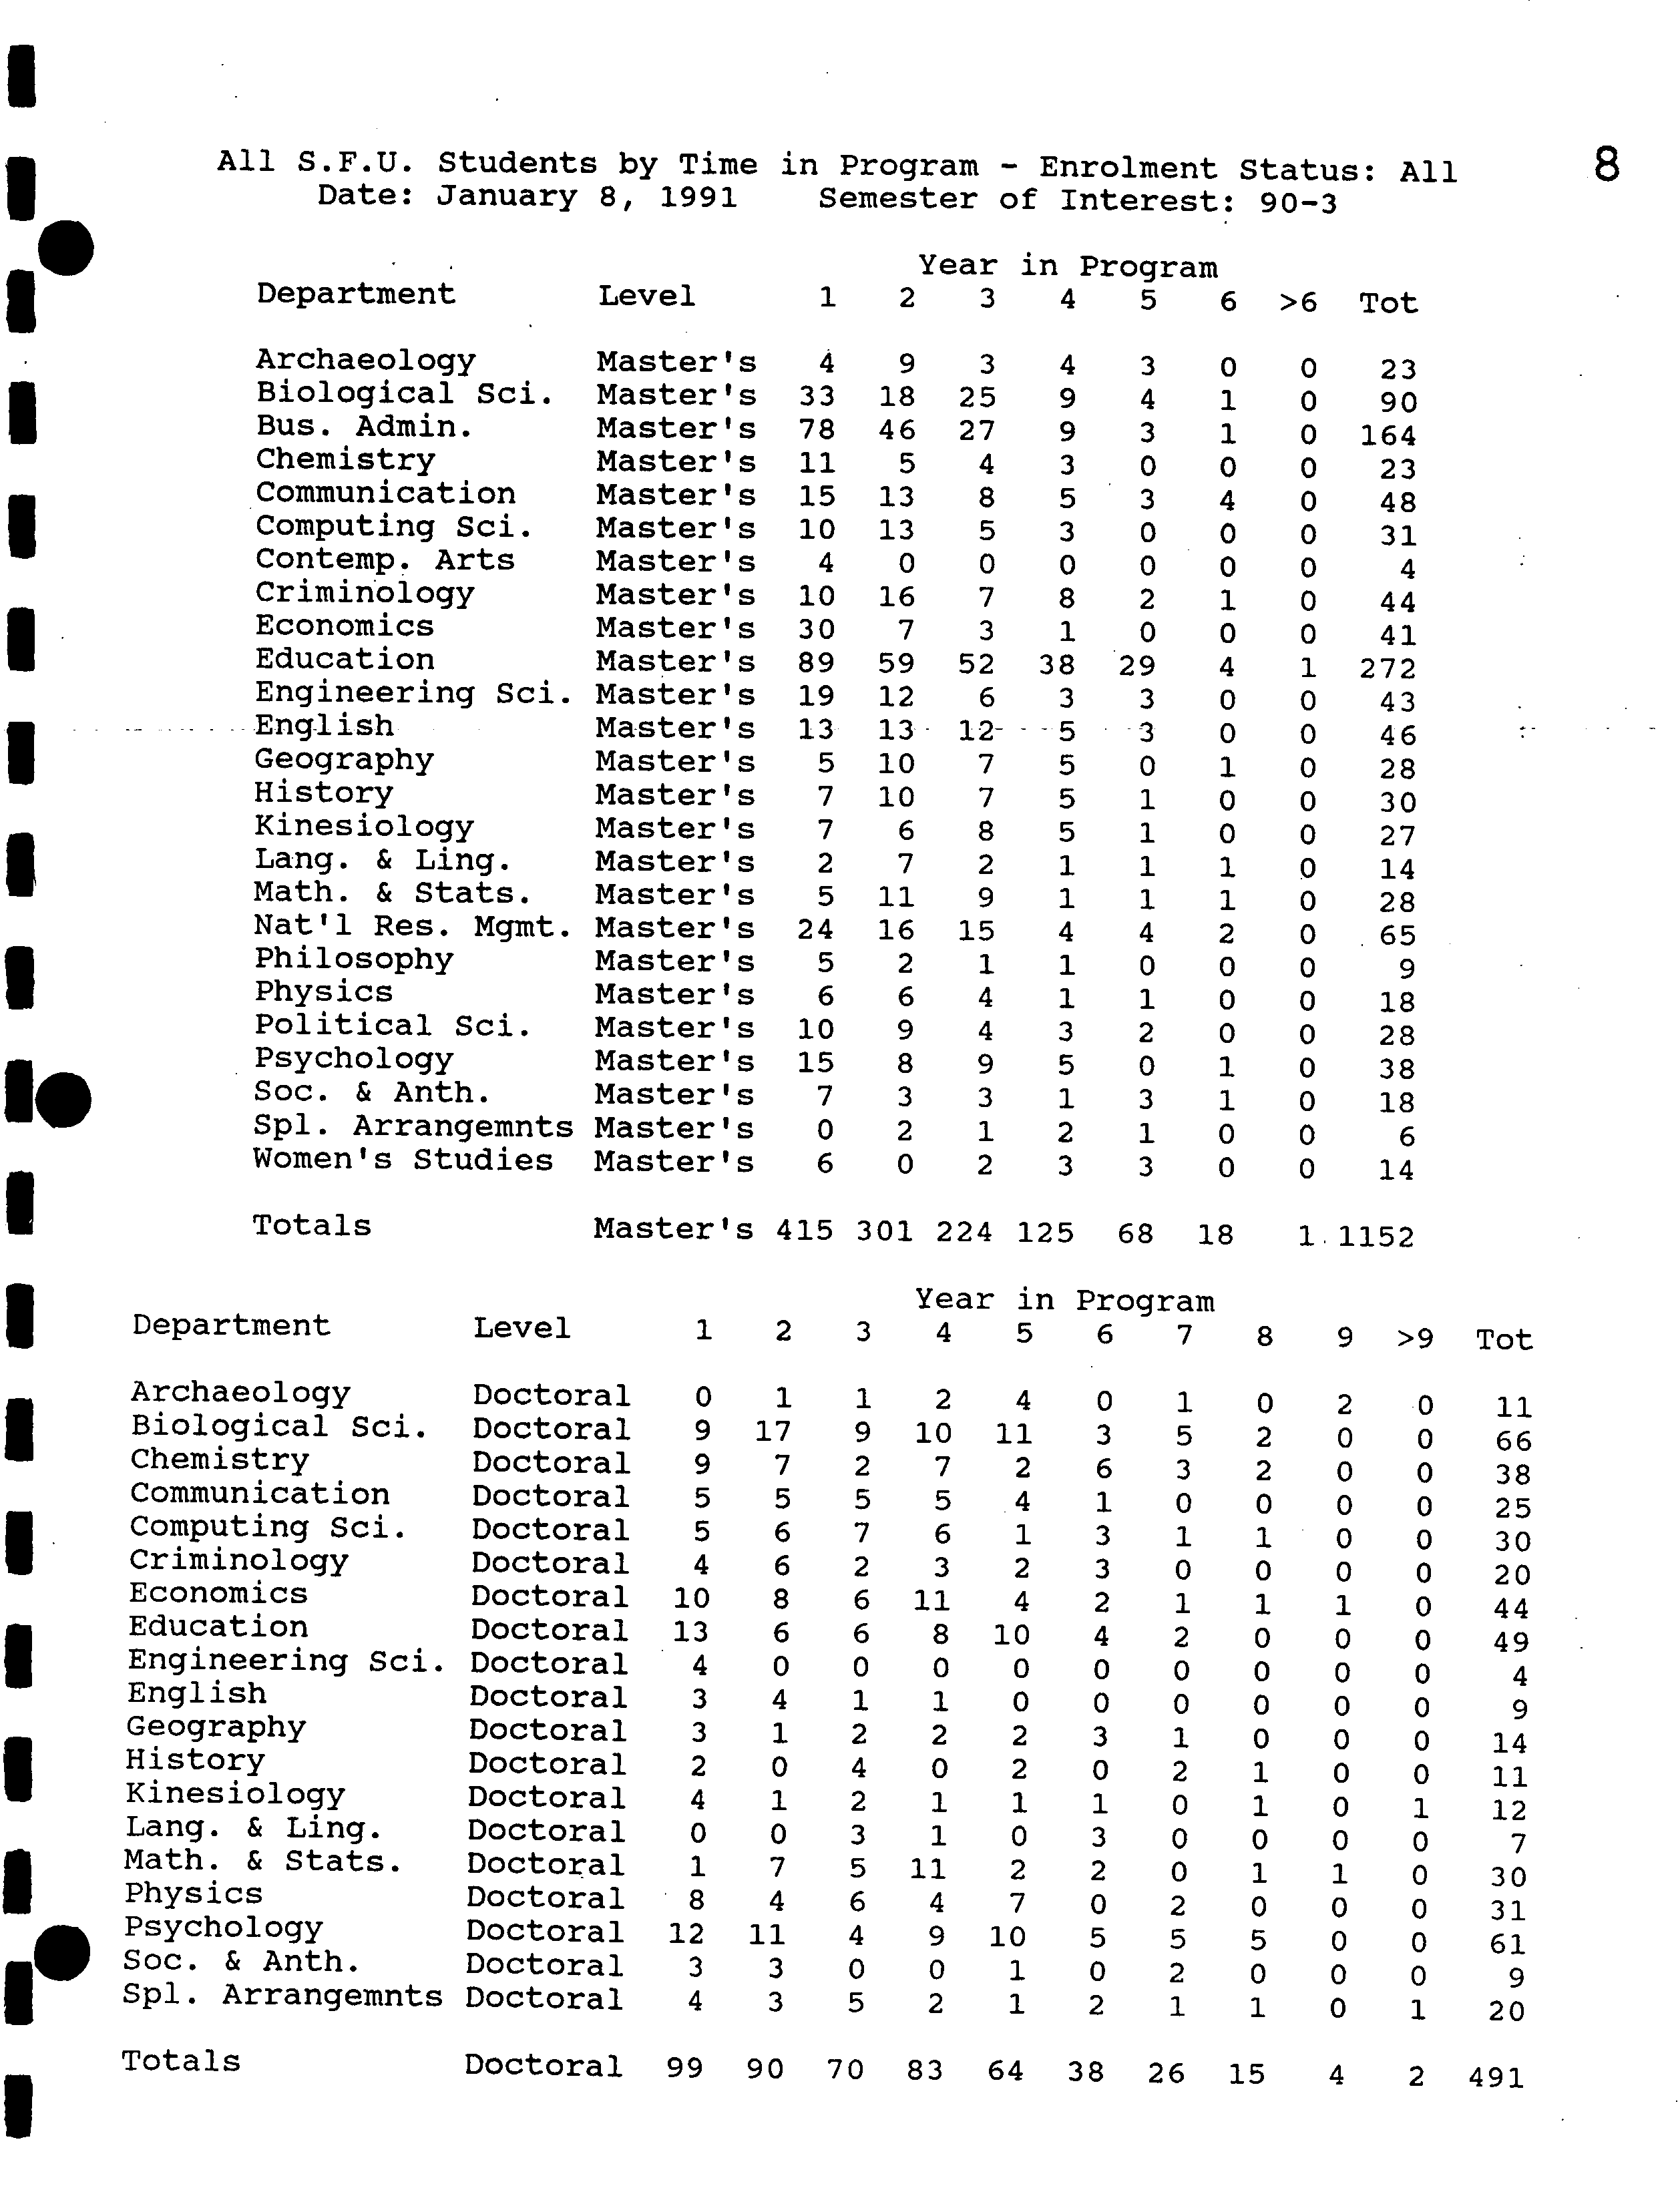
All S.F.U.
Date:
Students
January 8,
by
1991Time
?
in
Semester
Program -
of
Enrolment
Interest:
Status:
90-3
All
?
ru
LJ
Archaeology ?
Master's
Biological Sci. Master's
I ?
Bus. Admin.
Master's
Chemistry
Master's
Communication
Master's
Computing Sd.
I
Master's
Contenip. Arts
Master's
Criminology
Master's
I ?
Economics
Master's
Education
Master's
Engineering Sci.
Master's
• ?
............English
Master's
Geography
Master's
History
Master's
Kinesiology
Master's
Lang. ?
& Ling.
I
Master's
Math. & Stats.
Master's
Nat'l Res. Mgint.
Master's
II
??
PhilosophyPhysics
Master's
Master's
Political Sci.
Master's
1•
Department ?
Level
Year
in
Program
1
2
3
4
5
6 ?
>6
Tot
4
9
3
4
3
0 ?
0
23
33
18
25
9
4
1 ?
0
90
78
46
27
9
3
1 ?
0
164
11
5
4
3
0
0 ?
0
23
15
13
8
5
3
4 ?
0
48
10
13
5
3
0
0 ?
0
31
4
0
0
0
0
0 ?
0
4
10
16
7
8
2
1 ?
0
44
30
7
3
1
0
0 ?
0
41
89
59
52
38
•
29
4 ?
1
272
19
12
6
3
3
0 ?
0
43
13
13
12-
- -5
3
0 ?
0
46
5
10
7
5
0
1 ?
0
28
7
10
7
5
1
0 ?
0
30
7
6
8
5
1
0 ?
0
27
2
7
2
1
1
1 ?
0
14
5
11
9
1
1
1 ?
0
28
24
16
15
4
4
2 ?
0
.65
5
2
1
1
0
0
?
0
9
6
6
4
1
1
0 ?
0
18
10
9
4
3
2
0 ?
0
28
15
8
9
5
0
1
?
0
38
7
3
3
1
3
1
?
0
18
0
2
1
2
1
0 ?
0
6
6
0
2
3
3
0 ?
0
14
110
?
Psychology ?
Master's
Soc. & Anth. Master's
Spi. Arrangemnts Master's
Women's Studies Master's
II
DepartmentTotals ?
Level
Master's 415 301 224 125 68 18
?
1.1152
Archaeology ?
Doctoral
Biological Sci. Doctoral
- ?
Chemistry
Doctoral
Communication
Doctoral
I
I
??
.
CriminologyComputing
Sci.
Doctoral
Doctoral
Economics
Doctoral
Education
Doctoral
I
Engineering Sci.
Doctoral
English
Doctoral
Geography
Doctoral
I ?
History
Doctoral
Kinesiology
Doctoral
Lang. & Ling.
Doctoral
Math. ?
& Stats.
Doctoral
I ?
Physics
Doctoral
•
Psychology ?
Doctoral ?
Soc. & Anth.
?
Doctoral
I
?
?
Spi. Arrangemnts Doctoral
?
Totals ?
Doctoral
Year in Program
1 ?
2
?
3 ?
4 ?
5 ?
6
?
7 ?
8 ?
9 >9 Tot
4
5
5
9
9
0
17
6
6
57
1
2
7
9
2
5
1
10
3
6
5
7
2
11
24
1
4
2
33
61
3
0
0015
3
1
0
2
10
2
0
0000
2
0
0
00
0
00
20
30
25
66
38
11
121310
4
3
81
4
0
23
4
3
11
33
47
01
4
01860
5
4
065
3
22410
66
1111
2
90
4
1
0
2
11
0
8
1010
117
2
0
21
2
004
2
500
2
3
1
0
3
4
00
2
21
5
2
000
2
10
2
0
1
01
5
0
0
1
100
1
001
000
0
1
0
0000001
0100001
0
000
00
20
61
30
31
12
14
11
49
44
9
7
9
4
99
90 70
83 64
38
26
15
4
2
491
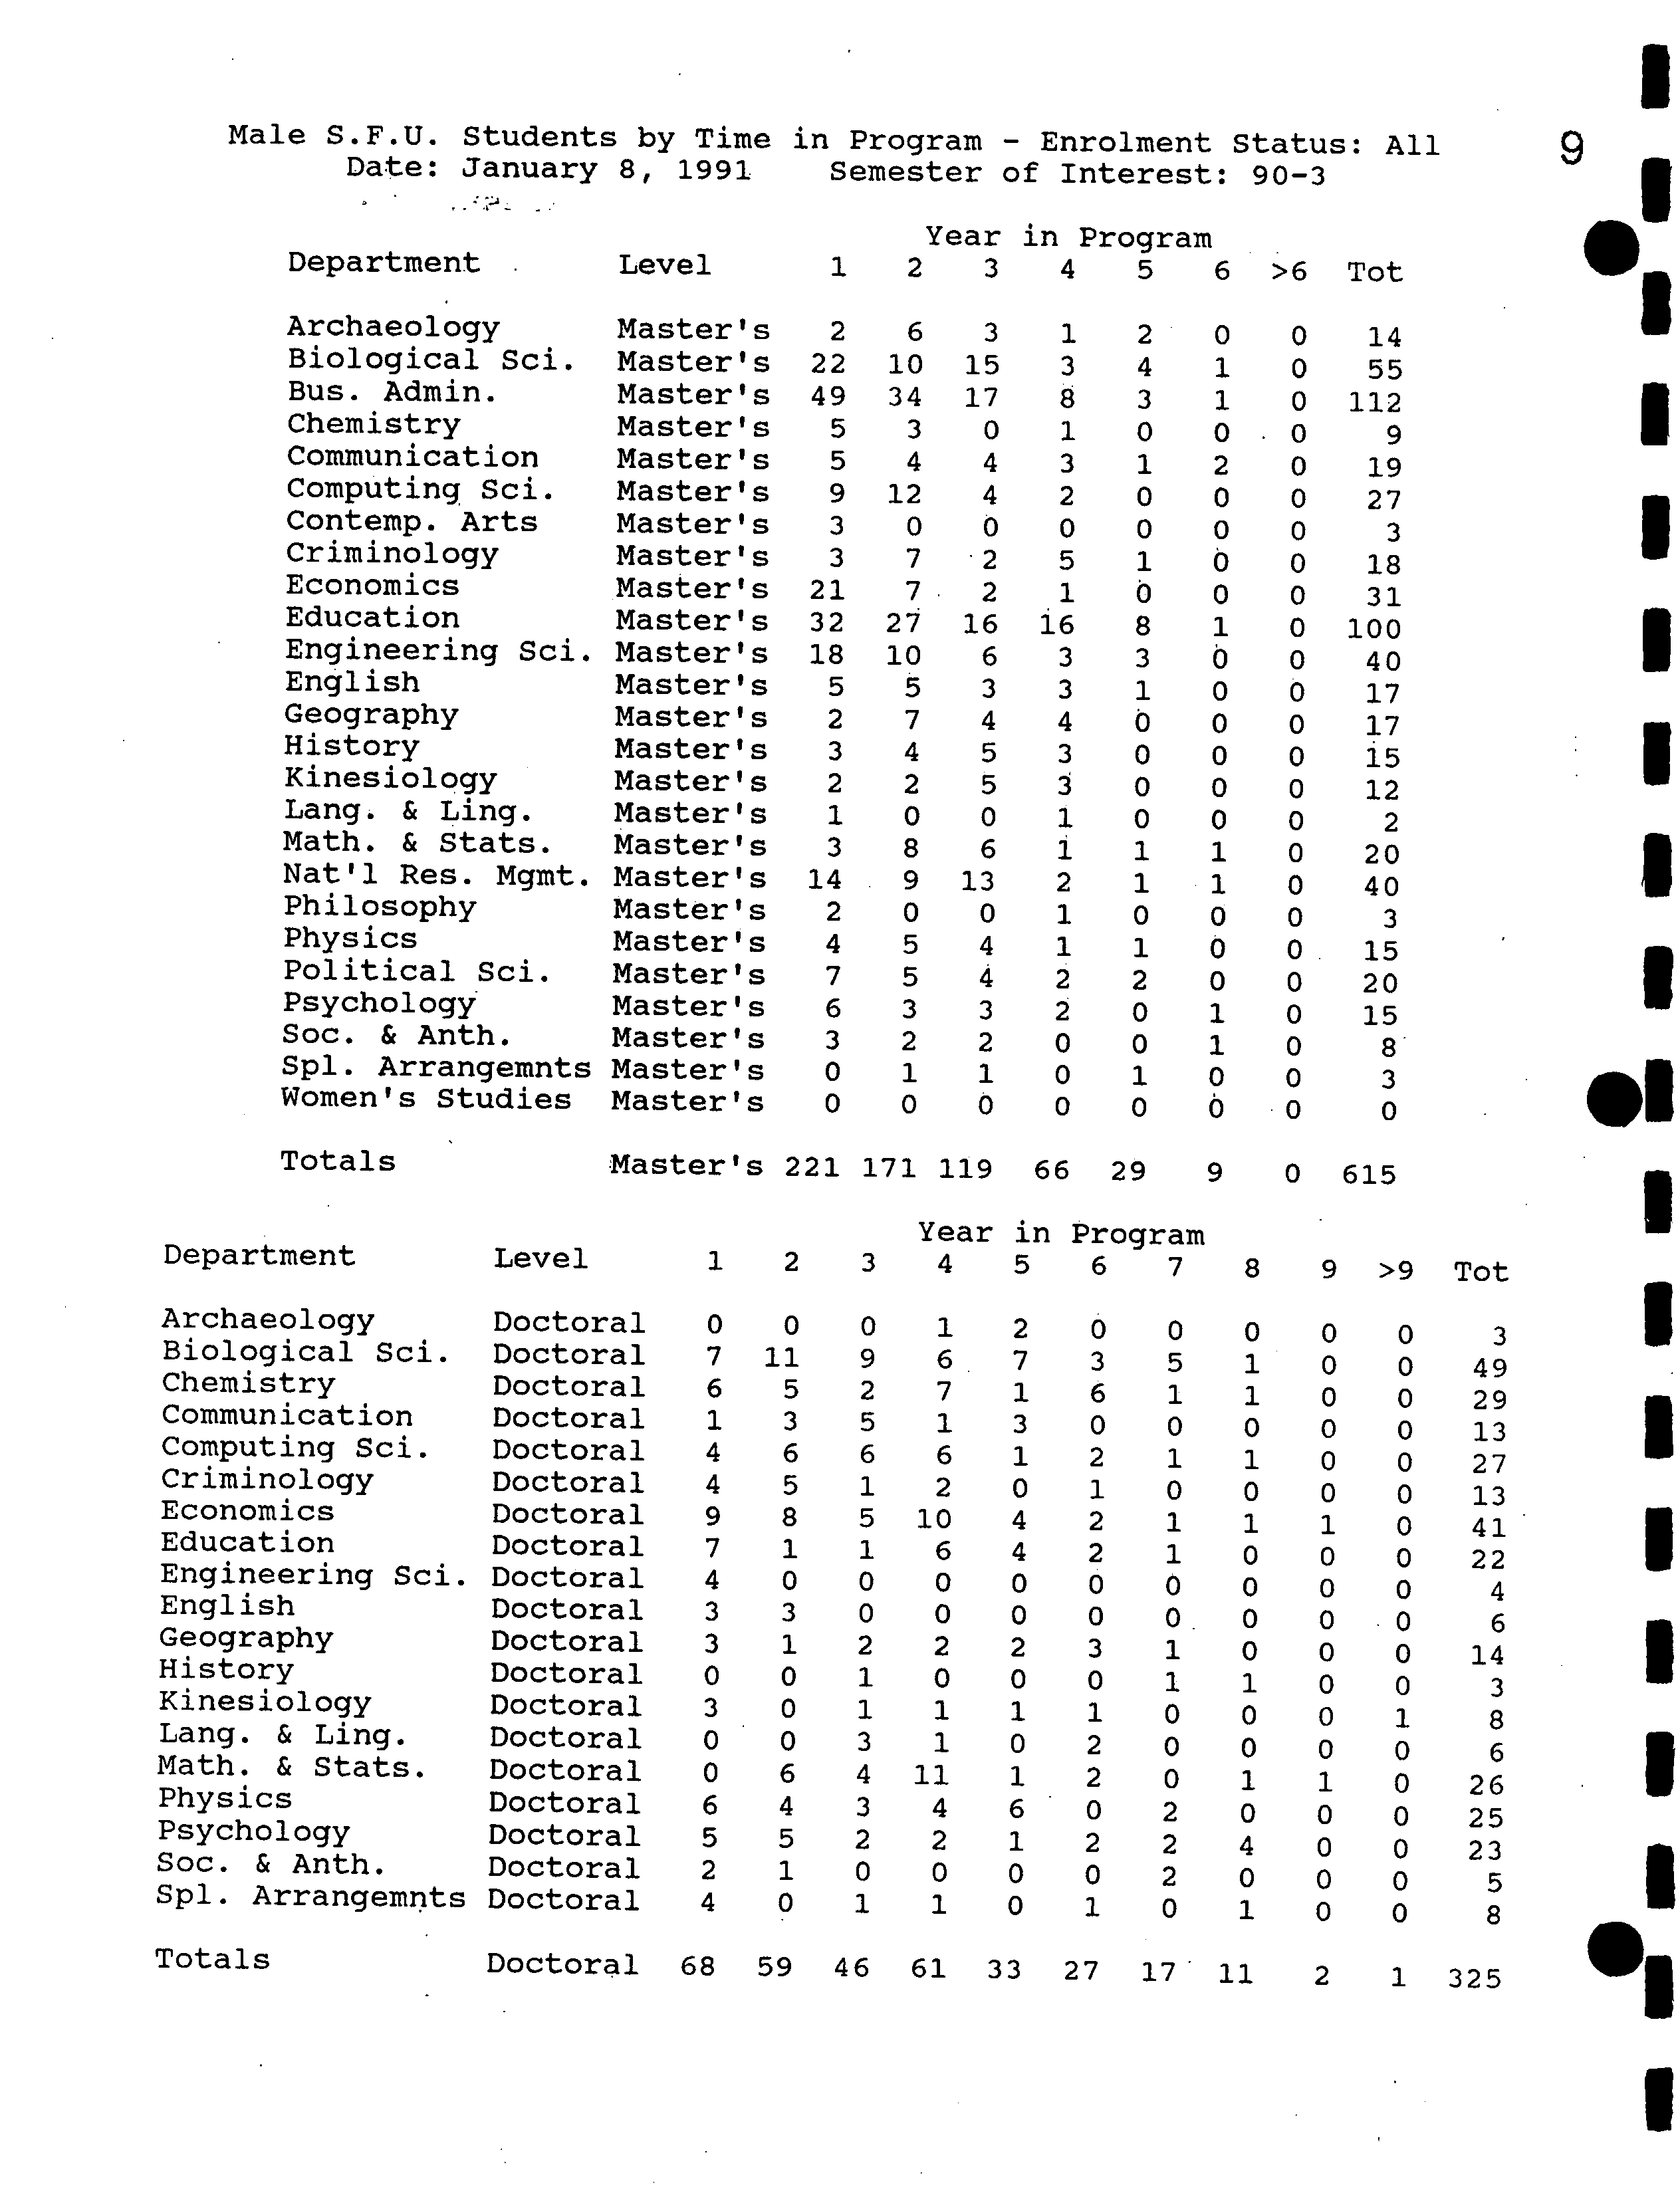
Male S.F.U. Students by Time
in
Program
- Enrolment
Status: All
Date: January 8, 1991
Semester
of Interest:
90-3
Year
in
Program
Department ?
Level
1
2
3
4
5
6
>6
Tot
ArchaeologyBiological
Sci.
?
?
Master'sMaster's
22
2
10
6
15
3
3
1
42
0
1
00
55
14
EconomicsEducationContemp.
CriminologyComputing
CommunicationChemistry
Bus. Admin.
??
Arts
?
Sci.
?????
Master'sMaster'sMaster'sMaster'sMaster'sMaster'sMaster'sMaster's
21
32
49
9
33
55
27
1234
7
74
0
3
16
17
2
2
44
00
16
5
2
018
3
1
800100
3
1
b
001
0
0
21
0000000
0
100
112
31
18
27
19
3
9
Women's
Spl.
Soc.
Math.
PsychologyNat'l
HistoryPolitical
PhysicsPhilosophyKinesiologyLang.
Geography
Engineering
English&
Arrangemnts
&
&
Res.
Anth.
???
Stats.StudiesLing.
?
Sci.
??
Mgmt.
??
Sd.
???
?
Master's
Master'sMaster'sMaster'sMaster'sMaster'sMaster'sMaster'sMaster'sMaster'sMaster'sMaster'sMaster'sMaster'sMaster's
1418
007
3
64
232
1
2
5
3
10
0
2
1
3
5
580940
27
5
13
0
2
1
4
3
4
00655
4
6
3
2
000
2
2
1
141
1
333
3
0
2
0
101001100
0
1
3
Ô
00
10100
1
1
0
0000
00000000
0
00
0
000
20
15
40
15
20
15
40
12
17
17
8
3
0
3
2
Totals ?
Master's
221
171
119
66
29
9
0
615
Year
in
Program
Department ?
Level ?
1
2
3
4
5
6
7
8
9
>9
Tot
Spi.
Math.
Soc.
PsychologyPhysicsHistoryKinesiology
Lang.
GeographyEngineering
EnglishArchaeologyEducationEconomicsCriminologyComputing
ChemistryCommunicationBiological
Arrangenints
&
&
&
Anth.
???
Stats.Ling.
????
Sci.
?
Sci.
????
Sci.
????
?
Doctoral
DoctoralDoctoralDoctoralDoctoralDoctoralDoctoralDoctoralDoctoralDoctoralDoctoralDoctoralDoctoralDoctoralDoctoralDoctoralDoctoralDoctoralDoctoral
???????????????????
4
2
56
0
00
33
4
3
7
4946
7
0
1
?
11
05
41
60
0
080
3
1
1
56
3
50
2104
3
1
3
2
1
0
50
1
2
1695
0
11
10
214012
010026
7
6
161
006
1021
01
0
44
007
2
3
1
1
01
2
0
2
2
010
3
2
0
2
1
2
060
3
0
2
2
2
000
1
00110
11
500
1
10
4
000
1
0
00
1
0
1
0
001
1
1
00
0
0
1
000000
0100
00
0
0
000000
0
0
1
0
0
00000000
25
23
26
22
14
41
27
13
49
29
13
8
5
8
6
3
4
6
3
Totals ?
Doctoral ?
68 ?
59 46
61
33
27
17
11
2
1
325
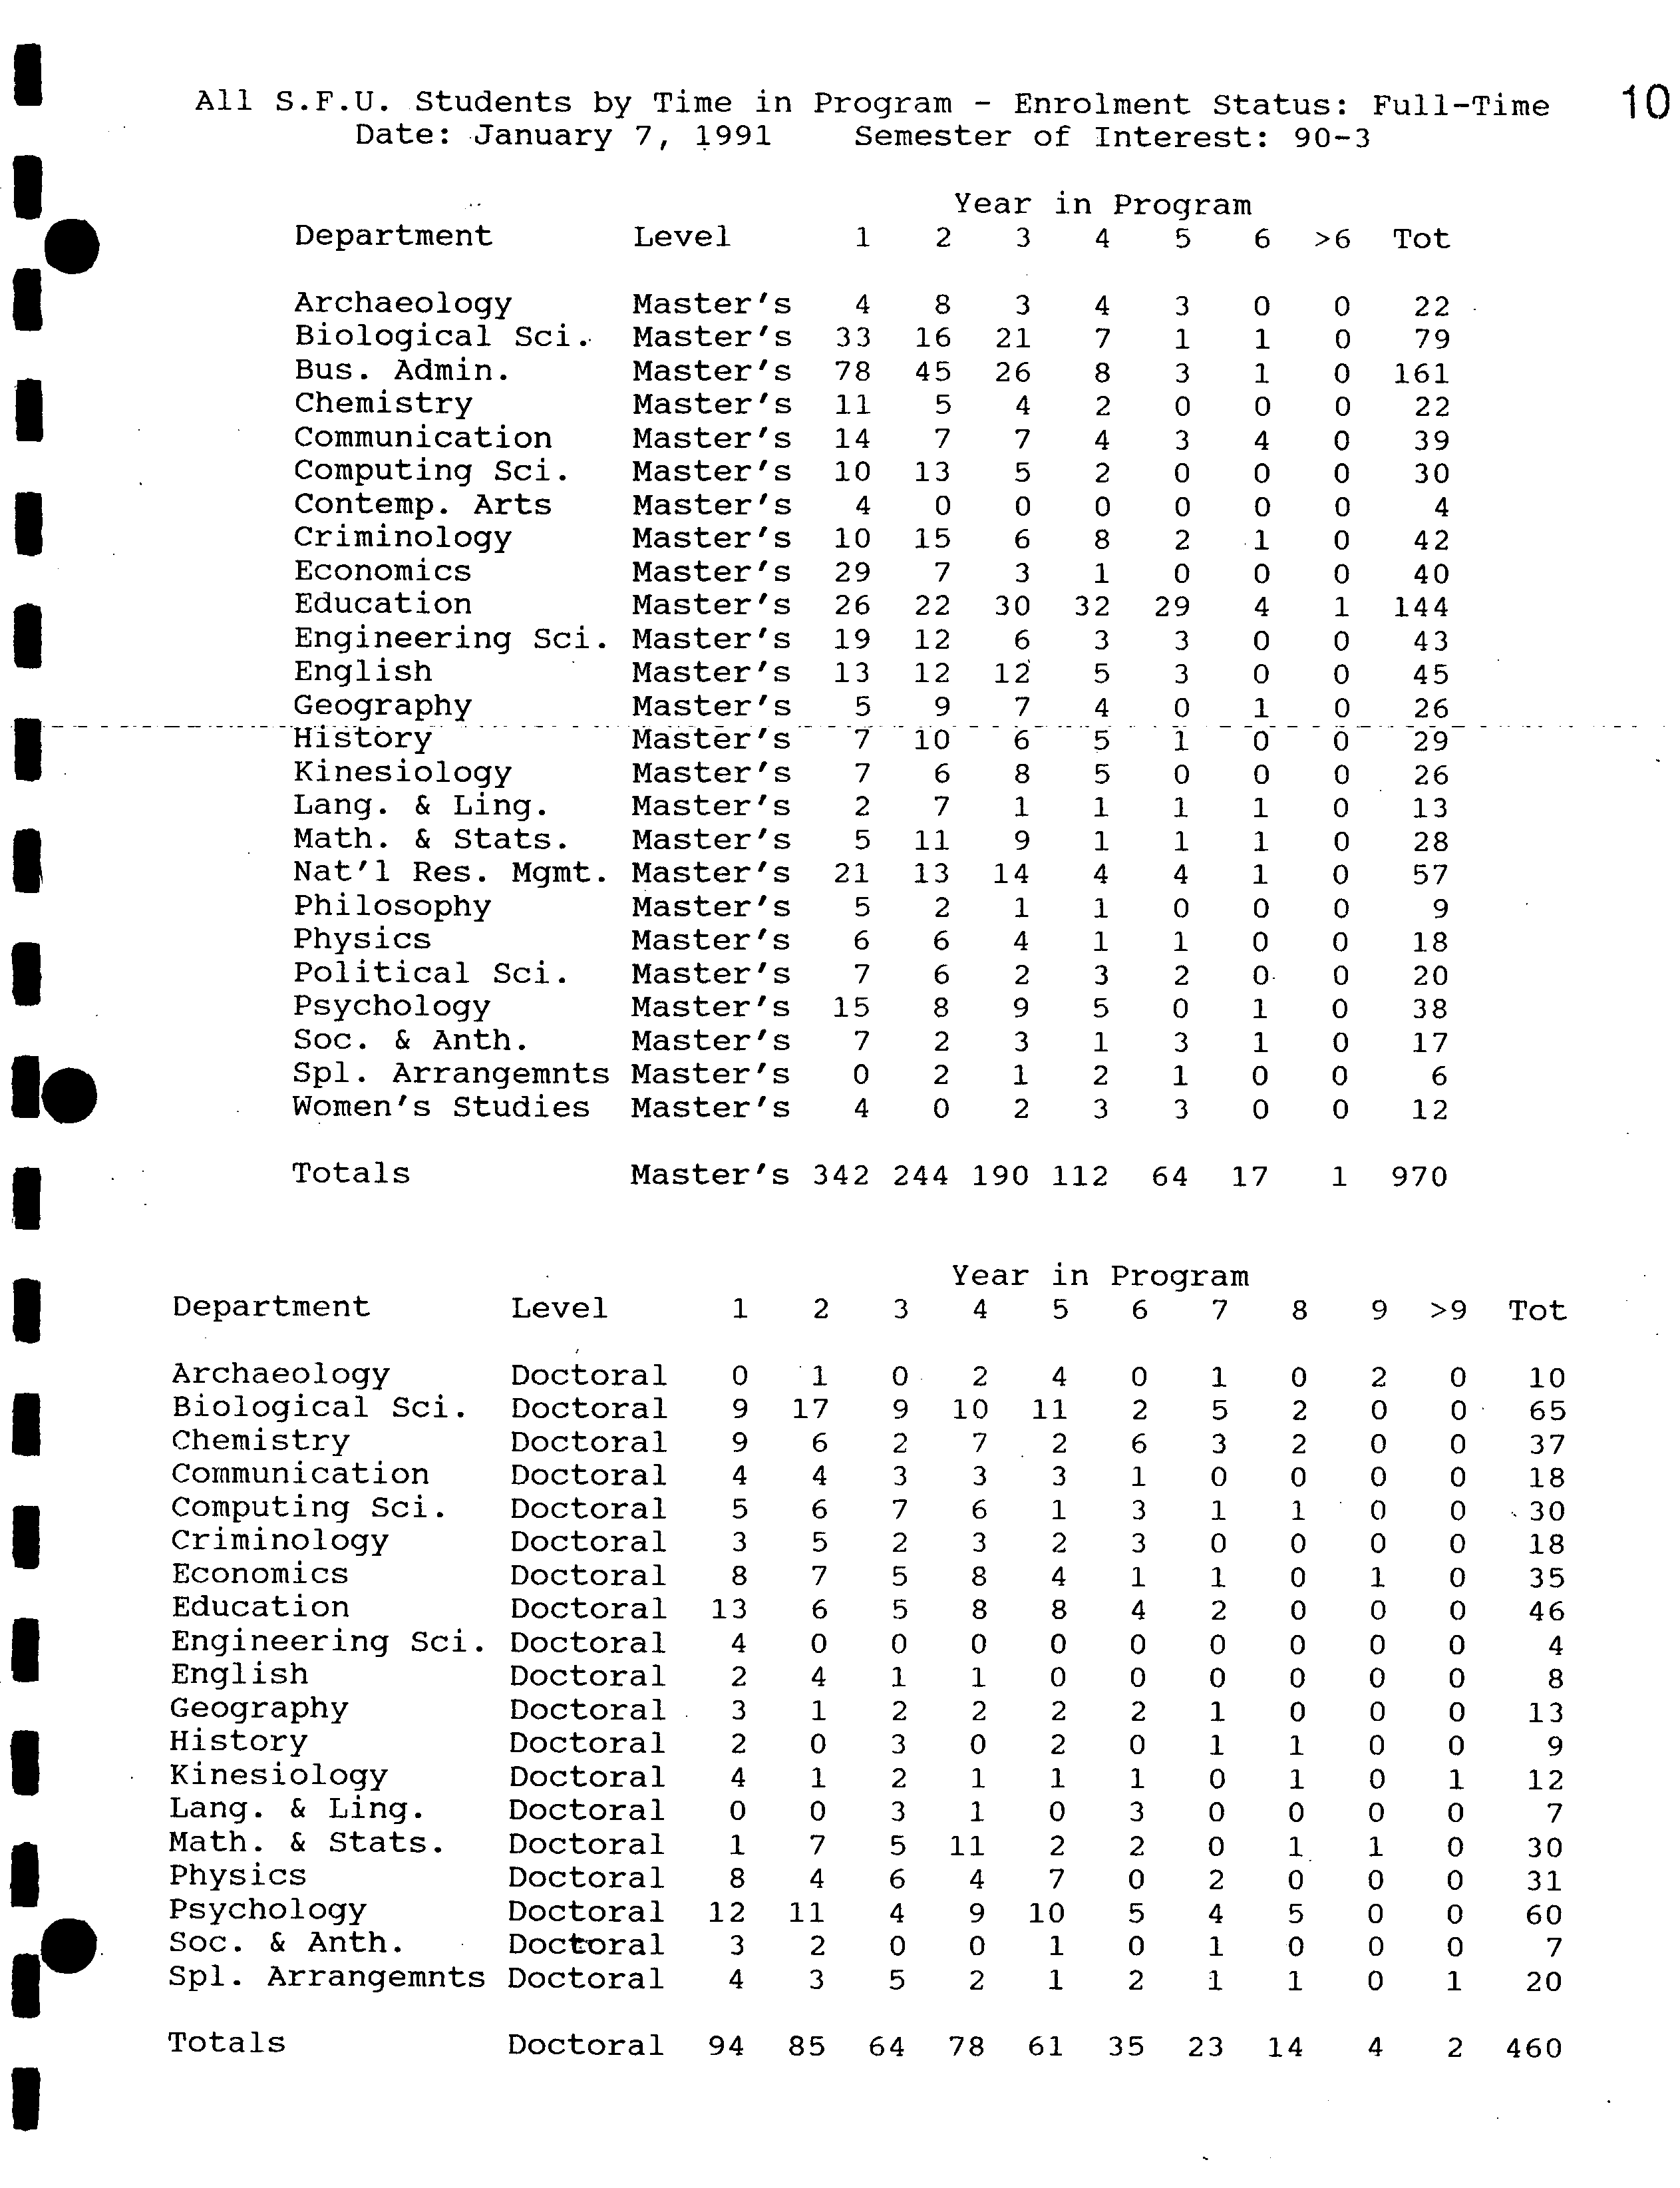
All S.F.U. Students by Time in Program - Enrolment Status: Full-Time
?
10
Date: January 7, 1991
?
Semester of Interest: 90-3
Year in Program
Department ?
Level ?
1 ?
2 ?
3 ?
4 ?
5 ?
6 >6 Tot
S
I ?
Archaeology
Master's 4
8
3
4 3 0
0 22
Biological Sci.
Master's
33 16
21
7
1 1 0
79
Bus. Admin.
Master's
78
45
26
8 3
1 0
161
I ?
Chemistry
Master's
11 5
4
2
0 0 0 22
Communication
Master's 14 7
7
4 3 4
0 39
Computing
Sd.
Master's
10 13
5
2 0
0 0 30
Contemp. Arts
Master's 4
0
0
0 0 0 0 4
S ?
Criminology
Master's 10 15
6
8
2 1 0 42
Economics
Master's 29 7
3
1 0
0 0
40
Education
Master's 26
22
30 32
29 4
1
144
Engineering Sci.
I
Master's
19 12
6 3
3
0
0 43
English
Master's
13 12
12
5
3 0
0 45
Geography
Master's
5 9 7
4
0 1 0
26
I- ?
Hitbry
Master 's
7
10
6 5
1 0 029
-
Kinesiology
Master's
7
6
8
5 0 0
0 26
Lang. ?
& Ling.
Master's
2 7
1
1
1 1 0
13
Math. & Stats.
Master's
5 11
9
1
1 1 0 28
I ?
Nat'l Res. Mgmt.
Master's 21
13 14
4 4 1
0 57
Philosophy
Master's 5
2
1 1 0 0
0 9
Physics
Master's 6
6 4
1 1
0 0 18
Political Sci.
I
Master's
7
6 2
3 2 0. 0 20
Psychology
Master's
15
8 9 5
0 1 0 38
Soc.
?
& Anth.
Master's 7
2
3 1
3 1 0 17
I ?
Spi. Arrangeinnts Master's
?
0 ?
2 ?
1 ?
2 ?
1 ?
0 ?
0 ?
6
Women's Studies Master's
?
4 ?
0 ?
2 ?
3 ?
3 ?
0
?
0 ?
12
Totals
Master's 342
244 190 112
64 ?
17 1
970
Year in
Program
5
Department
Level
1 2
3
4
5
6
7 8 9
>9
Tot
Archaeology
Doctoral
0 1
0
2 4 0
1 0 2 0
10
Biological Sci.
Doctoral 9 17
9
10
11
2
5 2
0
0 65
I
Chemistry
Doctoral
9
6
2
7
2
6 3 2 0
0 37
Communication
Doctoral 4
4
3 3
3 1 0
0 0 0
18
Computing
Sd.
Doctoral
5
6
7
6
1
3 1 1 0
0 30
I
Criminology
Doctoral
3 5
2 3
2 3 0
0 0 0
18
Economics
Doctoral 8 7
5 8 4
1
1 0 1 0
35
Education
Doctoral
13
6 5 8 8
4 2 0 0
0 46
I
Engineering Sci.
Doctoral
4 0
0 0 0
0 0 0 0 0
4
English
Doctoral
2 4
1 1 0 0
0 0 0 0
8
Geography
Doctoral 3
1 2 2 2
2
1 0
0
0
13
History
Doctoral
2 0 3
0 2 0
1
1
0
0
9
I
Kinesiology
Doctoral
4
1 2
1 1 1
0 1 0
1 12
Lang. ?
& Ling.
Doctoral
0
0
3 1 0 3
0
0 0 0
7
Math. & Stats.
Doctoral
1 7
5 11 2
2 0
1 1 0
30
I
Physics
Doctoral
8
4
6 4 7
0 2
0 0 0
31
Psychology
Doctoral
12 11
4 9 10
5 4 5 0
0
60
•
rmntS
Doctoral
4 3
5 2 1 2
1 1 0 1
20
I
Totals
Doctoral 94
85
64
78 61 35
23 14 4
2
460
Department ?
Level
Archaeology
Doctoral
Biological Sci.
Doctoral
Chemistry
Doctoral
Communication
Doctoral
Computing Sci.
Doctoral
Criminology
Doctoral
Economics
Doctoral
Education
Doctoral
Engineering Sci.
Doctoral
English
Doctoral
Geography
Doctoral
History
Doctoral
Kinesiology
Doctoral
Lang. ?
& Ling.
Doctoral
Math.
?
& Stats.
Doctoral
Physics
Doctoral
Psychology
Doctoral
Soc.
?
& Anth.
Doctoral
Spi. Arrangemnts
Doctoral
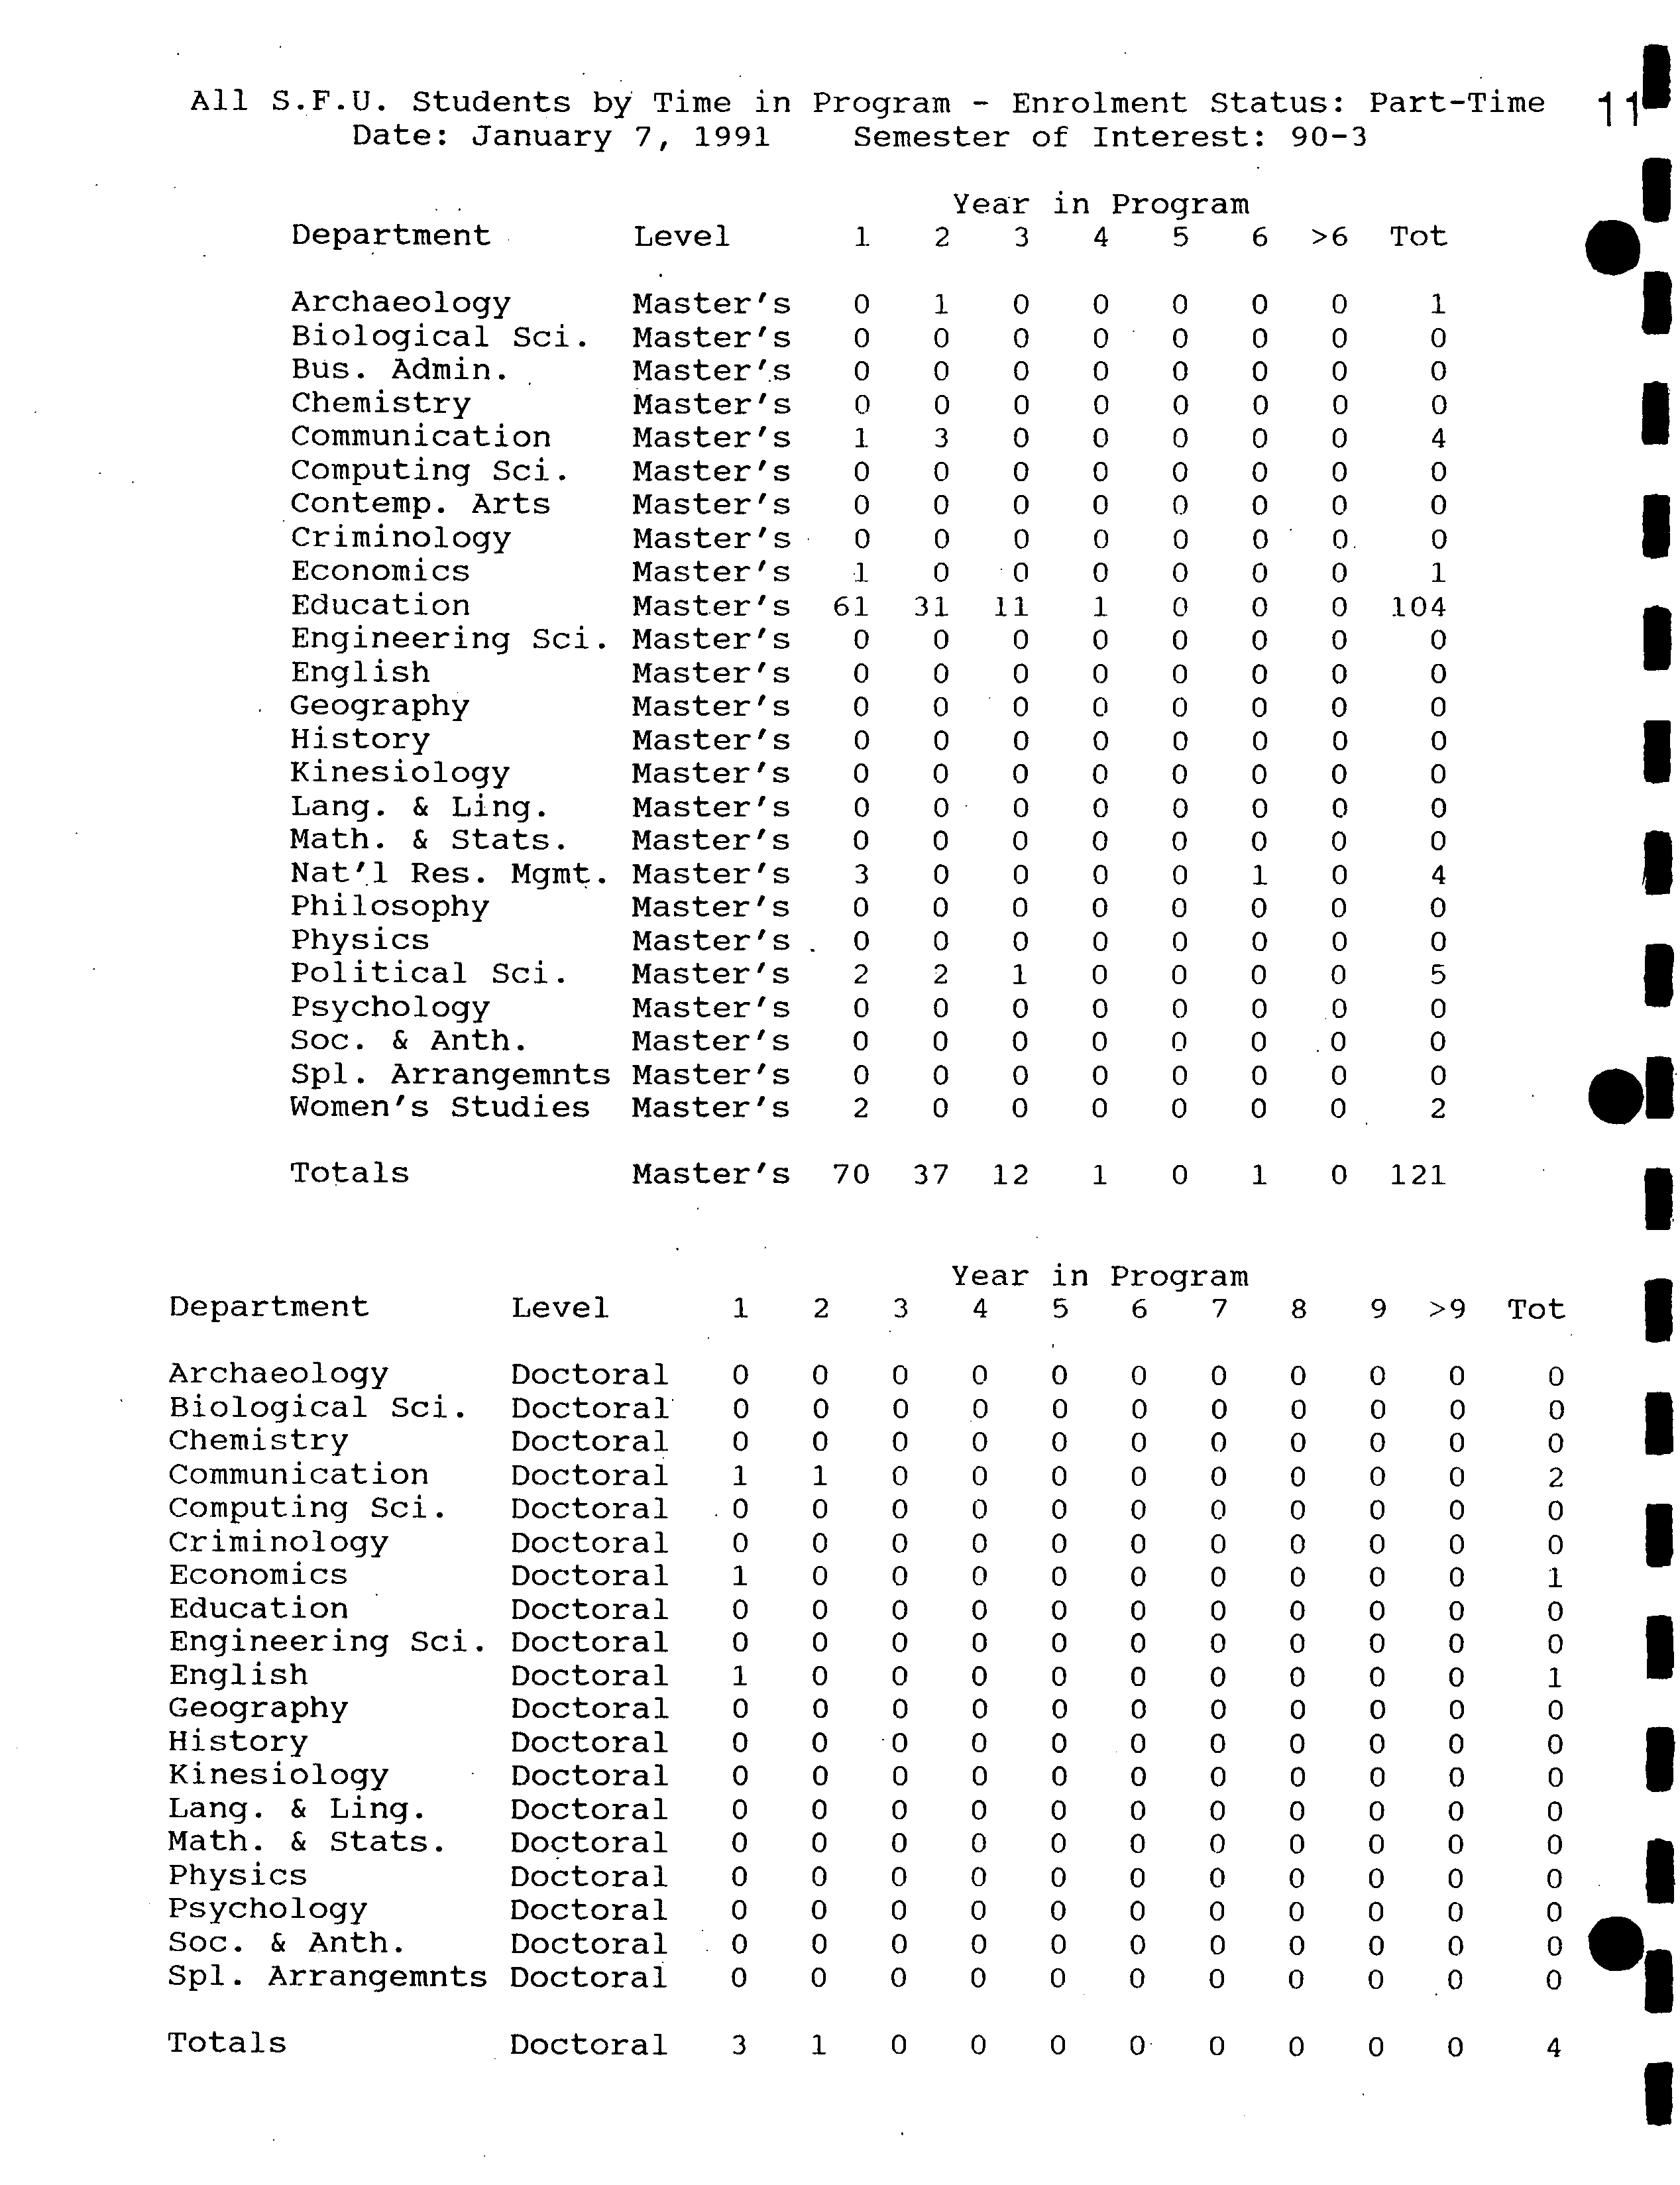
All S.F.U. Students by Time in Program - Enrolment Status: Part-Time ?
Date: January 7, 1991
?
Semester of Interest: 90-3
Year in Program
De p artment ?
Level ?
1 ?
2
?
3
?
4
?
5
?
6 >6 Tot
Archaeology
Master's 0
Biological Sci.
Master's 0
Bus. ?
Adinin.
Master'.s 0
Chemistry
Master's
0
Communication
Master's 1
Computing Sci.
Master's
0
Contemp. Arts
Master's 0
Criminology
Master's
0
Economics
Master's
1
Education
Master's 61
Engineering Sci.
Master's 0
English
Master's
0
Geography
Master's
0
History
Master's 0
Kinesiology
Master's 0
Lang. ?
& Ling. Master's
0
Math. ?
& Stats.
Master's 0
Nat'
.
l Res. ?
Mgmt. Master's 3
Philosophy
Master's 0
Physics
Master's 0
Political Sci.
Master's 2
Psychology
Master's 0
Soc. ?
& Anth.
Master's 0
Spi. Arrangemnts
Master's 0
Women's Studies
Master's 2
Totals
Master's 70
1
0
0
0
0
0
1
0 0 00 0 0
0
0 0000
0
0
00 000 0 0
3
0
0
0
0
0
4
0 0
0 00 0
0
0 0000
0
0
0
0
0
0
0
0.
0
0
0
0
0
0
0
1
31 11
1 0 0 0 104
000
000
0
0
0
0
0
0
0
0
0
0
0
0
0
0
0
0
0
0
0
0
0
0
0000
0 0
0
0 00000
0
00
000 0
0
0
0
0
0
1
0
4
0
0
0
0
0
0
0
00
00
0
0
0
2
1
0
0
0
0
5
0
0
0
0
0
0
0
0 0 0 0
0.0
0
000
0 0 0
0
0
0
0
0
0
0
2
37
12
1 0
1 0
121
Year in Program
1 ?
2 ?
3 ?
4 ?
5 ?
6 ?
7 ?
8 ?
9 >9 Tot
0 ?
0 ?
0 ?
0 ?
0 ?
0 ?
0 ?
0 ?
0 ?
0 ?
0
0 ?
0 ?
0 ?
0 ?
0 ?
0 ?
0 ?
0 ?
0 ?
0
?
0
0 ?
0 ?
0 ?
0 ?
0 ?
0 ?
0 ?
0 ?
0 ?
0 ?
0
1 ?
1 ?
0
?
0
?
0
?
0 ?
0 ?
0 ?
0 ?
0 ?
2
0 ?
0 ?
0 ?
0
?
0
?
0 ?
0 ?
0 ?
0 ?
0 ?
0
0 ?
0 ?
0 ?
0 ?
0 ?
0 ?
0 ?
0 ?
0 ?
0 ?
0
1
?
0 ?
0 ?
0 ?
0 ?
0 ?
0 ?
0 ?
0 ?
0 ?
1
0 ?
0 ?
0 ?
0 ?
0 ?
0 ?
0 ?
0 ?
0 ?
0 ?
0
0 ?
0 ?
0 ?
0 ?
0 ?
0 ?
0 ?
0 ?
0 ?
0 ?
0
1 ?
0 ?
0 ?
0 ?
0 ?
0 ?
0 ?
0 ?
0 ?
0 ?
1
0 ?
0 ?
0 ?
0 ?
0 ?
0 ?
0 ?
0 ?
0 ?
0 ?
0
0 ?
0 ?
• 0 ?
0 ?
0 ?
0 ?
0 ?
0 ?
0 ?
0 ?
0
0 ?
0 ?
0 ?
0 ?
0 ?
0 ?
0 ?
0 ?
0 ?
0 ?
0
0 ?
0 ?
0 ?
0 ?
0 ?
0 ?
0
?
0 ?
0 ?
0 ?
0
0 ?
0 ?
0 ?
0 ?
0 ?
0 ?
0
?
0
?
0 ?
0 ?
0
0 ?
0 ?
0 ?
0 ?
0
?
0 ?
0 ?
0 ?
0 ?
0 ?
0
0
?
0 ?
0
?
0 ?
0 ?
0 ?
0 ?
0 ?
0 ?
0 ?
0
0 ?
0 ?
0 ?
0 ?
0 ?
0 ?
0 ?
0 ?
0 ?
0 ?
0
0 ?
0 ?
0 ?
0 ?
0 ?
0 ?
0 ?
0 ?
0 ?
0
?
0
Totals ?
Doctoral
?
3 ?
1 ?
0 ?
0 ?
0 ?
0 ?
0
?
0 ?
0 ?
0 ?
4
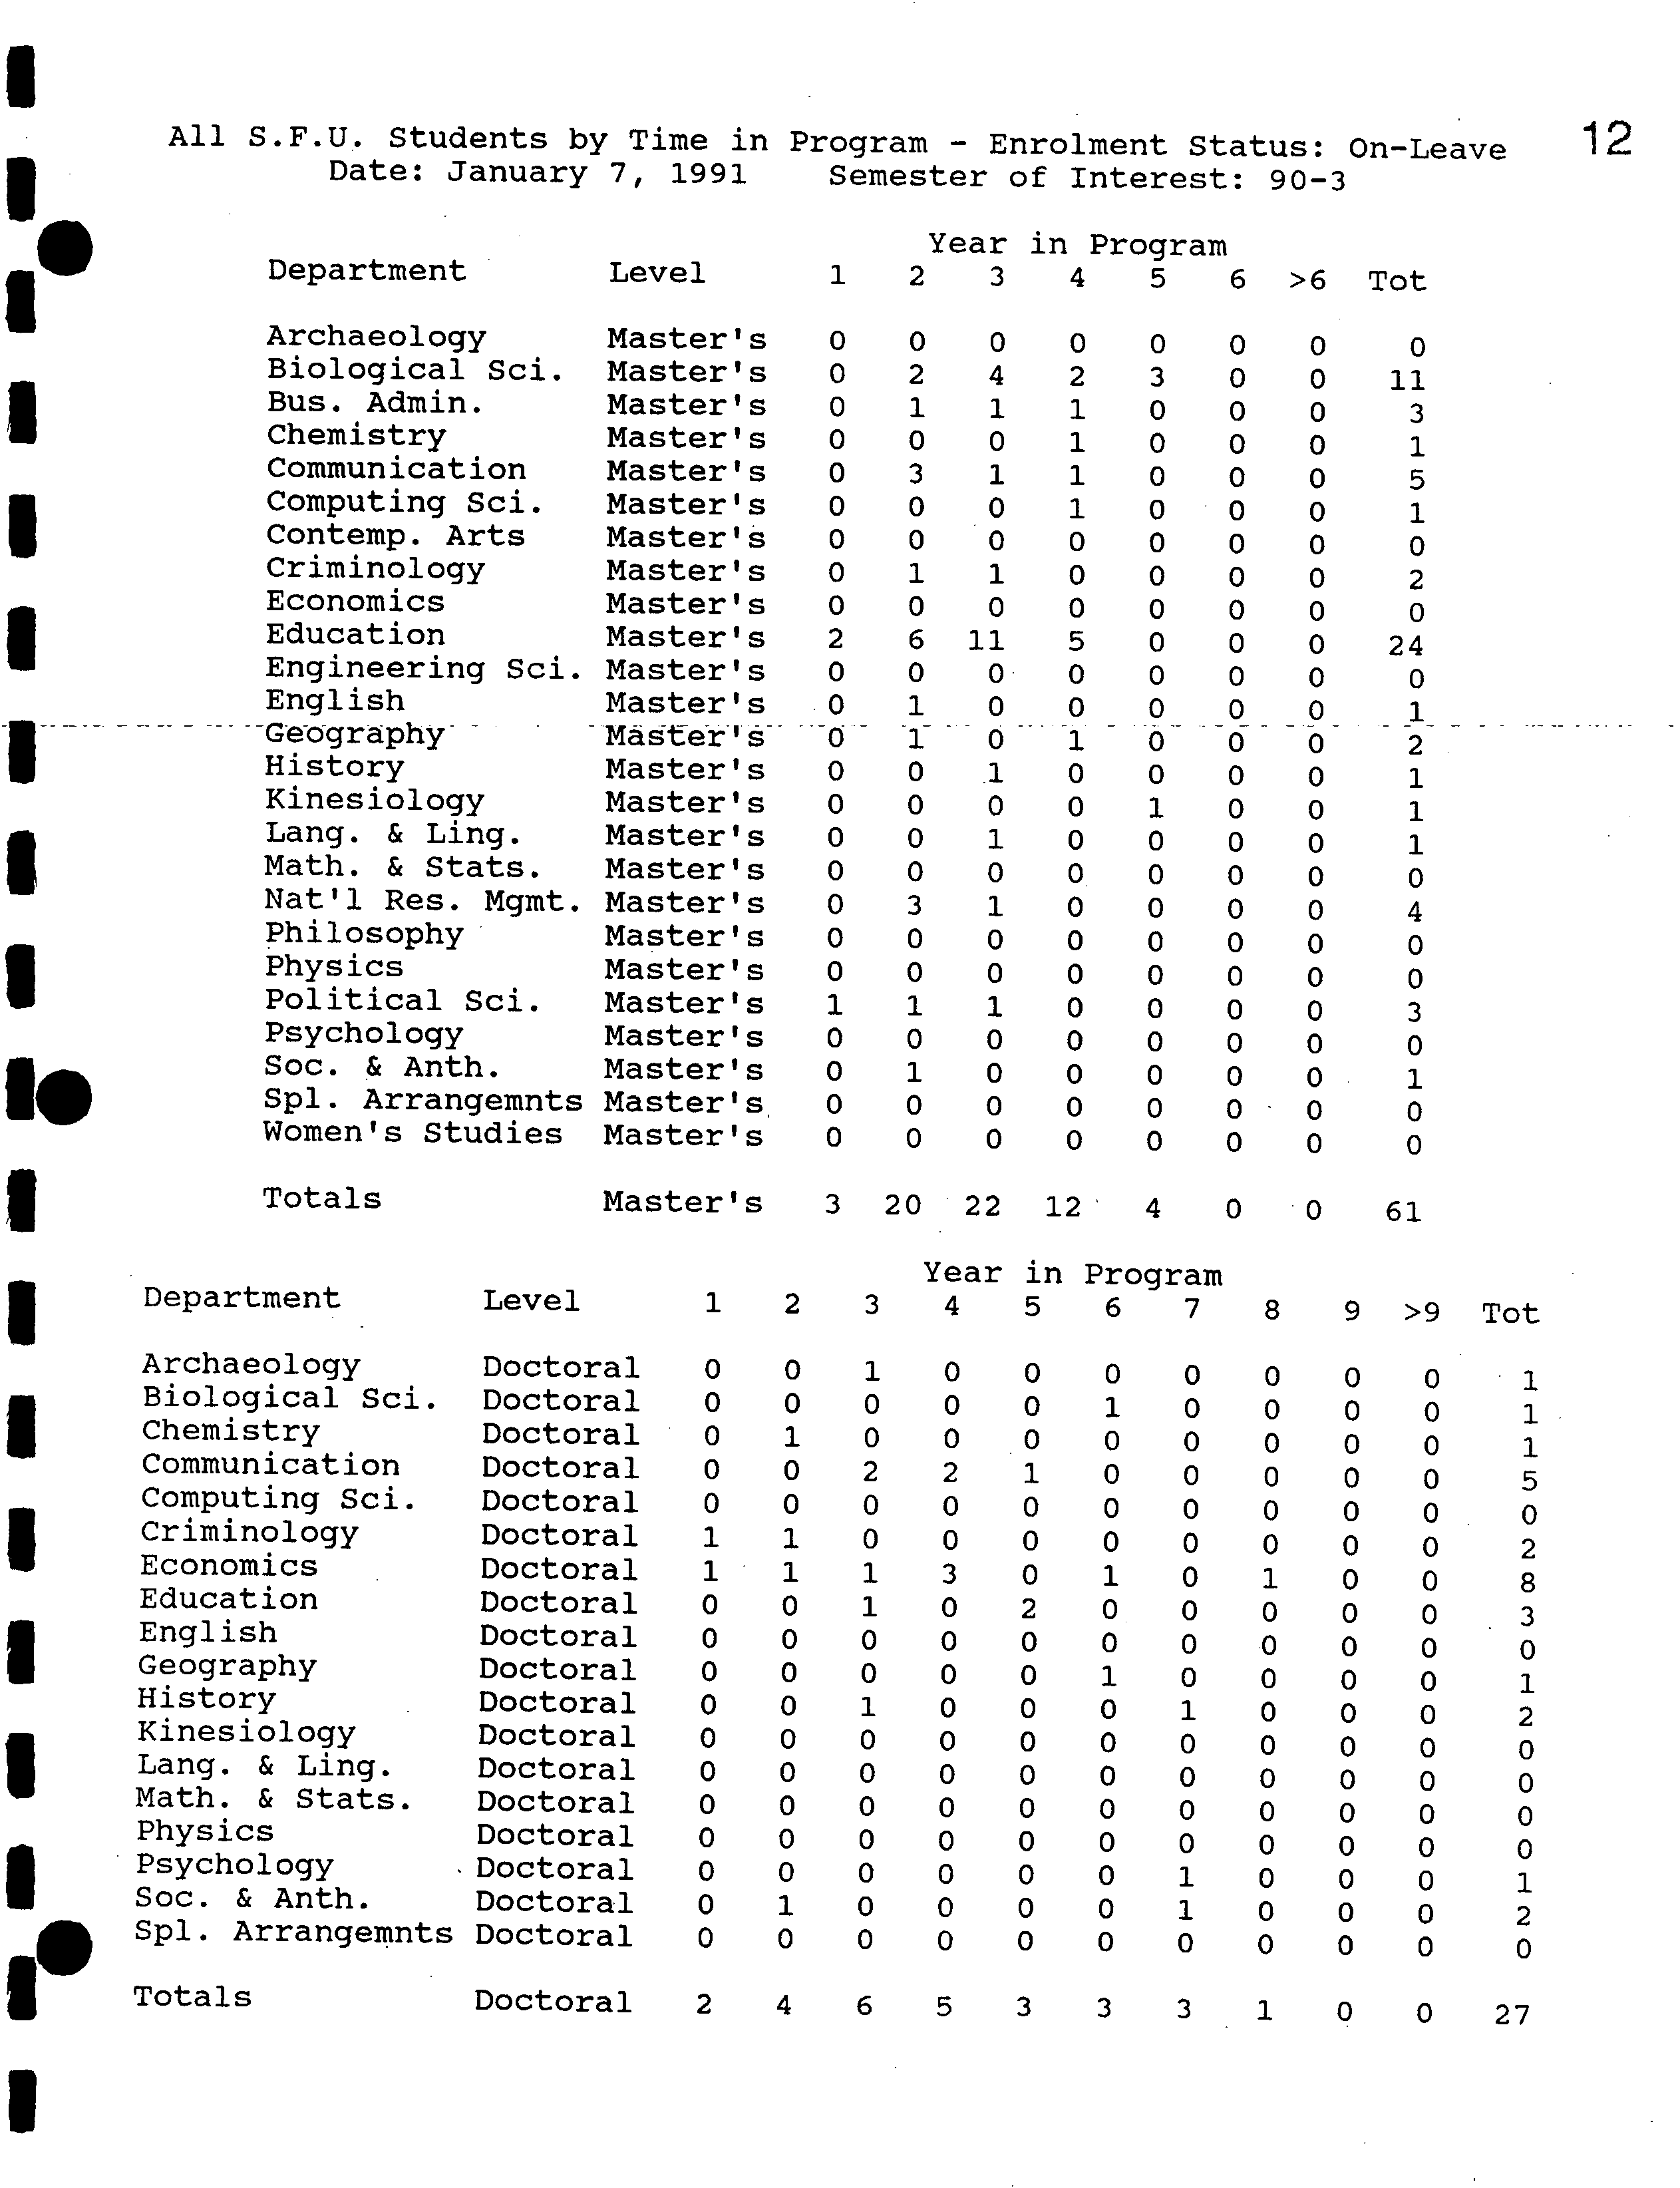
All S.F.U. Students by Time in
Program
- Enrolment
Status:
On-Leave ?
12
Date: January 7, 1991
Semester
of
Interest:
90-3
S
Year
in
Program
I
Department
Level
1
2
3
4
5
6
>6
Tot
ArchaeologyBiological
Sci.
?
?
Master'sMaster's
00
2
0
40
2
0
3
0
00
00
11
0
'
'
Computing
CommunicationChemistry
Bus. Admin.
?
Sci.
???
Master'sMaster'sMaster'sMaster's
000
0
3
001
0
101
11
1
1
0
0
00
00
00
000
0
5
1
1
3
EconomicsCriminologyContemp. ?
Arts
??
Master'sMaster'sMaster's
000
01
0
0
01
0
0
0
0
0
0
000
0
0
0
0
2
0
I
EnglishEngineering
Education
??
Sci. Master'sMaster'sMaster's
00
2
01
6
11
0
0
050
0
00
-
00
00
24
0
-
I
----------------
Gography-
?
Master'sO
- 1 -
0
-
1
0
0
0
2
HistoryLang.
Kinesiology&
?
Ling.
??
Master'sMaster'sMaster's
00
0
00
0
.1
0
1
000
0
01
0
00
000
1
1
1
I
I
Math.
Nat'l
PsychologyPhysicsPhilosophyPolitical
&
&
Res.
?
Anth.
Stats.Sci.
??
Mgmt.
???
Master'sMaster'sMaster'sMaster'sMaster'sMaster'sMaster's
0
0
00
0
10
0
10
0
3
10
0000
011
0
0
00
0
00
0
00000
0
0000
0
00
00
0
000
0
4
0
1
3
0
0
0
IS
Soc.
Women's
Spi. Arrangemnts
Studies
?
Master'sMaster's
0
0
0
0
00
00
0
0
00
0
0
0
0
Totals ?
Master's
3
20
22
12
4
0
0
61
Year
in
Program
Department ?
Level ?
1
2
3
4
5
6
7
8
9
>9
Tot
ArchaeologyBiological
Sci.
?
?
DoctoralDoctoral
??
00
0
0
01
00
0
0
10
00
0
0
0
0
0
0
1
1
I
Computing
ChemistryCommunication ?
Sci.
??
DoctoralDoctoralDoctoral ???
0
0
0
001
2
0
0
2
00
0
1
0
0
0
0
00
0
000
000
0
00
5
0
1
I
EducationEconomicsCriminology
??
DoctoralDoctoralDoctoral ???
01
1
0
1
1
101
0
3
0
2
00
0
10
00
0
0
0
1
000
0
0
0
8
3
2
I
I
I
Math.
Soc.
Spl.
PhysicsPsychologyHistoryLang.
KinesiologyGeographyEnglish&
Arrangemnts
&
&
Anth.
???
Stats.Ling.
??????
DoctoralDoctoralDoctoralDoctoralDoctoralDoctoralDoctoralDoctoralDoctoralDoctoral
??????????
0
0
0000000
0
0
00
1
000000
0
00
0
00
01
0
0
000000000
0
0000000000
0000000010
0
1
0
01
0
0100
00
0
0
0
0
0
0
00
000
0
0
0
0
000
0
0
0
0000000
0
2
1
0
0
0
2
0
0
1
Totals ?
Doctoral
?
2
4 6
5 3
3
3
1
0
0
27
A
V
2•
001 IN,
PWaWa1
'WV V V V V V V
4
iV
•
a
V
a
'V
a
WV
a £
V
a
'V
a
'V
a
V
a
-
a
'V
a
'V
a
V
a
'V
a a
- -,
a
•
*
-
*
V
*
V
*
V
* *
-
'V'V
* *
'VVW
* * *
'V
* *
V
*
V
**
'V
a. a
V V
*
'V
4
V V,VW
'V
V V,âV V V V*V*V 'VAVVaVA,.'V '
•
•
VW'V'VVWVw
'V WV
'V 'VVVV'V'V WV'
*************a**a aa*a*a
FV
*********à****a
'V
V V V V V
'V
V V V WV V V
*******4
V V V
'V 'V V
•I
13
•1
Simon Fraser University
Weighted Cumulative Grade Point Average
Fall 1990
Bus. Admin.?
Economics ?
Geography ?
Computing Science
?
Philosophy
?
Nat'l Resource Mgmt.
?
Chemistry ?
Political Science
?
Physics
-
?
Engineering Science
Q) ?
Biol. Sciences
Spi. Arrangements
Cz ?
History
Lang. & Ling.
O ?
English
Kinesiology
Education
Women's Studies
Math. & Stats,
Criminology
Psychology
Archaeology
Communications
Soc. & Anth.
3.4 ?
Grade
3.5
?
Point
3.6 ?
Average
3.7 ?
3.8 ?
I
14
. ?
Simon
Fraser University
Graduate Cumulative Grade Point
Averages as
of the
End of
Semester 902
I ?
All Students
November 22,
1990
# of
CGPA
CGPA
CGPA
CGPA
CGPA
CGPA
1
.
Department
Stu.
25%
20%
10%
Aver.
Med.
Wted.
Archaeology
31
4.00
4.00
4.00
3.78
3.83
3.76
I
' ?
Contemporary
CriminologyCommunications
Computing
Business
ChemistryBiological
Administration
Science
SciencesArts
--
13355
61645542
0
3.934.003.673.833.673.89
no students
3.954.003.893.673.833.91
4.004.004.004.003.834.00
meet
.3733..8.O3..74
search
3.753.503.533.583.68
3.613.783.473.623.75criteria
3.55
3.76
3.45
3.57
3.68
'
I
---------------
Engineering
English
Econö]njcs
Education
Science
319
185062
3.923.833.753.89
3.833.923.793.93
4.004.004.003.91
3.673.713.533.72
3.753.673.523.75
3.67
3.70
3.48
3.71
I
I
I
?
.
, ?
Mathematics
Philosophy
Physics
Nat'l
KinesiologyLanguages
Geography
History,
Resource
&
&
LinguisticsStatisticsManagement
46513519
2630
5
4.003.943.733.913.923.78
3.83
4.003.783.964.003.923.923.83
4.003.854.004.003.944.004.00
3.623.703.553.643.753.693.56
3.443.543.783.673.783.753.56
3.55
3.56
3.73
3.70
3.69
3.51
3.69
41
3.83
4.00
4.00
3.62
3.67
3.64
PsychologyPolitical
Science
2482
3.833.94
3.834.00
4.003.92
3.773.59
3.823.58
3.74
3.61
I
I
?
TotalsWomen's
Special
Sociology
?
StudiesArrangements&
Anthropology
1310
10
21
30
3.89
4.003.804.00
3.93
3.804.004.00
4.00
'4.00
4.004.00
3.67
3.713.793.73
3.72
3.733.833.89
3.65
3.72
3.68
3.78
I
If
15
I
Simon Fraser University
Graduate Cumulative Grade Point Averages as of the End of Semester 90-k
Female Students November 22, 1990
# of CGPA CGPA CGPA CGPA CGPA CGPA
Department
?
Stu. ?
25%
?
20% ?
10% Aver. Med. Wted.
Archaeology
Biological Sciences
Business Administration
Chemistry
Communications
Computing Science
Contemporary Arts
Criminology
Economics
Education
Engineering Science
English
Geography
History
Kinesiology
Languages & Linguistics
Mathematics & Statistics
Nat'l Resource Management
Philosophy
Physics
Political Science
Psychology
Sociology & Anthropology
Special Arrangements
Women's Studies
16 4.00
45 3.89
11 3.67
15 3.92
32 3.93
8 3.67
0 no
29 3.92
10 3.83
194 3.89
1 3.33
29 4.00
8 3.67
13 3.83
16 4.00
12 3.83
8 3.78
19 3.73
4 4.00
5 4.00
9 3.83
50 4.00
10 4.00
19 3.90
10 3.80
4.00
3.89
3.79
4.00
4.00
3.67
studen
3.93
3.83
3.93
3.33
4.00
3.67
3.83
4.00
3.92
3.78
3.75
4.00
4.00
3.83
4.00
4.00
3.94
3.80
4.00
3.94
3.87
4.00
4.00
3.72
bs meet
4.00
4.00
4.00
3.33
4.00
3.83
4.00
4.00
4.00
3.89
3.79
4.00
4.00
3.83
4.00
4.00
4.00
4.00
3.87 3.85 3.86
3.67 3.77 3.72
3.62 3.67 3.61
3.62 3.67 3.64
3.73 3.75 3.75
3.51 3.61 3.56
search criteria
3.75 3.80 3.76
3.69 3.66 3.64
3.71 3.72 3.70
3.33 ?
3.33 ?
3.33
3.70 3.67 3.69
3.52 3.45 3.45
3.73 3.75 3.73
3.84 3.83 3.80
3.60 3.53 3.62
3.65 3.67 3.67
3.57 3.54 3.59
3.69 3.44 3.63
3.71 3.67 3.66
3.60 3.58 3.65
3.79 3.83 3.77
3.85 3.75 3.86
3.63 3.75 3.59
3.71 3.73 3.72
•1
Totals
?
573 3.92 3.94 4.00 3.70 3.75 3.70
I
•I
1
16
ISimon Fraser
University
Graduate Cumulative Grade Point
Averages
as of the
End of
Semester
90-2
Male Students
November
22,
1990
# of
CGPA
CGPA
CGPA
CGPA
CGPA
CGPA
I
Department
Stu.
25% 20%
10%
Aver.
Med. Wted.
Archaeology
15
4.00 4.00
4.00
3.68 3.72
3.66
Biological Sciences
88
3.90
3.92
4.00
3.68
3.75
3.66
I
Business Administration
53
3.63
3.67
3.83
3.48
3.46 3.43
Chemistry
27 3.67
3.67
3.67
3.56
3.57
3.54
Communications
29
4.00 4.00
4.00
3.76 3.83
3.77
I
Computing Science
47 3.83
3.94
4.00
3.53
3.67
3.55
Contemporary Arts
0
no
students meet
search criteria
Criminology
26 4.00
4.00
4.00
3.71 3.77
3.71
----------------
Economics ?
- ?
----------
- 52---•-3 .-7-2
-3;75--3.8-5
- -3-.-4-9 - -3-.49
-
--3-.-46
J
Education
125
3.90
3.93
4.00
3.73 3.80 3.73
Engineering Science
17
3.83 4.00
4.00
3.73 3.75
3.70
English
21 3.83
3.83
3.92
3.64 3.67
3.70
Geography
22
3.78 3.85
4.00
3.57 3.56
3.54
I
History
13
3.83
3.83
4.00 3.65
3.75 3.65
Kinesiology
19 3.87
3.89
4.00
3.67 3.73
3.62
Languages & Linguistics
7 3.91
3.93
3.93
3.71 3.83
3.77
I
Mathematics & Statistics
43
3.95 3.96
4.00
3.71 3.78
3.74
Philosophy,
Nat'l Resource Management
27
1 3.333.72
3.333.79
3.333.85
3.333.54
3.333.57 3.33
3.54
Physics
36
3.83
4.00 4.00
3.60 3.67
3.64
I
Political Science
15
3.83 3.92
3.92
3.59
3.67 3.60
Psychology
32 3.86
3.91
3.96
3.74
3.75
3.71
Sociology & Anthropology
11
3.89 4.00
4.00
3.74
3.83 3.71
I
Special Arrangements
11
4.00 4.00
4.00
3.90
4.00 3.87
Women's Studies
0
no students
meet
search
criteria
Totals
737
3.89
3.92
4.00
3.65 3.67
3.62
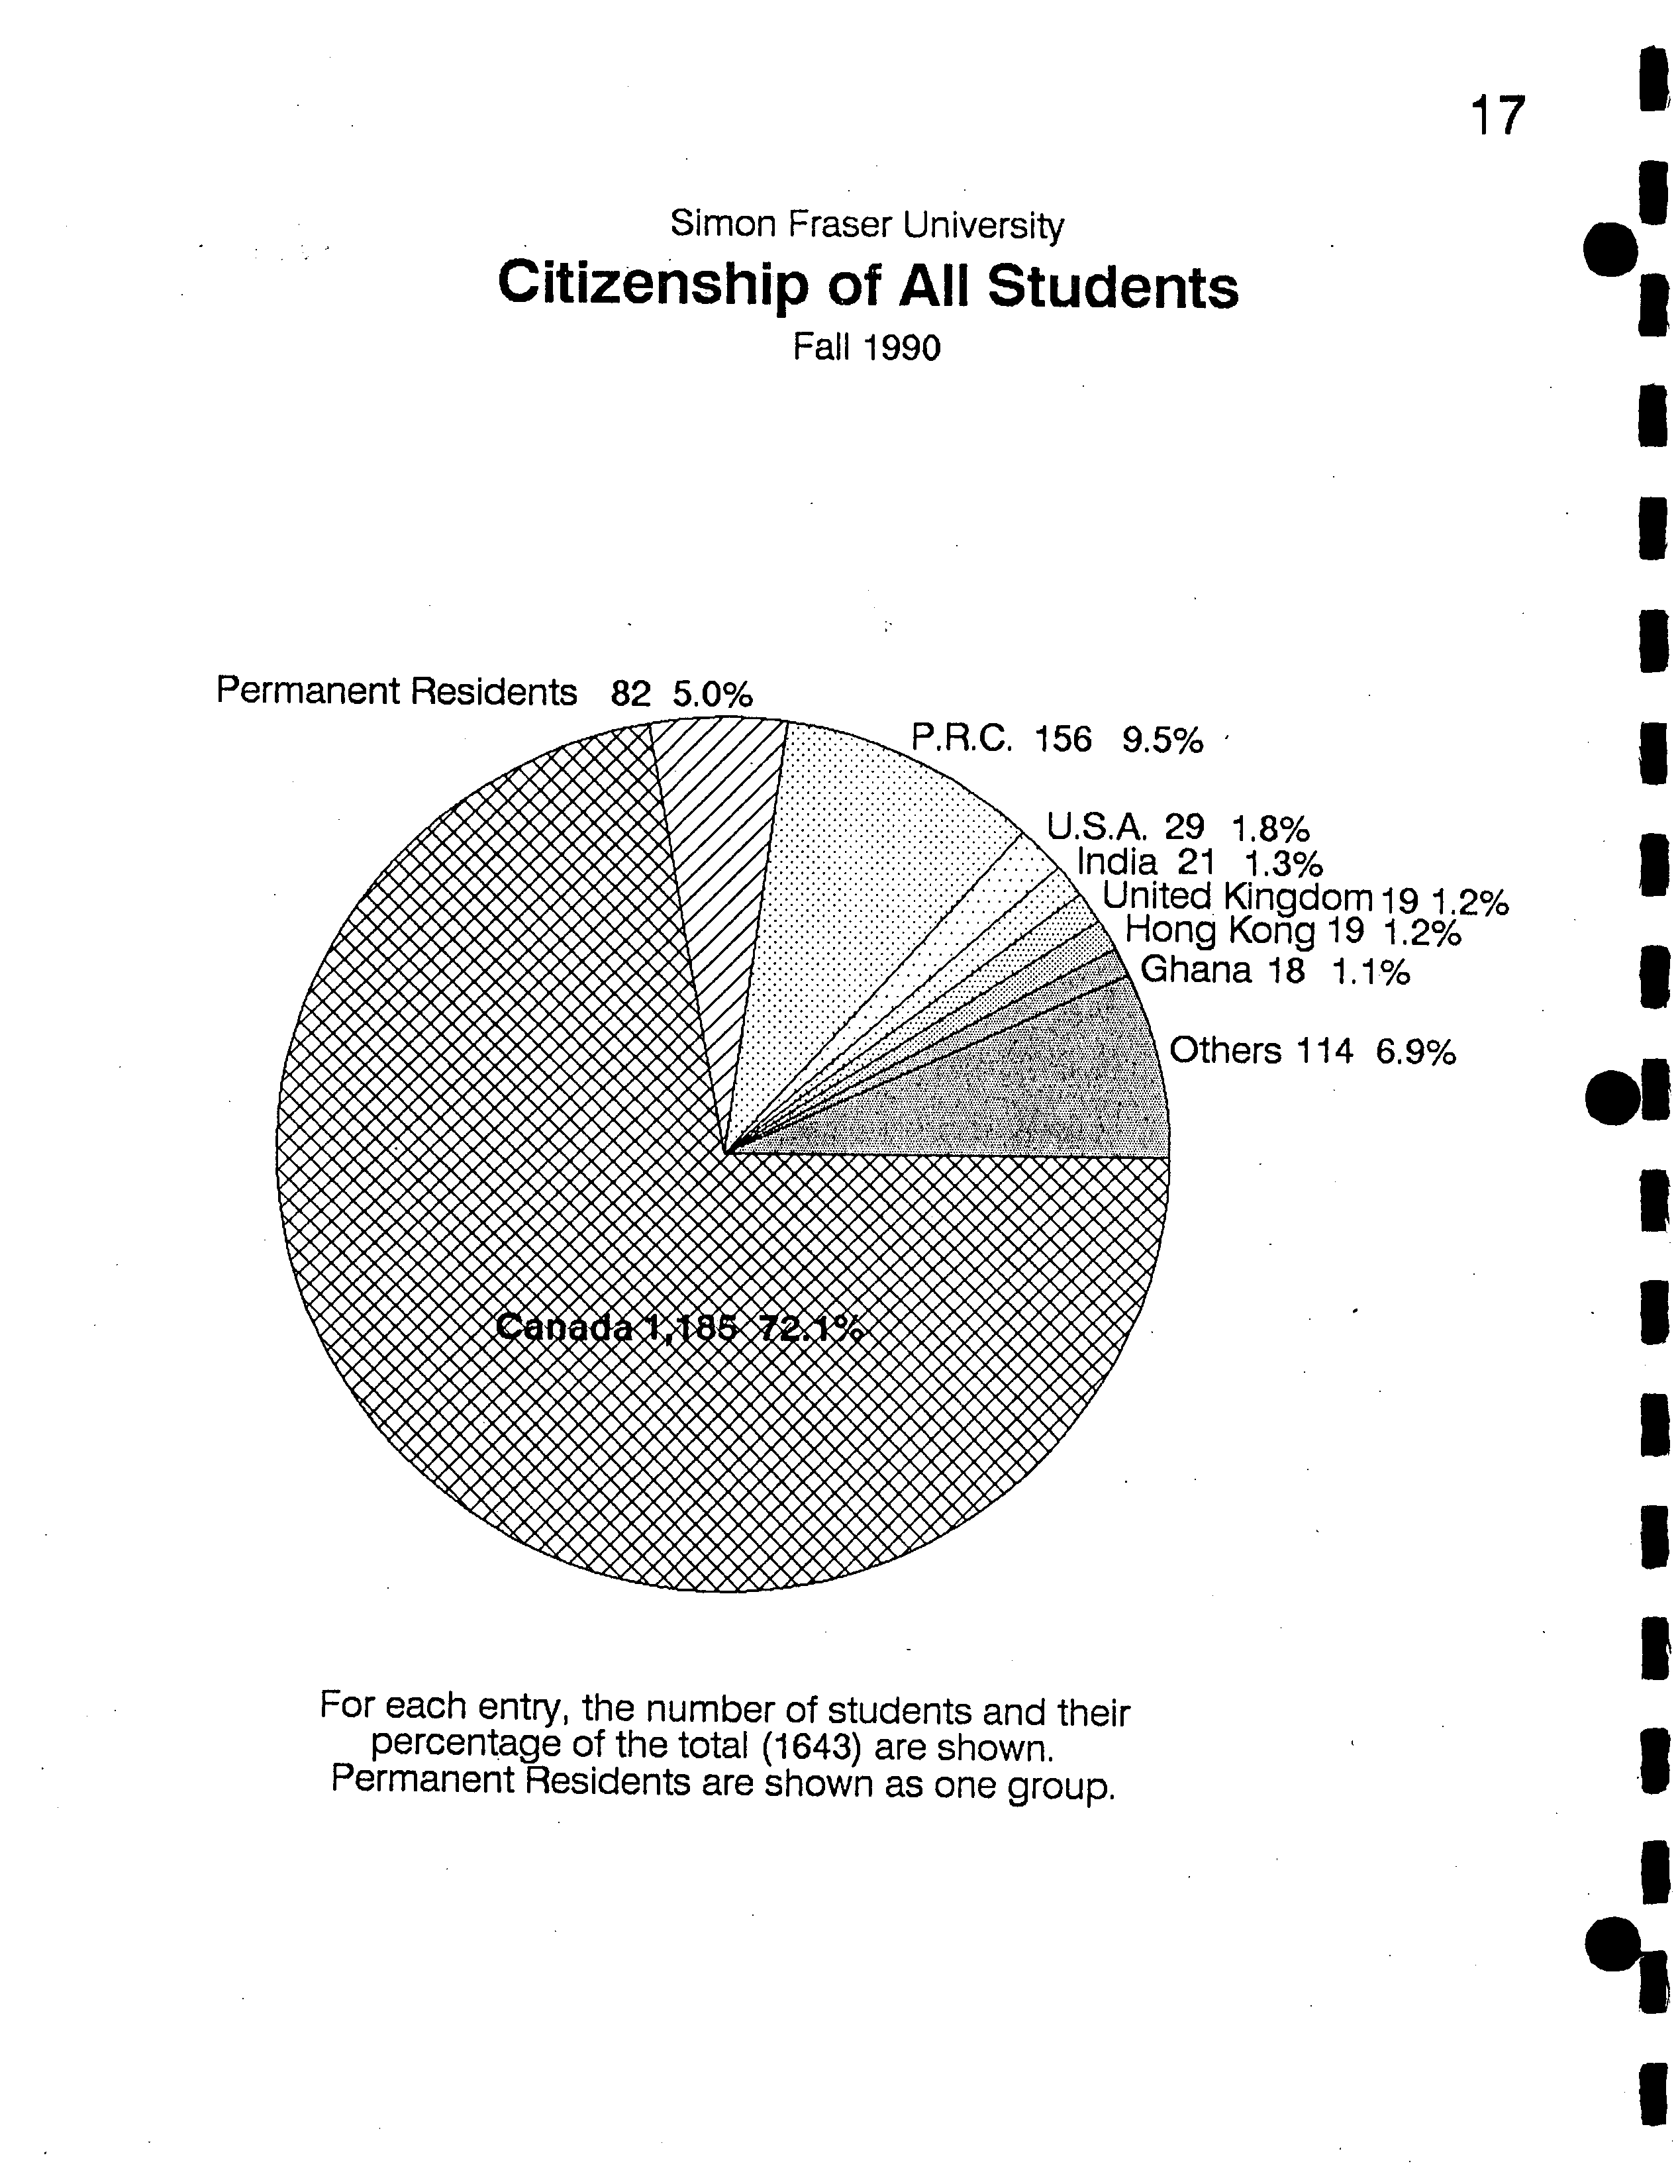
29 1.8%
21 1.3%
ed Kingdom 19 1.2%
ng Kong 19 1.2%
hana 18 1.1%
Others 114 6.9%
Simon Fraser University
Citizenship of All Students
Fall 1990
Permanent Residents 82 5.0%
17
For each entry, the number of students and their
?
percentage of the total (1643) are shown.
?
Permanent Residents are shown as one group.
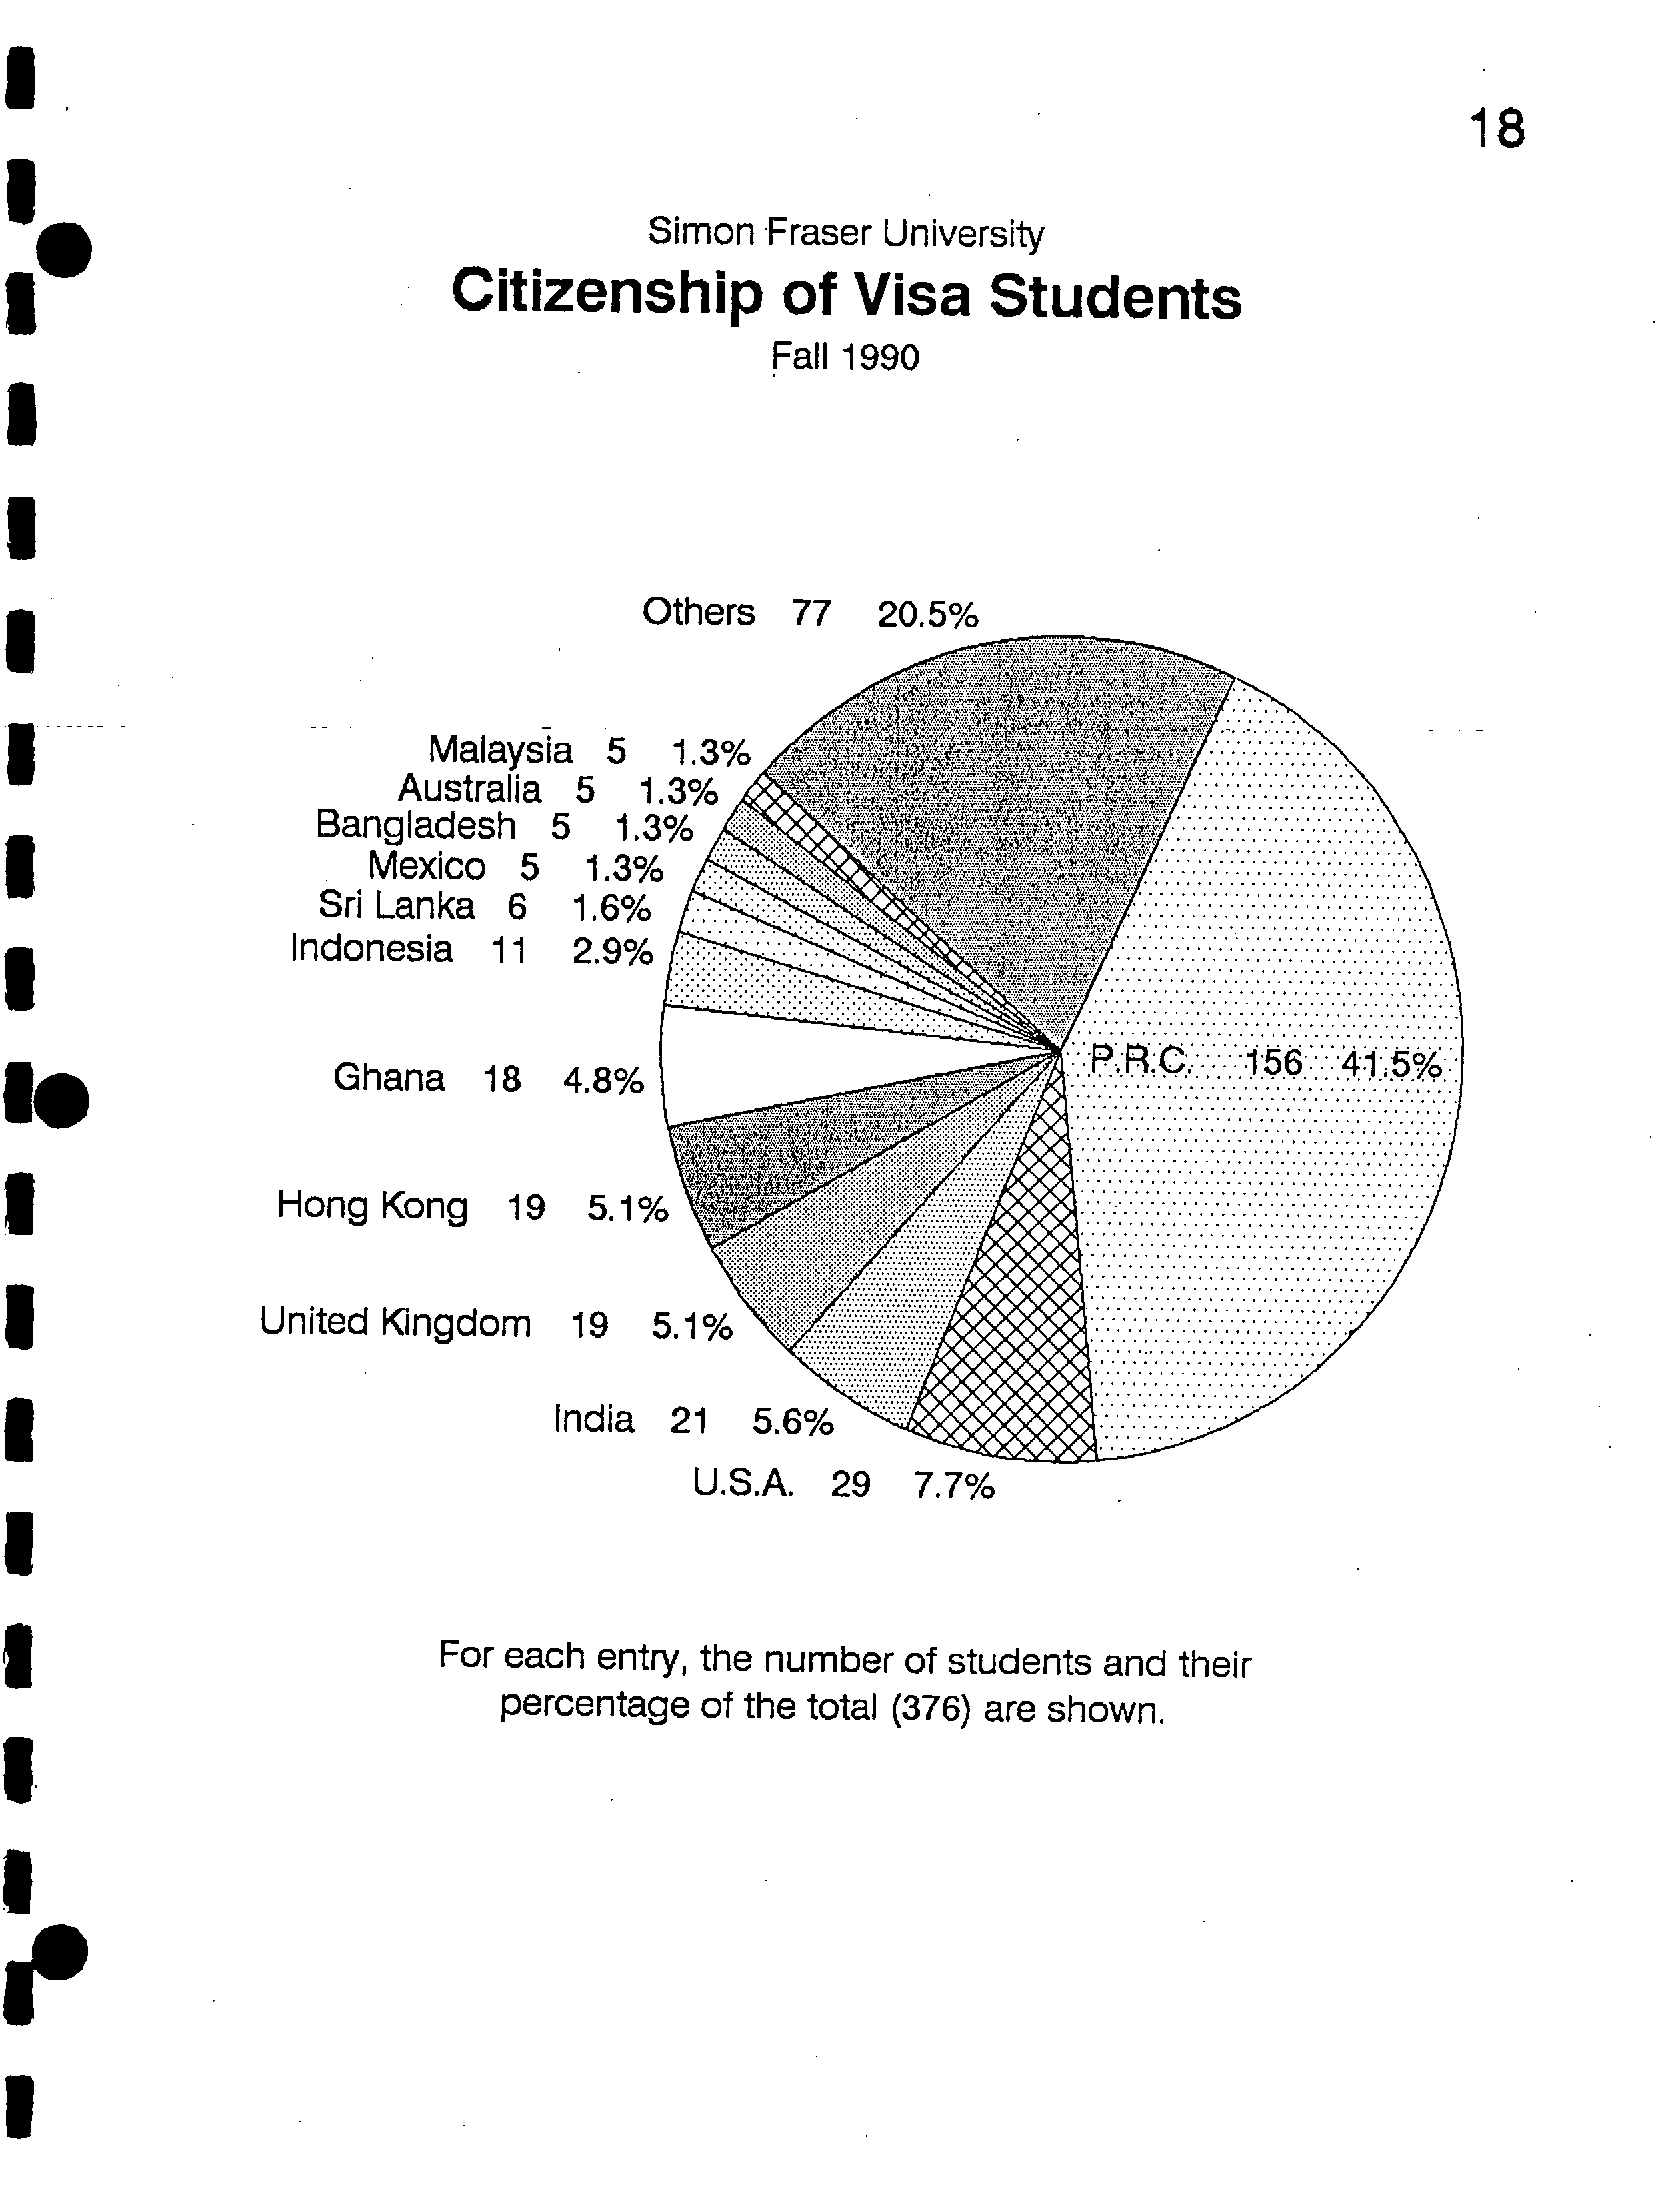
18
Simon Fraser University
I
?
Citizenship of Visa Students
Fall 1990
I
For each entry, the number of students and their
?
percentage of the total (376) are shown.
I.
Argentina
Australia
Bangladesh
Brazil
Brunei
Canada (incl. all Perm. Res.)
Chile
Costa Rica
Cuba
Denmark
Egypt
France
Ghana
Greece
Guyana
Hong Kong
Iceland
India
Indonesia
Iran
Iraq
Ireland
Israel
Ivory Coast
Jamaica
Japan
Kenya
Libya
Macao
Malaysia
Mauritius
Mexico
New Guinea
The Netherlands
New Zealand
Nigeria
Norway
Pakistan
Philippines
Poland
Portugal
People's Republic of
Singapore
South Africa
South Korea
Sri Lanka
Sudan
Switzerland
Syria
Taiwan
China
IP ?
I
Simon Fraser University
Citizenship of Current Students, Excluding Permanent Residents ?
November 27, 1990
?
% of ?
Admitted
Country of Citizenship
?
Current Total ?
90-1 -
'
90-3 New Admits
1
0.1
0
0.0
5
0.3
1
0.2
5
0.3
1
0.2
1
0.1
0
0.0
1
0.1
1
0.2
1267
77.1
395
76.8
2
0.1
1
0.2
2
0.1
2
0..4
1
0.1
1
0.2
1
0.1
1
0.2
2
0.1
0
0.0
1
0.1
0
0.0
18
1.1
7
1.4
4
0.2
1
0.2
1
0.1
0
0.0
19
1.2
7
1.4
1
0.1
0
0.0
21
1.3
8
1.6
11
0.7
7
1.4
1
0.1
0
0.0
1
0.1
1
0.2
2
0.1
0
0.0
0.0
I
V
156
9.5
38
7.4
4
0.2
3
0.6
3
0.2
3
0.6
2
0.1
0
0.0
6
0.4
2
0.4
1
0.1
0
0.0
2
0.1
.0
0.0
0
0.0
0
0.0
0
0.0
0
..continued.
I
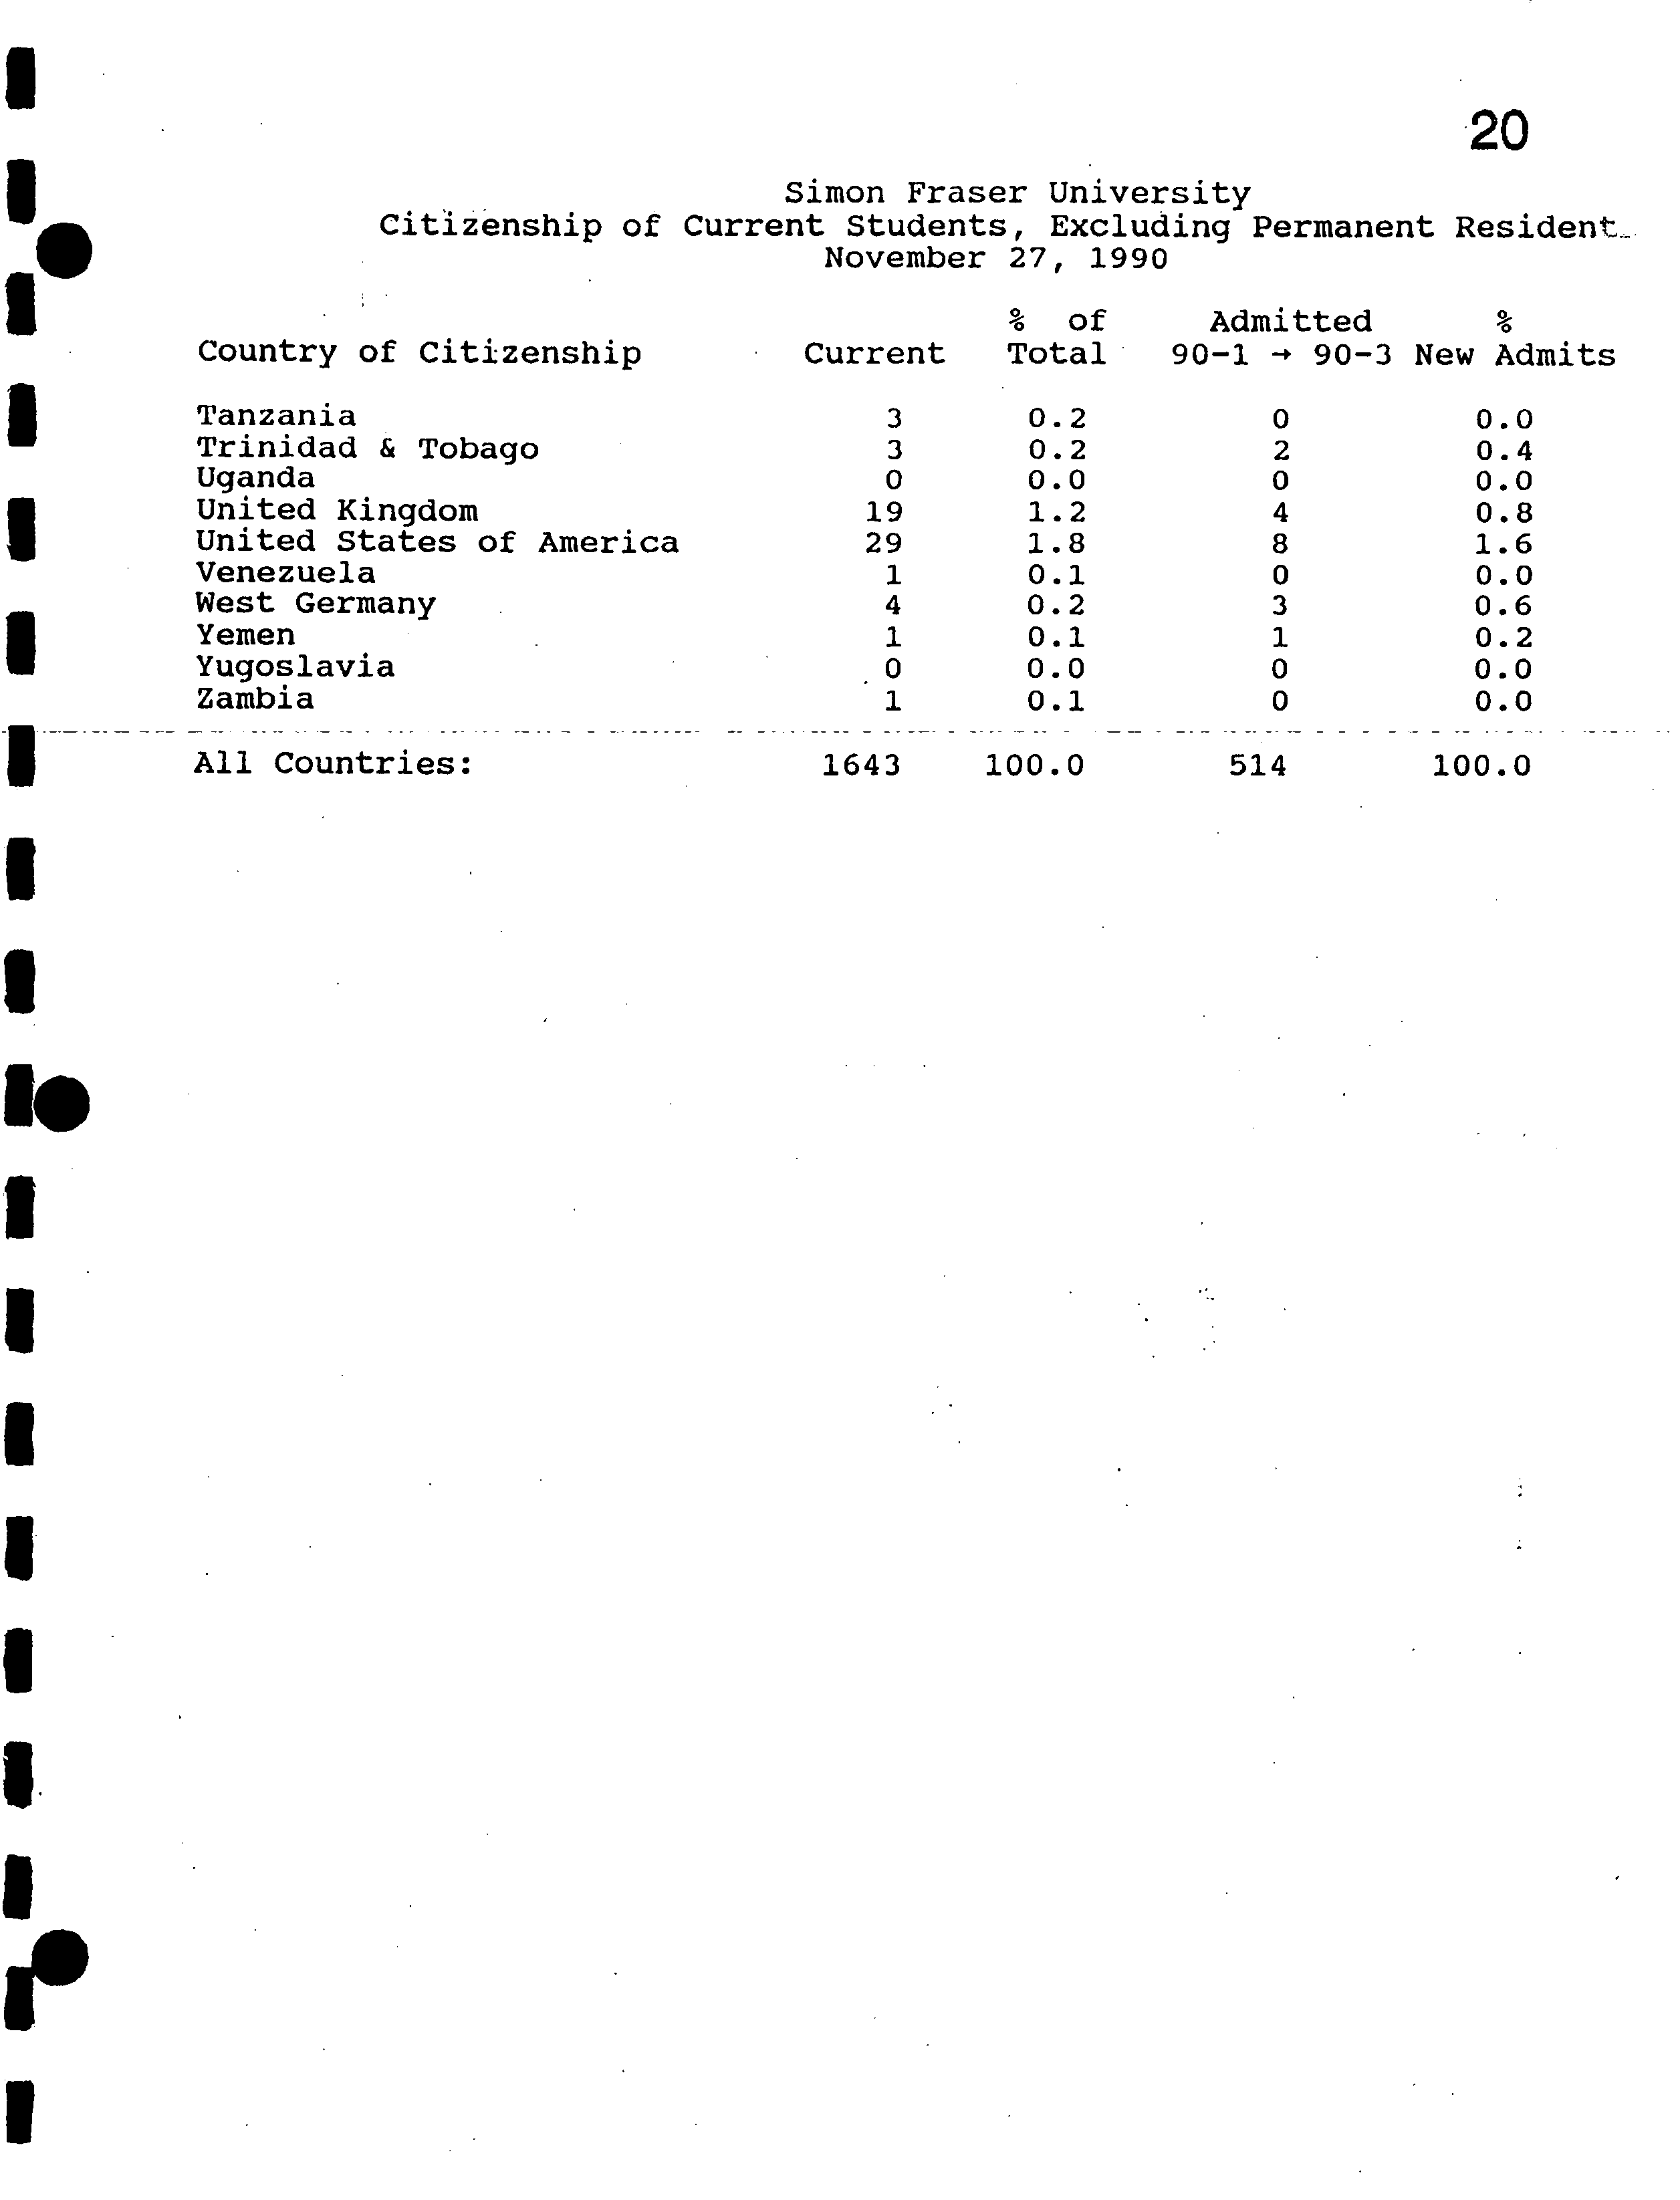
1
Simon Fraser
20
S
University
Citizenship of
Current Students, Excluding
Permanent Resident
•
November 27, ?
1990
I%
of ?
Admitted
Country of Citizenship
Current Total ?
90-1
90-3
New Admits
ITanzania
3
0.2
0
0.0
Trinidad & Tobago
3
0.2
2
0.4
Uganda
0
0.0
0
0.0
United Kingdom
19
1.2
4
0.8
I ?
United States of America
29 1.8
8 1.6
Venezuela
1
0.1
0
0.0
West Germany
4
0.2
3
0.6
Yemen
'
1
0.1
1
0.2
Yugoslavia
0
0.0
0
0.0
Zambia
1
0.1
0
0.0
IAll Countries:
1643 100.0 ?
514
100.0
I.
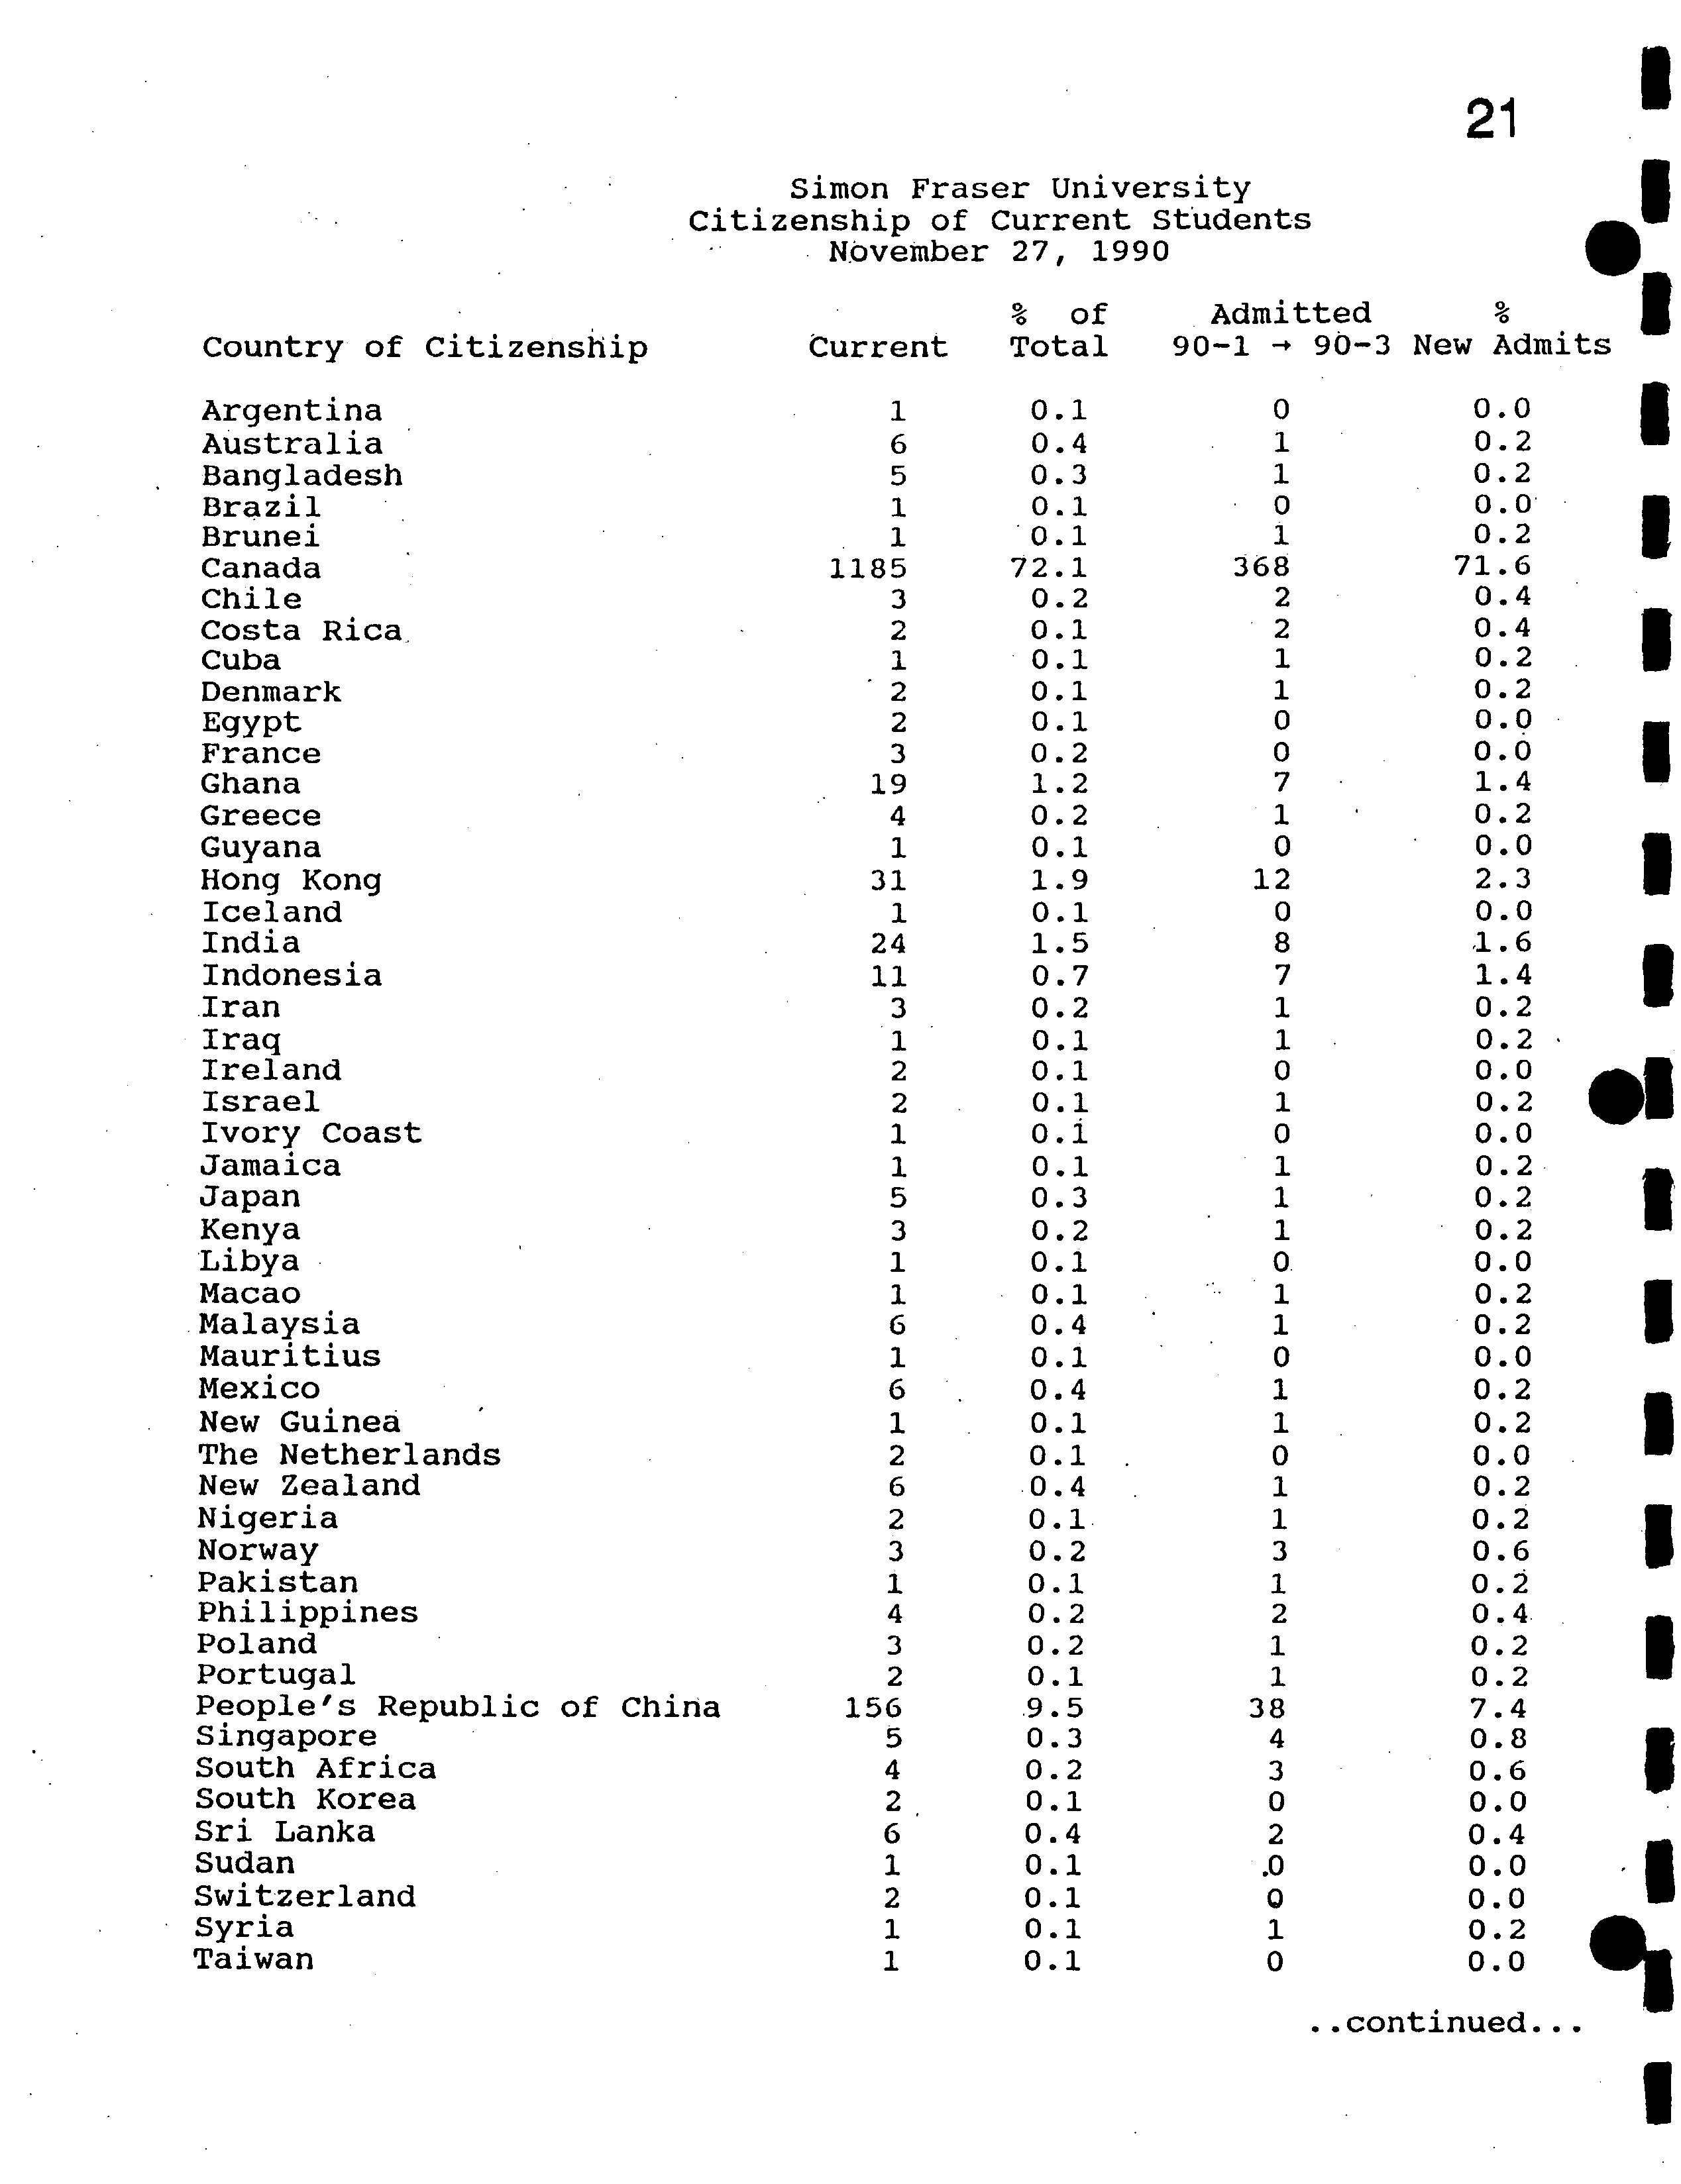
211
Simon Fraser
University
I
Citizenship of
Current
Students
November 27, ?
1990
% ?
of
Admitted
I
Country of Citizenship
Current
Total
90-1 ?
90-3
New Admits
Argentina
1
0.1
0
0.0
Australia
6
0.4
1
0.2
Bangladesh
5
0.3
1
0.2
Brazil
1
0.1
0
0.0
Brunei
1
0.1
1
0.2
Canada
1185
72.1
368
71.6
Chile
3
0.2
2
0.4
Costa Rica.
.
?
2
0.1
2
0.4
Cuba
1
0.1
1
0.2
Denmark
' ?
2
0.1
1
0.2
Egypt
2
0.1
0
0.0
France
. ?
3
0.2
0
0.0
Ghana ?
.
.
?
19
1.2
7
1.4
Greece
4
0.2
1
0.2
Guyana
1
0.1
0
0.0
Hong Kong
31
1.9
12
2.3
Iceland
1
0.1
0
0.0
India
24
1.5
8
1.6
Indonesia
11
0.7
7
1.4
Iran
3
0.2
1
0.2
Iraq
1
0.1 1 ?
. 0.2
Ireland
2
0.1
0
0.0
Israel
2
0.1
1 0.2 ?
lei
Ivory Coast
1
0.1
0
0.0
Jamaica
1
0.1
1
0.2
Japan
5
0.3
1
0.2
Kenya ?
.
3
0.2 1 0.2
Libya
1
0.1
0
0.0
Macao
1
0.1
1
0.2
Malaysia
6
0.4
1
0.2
Mauritius
1
0.1
0
0.0
Mexico
6
0.4
1
0.2
New Guinea
1
?
. 0.1 1 0.2
The Netherlands
2
0.1
0
0.0
New Zealand
6
0.4 ?
.
1
0.2
Nigeria
2
0.1
1
0.2
Norway
3
0.2
3
0.6
Pakistan
1
0.1
1
0.2
Philippines
4
0.2
2
0.4
Poland
3
0.2
1
0.2
Portugal
2
0.1
1
0.2
People's Republic of China
?
156
.9.5
38
7.4
Singapore
5
0.3
4
0.8
South Africa
4
0.2
3
0.6
South Korea
2,
0.1
0
0.0
Sri Lanka
6
0.4
2
0.4
Sudan
1
0.1
.0
0.0
Switzerland
2
0.1
0
0.0
Syria
1
0.1
1
0.2
Taiwan
1
0.1
0
0.0
..continued...
I
1
'
?
22
?
?
Simon Fraser University
Citizenship of Current Students
S
November 27, 1990
•
I
?
?
Country of Citizenship
?
Current Total
% of ?
90-1
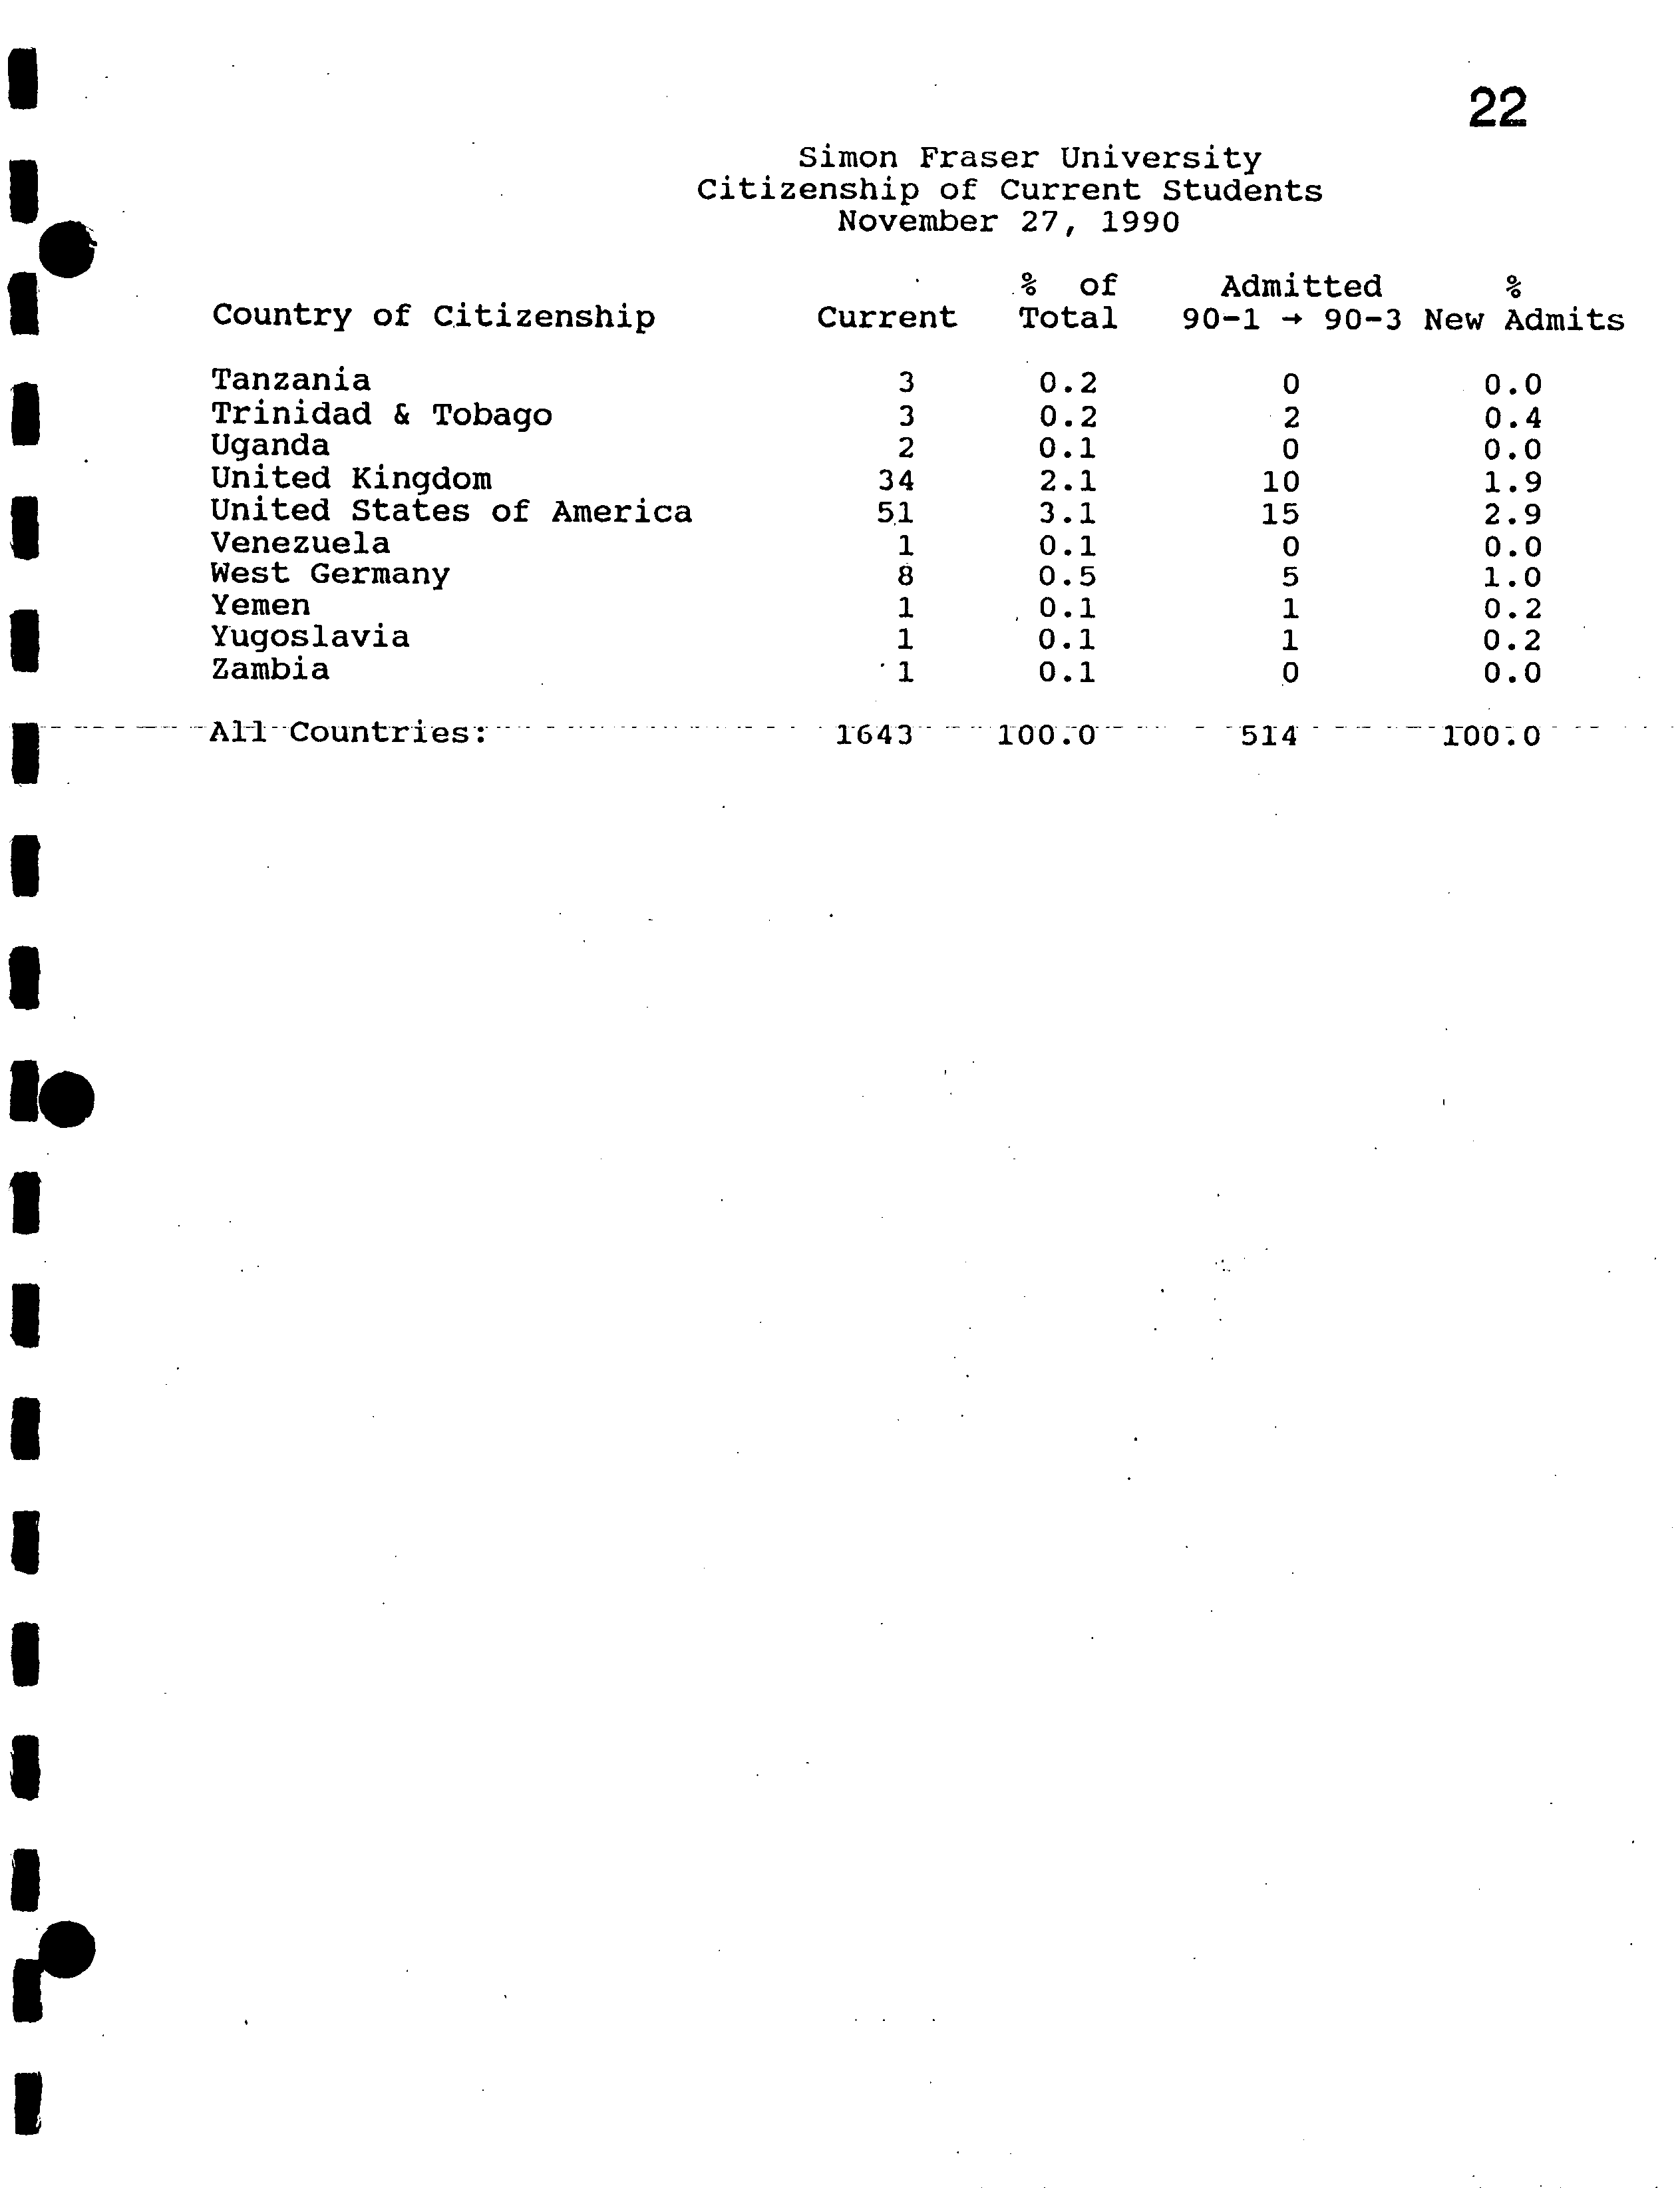
Admitted
- 90-3 New Admits
I ?
Tanzania ?
3 ?
0.2 ?
0 ?
0.0
Trinidad & Tobago
?
3 ?
0.2 ?
2 ?
0.4
Uganda ?
2 ?
0.1 ?
0 ?
0.0
United Kingdom ?
34 ?
2.1 ?
10
?
1.9
I ?
United States of America
?
5,1 ?
3.1 ?
15 ?
2.9
Venezuela ?
1 ?
0.1 ?
0 ?
0.0
West Germany
?
8 ?
0.5 ?
5 ?
1.0
I ?
Yemen ?
1 ?
0.1
?
1 ?
0.2
Yugoslavia ?
1 ?
0.1 ?
1 ?
0.2
Zambia ?
1 ?
0.1 ?
0 ?
0.0
A1iCountries: ?
' ?
'''1:643 ?
I00.0'' 514
-
?
1:00-. 0
10
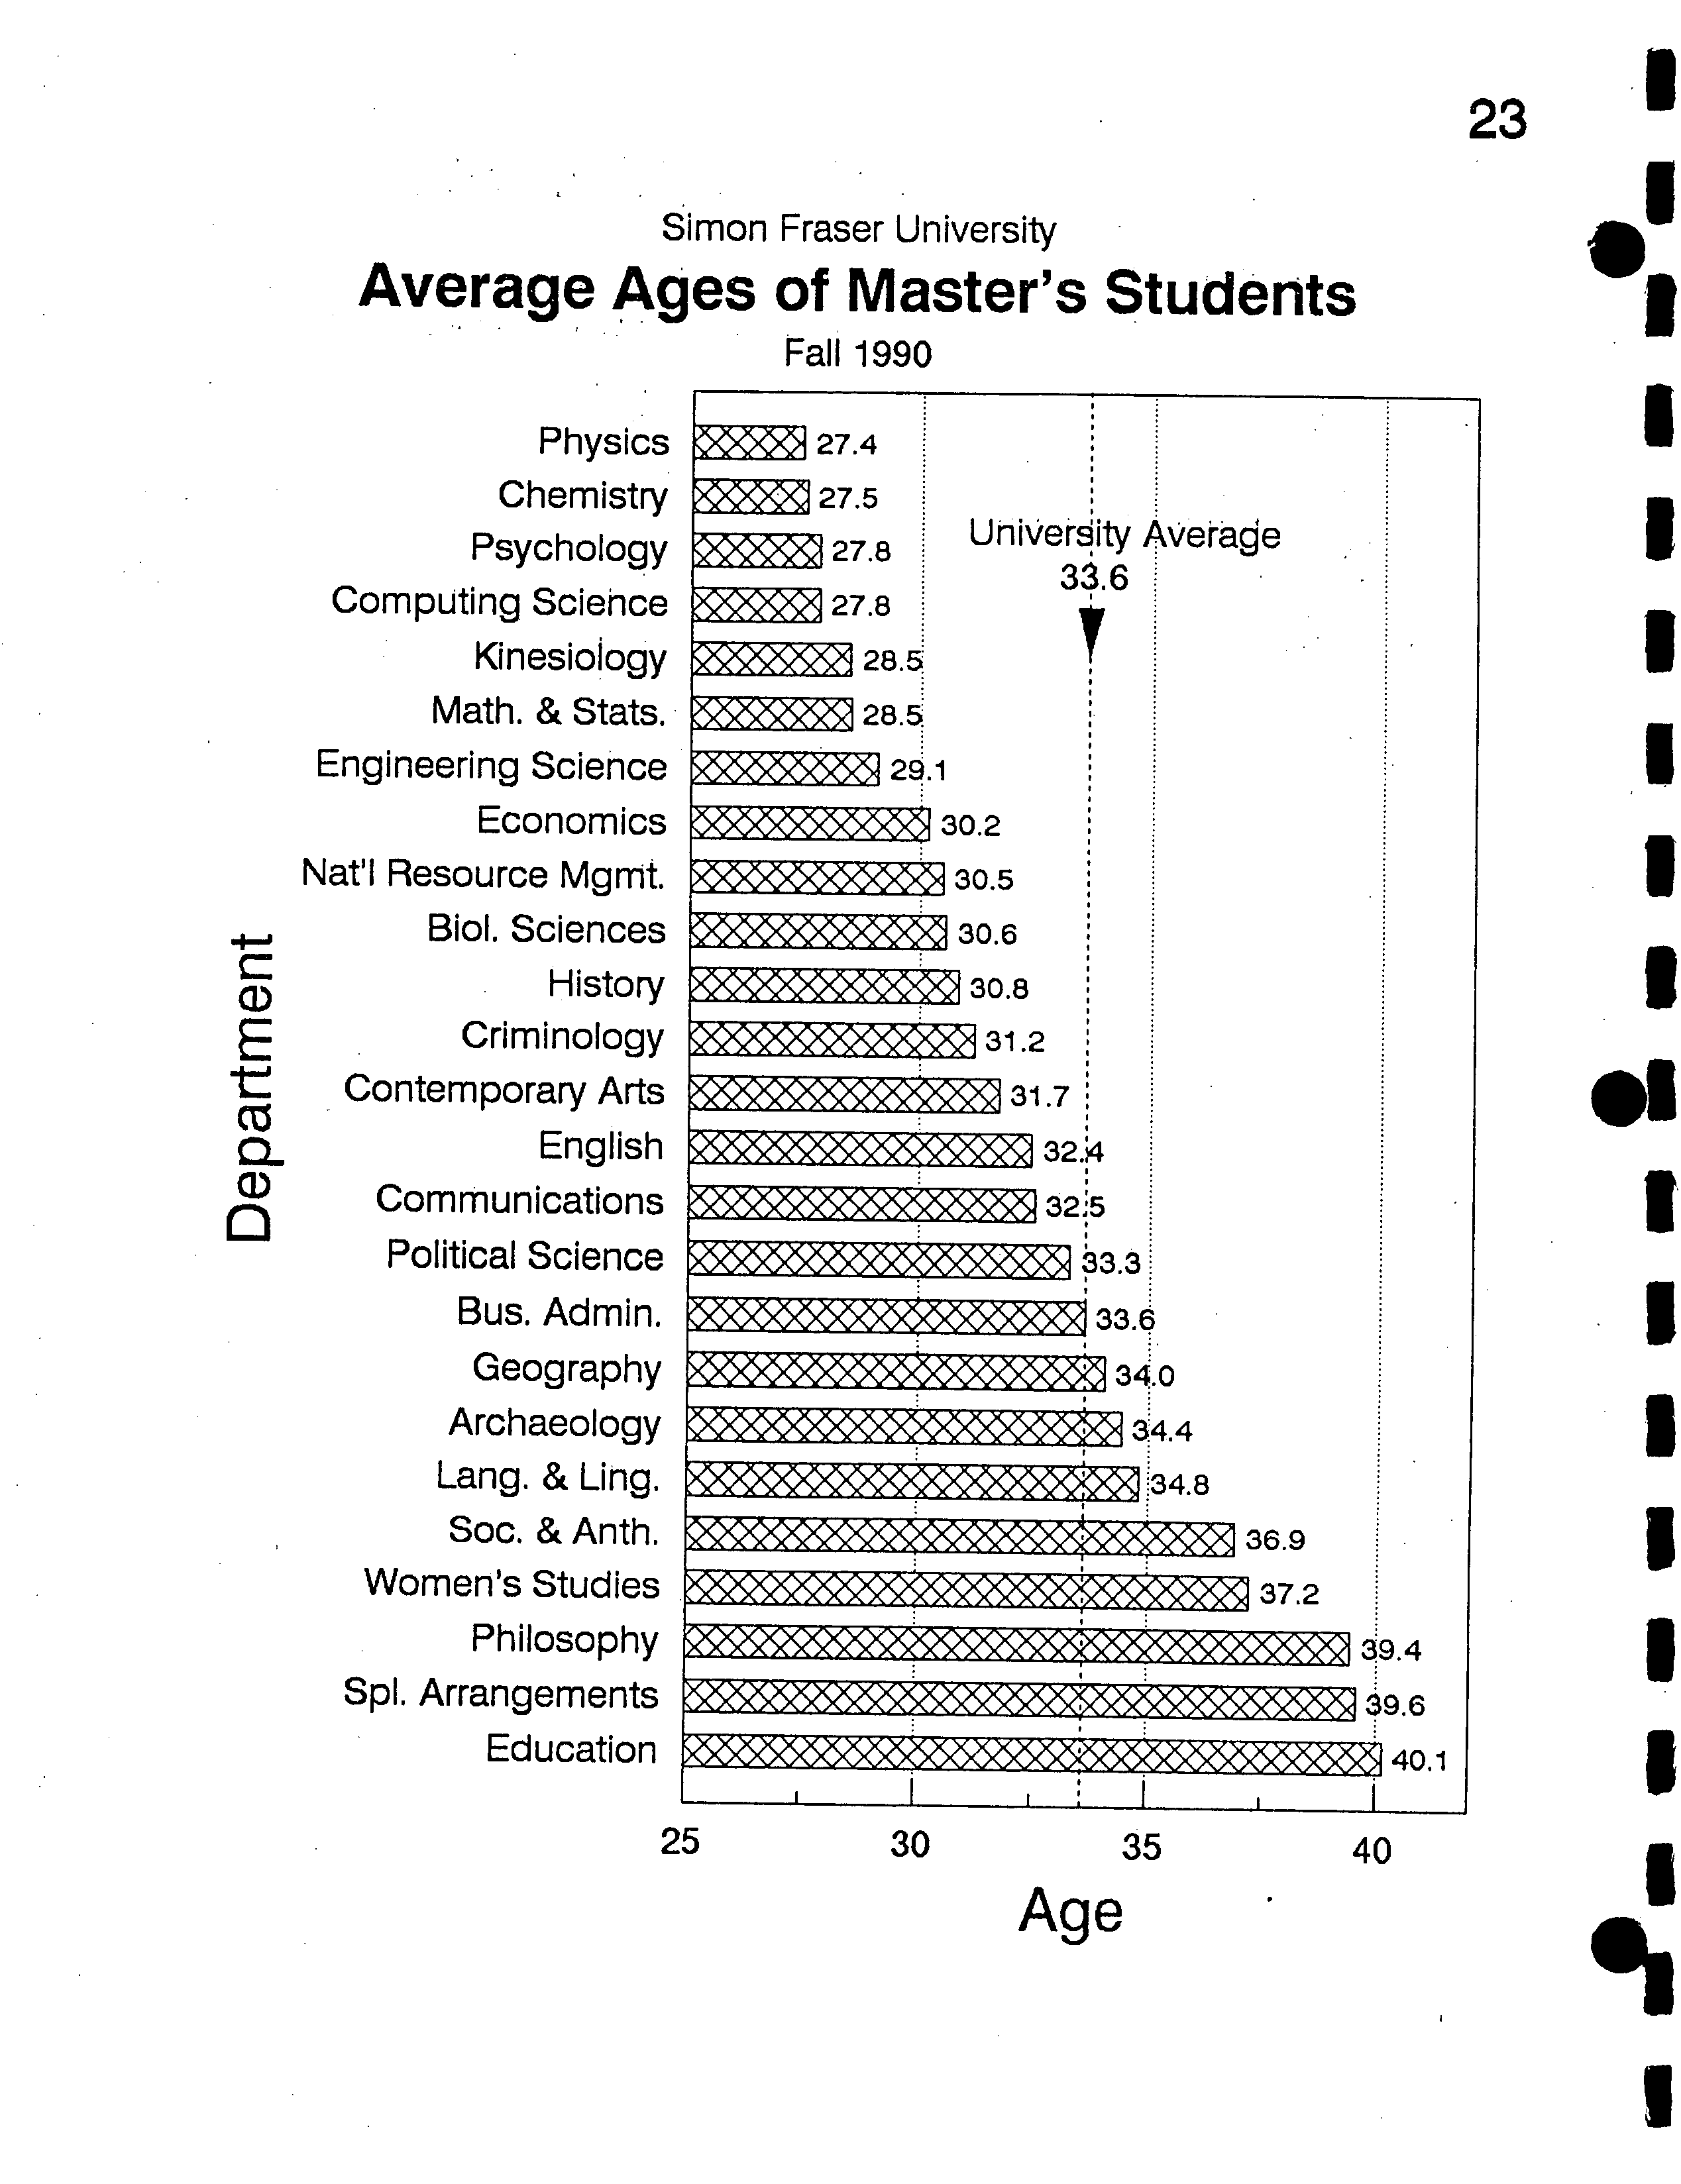
Simon Fraser University
Average Ages of
Master's
Students
Fall 1990
23
Physics
Chemistry
Psychology
Computing Sciehce
Kin esiology
Math. & Stats.
Engineering Science
Economics
Nat'l Resource Mgrnt.
I .
?
Biol. Sciences
History
E
?
Criminology
t Contemporary Arts
CL ?
English
Communications
Political Science
Bus. Admin.
Geography
Archaeology
Lang. & Ling.
Soc. & Anth.
Women's Studies
Philosophy
Spi. Arrangements
Education
A
It 27.8
?
gA
33.6
S
S.
P
•
V V
"
News VW'
• a a a
a a a
RA WNRIN
£''VA
1. ?
£ £ £ £ £ £ £ £ £ d
4.
S
36.9
137.2
39.4
39.6
8140.1
25
?
30
?
35
Age
Simon Fraser University
Average Ages of Doctoral Students
Fall 1990
24
Computing Science
Chemistry
Physics
Math. & Stats.
Economics
Kinesiology
Biol. Sciences
Psychology
E
Communications
CL
Geography
Criminology
Lang. & Ling.
Archaeology
Soc. &
Anth.
English
History
SpI. Arrangements
Education
28 30 32 34 36 38 40 42
Age
25
I
Median Ave.
Is
35
29
?
34.4 ?
1
34
26
32
28
28
29
28
40
28
30
31
28
26
33
28
28
44
27
31
27
37
32
35
32
?
33.6
30.5
33.6
27.5
32.5
27.8
31.7
31.2
30.2
40.1
29.. 1
32.4
34.0
30.8
28.4
34.8
28.5
30.5
39.4
27.4
33.3
27.8
39.6
37.2
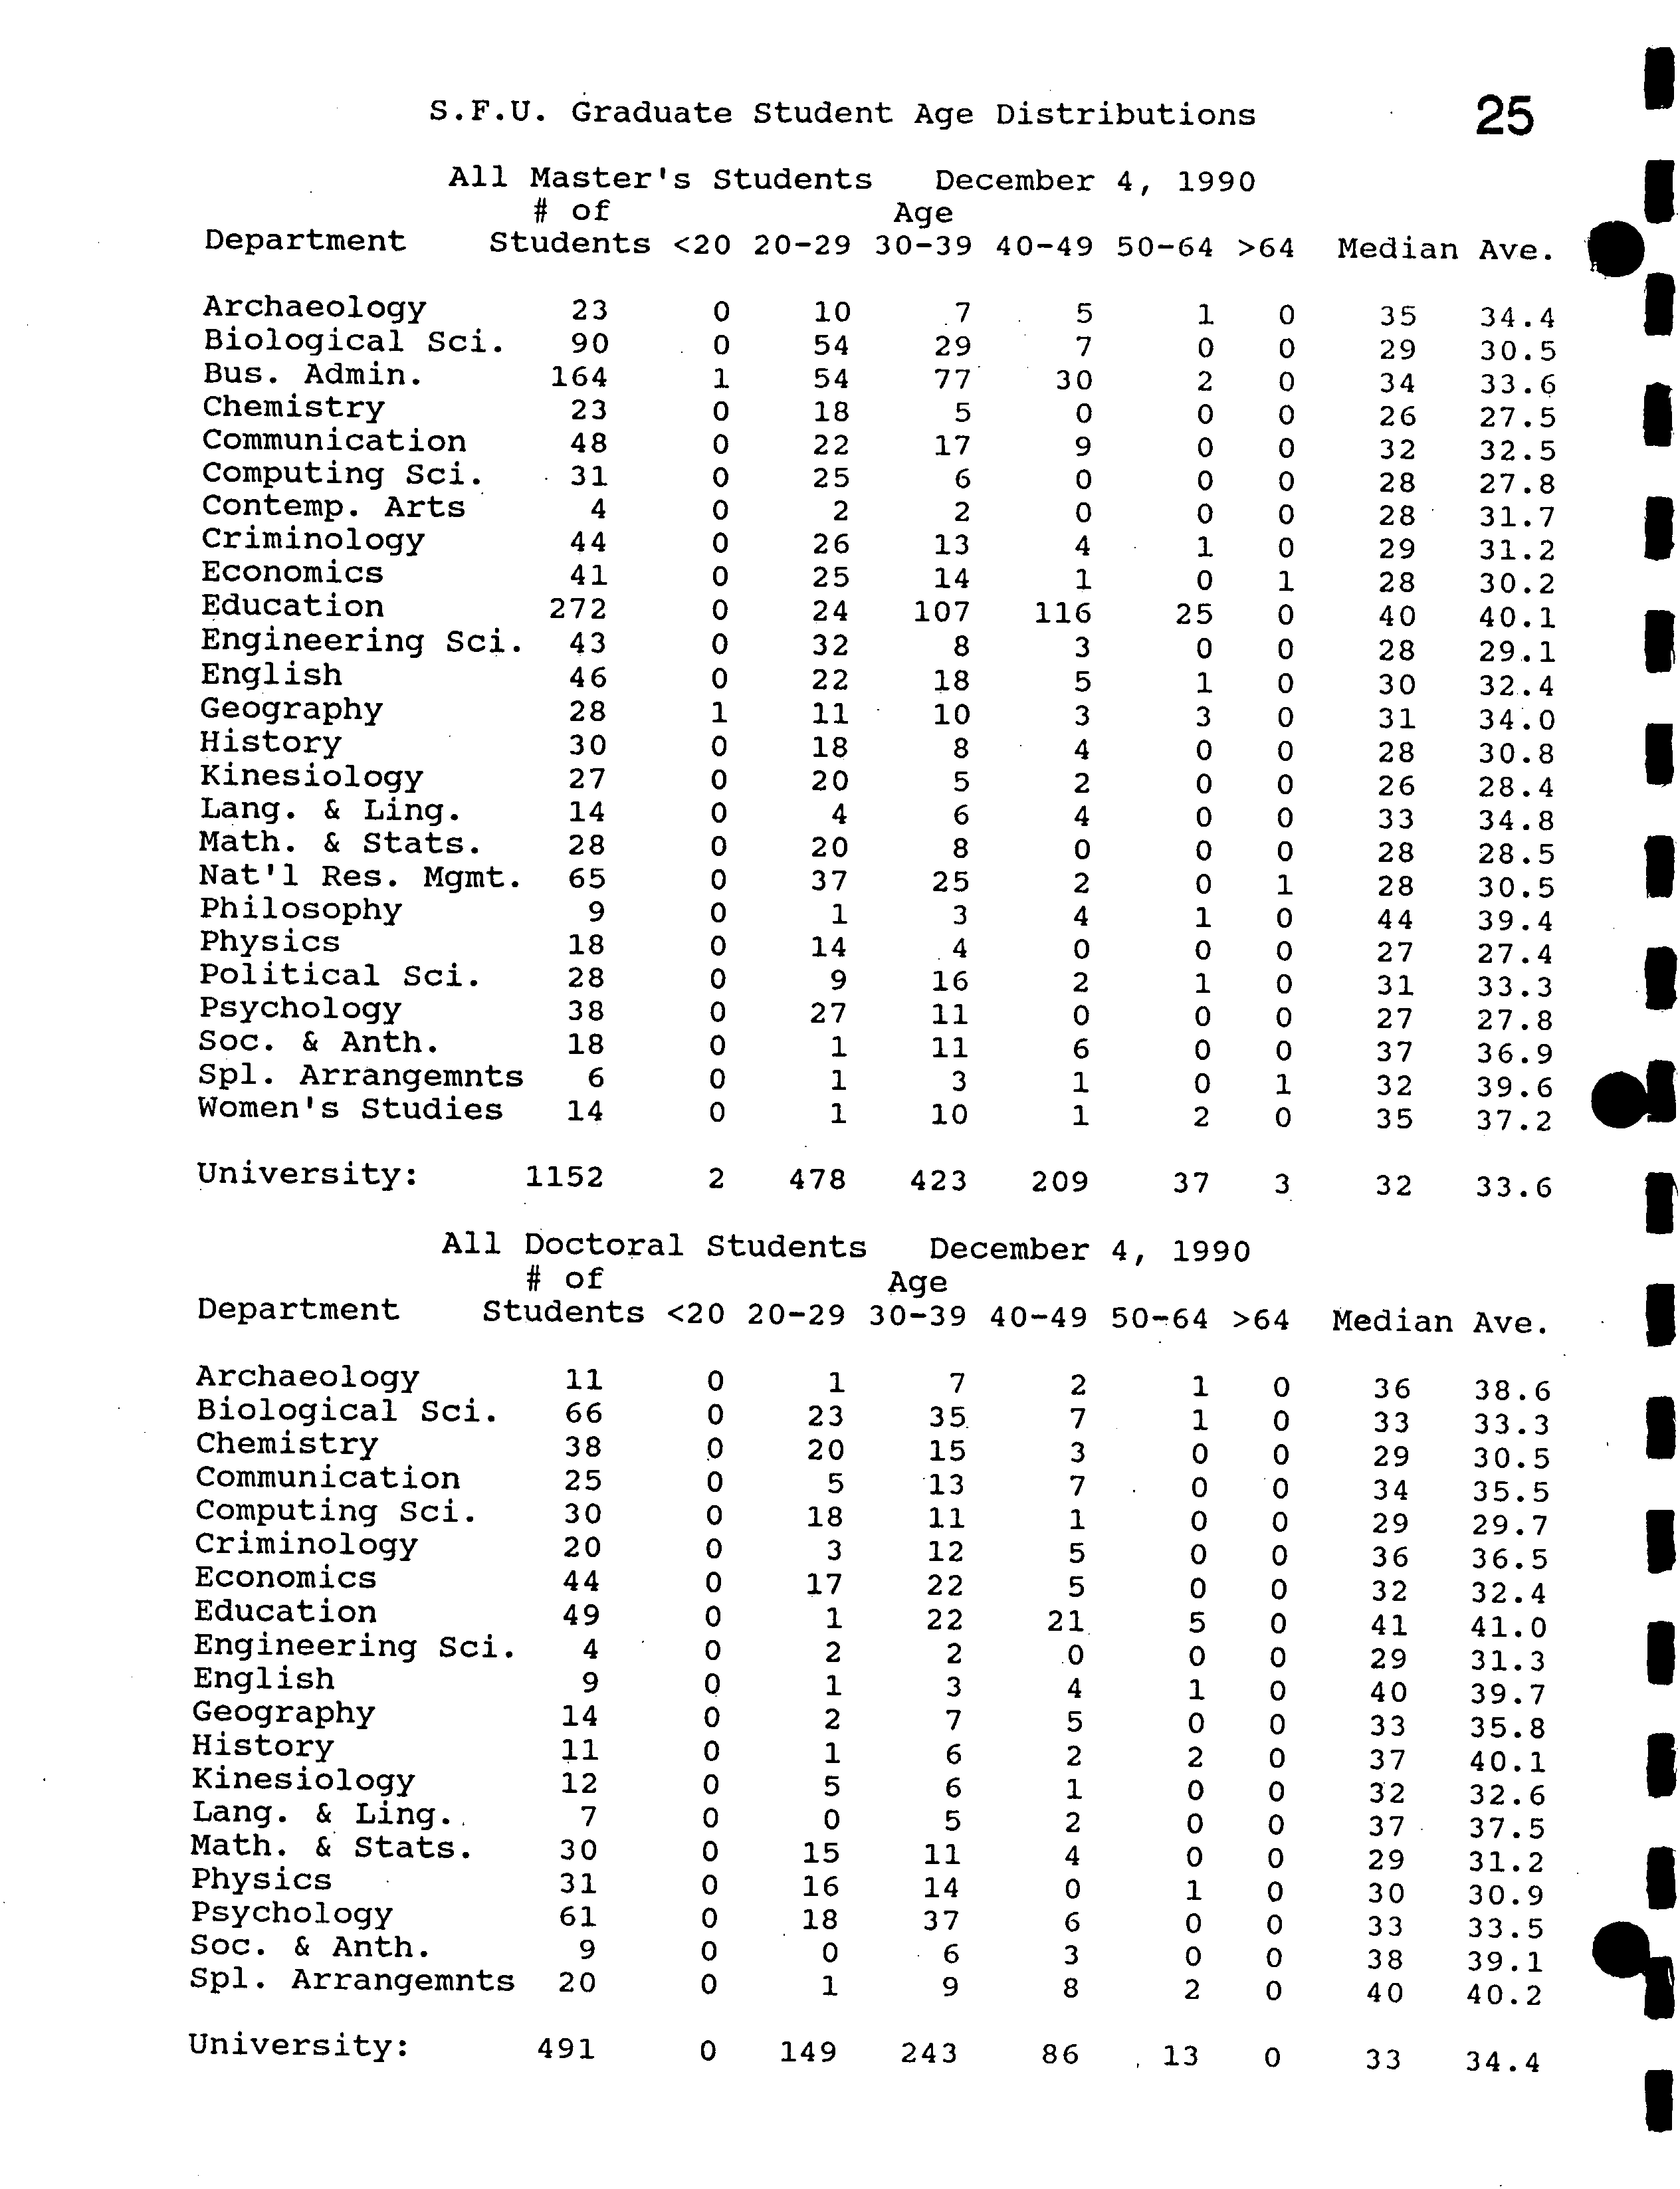
S.F.U. Graduate Student Age Distributions
All Master's Students
?
December 4, 1990
#of ?
Age
Department ?
Students <20 20-29 30-39 40-49 50-64 >64
Archaeology
23
0 10
.7
5
1
?
0
Biological Sci.
90
0 54
29
7
0 ?
0
Bus. Admin.
164
1 54
77
30
2 ?
0
Chemistry
23
0
18
5
0
0 ?
0
Communication
48
0
22 17
9
0 ?
0
CriminologyContemp.
Computing
Arts
Sd.
.
?
44
31
4
0
0
0 2526
2
13
2
6
4
0
0
0
10
???
0
0
0
EducationEconomics
27241
0
0
24
25
107
14
116
1
25
0
??
0
1
Engineering Sci.
43
0
32
8
3
0 ?
0
English
46
0
22
18
5
1
?
0
Geography
28
1
11
10
3
3
?
0
History
30
0
18
8
4
0 ?
0
Kinesiology
27
0
20
5
2
0 ?
0
Lang. & Ling.
14
0
4
6
4
0 ?
0
Math. & Stats.
28
0
20
8
0
0 ?
0
Women's
Nat'l
Spl.
Soc.
Political
PsychologyPhilosophyPhysics
Arrangemnts
&Anth.
Res.
StudiesSci.Mgmt.
143818286518
6
9
00
0
0000
0
271437
91
1
11
1025111611
4
33
1
2
10
62
0
4
2
0
00
0
1
1
0
????????
0
0
1
0
0
0
0
1
University:
1152
2
478
423
209
37 ?
3
All
Doctoral
Students
December
4, ?
1990
#of
Age
Department ?
Students <20
20-29
30-39
40-49
50-64 >64
Median
Ave.
Spl.
Math.
Soc.
PsychologyPhysicsHistoryKinesiologyGeographyLang.
English
Engineering
EducationEconomicsArchaeologyCriminologyCommunicationComputing
ChemistryBiological
?
?
Arrangemnts
&Anth.
&
&
?
Ling.
Stats.
.
Sci.Sci.
Sd.
20613031
12
11
14
4449202530663811
97
9
4
0000
0
000
0
0
0
00
0
0
0
0
0
0
.181615
1718
20
23
10501
22
11
3
5
1
37
11
14
2222
12
1115
35.
13
96567
63
2
7
21
8
3
6
420
15
24
0575
1
7
2
3
2
0
01
000
2
0051
0
00
0011
0
00
0
0
0
0000000000
0
0
0
40
38
33
2930
37
32
37
33
4029413629
32293433
36
.
40.2
39.1
33.5
30.9
31.2
37.5
32.6
40.1
39.7
41.0
35.8
31.3
36.5
32.4
29.7
35.5
30.5
33.3
38.6
University: ?
491 ?
0 ?
149 ?
243 ?
86
?
1
13 ?
0 ?
33 ?
34.4
I
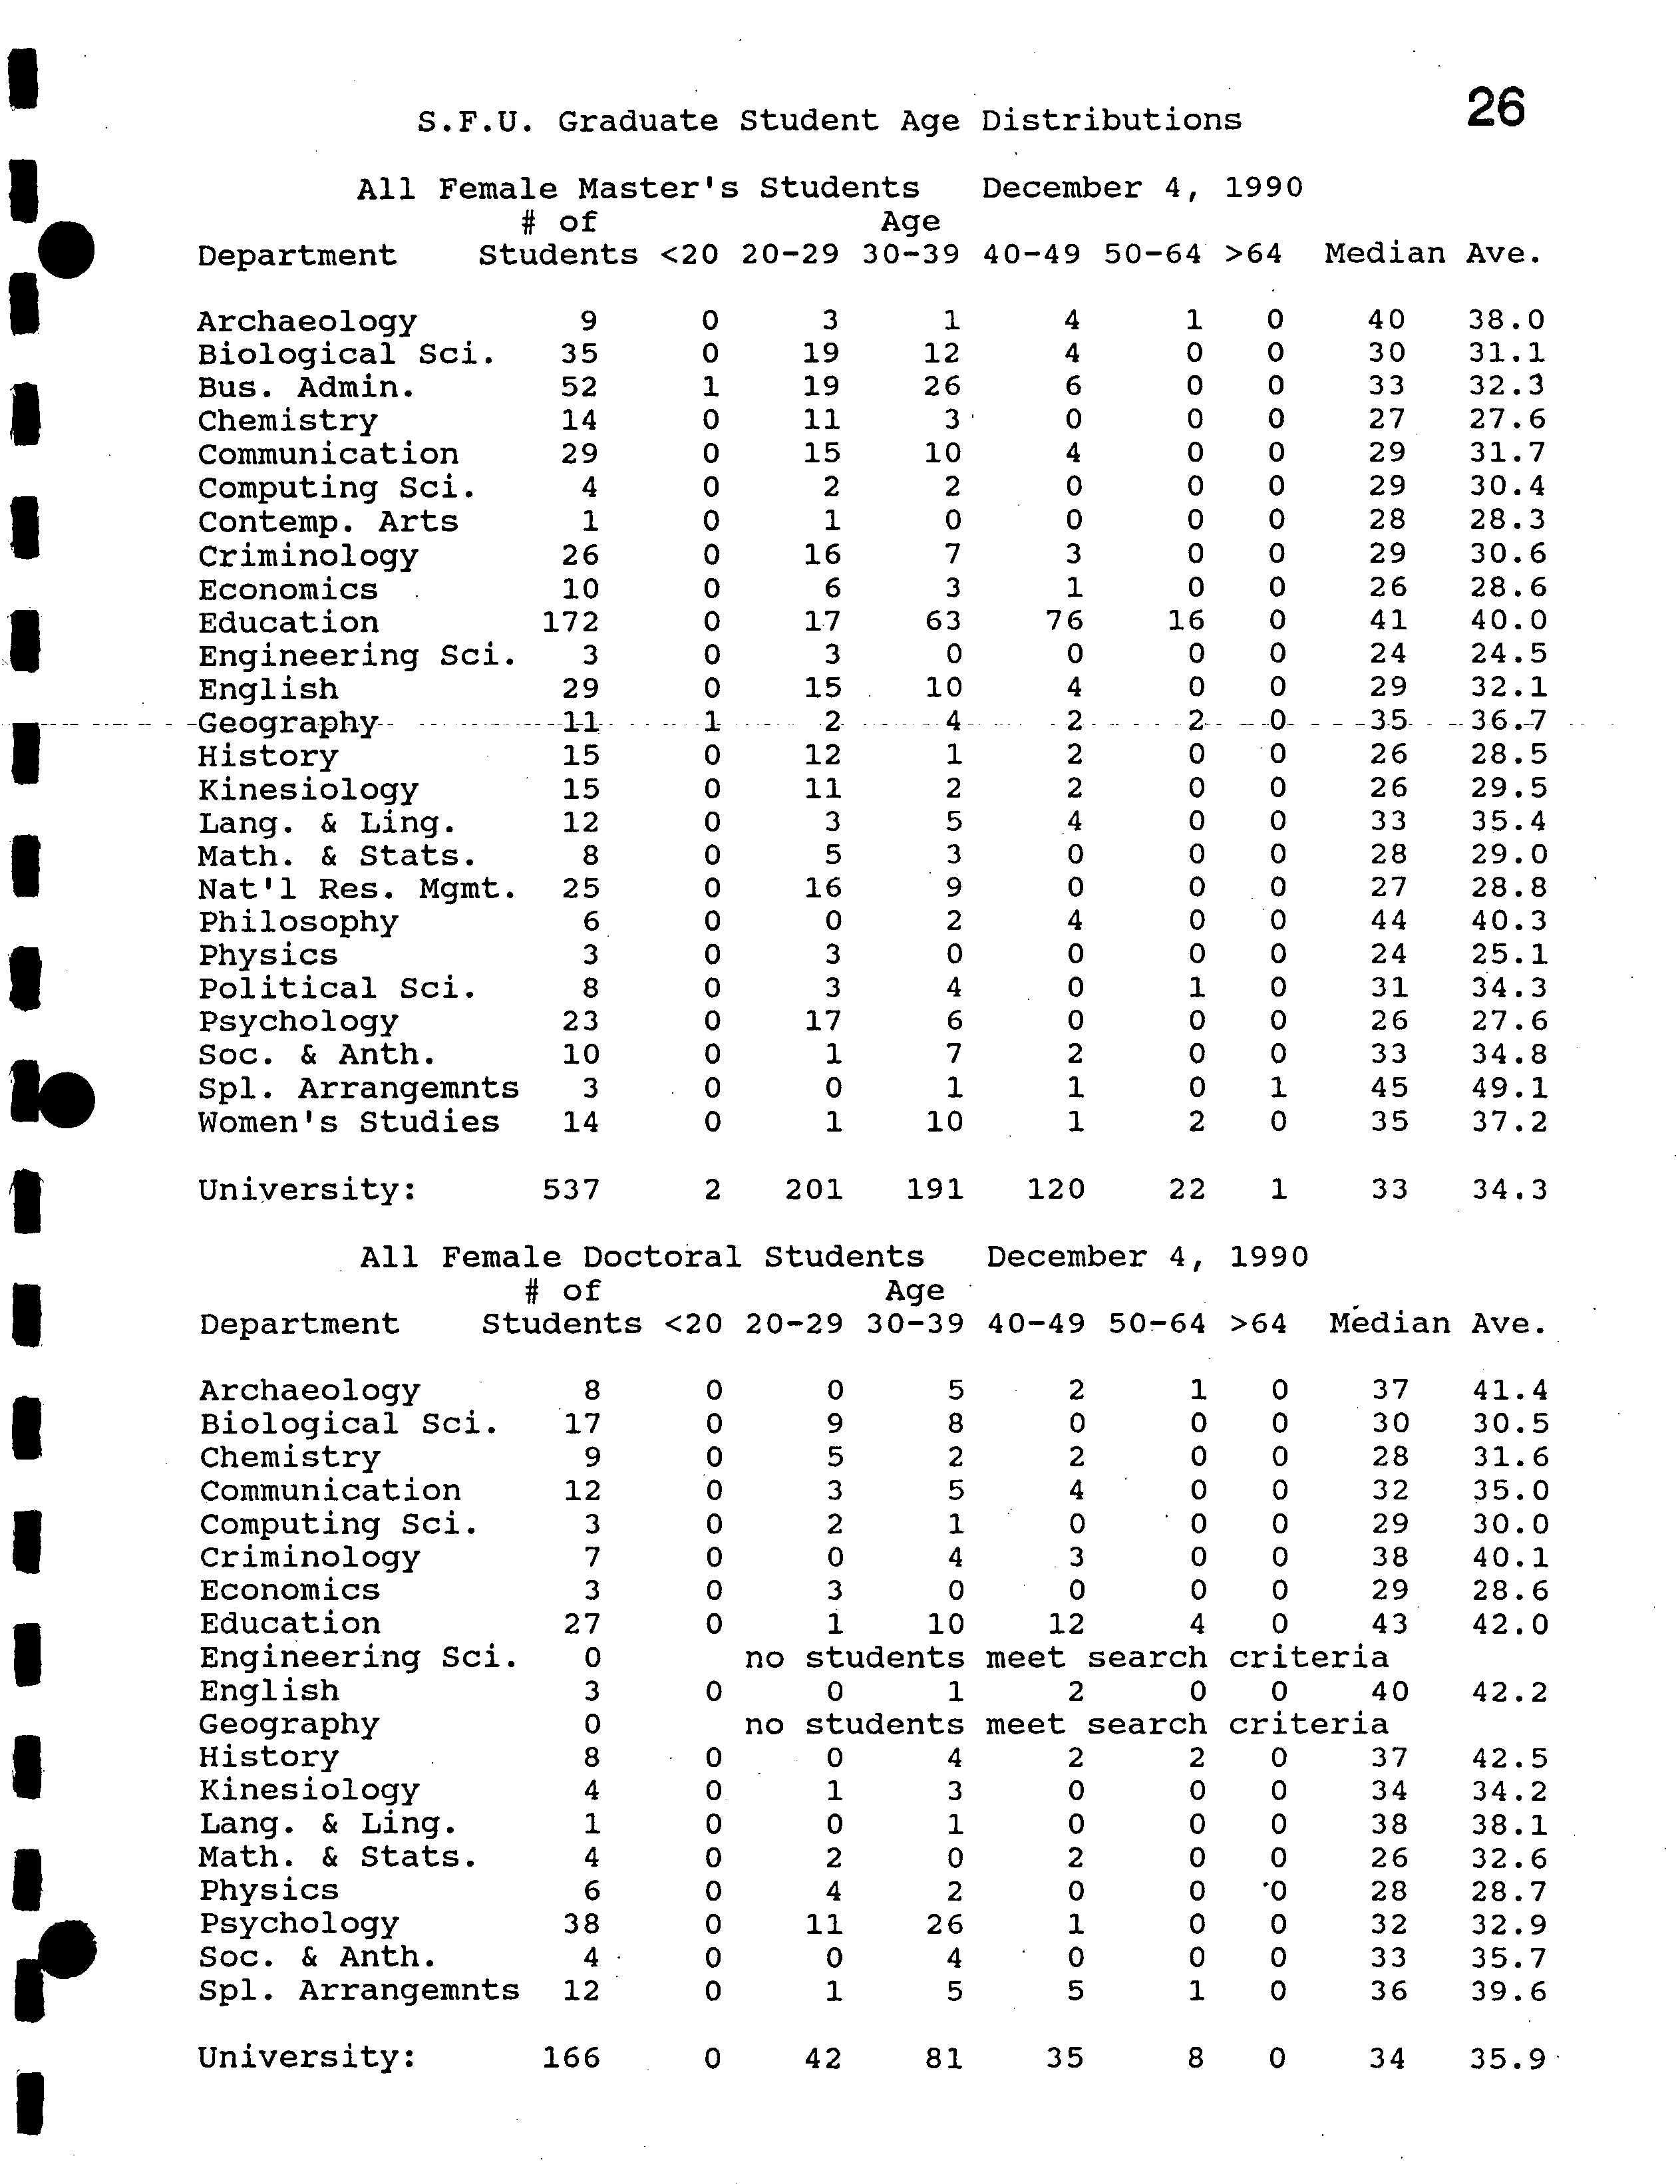
S.F.U. Graduate Student Age Distributions ?
26
I
All Female Master's Students December 4, 1990
- ? #of
Age
Department ?
Students
<20
20-29 30-39 40-49 50-64
>64 Median Ave.
Archaeology
9
0 3
1
4
1 0
40
38.0
Biological
Sd.
35
0 19 12
4
0 0 30 31.1
Bus. Admin.
52
1
19
26
6
0
0 33 32.3
Chemistry
I
14 0
11 3 0
0 0 27 27.6
Communication
29 0
15 10 4
0 0 29 31.7
Computing Sci.
4
0
2
2
0
0 0 29
30.4
I ?
Contemp. Arts
1 0
1
0 0 0 0
28 28.3
Criminology
26
0
16
7 3 0
0 29 30.6
Economics
10
0 6
3
1
0 0
26
28.6
172 0
17
63 76 16
0 41 40.0
.I
?
Education
Engineering Sci.
3
0
3
0
0
0
0 24 24.5
English
29 0
15
10 4 0
0 29
32.1
--------- - -Geography---------------
l-l----1-
2-
4-
-2----
-2--
--0- ---35--
--36.-7
History
I
15
0
12
1 2
0
0
26 28.5
Kinesiology
15
0 11
2 2 0
0 26
29.5
Lang. & Ling.
12
0
3
5
4
0 0 33
35.4
I ?
Math. & Stats.
8 0
5
3
0
0 0 28 29.0
Nat'l Res. Mgmt. 25
0 16
9
0 0 0
27
28.8
Philosophy
6
0
0 2
4
0 0
44
40.3
Physics
3 0
3 0
0 0
0
24
25.1
I
?
Political Sc!. 8 0
3
4
0 1
0 31
34.3
Psychology
23 0 17
6 0 0 0 26 27.6
Soc.&Anth.
10 0 1
7 2
0 0
33
34.8
Spl. Arrangemnts
3
0
0
1
1
0
1
45
49.1
Women's Studies 14
0
1 10
1
2 0
35
37.2
University:
537 2
201 191 120 22 1 33 34.3
All Female
Doctoral Students December 4, 1990
#of
Age
Department ?
Students
I
<20 20-29 30-39 40-49 50-64 >64
Median
Ave.
Archaeology
8
0 0 5 2
1 0
37
41.4
Biological Sci.
I
17
0
9 8 0
0
0
30
30.5
Chemistry
9 0 5 2
2 0 0 28 31.6
Communication 12 0 3 5
4 0
0
32
35.0
Computing Sc!.
3
0
2
1
0
0 0 29 30.0
I ?
Criminology 7
0
0 4 3 0 0
38
40.1
Economics
3 0 3 0 0 0 0 29 28.6
Education
27 0 1 10 12 4 0 43 42.0
Engineering Sci.
I
0
no students meet
search criteria
English
3 0 0
1
2 0 0
40
42.2
Geography
0
no students
meet
search criteria
I ?
History
8 0
0
4 2 2 0 37
42.5
Kinesiology
4
0 1 3
0 0 0 34
34.2
Lang. &Ling.
1
0
0
1
0
0 0 38
38.1
Math. ?
& Stats. 4
0
2 0
2 0 0 26
32.6
I ?
Physics
6 0 4
2
0 0 0 28
28.7
Psychology
38 0
11
26 1 0 0 32
32.9
Soc. & Anth.
4-
0
0
4
0
0 0 33
35.7
Spl. Arrangemnts
12
0
1
5
5
1 0 36
39.6
I
-
?
University:
166
0
42 81
35
8 0
34
35.9
S.F.U.
Graduate
Student Age
Distributions
27
All Male
Master's
Students
December
4,
1990
#of
Age
Department
?
Students
<20
20-29
30-39
40-49 50-64
>64
Median
Ave.
Women's
Spl.
Soc.
Nat'l
Math.
Psychology
Political
PhilosophyPhysics
History
Geography
Kinesiology
Lang.
English
Engineering
Education
Economics
CriminologyContenip.
Computing
Communication
ArchaeologyChemistryBus.
Biological
Arrangenints
&Anth.
?
Admin.
Res.
&
& Ling.
Studies
Stats.
?
Arts
Mgnit.
Sci.
Sd.
Sci.
Sci.
10011220
1515
2040
121715
40
1731182719
55
14
3
80
3
2
3
9
00
0
0
0
0000
0
0000
0
0
0
00
0
0000
no students
1011211529
1
2310
3535
10
6
1
9
9
1
6
7717
7
7
12
1644115117
2
4
5
4
1
5
71
6
3
8
8
6
4272
6
meet
40
24
0
42
00
2
00
0
0
2
1
1
3
0
1
5000
3
1
search
000
0
00
1
000011090
0
0100
2
0
0
criteria
00000
0
1
0000000
0
0100000
0
0
283138273028302826
26
2830
34
40
3228
353026
3424293429
28.0
30.0
39.5
32.8
27.9
37.7
28.3
31.5
27.1
31.0
32.3
40.4
33.2
29.4
33.0
27.4
32.0
30.7
32.9
33.7
27.2
34.2
32.1
30.2
University: ?
615
0
277
232
89
15
2
31
32.9
All Male
#of
Doctoral
Students
Age
?
December
4, ?
1990
Department ?
Students
<20
20-29
30-39
40-49 50-64>64
Median
Ave.
spi.
Soc.
Math.
Psychology
Physics
History
Kinesiology
Lang.
Geography
English
Engineering
Education
Economics
ArchaeologyCriminology
Computing
Chemistry
Communication
Biological
Arrangenints&Anth.
&
&
Ling.
Stats.
Sd.
Sd.
Sci.
232526
14
22
41
27
1313
4929
8
56
8
3
46
3
00000000
0
0000000000
121314
16
14
15
070
0
4
1
22
10
3
2
1
1211112212101327
4
2
43
2722
8
82
33
5
2
0
2
1
05
2
0
9
5
2
7
3
11
0
100100000101
0
00000
1
000000
0000
000000
0
00
4044352930362936
33
293539
32293535
30
34
30
41.1
41.7
34.5
31.5
31.0
37.3
31.8
33.8
35.8
38.4
31.3
39.8
32.7
34.6
29.6
36.0
30.1
31.4
34.3
University:
?
325
0
107
162
51
5
0
33
33.7
Economics
• Bus. Admin. MBA
Eng. Sd. MAP
Psychology
Math. & Stats.
Geography
Computing Science
Chemistry
Physics
Cz
Political Science
Kinesiology
2
Spl. Arrangements
0...
Biol. Sd. MPM
.Y
'b.
Bus. Admin. MBE
Biol. Sci. MSC
Cz
Nat'l Res. Mngmt.
Education IVIED
History
Education MA
Criminology
Geography
Communications
Soc. & Anth.
English
Archaeology
7.3
?
University Av,,-
10.4 Sernest-
7.3
V
rWfWvfWvf*vf*f*vf*vf,
•
-
V
PVVVVVVVVVV
•
-
V
V
V
•
V
,â,V
'V
V
V'V
V V,à,V
?
V 'V V
?
13.9
S
•
4*4h
£
•
Al*lI*I ?
A
S
4
5
I1.8
1.8
:12.0
112.0
12.3
XXX
12.8
8 ?
10
?
12 ?
14
Semesters to Completion
Simon Fraser University
Average Degree Completion Times
Fall 1985 - Fall 1990
14.21
Simon Fraser University
Average Degree Completion Times
Fall 1985- Fall 1990
29
Physics
Education
Math. & Stats.
Computing Science
Communications
U)
E
Biol. Sci.
Cz
Spi. Arrangements
Kinesiology
0
Cz
Chemistry
Psychology
Economics
English
History
Soc. & Anth.
Geography
Archaeology
£ A A A £ A A 4
A A A
01111111
WIN
'
W
A'
W
A'
W A'
WW
A A'WA'I
•
?
*d*à•
•4II[S
A A
A A
A A A A A A A *
A
A
A A A A
MONSOON
A A A A
A
A
A A A A A A A A A
A
AA
A A A
A
A
A
4
ON-7-4341 , a
4-Pi
•
A A A A
A
A
A
A
A A A A A A A
A A A
A A A A A A A
A A
A A A
A A A
A A A
A
A A A
A A A A
A A A
A A A A A
V
A
'V
A
'V
A
'V
A
'V
A
'V
A
'V'V'V
A
A
A A
'VV
A A
'V
A
'V
A A
'V
A
-v
A
'V
A
'"V
A
A
'V
A
'WV
A
A
'V
A
'V'V
A
A
'V
A
'WV
A
A
'V
A
-
?
_________
'V'W••'V'V'V'V'V'V'V 'V'V'V'V•• 'V'V••'V'V'V
-----------
A
A
A
A A
A
A A A A
A
A A A
A A
A A A A
'V'W•• • •'W 'V•
'V 'V
'V•
'V'V 'V
'V•
'V 'V 'V 'V 'V 'V
'V•
'V 'V
V•
A
A A
A A A A
A A
A A A
A A
A A
A A
A A A A A A
A
A A A A A A
A
12 ?
14 ?
16
?
18
?
20 ?
22
Semesters to Completion
1
Simon Fraser University
?
30
I
?
?
Times for Degree Completion for Graduands Completing Degrees
?
in 85-3 through 90-2 as of January 7, 1991
Number of
?
Semesters in Program
I ?
Department ?
Program Graduands
?
Min Max
?
Average Median
Archaeology ?
MA ?
17
?
9 ?
18 ?
14.18 ?
15
I ?
Archaeology ?
PHD ?
8
?
12 ?
27 ?
21.00 ?
22
Biological Sci. MAQ
?
0 ?
- ?
-
?
- ?
-
I ?
Biological
Biological
Biological
Sci.
Sci.
Sci.
MSCPHDMPM
???
484955
???
10
55
???
27
1717
???
15.9210.8010.24 ???
14
10
10
I
IBus.
-----------Chéinistry
Admin.
Bus. Admin. ??
MBAMBE
??
152
63
??
5
3
??
1617
??
10.547.32 ??
10
6
?
-MSC ?
25
4 ?
18 ?
9.24 ?
8
Chemistry ?
PHD ?
20 ?
12
?
22 ?
16.50 ?
16
I ?
CommunicationCommunication
??
MCM
PHD ??
36
5 ??
11
5
??
45
19 ??
14.4012.33
??
13
10
Computing Sci.
?
MSC ?
75 ?
4 ?
17 ?
8.96 ?
8
I
?
Computing Sci.
?
PHD ?
7 ?
11 ?
17 ?
14.14 ?
15
Criminology ?
MCR ?
40 ?
3 ?
21 ?
11.95 ?
12
i.
?
Criminology ?
PHD ?
0 ?
- ?
- ?
- ?
-
Lang. & Ling.
?
MA ?
4 ?
8 ?
12
?
10.00 ?
9
I ?
Lang.
Lang.
&
&
Ling.Ling.
??
MAT
PHD ??
7
2 ??
24
14
??
2824 ??
26.0016.43
??
24
15
Economics ?
MA
?
68 ?
3 ?
18 ?
7.28 ?
6
I ?
Economics ?
PHD ?
26 ?
11 ?
42 ?
18.88 ?
18
Education ?
MAE
?
119 ?
5 ?
23 ?
11.78 ?
12
I ?
EducationEducationEducation ???
MSEMEDPHD ???
166
86 ???
8
8
4
???
21
2415 ???
13.6212.1711.05 ???
13
13
11
IEnglish
I
?
Engineering
Engineering
Engineering
English ??
Sci.
Sd.
Sd.
PHDMEN
MAPMAPHD
?????
10
41
018 ?????
11
12-
55
?????
11
1229
35
-
?????
11.0019.0013.227.70
-
?????
11
19
12
-
7
IMFA
?
0
?
- ?
-
?
-
?
-
Geography ?
MA
?
12 ?
8 ?
18 ?
12.00 ?
11
I ?
GeographyGeography ??
MSC
P1-ID ??
1212 ??
15
6
??
29
12
??
20.588.67 ??
17
9
History ?
MA
?
21 ?
3 ?
18
?
11.76 ?
11
continued...
31
Simon Fraser
University
Times for Degree Completion for
Graduands
Completing Degrees
in 85-3 through 90-2
as of January 7,
1991
Number of
Semesters
in Program
Department ?
Program
Graduands
Min
Max
Average ?
Median
History
PHD
5
14
26
19.60
21
KinesiologyKinesiology
MSK
PHD
31
7
85
28
17
16.439.87
15
10
Math.
Math.
?
&
&
Stats.
Stats.
MSCPHD
4315
8
5
2015
14.008.42
13
8
Nat'l Res. Mgmt.
MRN
51
5
24
10.90
9
Philosophy
MA
1
19
19
19.00
19
PhysicsPhysics
MSCPHD
2917
84
1719
12.539.45
13
9
Political Sci.
MA
13
4
17
9.69
8
PsychologyPsychology
MA
PHD
4230
95
2717
17.138.19
17
8
Soc.Soc.
?
?
&
&
Anth.Anth.
MAPHD
12
5
15
6
25
19
12.7520.40
23
13
Spl.
Spi.
Spl. ArrangemntsArrangemntsArrangemnts
MSSMAS
PHS
12
7
3
7
8
6
22'
25
16
10.1415.0016.00
16
16
8
Women's Studies
MA
2
7
14
10.50
7
Total Master's:
Total Ph.D.:
?
1213 ?
3 ?
45 ?
10.37 ?
11
?
235
?
8 ?
42 ?
16.71 ?
16
Note: These data are based on the total elapsed time in program
?
and do not take into account part-time or on-leave status.
32
Simon Fraser
University
Times for Degree
Completion
for Graduands
Completing Degrees
in 85-3 through
90-2 ?
as
of January
7, ?
1991
- Male
Graduands only
Number of
Semesters
in Program
Department
Program
Graduands
Min
Max
Average
Median
ArchaeologyArchaeology
MA
PHD
8
6
19
9
2716
23.6713.75
24
14
Biological Sci.
MAQ
0
-
-
-
Biological Sci.
MPM
36
5
16
9.75
-
9
Biological
BiologicalSci.
Sci.
MSCPHD
41
32
10
5
27
17
16.1210.56
16
10
Bus.
Bus.
Admin.Admin.
MBEMBA
125
42
5
3
1716
10.567.29
10
6
ChemistryChemistry
MSC
PHD
1717
12
5
-
21
18
16.069.53
16
8
CommunicationCommunication
MCM
PHD
15
3
11
5
45
19
12.6715.67
10
17
Computing
Computing
Sci.Sci.
MSCPHD
60
6
11
4
1717.
14.179.17
15
8
CriminologyCriminology
MCR
PHD
15
0
-
3
17
-
11.07
-
11
-
Lang. ?
& Ling.
MA
0
- - -
Lang. & Ling.
MAT
4
14
15
14.75
-
15
Lang. ?
& Ling.
PHD
1
24
24
24.00
24
EconomicsEconomics
MA
PHD
4824
11
3
30
18
17.927.00
18
6
EducationEducationEducationEducation
MSEMEDMAEPHD
8839
3
1
15
946
1724
1521
13.6715.0012.0310.86
15
15
10
12
EnglishEnglish
MAPHD
17
2
20
7
29
17
24.5012.00
20
11
Engineering
Engineering
Engineering
Sci.Sci.
Sd.
MENMAP
PHD
0
81
11
-
5
12
11
-
11.00
7.62
-
11,
-
7
MFA
0
-
-
-
-
GeographyGeographyGeography
MSCPHDMA
11
96
15
69
291115
20.7311.838.44
17
12
9
History
MA
13
3
18
11.77
11
continued...
•
?
Simon Fraser University
331
Times for Degree Completion for Graduands Completing Degrees
in 85-3 through 90-2 as of January 7, 1991 - Male Graduands only
?
Number of
?
Semesters in Program
Department ?
Program Graduands
?
min
?
Max ?
Average Median
History ?
PHD ?
3 ?
14 ?
21 ?
16.67 ?
15
KinesiologyKinesiology
??
MSK
PHD ??
17
6
??
85 ??
2817 ??
16.509.76
??
10
12
Math.
Math.
&
&
Stats.Stats.
??
MSCPHD ??
30
12 ??
5
8 ??
2015 ??
14.678.83
??
14
8
Nat'l Res. Mgmt. MRM
?
31 ?
5 ?
24 ?
11.71 ?
9 ?
1
Philosophy ?
MA ?
1 ?
19 ?
19 ?
19.00 ?
19
PhysicsPhysics ??
MSCPHD ??
25
15
??
84 ??
.19
17
?
?
• ?
12.139.48 ??
11
9
Political Sci.
?
MA ?
8 ?
5 ?
17 ?
10.75 ?
10
PsychologyPsychology ??
MA
PHD
??
1417
??
10
5
??
2717 ??
16.508.53
??
15
8
Soc.
Soc.
&
& Anth.Anth.
??
MA
PHD
??
8
2 ??
15
6 ??
2318 ??
11.2519.00
??
10
i
Spi.
Spi.
Spi.
Arrangemnts
Arrangemnts
Arrangemnts
PHSMSSMAS
???
6
2
1
???
22
8
8
???
222210 ???
22.0015.679.00
??
•
?
22
14
8
Women's Studies MA
?
0 ?
- ?
-
?
- ?
-
Total
Total Ph.D.:Master's: ??
. ?
724
172 ??
8
3 ??
3045
??
10.10
16.57 ?
16
Note: These data are based on the total elapsed time in program and
?
do bot take into account part-time or on-leave status.
I
0
I
• ••
?
•1
I
I
Simon Fraser
University
I
Times for Degree
Completion for Graduands
Completing Degrees
I,.
•
in
Department.85-3
through 90-2Program
as
Number
Graduandsof
January
of
7,
Min
1991
SemestersMax-
FemaleAverage
in
Graduands
Program
Median
only
Archaeology
MA
9
11
18
14.56
16
1
Archaeology
PHD
2
12
14
13.00
12
Biological Sci.
MAQ
0
-
-
-
-
I
Biological
Biological
Biological
Sci.Sci.Sci.
MPMMSC
PHD
1719
7
10
66
191617
14.7111.2411.16
14
12
11
IBus.
I
I
CommunicationCommunicationChemistryChemistry
Bus. Admin.Admin.
MCM
PHDMSCMBE
MBA
PHD
21
2721
2
8
3
1215
546
3
25
132214
1616
12.5012.1019.0010.448.627.38
12
12
20
10
8
6
Computing Sci.
MSC
15
5
13
8.13
8
1
Computing Sci.
PHD
1
14
14
14.00
14
Criminology
NCR
25
8
21
12.48
12
I.
Criminology
PHD
0
-
-
-
-
Lang. & Ling.
MA
4
8
12
10.00
9
I
.
?
Lang.Lang. ?
?
&
&
Ling.Ling.
MATPHD
1
3
2815
2824
28.0018.67
28
17
Economics
MA
20
4
17
7.95
6
.1
Economics
PHD
2
19
42
30.50
19
Education
MAE
80
5
23
11.66
11
I
I
EnglishEnglishEducationEducationEducation
MAMSEMED
PHDPHD
2478
655
12
5
8
8
4
2035202115
17.1714.0813.6011.6011.26
18
13
13
13
12
I
Engineering
Engineering
Sci.Sci.
MENMAP
20
8
-
-
8
8.00
-
-
8
Engineering Sci.
PHD
0
-
-
-
-
I
MFA
0
-
-
-
-
Geography ?
.
MA
6
8
18
12.17
10
I
GeographyGeography
MSCPHD
3
1
19
6
1912
19.009.33
19
10
1
History
MA
8
7
18
11.75
10
I
Continued...
351
Simon Fraser University
Times for Degree Completion for Graduands Completing Degrees
?
in 85-3 through 90-2 as of January 7, 1991 - Female Graduands on1
?
Department ?
Program GraduandsNumber
?
of
??
Min
?
Semesters
Max ?
in
Average
ProgramMedian
?
1
History ?
PHD ?
2 ?
22 ?
26. ?
24.00
?
22
KinesiologyKinesiology
??
.
MSK
PHD ??
14
1
??
16
5 ??
1616
??
10.0016.00
??
16
10
Math.
Math.
&
& Stats.Stats.
??
MSCPHD ??
13
3 ??
95 ??
1313 ??
11.337.46 ??
12
6
Nat'l Res. Mgmt. MRN
?
20
?
6 ?
17 ?
9.65 ?
9
PhilosophyPhysicsPhysics
???
MSCMAPHD
???
2
4
0
???
14
7
-
???
1714
-
???
15.509.25
- ???
14
7
-.
Political Sci.
?
MA
?
5 ?
4 ?
15
?
8.00 ?
7
PsychologyPsychology ??
MA
PHD
??
2516 ??
9
6
??
26
11
??
17.697.96 ??
17
8
Soc.
Soc.
&
&
Anth.Anth.
??
MA
PHD
??
4
3 ??
16
13 ??
2519 ??
21.3315.75
??
23
14
Spl.
Spi.
Spi.
Arrangemnts
Arrangemnts
Arrangemnts
MSSPHSMAS
???
6
2
5
???
8
7
6
???
25
1616
???
10.6011.5016.33
???
16
7
8
Women's Studies MA
?
2 ?
7 ?
14 ?
10.50 ?
7 ?
1
Total
Total
Ph.D.:Master's: ??
489
63 ??
8
3 ??
4235 ??
10.7717.11 ??
16
10
Note:
do
These
bot
data
take
are
into
based
account
on the
part-time
total
or
elapsed
on-leave
time
status.
in program-and
I
I
•1
I
•1
I
Biol. Sci. MPM
?
Bus. Admin. MBE
?
Biol. Sci. MSC
?
Kinesiology
-
Psychology
Computing Science-
Bus. Admin. MBA
Engineering Science
IE
Geography
Physics
I
C)
Chemistry
Math. & Stats.
a)
Economics
a)
Communications
0
Education
I
?
a)
Lang. & Ling.
O
Nat'l Resource Mgmt.
IEducation
Archaeology
Geography
Political
Political Science
Soc. & Anth.
jEnglish
Criminology
IHistory
Simon Fraser University
Master's Program Withdrawal Rates
Fall 1985- Fall 1990
36
I
0 ?
10
?
20 ?
30 ?
40
?
50
Withdrawal
Rate
(%)
ISome programs with small numbers of
graduands have been omitted
I
Communications
Psychology
Physics
Biological Sci,
Chemistry
?
E
?
Math. & Stats.?
Cz
Archaeology
0
English
CL
Geography
• Spi. Arrangements
1)
?
o
?
Kinesiology
Economics
Education
Soc. & Anth.
History
Computing Science
Simon Fraser University
Doctoral Program Withdrawal Rates
Fall 1985 - Fall 1990
37
o ?
10 ?
20
?
30
?
40 ?
50 ?
60 ?
70
Withdrawal Rate (%)
Some programs with small numbers of?
graduands have been omitted
•
38
Simon
FraserAll
UniversityStudents
sinceCompletionFall
1985
Statistics
Report
Dated:
December
4,
1990
Active
Total
W/D
Department
Pgm
Now
Degree
Trf
W/D
Completed
Rate ?
(%)
ArchaeologyArchaeology
PHD
MA
2311
17
8
00
11
4
28
12
33
39
Biological
Biological
Biological
Biological
Sci.Sc!.Sci.Sci.
MSCMPMMAQPHD
296560
2
484955
0
13
000
15
12
7
0
746362
0
N/A
24
16
11
Bus.
Bus.
Bus.
Admin.Admin.Admin.
MBW
MBEMBA
-
?
95
69
0
152
63
0
?
-
000
2216
0
174
79
0
N/A
20
13
ChemistryChemistry
MSCPHD
2338
2025
9
1
11
7
28
45
24
25
CommunicationCommunication
MCM
PHD
4825
36
5
01
15
0
52
5
29
0
Computing
Computing
Sc!.Sci.
MSCPHD
3130
75
7
20
1417
2194
67
18
Contemp. Arts
MFA
4
0
0
0
0
N/A
CriminologyCriminology
MCR
PHD
4420
40
0
0
2
40
2
82
2
100
49
EconomicsEconomics
PHDMA
4441
26
68
0
0
2418
4492
26
41
EducationEducationEducationEducation
MSEMEDMAEPHD
110143
4919
119166
86
001
1
7870
81
245190
16
7
50
37
14
32
Engineering
Engineering
Engineering
Sc!.Sc!.Sc!.
MAPMEN
PHD
26
19
2
10
0
1
000
26
0
3
27
13
0
N/A
23
96
EnglishEnglish
PHD
MA
46
9
41
8
00
35
4
12
76
33
46
GeographyGeographyGeography
MSCPHDMA
1422
6
121212
0
00
6
9
3
21
1815
33
43
20
HistoryHistory
PHD
MA
1130
21
5
01
23
7
45
12
58
51
continued...
39
Simon Fraser University
Completion Statistics
All Students since
Fall
1985
Report Dated: December
4,
1990
Active
Total
W/D
Department
Pgxn
Now
Degree
Trf
W/D
Completed
Rate ?
(%)
KinesiologyKinesiology
MSK
PHD
27
12
31
7
0
1
46
11
38
16
36
Lang.Lang. ?
?
&
& Ling.Ling.
PHD
MA
13
8
11
2
0
3
7
1
21
3
33
33
Math.
Math.
?
&
&
Stats.
Stats.
MSCPHD
2929
4315
2
1
15
7
23
60
25
30
Nat'l Res. Mgmt.
MRN
65
51
0
26
77
34
Philosophy
MA
9
1
0
9
10
90
PhysicsPhysics
MSCPHD
31
18
29
17
70
10
5
46
22
23
22
Political
Sd.
MA
28
13
0
10
23
43
PsychologyPsychology
PHD
MA
3861
4230
01
79
3752
17
19
Soc.Soc. ?
?
&
&Anth.
Anth.
PHD
MA
18
9
12
5
00
9
5
2110
43
50
Spl.
Spl.
Spi.
Arrangernnts
ArrangemntsArrangemnts
MSS
MAS
PHS
20
06
12
7
3
000
6
3
1
10
18
4
25
33
30
Women's Studies
MA
14
2
0
4
6
67
Totals ?
Masters
1155
1213
44
532
1789
30
Totals ?
Doctoral
488
235
2
120
357
34
Totals
All
1643
1448
46
652
2146
30
40
Simon
Fraser
University
Completion Statistics
All Female
Students
since
Fall 1985
Report
Dated:
December
4,
?
1990
Active
Total
W/D
Department
Pgm
Now
Degree
Trf
W/D
Completed
Rate ?
(%)
ArchaeologyArchaeology
PHD
MA
9
8
2
9
00
06
15
2
40
0
Biological
Biological
Biological
Biological
Sci.Sci.Sci.Sci.
MSCMAQMPM
PHD
231710
2
1719
7
0
5000
5
2
60
28
21
12
0
N/A
42
21
10
Bus.
Bus.
Bus. Admin.Admin.Admin.
MBWMBA
MBE
2131
0
27
21
0
000
0
3
5
2630
0
N/A
10
19
ChemistryChemistry
MSC
PHD
14
9
8
3
1
2
2
0
12
4
17
0
CommunicationCommunication
MCM
PHD
29
12
21
2
0
0
90
30
2
30
0
Computing
Computing
Sci.Sci.
MSCPHD
4
3
15
1
00
3
6
21
4
75
29
Contemp. Arts
MFA
1
0
0
0
0
N/A
CriminologyCriminology
MCR
PHD
26
7
25
0
0
1
18
0
44
0
N/A
41
EconomicsEconomics
PHDMA
10
3
20
2
00
80
28
2
29
0
EducationEducationEducationEducation
MSEMEDMAEPHD
277493
5
80
78
55
0011
4239
0
6
121120
11
5
55
32
35
0
Engineering
Engineering
Engineering
Sci.Sci.Sci.
MAPMEN
PHD
2
0
1
2
00
000
000
0
2
0
N/A
N/A
0
EnglishEnglish
PHD
MA
29
3
24
6
00
18
1
42
7
43
14
GeographyGeographyGeography
MSCPHDMA
11
0
0
1
3
6
000
241
10
4
3
67
25
40
HistoryHistory
PHD
MA
15
8
8
2
01
8
3
17
5
47
60
continued...
41
Department
Simon Fraser
.
University Coinple'
?
All Female Students since
?
Report Dated: December
Active
Pgm Now Degree Trf W/D
bion Statistics
Fall 1985
4, 1990
Total ?
W/D ?
Completed Rate (%
Kinesiology
Kinesiology
MSK
PHD
15
4
14
1
0
0
3
1
17
2
18
50
Lang. & Ling.
Lang. ?
& Ling.
MA
PHD
12
1
7
1
1
0
3
0
11
1
27
0
Math. ?
& Stats.
Math. ?
& Stats.
MSC
PHD
8
4
13
3
0
0
3
1
16
4
19
25
Nat'l Res. Mgint.
MRN
25
20
0
7
27
,
?
26
Philosophy
MA
6
0
0
6
6
100
Physics
Physics
MSC
PHD
3
6
4
2
0
0
0
1
4
3
0
33
Political Sci.
MA
8
5
0
5
10
50
Psychology
Psychology
MA
PHD
23
38
25
16
1
0
4
5
30
21
13
24
Soc. ?
& Anth.
Soc. ?
& Anth.
MA
PHD
10
4
4
3
0
0
6
1
10
4
60
25
Spl. Arrangemnts
Spl. Arrangemnts
Spl. Arrangeinrits
MAS
MSS
PUS
3
0
12
5
2
6
'0
0
0
2
0
3
7
2
9
29
0
33
Women's Studies
MA
14
2
0
4
6
67
Totals ?
Masters
537
489
13
220
722
30
Totals ?
Doctoral
166
63
1
32
96
33
Totals
All
703
552
14
252
818
31
42
Simon Fraser University Completion Statistics
All Male Students since Fall 1985
Report Dated: December 4, 1990
Active ?
Tr-1
?
TAI
n
Department
Pgm
Now
Degree
Trf
W/D
Completed
LI,
1.1
Rate ?
(%)
ArchaeologyArchaeology
PHD
MA
14
3
68
00
4
5
10
13
40
38
Biological
Biological
Biological
Biological
Sci.Sci.Sci.Sci.
MSCMAQMPM
PHD
481937
0
41
32
36
0
80
0
0
10
6
5
0
465141
0
N/A
20
13
12
Bus.
Bus.
Bus.
Admin.Admin.Admin.
MBWMBA
MBE
48
64
0
125
42
0
0
00
1119
0
144
53
0
N/A
13-
21
ChemistryChemistry
MSCPHD
29
9
1717
0
7
9
7
2433
29
27
CommunicationCommunication
MCM
PHD
1319
15
3
01
0
6
22
3
27
0
Computing
Computing
Sci.Sci.
MSCPHD
2727
60
6
2
0
1111
7317
65
15
Contemp. Arts
MFA
3
0
0
0
0
N/A
CriminologyCriminology
MCR
PHD
18
13
15
0
01
22
2
38
2
100
58
EconomicsEconomics
PHD
MA
4131
2448
00
16
18
4264
43
25
EducationEducationEducationEducation
MEDMSEMAE
PHD
22501436
8839
3
1
0
0
00
3631
2
1
12470
5
2
40
50
44
29
Engineering
Engineering
Engineering
Sci.Sci.
Sd.
MAPMEN
PHD
2418
2
80
1
0
0
0
26
3
0
2711
0
N/A
27
96
EnglishEnglish
PHDMA
17
6
17
2
00
17
3
34
5
50
60
GeographyGeographyGeography
MSCPHDMA
14
11
6
11
9
6
00
0
42
5
151111
27
45
18
HistoryHistory
PHDMA
15
3
13
3
00
15
4
28
7
57
54
continued...
43
..,Simon
Fraser
University
Completion
Statistics
All Male
Students.
since
Fall 1985
Report
Dated:
December
4, ?
1990
Active
Total
W/D
Department
'
Pgm
Now
Degree
Trf
W/D
Completed
Rate ?
(%)
KinesiologyKinesiology
MSK
PHD
12
8
17
6
01
33
21
9
14
33
Lang.Lang.
??
&
&
Ling.Ling.
PHDMA
71
41
0
2
41
10
2
40
50
Math.
Math.
?
&
&
Stats.
Stats.
MSCPHD
2521
12
30
2
1
12
6
4419
27
32
Nat'l Res. Mgmt.
MRN
40
31
0
19
50
38
Philosophy
MA
3
1
0
3
4
75
PhysicsPhysics
MSC
PHD
•25
15
25
15
0
7
10
4
4219
24
21
Political Sci.
MA
20
8
0
5
13
38
PsychologyPsychology
PHD
MA
2315
1417
00
2
5
2216
23
12
Soc.Soc.
?
?
&
&Anth.
Anth.
PHD
MA
85
2
8
00
4
3
ii.
6
27
67
Spi.
Spi.
Spi.
ArrangemntsArrangemntsArrangemnts
MAS
MSS
PHS
80
3
6
2
1
000
3
1
1
92
3
33
50
33
Women's Studies
MA
0
0
0
0
0
N/A
Totals ?
Masters
618
724
31
312
1067
29
Totals ?
Doctoral
322
172
1
88
-
?
261
34
Totals
All
940
896
32
400
1328
30
Doctoral
Simon Fraser University
Distribution of S.F.U. Awards
Fall 1990
er's GF 50.3%
Stipend ?
10.1%
Doctoral Entrance
?
5.0%
GF = Graduate Fellowship
All Awards
Total = 179
Master's Entrance 3.9%
Master's
62.1%
Doctoral
37.9%
Master's
43.8%
Doctoral
56.3%
Masters
67.9%
Doctoral
32.1 %
Doctoral
21.3%
• ?
45 ?
1
I
Simon Fraser University
Distribution of S.F.U. Awards
?
11
Fall 1990
Graduate Fellowship
?
Total = 145
Entrance Scholarship ?
Total =
16
Full Time Enrolment
?
1st Yr. FT Enrolment
Total = 1430
?
Total =
436
Distributions of Full-Time Enrolments are?
shown for comparison
Male
61.0%
Male 495°,
Female
50.5%
Female 39.0%
Female
44.5%
Female
34.6%
Simon Fraser University
Gender Distribution of S.F.U. Awards
Fall 1990
EEO
Master's Awards
?
Doctoral Awards
Total = 97
?
Total = 82
Male
55.5%
?
Male
65.4%
FT Master's Enrolment
?
FT Doctoral Enrolment
Total = 970
?
Total =
460
• Gender Distributions of Full-Time Students
are shown for comparison
Smters 1-3 35.1%
_..iesters7- 27.8%
Master's ?
Total Awards = 97
I
I
•i
Semesters 4-6 37.
47. ?
•i
I
1
1
Simon Fraser University
Semesters of Tenure of S.F.U. Awards
Fall 1990
Semesters 10- 40.2%
Doctoral ?
Total Awards = 82
Graduate Fellowships, Entrance Scholarships and
President's Ph.D Research Stipends are included
Semesters 4-6 1
Semesters 7-9 17.1%
•1
I
I
I
I
I
esters 1-3 28.0%
Simon Fraser University
Distribution of S.F.U. Awards by Semester in Program
?
All Students - Fall 1990
S FU
GF
PRS Ent
Awards
FT
SFU
Program
Sem.
90
90 90 Total
90-3
Awards/FT
Master's
1-3 27
0 7
34
343
9.9%
4-6 36
0
0 36
244
14.8%
7- 27
0 0
27
384
7.0%
Subtotal
90
0 7
97
971
10.0%
Doctoral
1-3
14 0
9
23
93
24.7%
4-6
10
2
0
12
85
14.1%
7-9
9
5
0 14
64
21.9%
10-
22
11
0
33
217
15.2%
Subtotal
55
18
9
82
459
17.9%
Grand Total
145
18 16
179
1430
12.5%
GF = Graduate Fellowships
PRS = President's Ph.D. Research Stipends
Ent = S.F.U. Entrance Scholarships
FT = Full-Time Enrolment
scholr3 .wkl
49
Simon
Fraser
University
Distribution of
S.F.U.
Awards by Semester
in Program
Male
Students
- Fall 1990
S FU
GF PRS
Ent
Awards
FT
SFU
Program ?
Sem.
90
90
90
Total
90-3
Awards/FT
Master's ?
1-3
14
0
4
18
196
9.1%
4-6
21
0
0
21
145
14.5%
7-
9
0
0
9
198
4.5%
Subtot Master's
44
0
4
48
539
8.9%
Doctoral ?
1-3
8
0
3
11
63
17.5%
7-94-6
7
6
2
1
0
0
88
55
43
14.5%
18.6%
10-
13
10
0
23
139.
16.5%
Subtotal PhD
34
13
3
50
300
16.7%
Total Male
78
13
7
98
839
11.7%
• Female Students - Fall 1990
S FU
GF PRS Ent Awards FT
?
SFU
Program ?
Seni. ?
90 90 90 Total 90-3 Awards/FT
Master's ?
4-6
7-1-3
181315
000
3
0
0
181615
186147
99
10.9%
15.2%
9.7%
Subtotal Master's
46
0
3
49
432
11.3%
Doctoral ?
7-910-4-6
1-3
9
2
4
6
4
100
0
0
0
6
1012
46
21
783030
12.8%
28.6%
40.0%
13.3%
Subtotal PhD
21
5
6
32
159
20.1%
Total Female
67
5
9
81
591
13.7%
Grand Total
145
18
16
179
1430
12.5%
GF = Graduate Fellowships
PRS = President's Ph.D. Research Stipends
Ent = S.F.U. Entrance Scholarships
FT = Full-Time Enrolment
scholr4 .wkl
Simon Fraser
University
Distribution
of
S.F.U. Awards by
Semester in Program
All
Students
- Fall
1989
SFU
GF
PRS
Ent
Awards
FT
SFU
Program
Sem.
89
89
89
Total
89-3
Awards/FT
Master's
1-3
19
0
7
26
337
7.7%
4-6
30
0
0
30
263
11.4%
7-
21
0
0
21
285
7.4%
Subtotal
70
0
7
77
885
8.7%
Doctoral
1-3
10
0
3
13
81
16.0%
4-6
17
1
0
18
83
21.7%
7-9
10
1
0
11
87
12.6%
10-
20
16
0
36
193
18.7%
Subtotal
57
18
3
82
444
17.6%
Grand Total
127
18
10
155
1329
11.7%
GF = Graduate Fellowships
PRS = President's Ph.D. Research Stipends
Ent = S.F.U. Entrance Scholarships
FT = Full-Time Enrolment
scholrl . wkl
50
Master's
44.4%
Doctoral
55.6%
Master's
50.0%
Doctoral
50.0%
Master's
67.9%
Master's
70
70L
Doctoral
21.3%
Doctoral
32.1 %
51
-
?
Simon Fraser University
Distribution of External Awards
Fall 1990
Federal Awards
?
B.C. Awards
Total =
63
?
Total =
20
Full Time Enrolment
?
1st Yr. FT Enrolment
Total =
1430
?
Total =
436
Distributions of Full-Time Enrolments are?
shown for comparison
Semesters 4-6 i
emesters 7-15.8%
Simon Fraser University
Semesters of Tenure of External Awards
Fall 1990
Semesters 1-3 52.6%
52
Master's ?
Total Awards = 38
mesters 1-324.4%
esters 10-31.1%
Doctoral ?
Total Awards = 45
Federal (NSERC, SSHRC, MRC etc.) and?
Provincial (G.R.E.A.T.) Awards are included
Semesters 79 24.4c
Semesters 4-6 on '°'-
35 ?
10
63 ?
20
Government
Council of
ne Enrolmen
45 ?
459 ?
9.8%
83 1430 ?
5.8%
Scholarships (NSERC, etc.)
B.C. G.R.E.A.T. Awards
b
Simon Fraser University
Distribution of External Awards by Semester in Program
All Students - Fall 1990
Fed. ?
GREAT Ext. FT
?
Ext.
Program ?
Sent. ?
89 ?
89
?
Total ?
89-3 ?
Awards/FT
Master's 1-3
7-
4-6
???
16
9
3
???
3
4
3
???
20
12
6
???
244384343 ???
4.9%
5.8%
1.6%
Subtotal
?
28
?
10 ?
38 ?
971 ?
3.9%
Doctoral 1-3
?
11
?
0 ?
11 ?
93 ?
.11.8%
4-6 ?
5 ?
4 ?
9 ?
85 ?
10.5%
7-9 ?
11
?
0 ?
11 ?
64 ?
17.2%
10- ?
8 ?
6 ?
14 ?
217 ?
6.5%
Subtotal
Total
Fed. = Federal
GREAT = Science
FT ?
= Full Ti:
scholr3 .wkl
•i
I
I
scholrl .wkl
I
I.
I
Simon Fraser University
Distribution of
External
Awards
by
Semester in Program
All Students - Fall
1989
Fed. GREAT Ext. FT
Ext.
Program ?
Sem.
89 ?
89 Total
89-3
Awards/FT
Master's ?
1-3
11 ?
1
12 337
3.6%
4-6 17 ?
3 20 263
7.6%
7-
4 ?
2 6
285
2.1%
- Subtotal--
32
38 885
4.2%--- ?
-- - ?
- -
Doctoral ?
1-3
5
?
2
7
81
8.6%
4-6
10
?
1
11
83
13.3%
• ?
7-9
12
?
5
17
87
19.5%
10-
11
?
0
11 193
5.7%
Subtotal
38 ?
8
46 444
10.3%
Total
70 ?
14 84
1329
6.3%
Fed. ?
= Federal Government
Scholarships
(NSERC, ?
etc.)
GREAT = Science
Council of
B.C.
G.R.E.A.T. Awards
FT ?
= Full Time
Enrolment
54
I
I