% Sj
C
For Information
SIMON FRASER UNIVERSITY
DEAN OF GRADUATE STUDIES?
Memorandum
S.94-22
TO: W.RHeath
?
FROM: B.P. Clayman
Registrar
?
Dean of Graduate Studies
SUBJECT: Annual Report of the SGSC
?
DATE: February 3, 1994
I am pleased to enclose the 1993 annual report of the Senate Graduate Studies Committee.
Enclosures
c. M. McGinn
El
.
c..
SIMON FRASER UNIVERSITY
I1 ?
101
II
kkY))
Senate Graduate Studies Committee
1993 REPORT TO SENATE
The Dean of Graduate Studies is responsible for the general supervision of graduate work at the
University and chairs the Senate Graduate Studies Committee. This report outlines the position
of graduate studies at Simon Fraser University, describes some changes made in 1993 and makes
recommendations for future directions.
The enclosed copy of the 1993 S.F.U. Graduate Studies Fact Book describes, in quantitative
terms, the graduate student body in Fall 1993 and provides some retrospective data on comple-
tion rates. It is the fourth edition. It is designed to complement information in the Simon Fraser
University Fact Book, produced by the Office of Analytical Studies.
0
?
I. Enrolments and Degrees
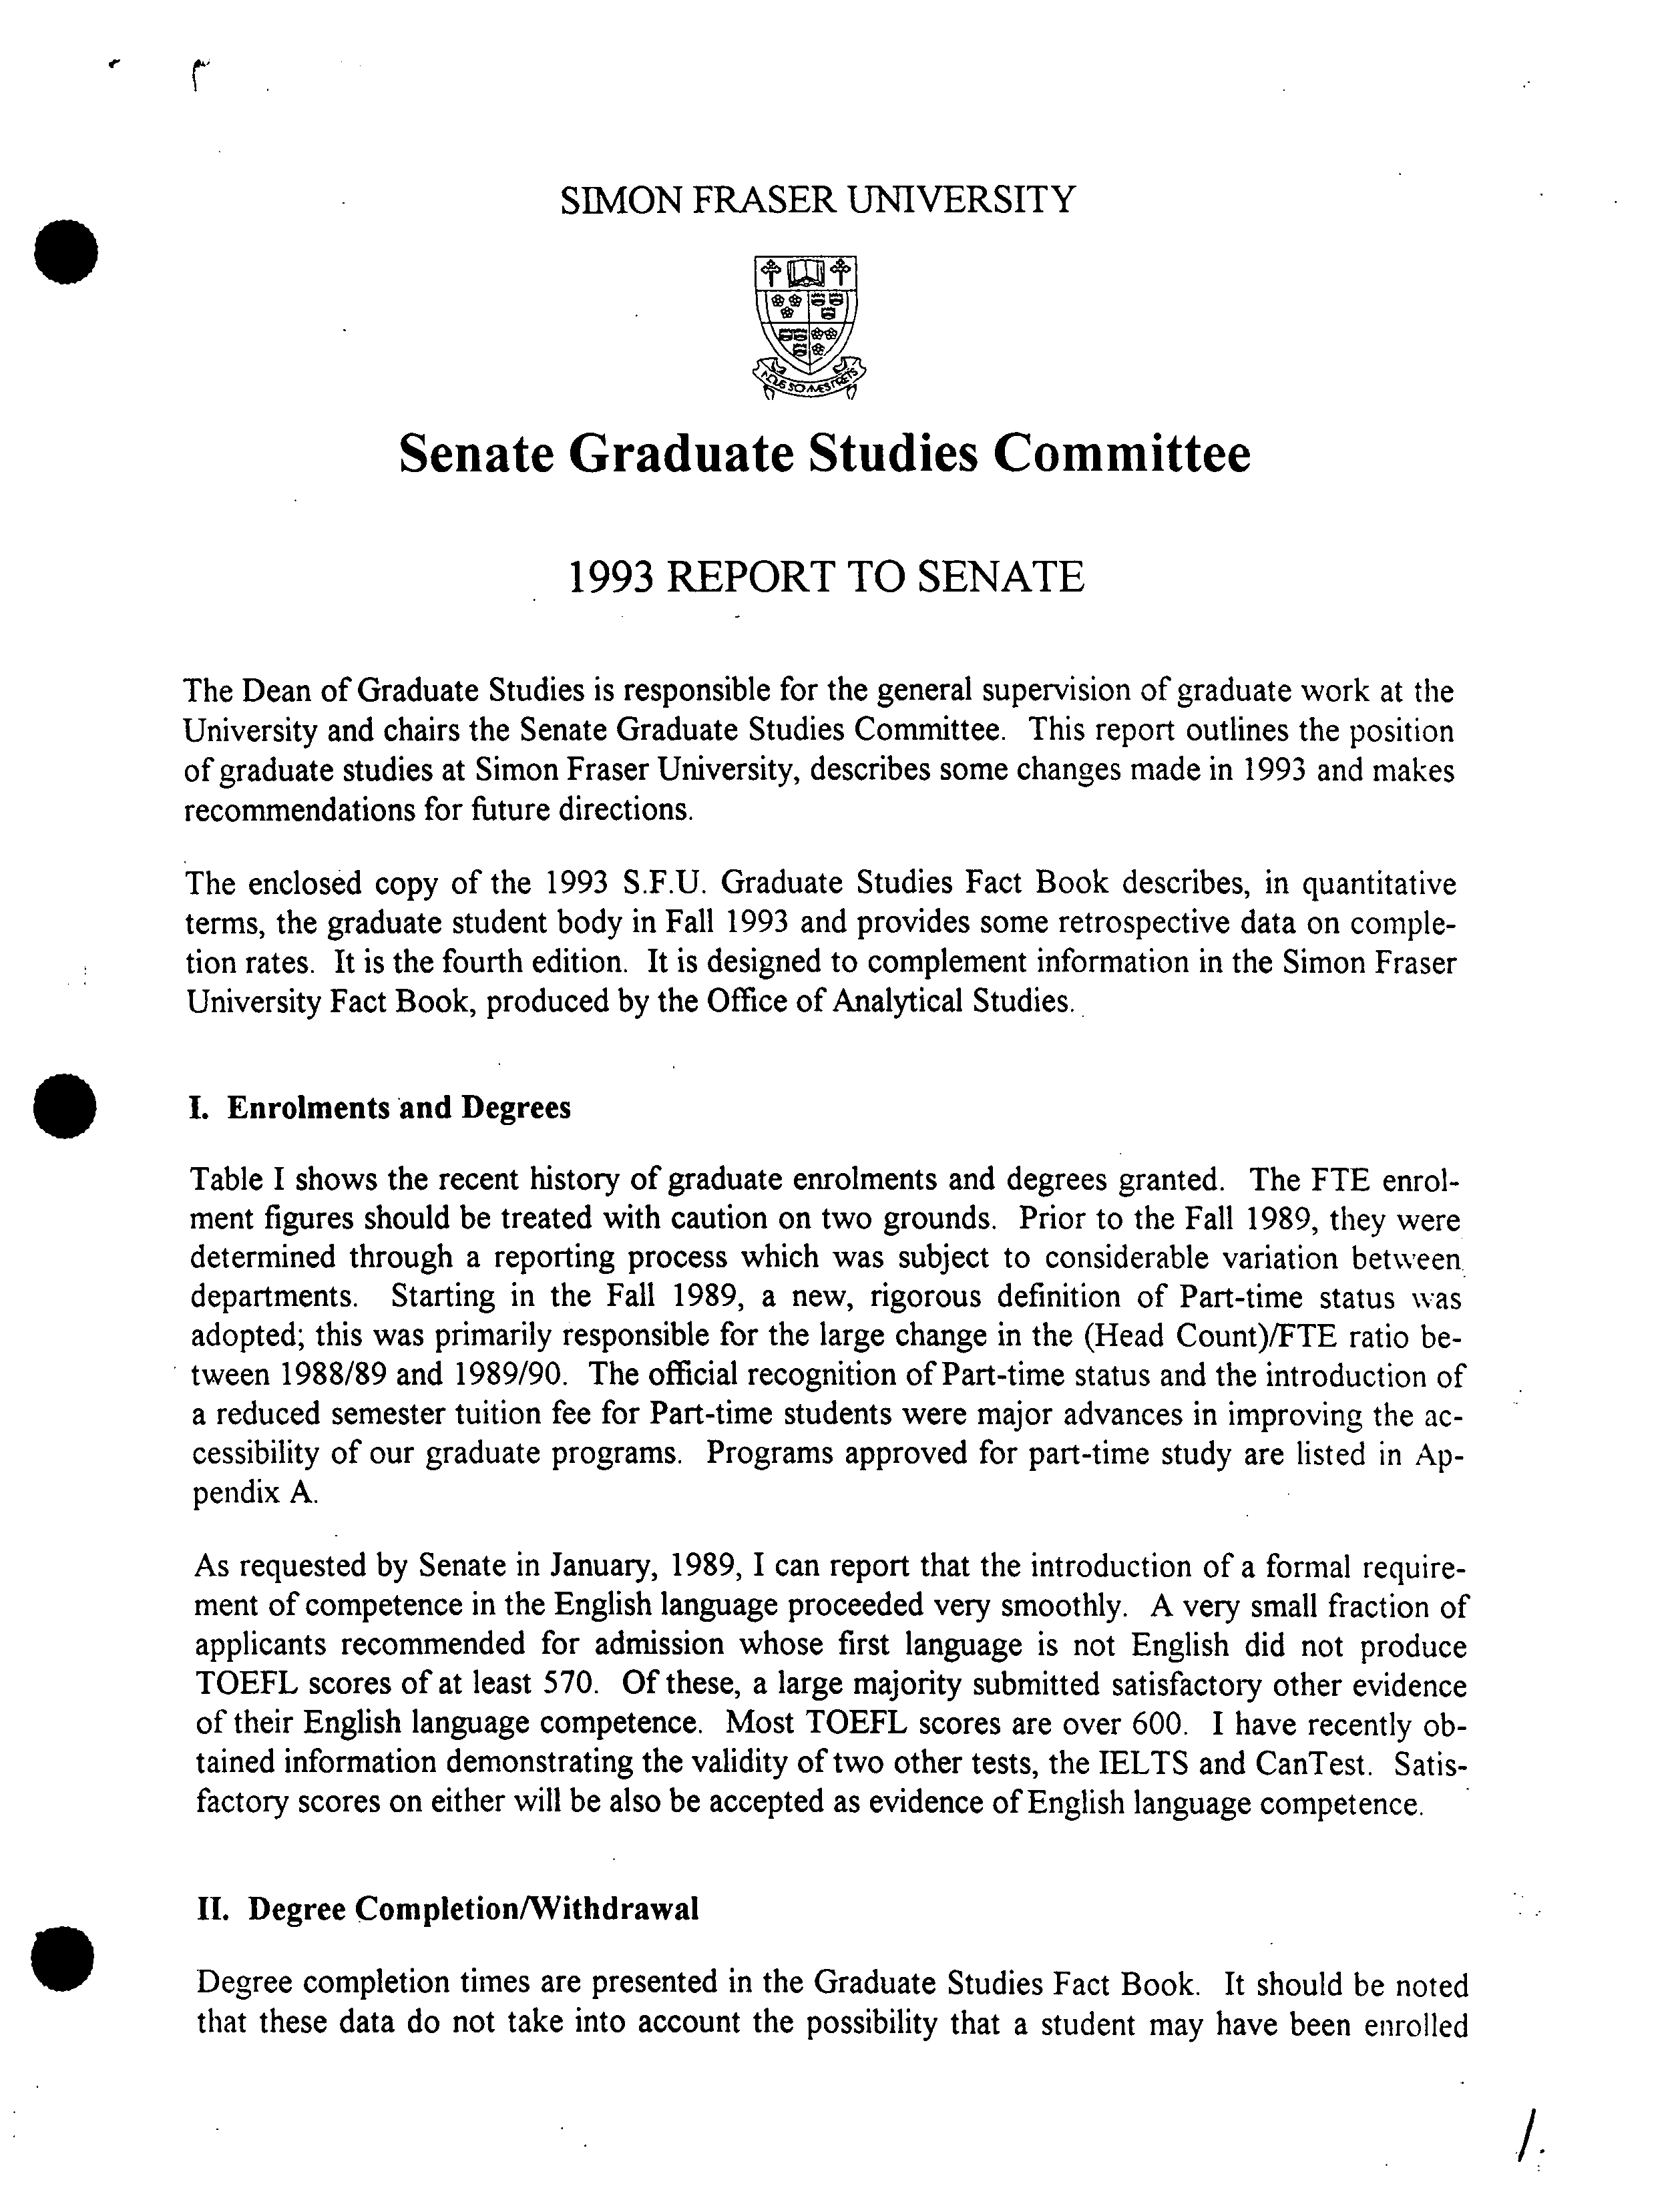
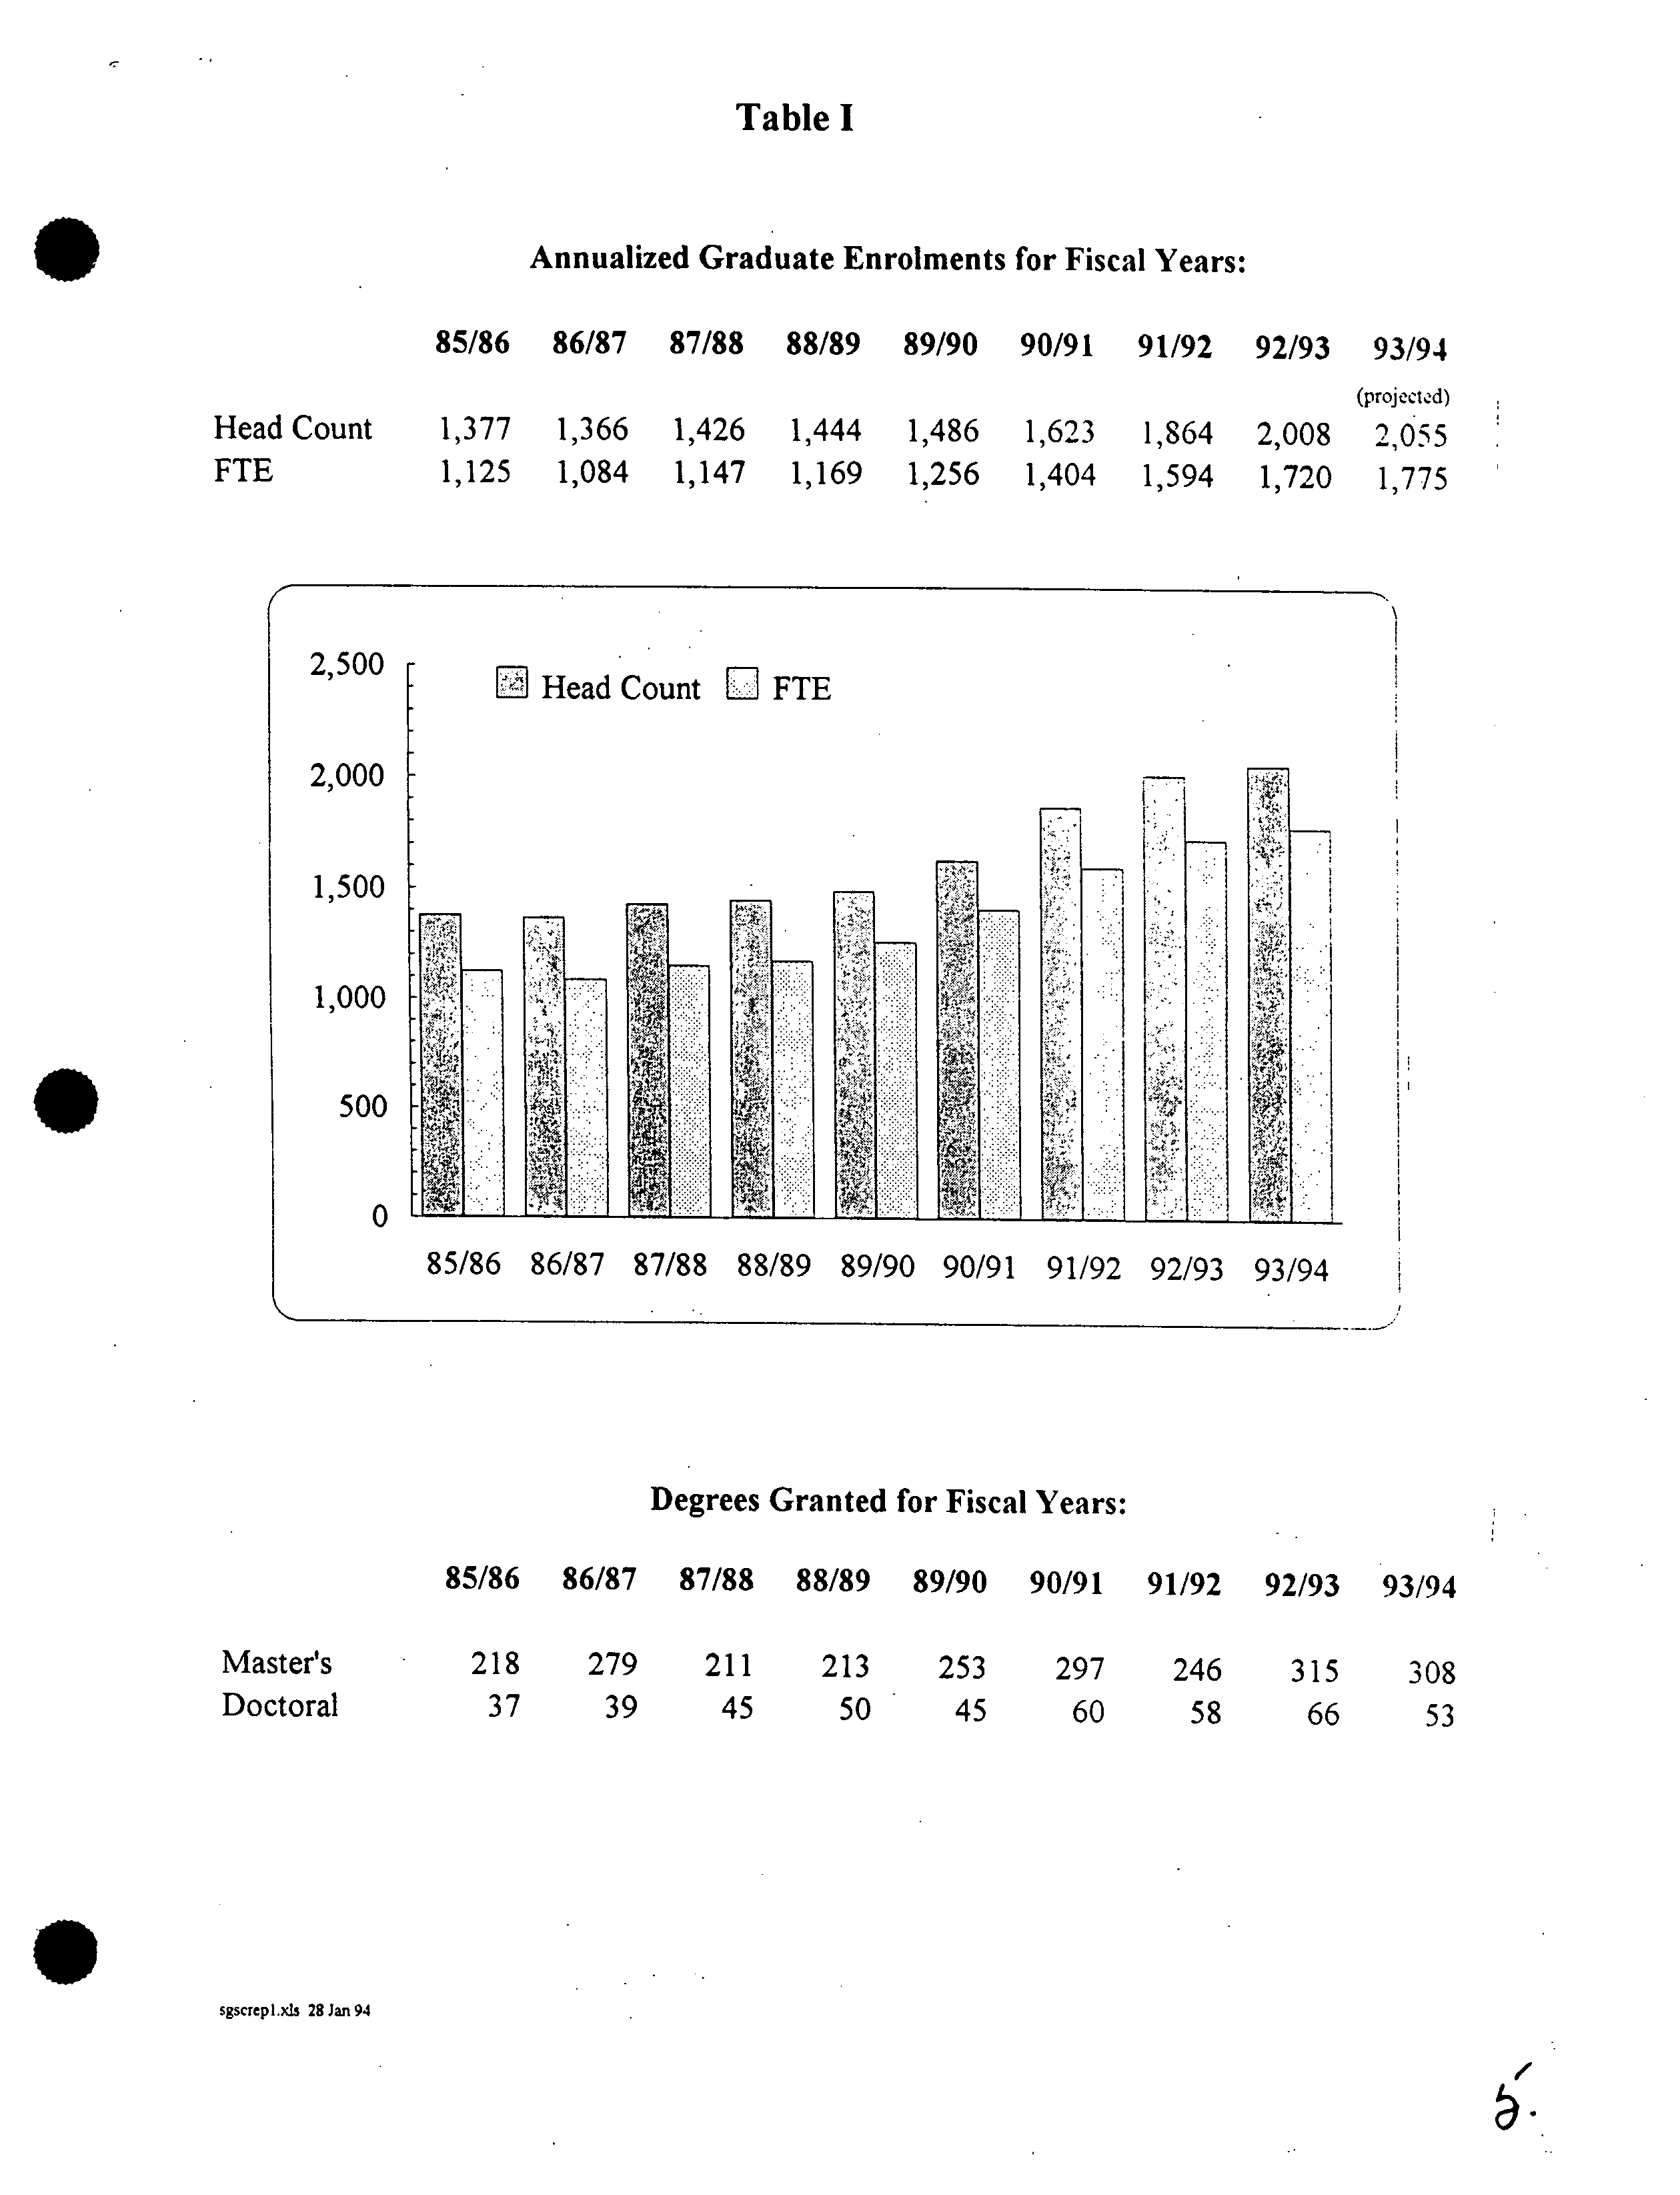
Table I shows the recent history of graduate enrolments and degrees granted. The FTE enrol-
ment figures should be treated with caution on two grounds. Prior to the Fall 1989, they were
determined through a reporting process which was subject to considerable variation between
departments. Starting in the Fall 1989, a new, rigorous definition of Part-time status was
adopted; this was primarily responsible for the large change in the (Head Count)/FTE ratio be-
tween 1988/89 and 1989/90. The official recognition of Part-time status and the introduction of
a reduced semester tuition fee for Part-time students were major advances in improving the ac-
cessibility of our graduate programs. Programs approved for part-time study are listed in Ap-
pendix A.
As requested by Senate in January, 1989, I can report that the introduction of a formal require-
ment of competence in the English language proceeded very smoothly. A very small fraction of
applicants recommended for admission whose first language is not English did not produce
TOEFL scores of at least 570. Of these, a large majority submitted satisfactory other evidence
of their English language competence. Most TOEFL scores are over 600. I have recently ob-
tained information demonstrating the validity of two other tests, the JELTS and CanTest. Satis-
factory scores on either will be also be accepted as evidence of English language competence.
•
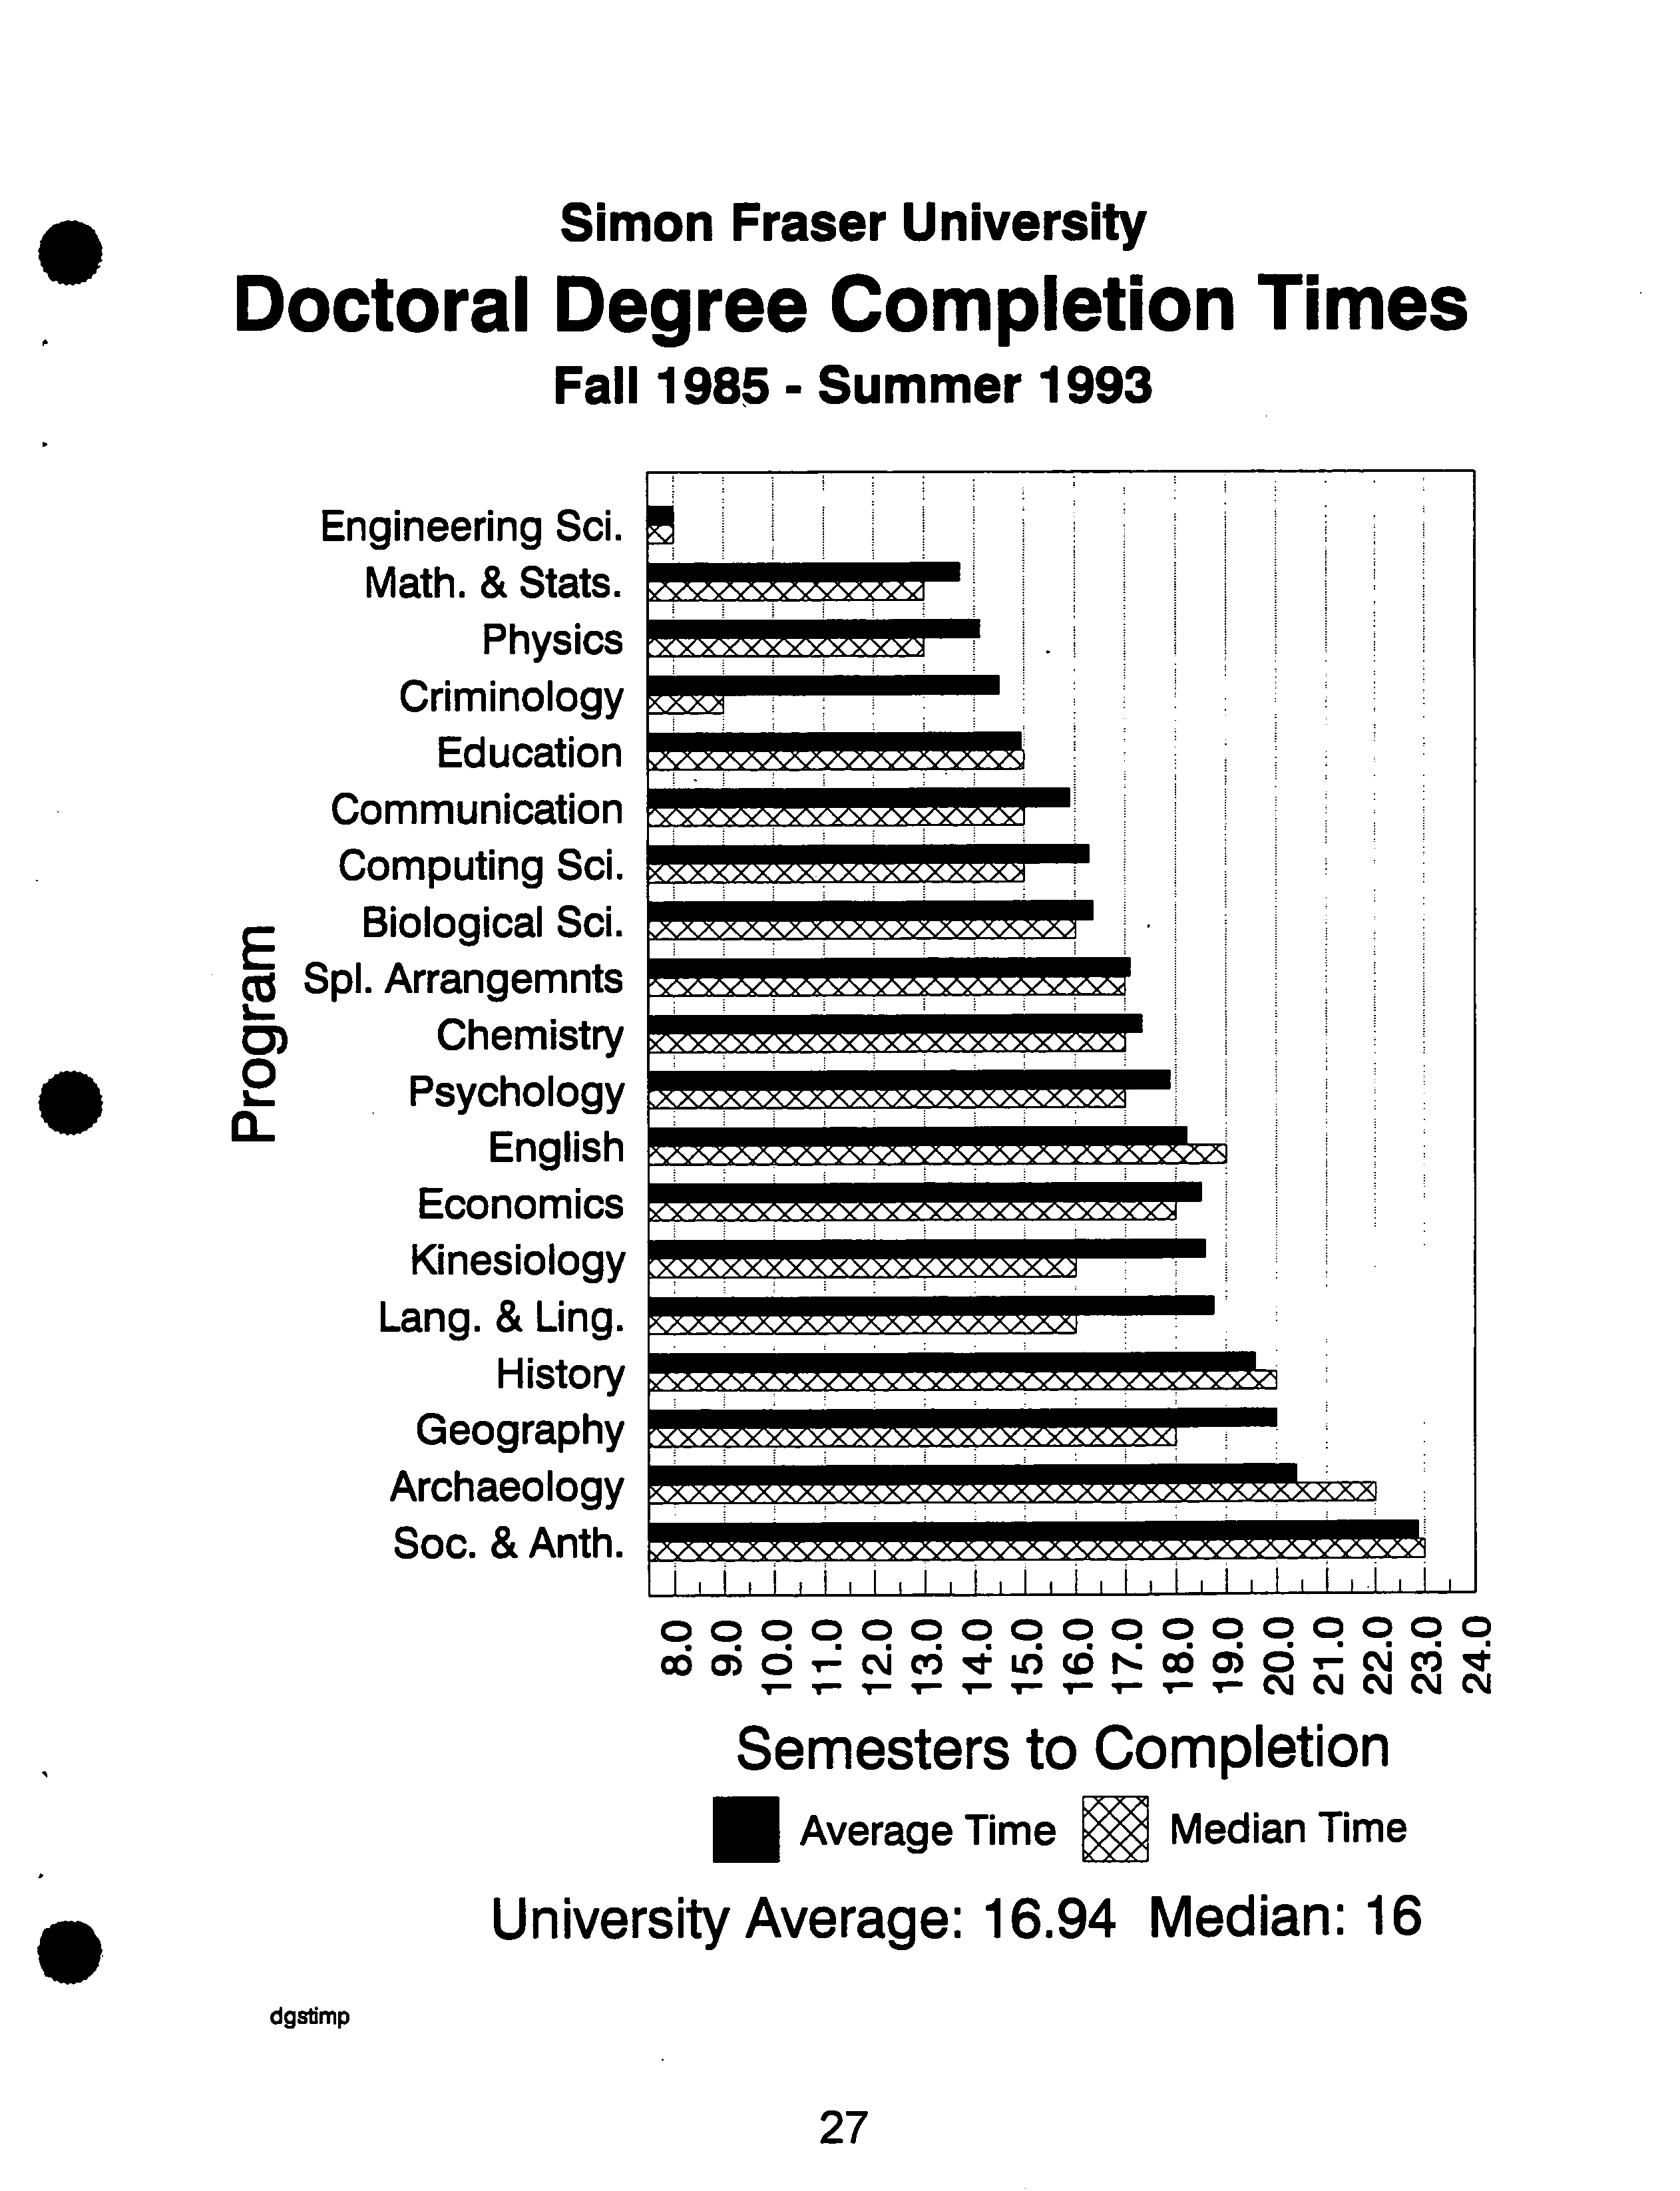
Degree
II. Degree
completion
Corn pletionfWithd
times are presented
rawal
in the Graduate Studies Fact Book. It should be noted
that these data do not take into account the possibility that a student may have been enrolled
I.
1993 S.G.S.C. Report to Senate
?
. Page 2
part-time for all or part of the program and thus overstate-completion times, especially for pro-
grams with large numbers of part-time students.
I remain concerned by what appear in many cases to be excessive times for degree completion.
When resources are limited, it is especially important that they be used effectively and efficiently.
I am actively encouraging departments to ensure both that their degree requirements are realistic
and that their students make satisfactory progress, as required by Senate regulations, toward
meeting those requirements. The Graduate Studies Handbook, first published in
1991,
contains
guidelines for supervisors and students that (if followed) should improve prospects for expedi-
tious degree completion. I am also considering more rigorous enforcement of the regulations
requiring annual progress reports.
I am also pressing for timely appointment of supervisory committees. In establishing the
Graduate Studies Database, I encountered many students who had been here for several years,
yet apparently had no supervisory
.
committees. This situation has largely been remedied; each
semester, reminders about 'delinquent' students are sent to departments by my office; a minor
flood of committee recommendations follows.
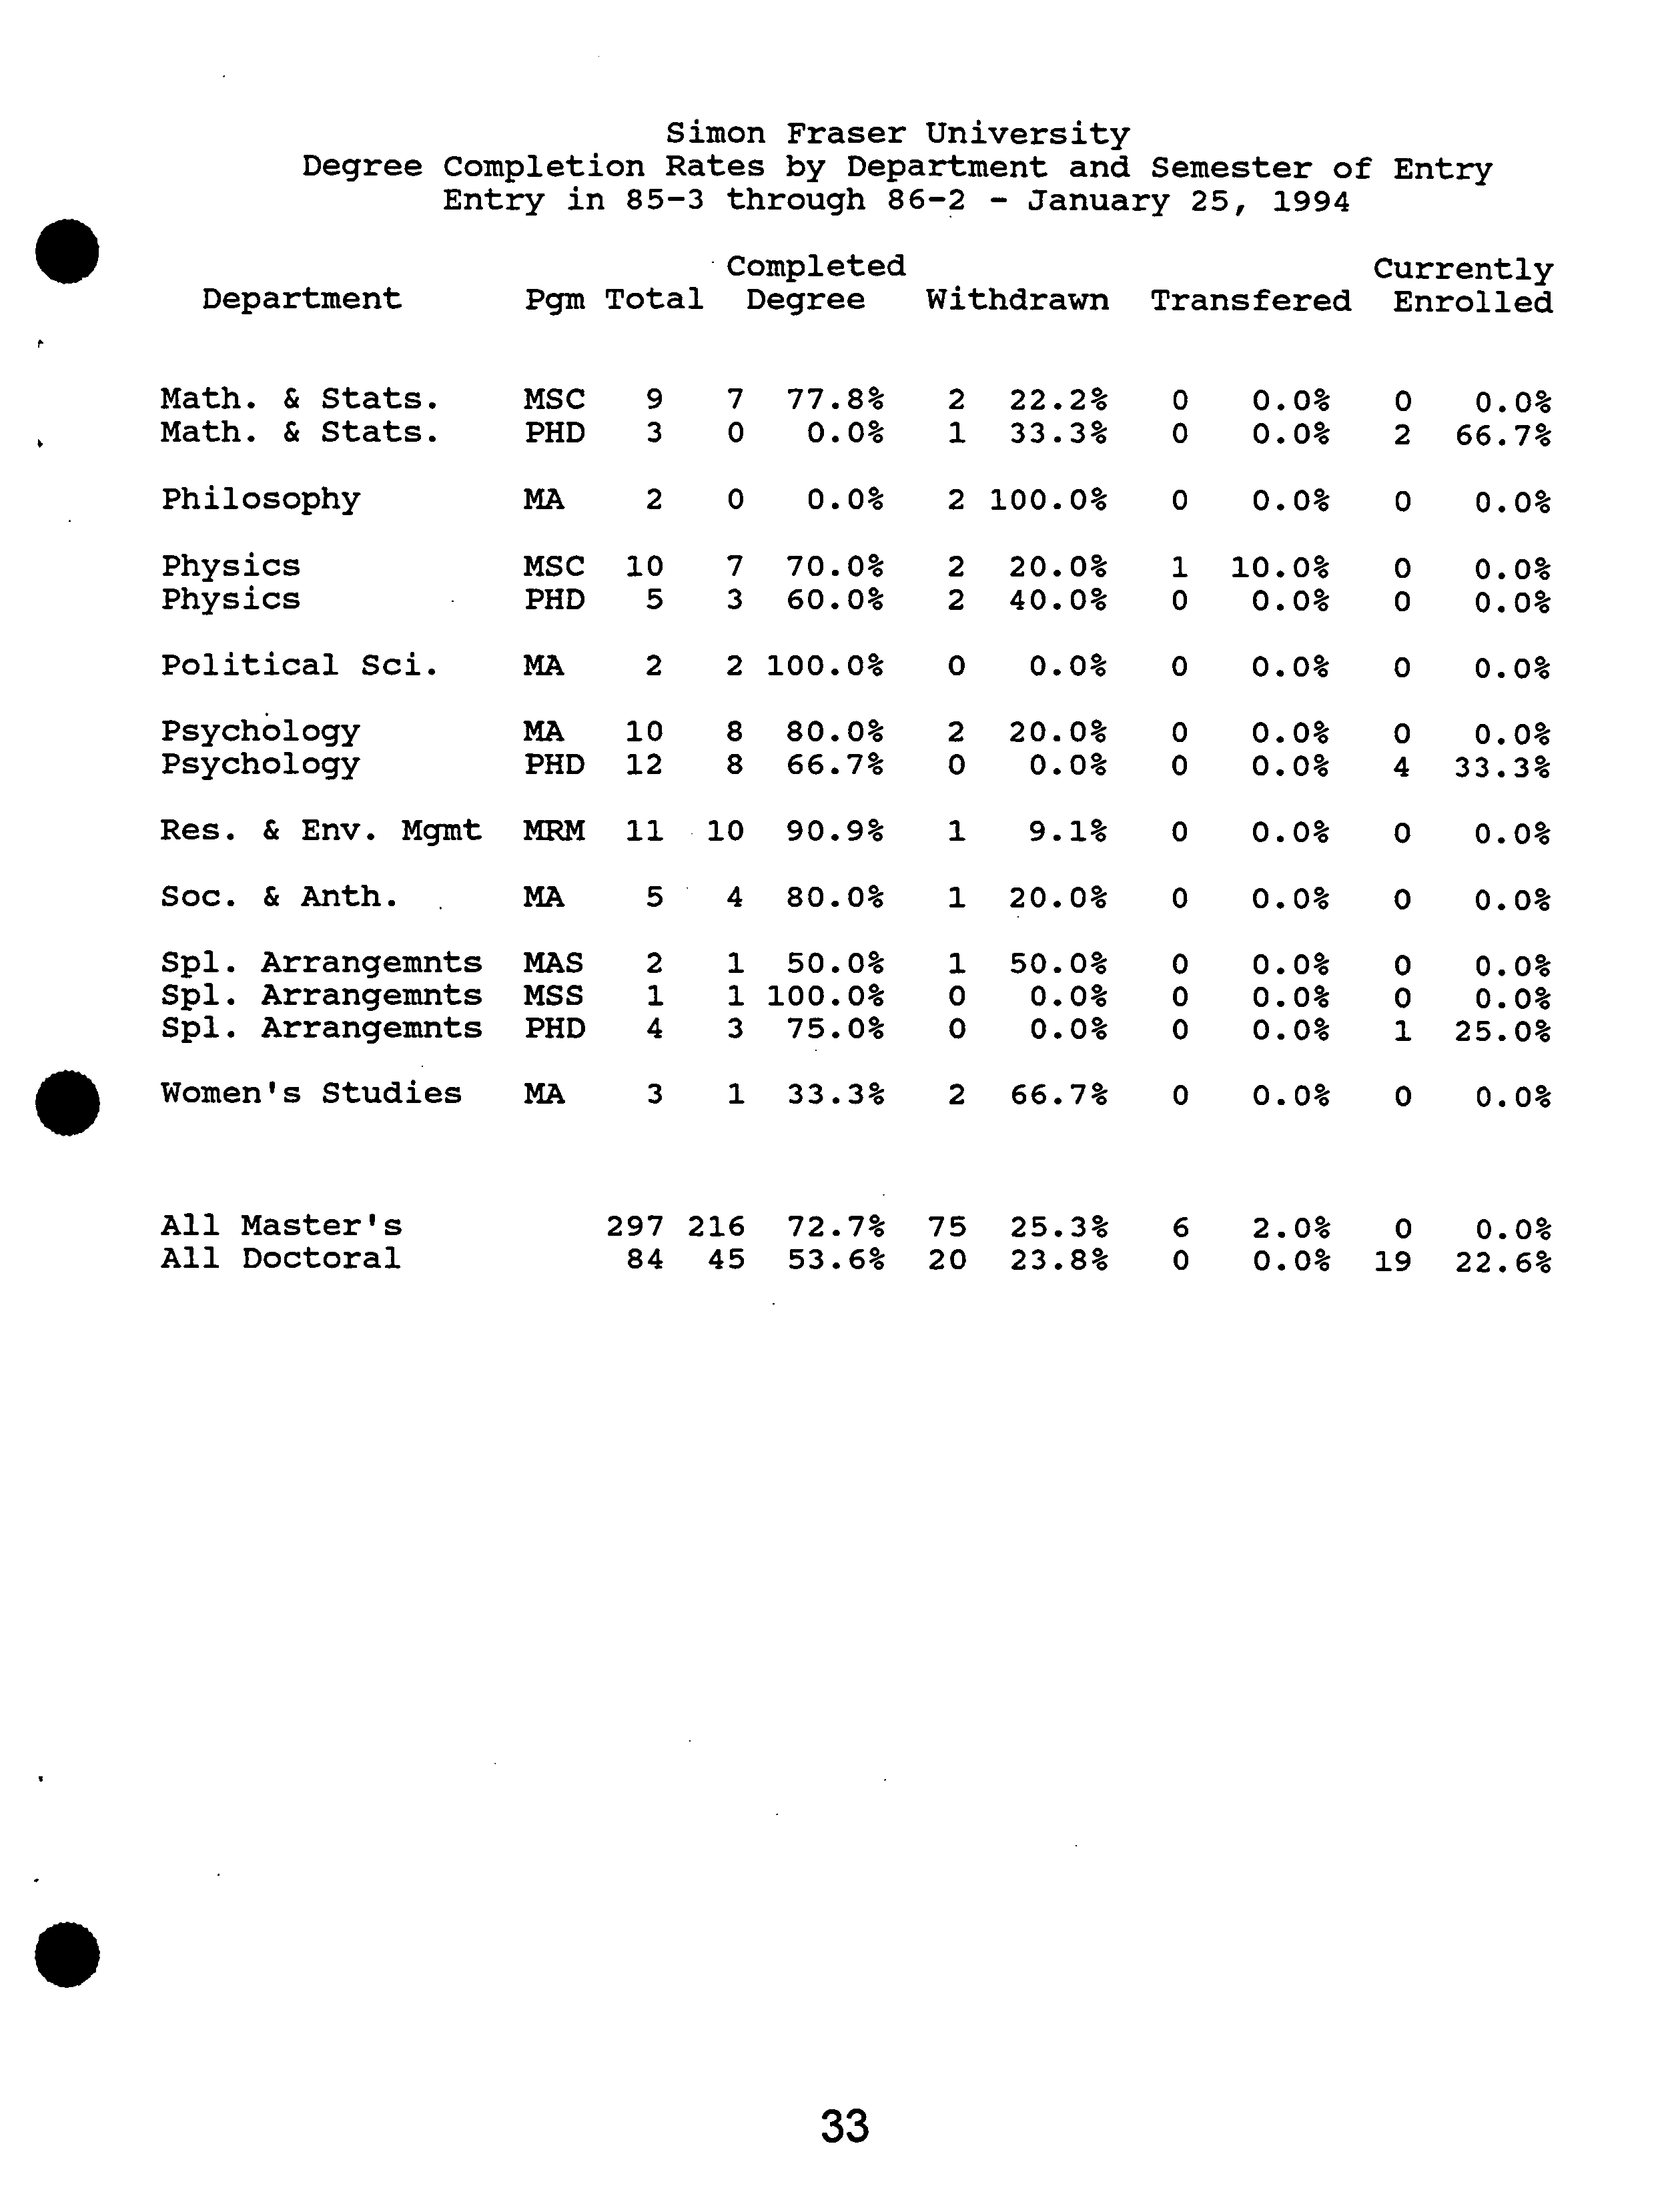
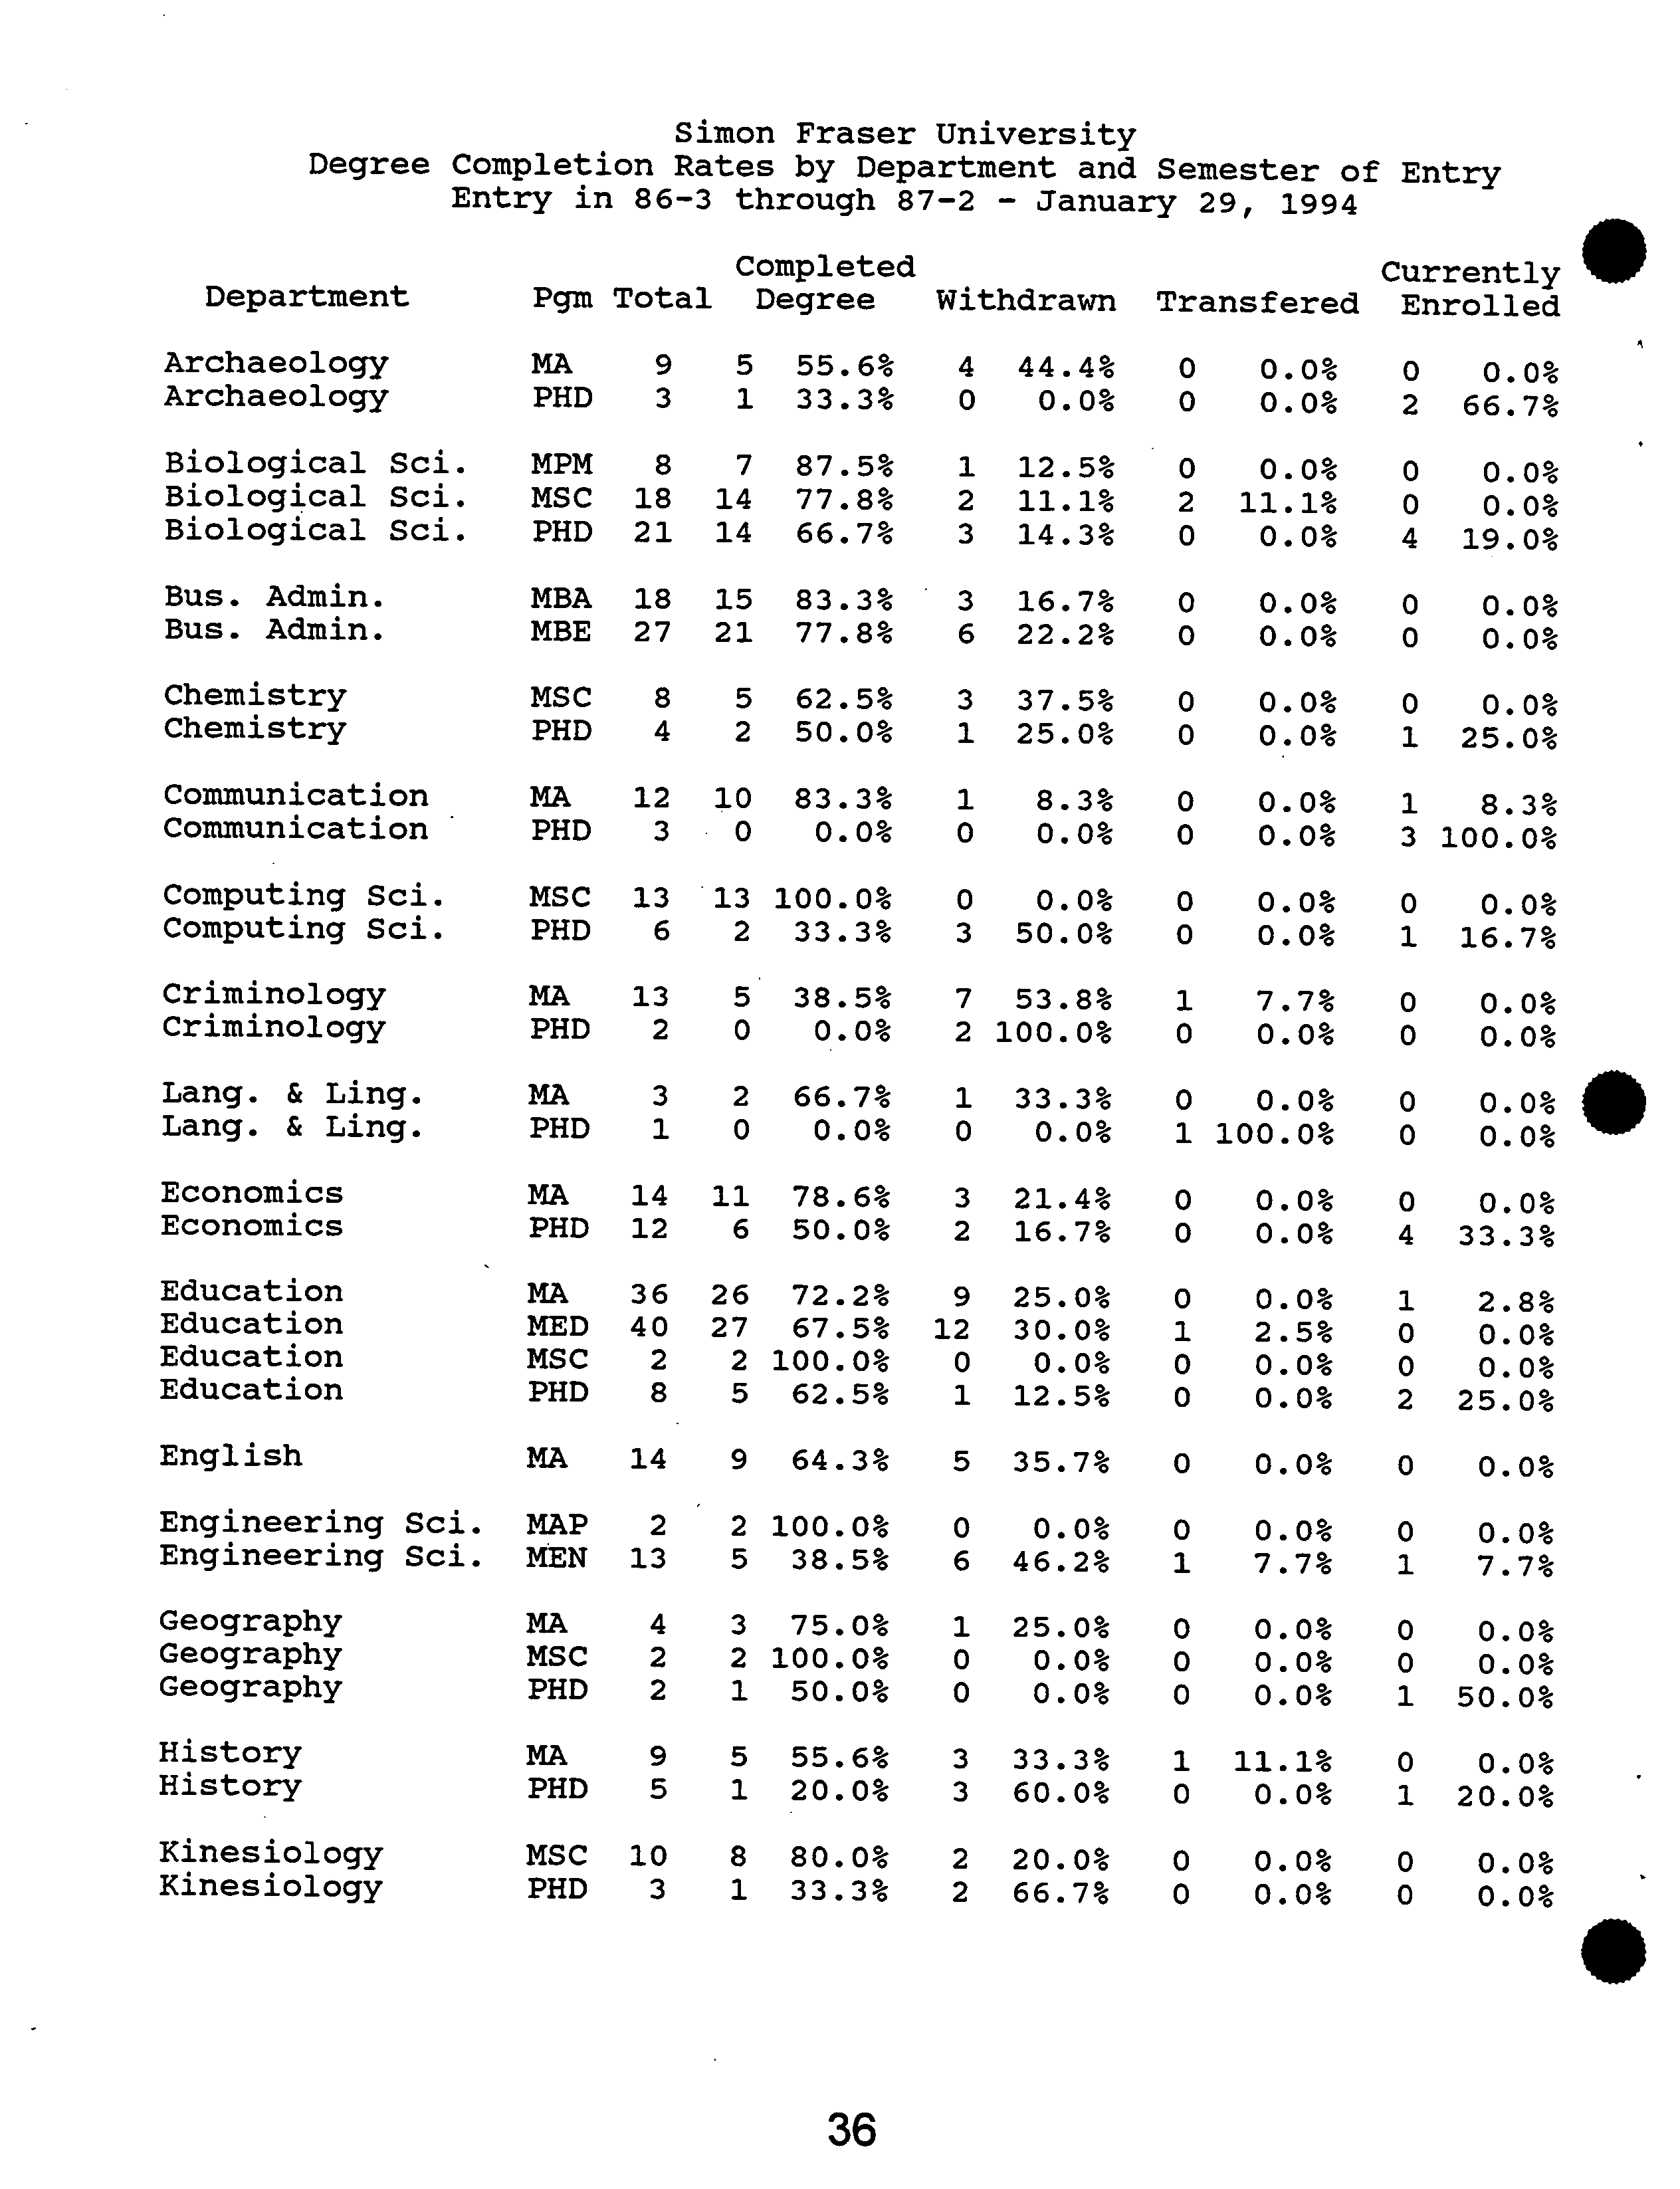
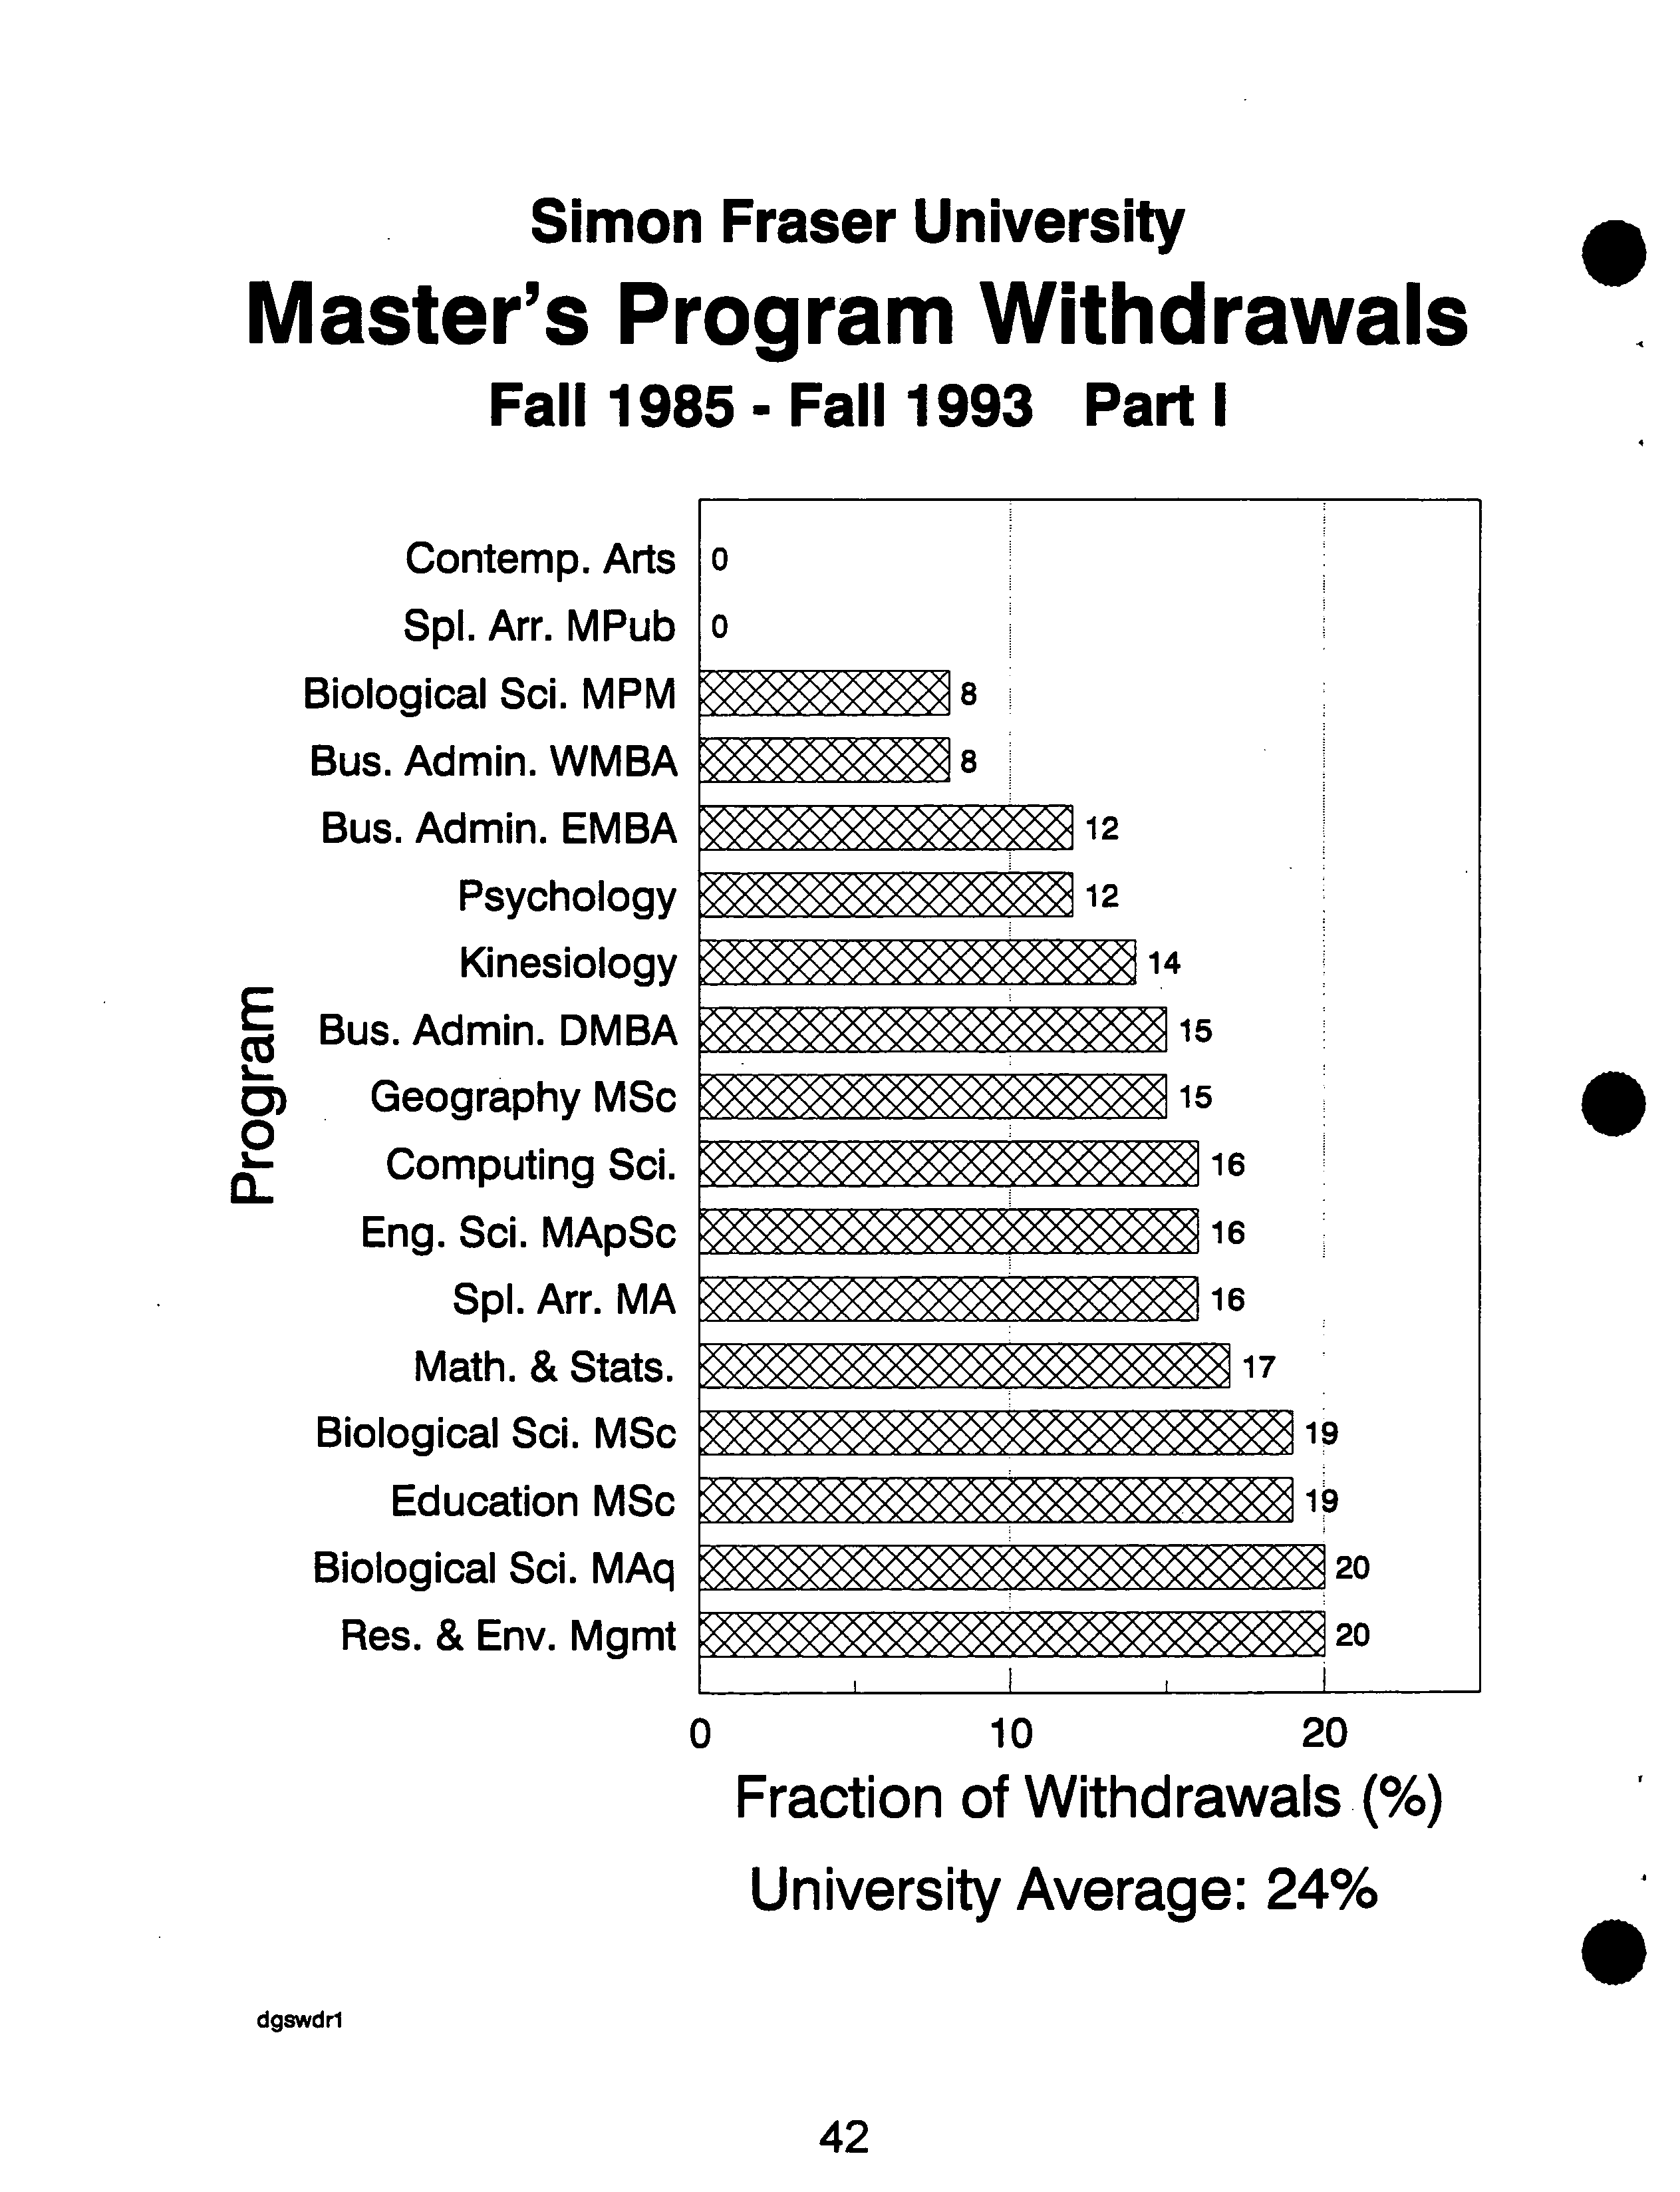
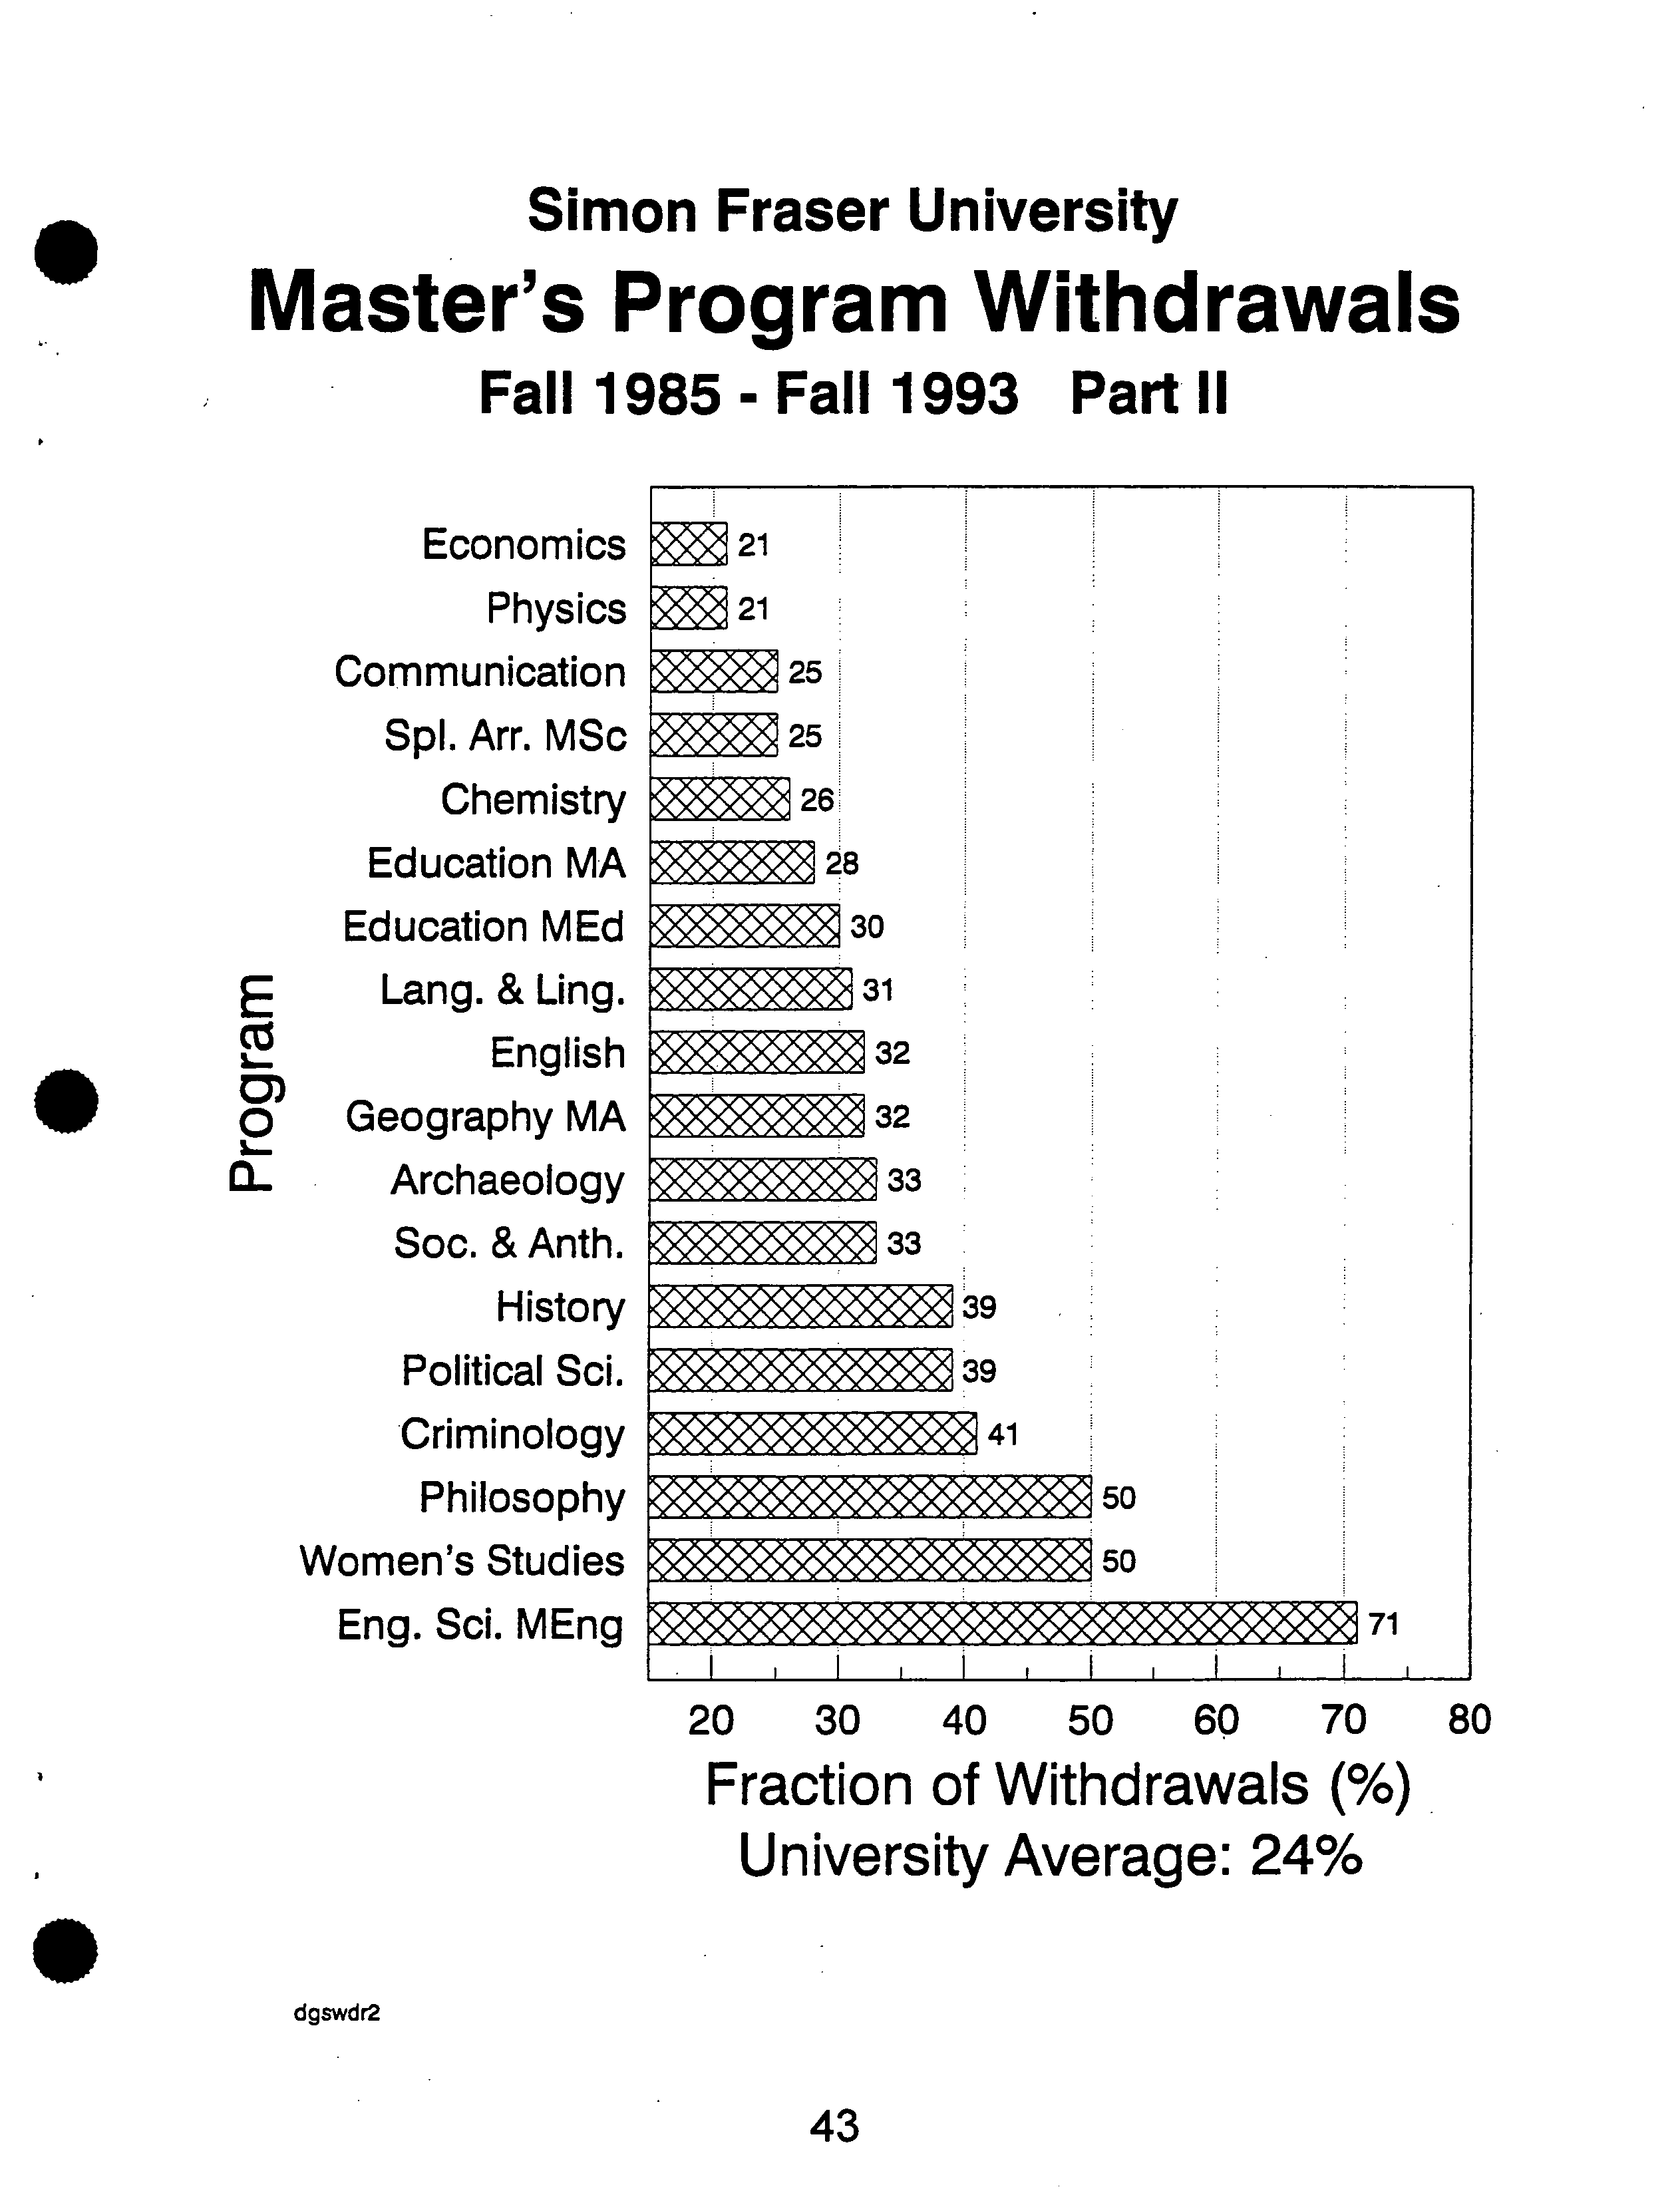
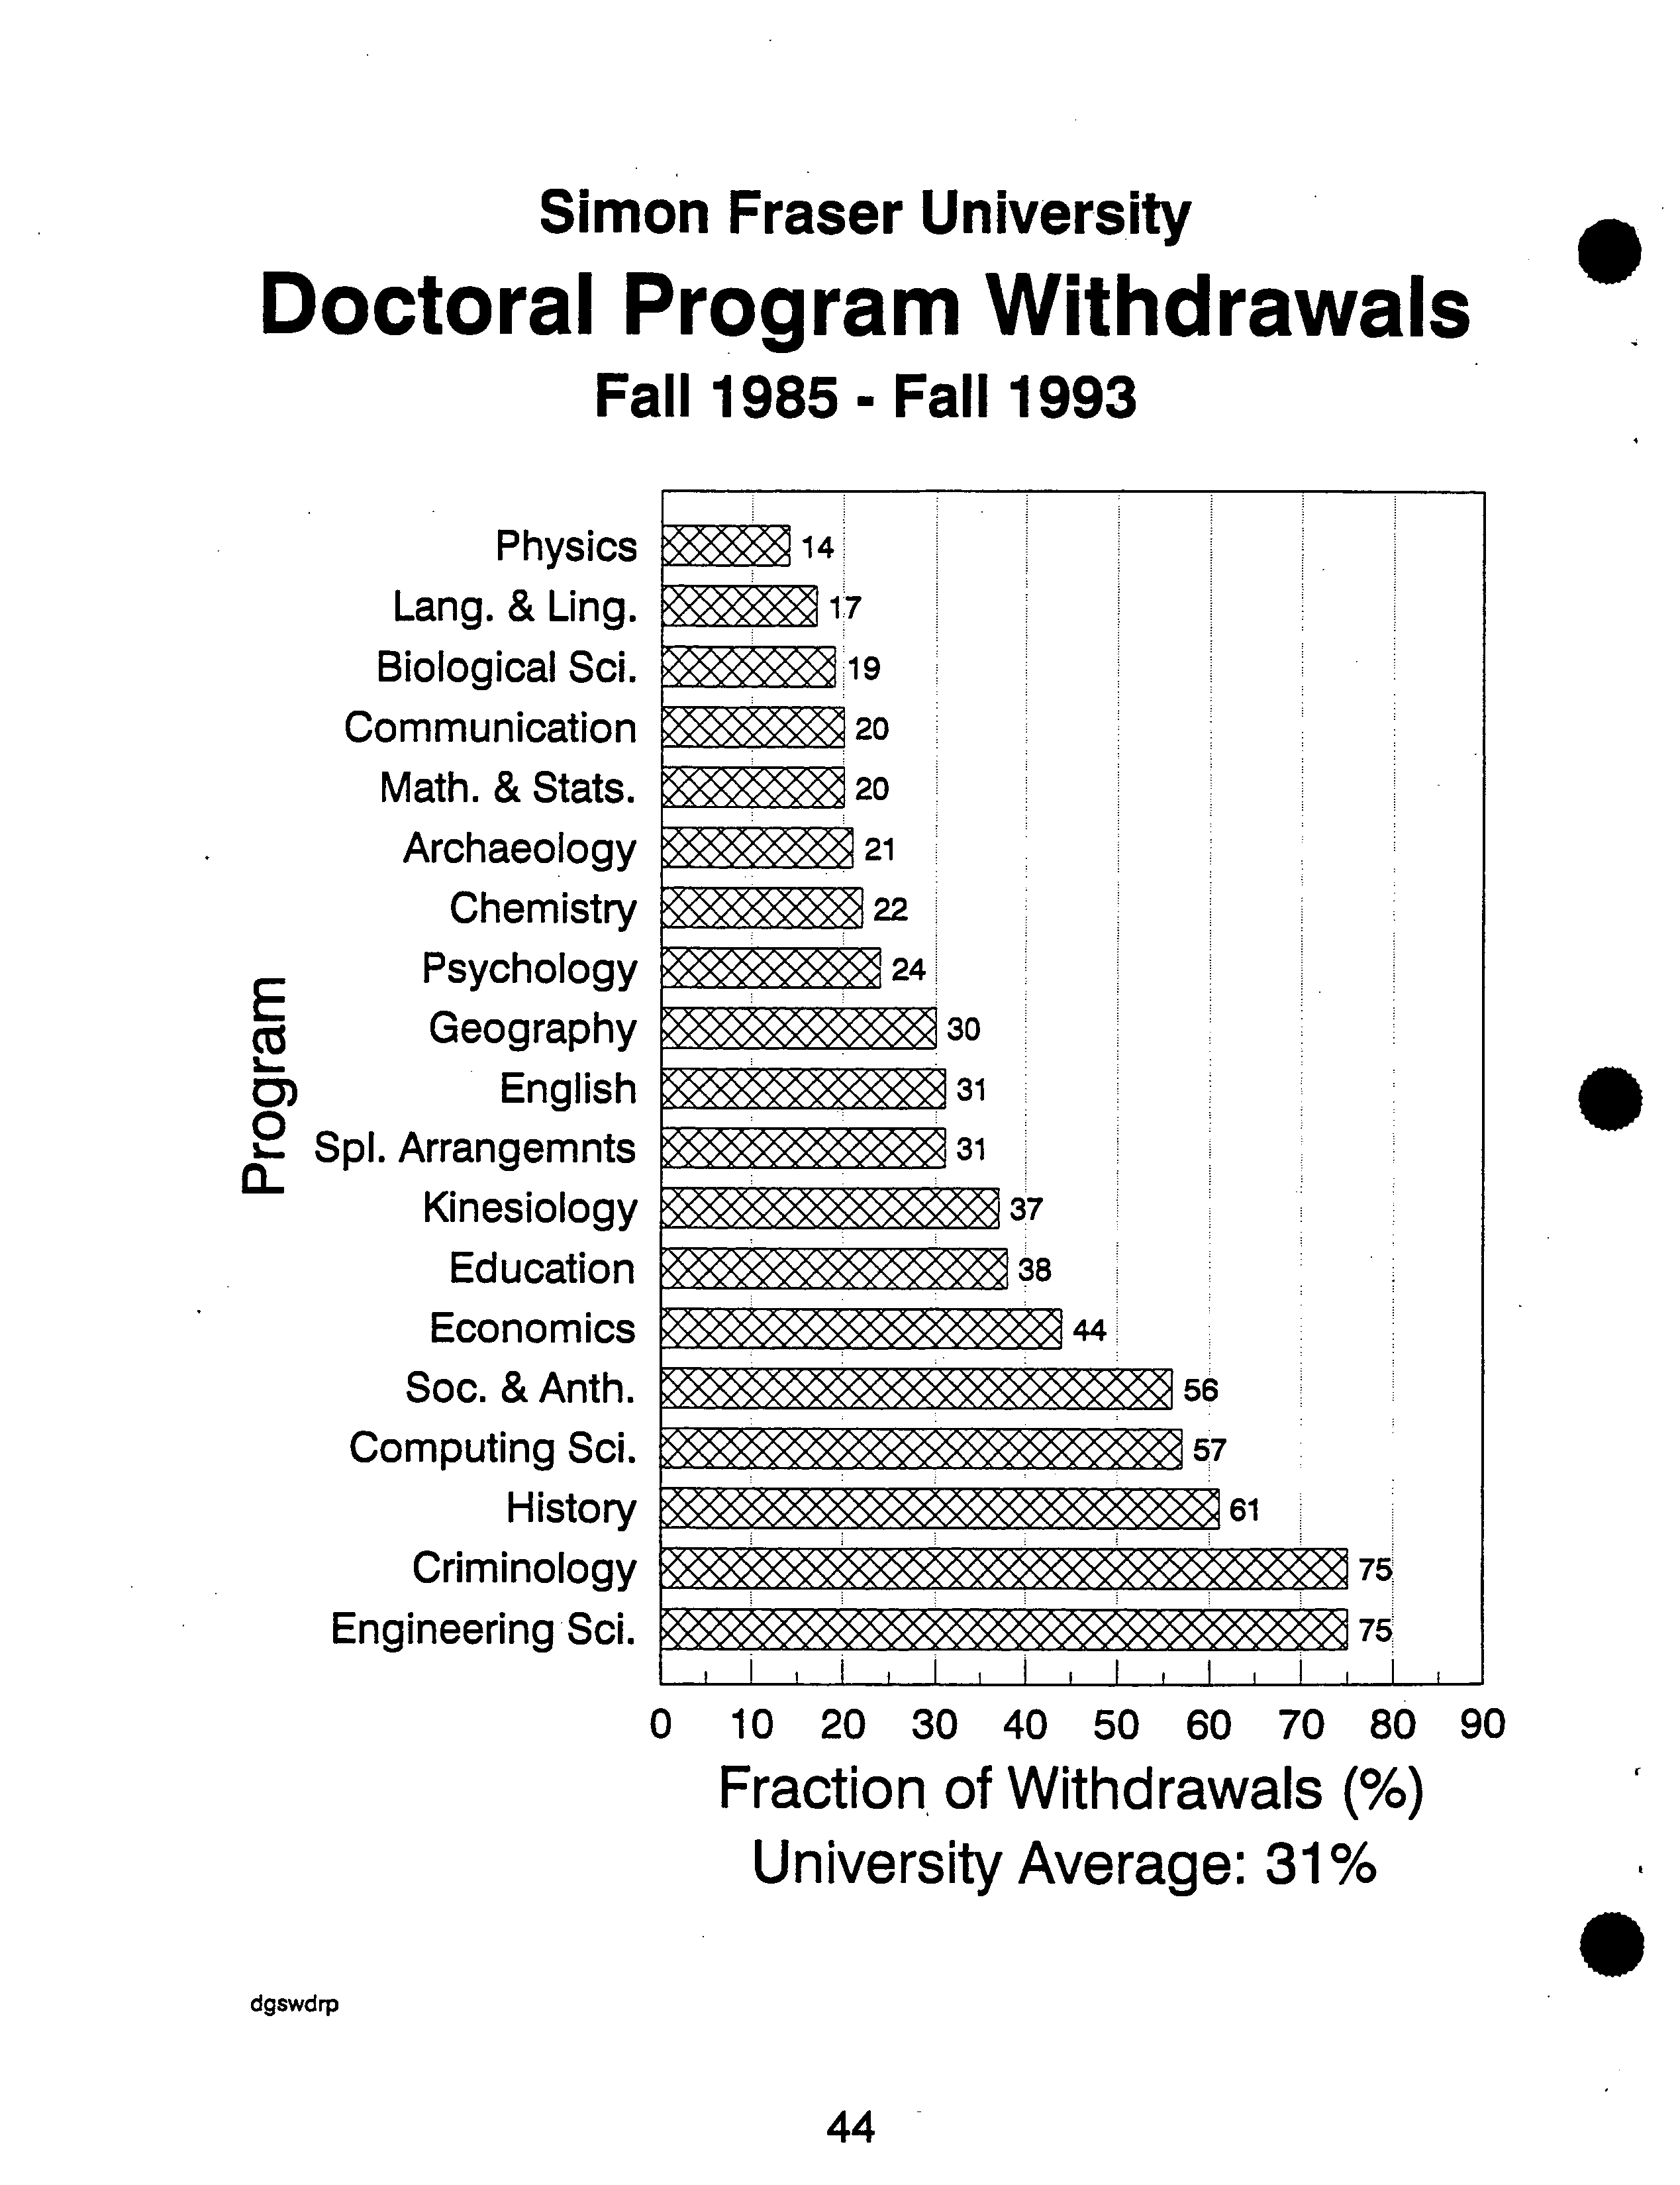
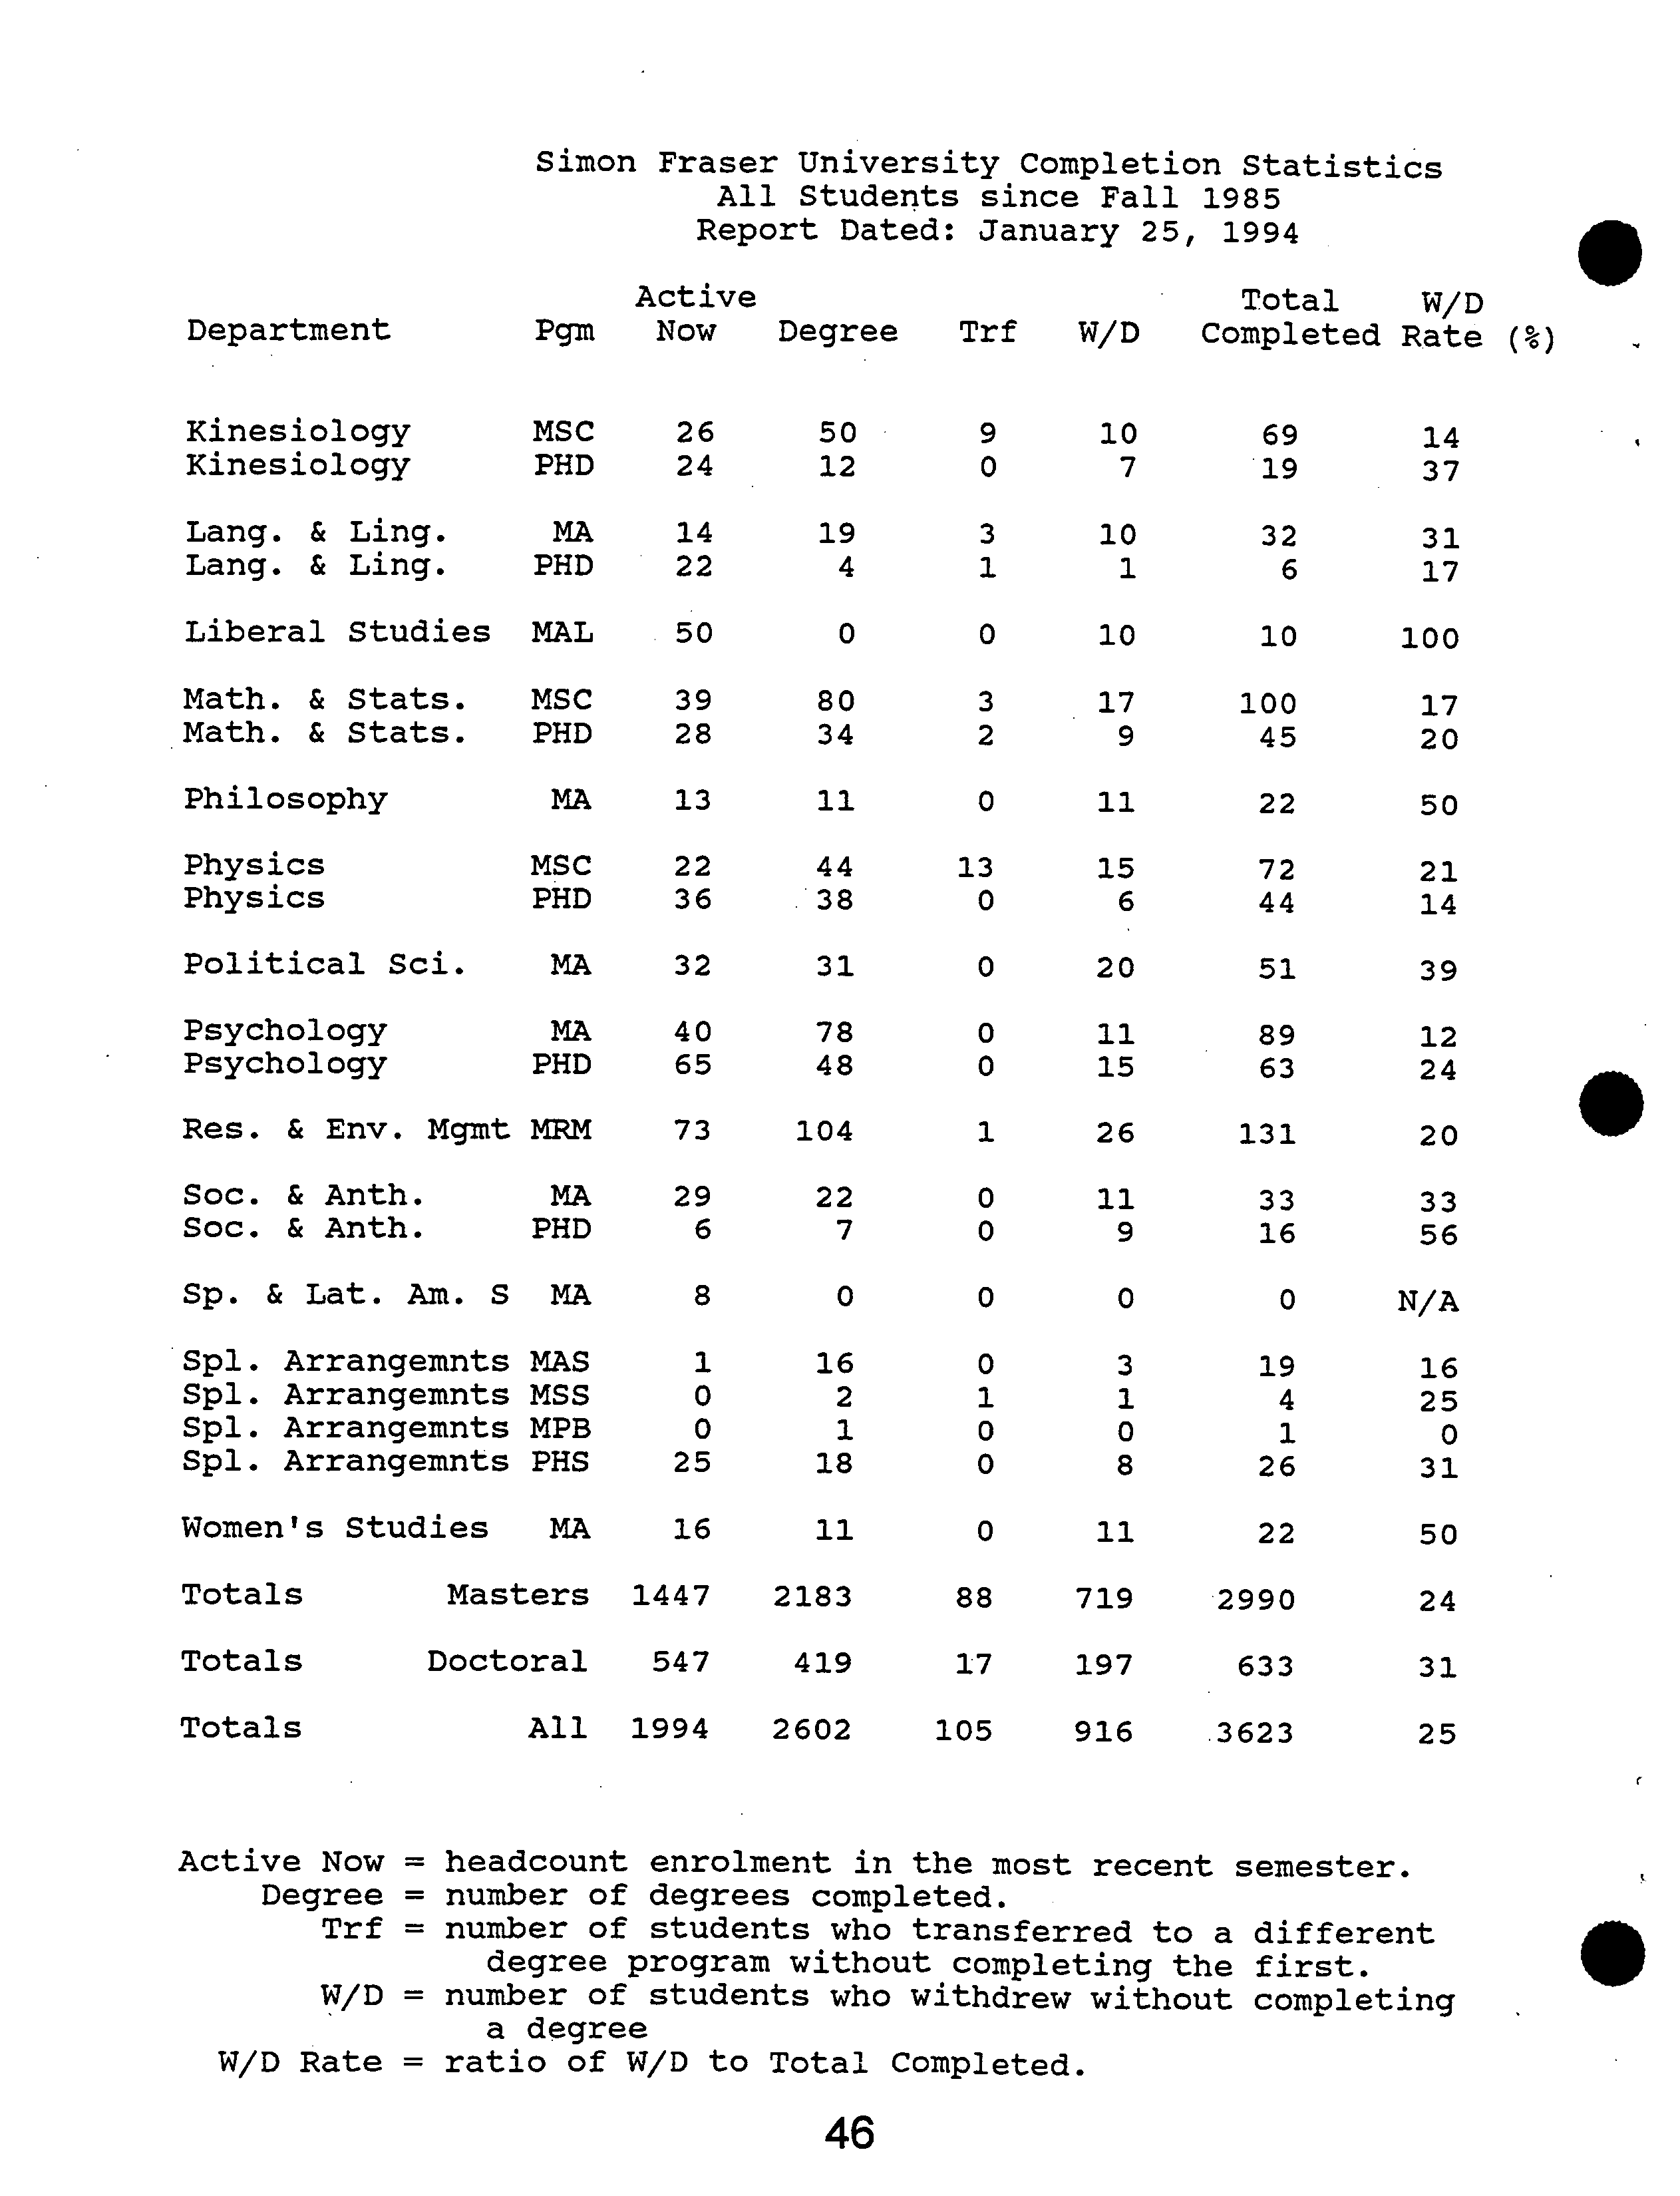
Withdrawal rates are also presented in the Graduate Studies Fact Book. There are tremendous
variations in rates between programs. The overall rates for the University as a whole are in line
with the results of similar studies performed in the U.S. and with a similar study performed by
the Canadian Association for Graduate Studies (of which I am past-President).
Nonetheless, I am very concerned about the low completion rates in some of our graduate pro-
grams. Withdrawal may be due to any one of or a combination of factors including: lack of abil-
ity, lack of motivation, lack of financial resources, health problems, and deficiencies in the gradu-
ate programs and/or their implementation. For several years, I assisted a Master's student in Edu-
cation, Ms. Marianne Yeatman, who, as her thesis research, performed a study of students who
withdrew from their graduate programs. The study had both statistical and anecdotal components
and made some interesting generalizations about the importance of the factors outlined above.
The thesis was successfully defended early in
1992
and is available in the S.F.U. Library. As of
January 1, 1993, I have instituted an exit questionnaire to gather information about many aspects
of our graduate programs from students who successfully complete their degrees and from those
who withdraw. Because of the need for confidentiality, the results are analyzed only statistically,
once enough students respond; analysis of the first data-set is now underway.
Meanwhile, I am continuing to press for improved funding for graduate financial aid. There had
been some very substantial increases to the graduate scholarships budget in the two years precéd-
ing
1992.
Unfortunately, in
1992
there was a significant reduction. I argued strenuously to-re-
verse this action and provide increased support for graduate students; although the reduction was
not reversed, there was a modest increase in funding for--I
' 993. I am very pleased that the current
agreement with Teaching Support Staff Union increasedthe Teaching Assistant stipend and re-
duced the workload. The latter factor will both allow students more time for their studies and will
create additional teaching assistant positions, allowing more graduate students to receive ap-
pointments. Unfortunately, recent cuts to TA budgets have worked against these goals.
C).
Eal
1993 S.G.S.C. Report to Senate
?
. Page 3
.
?
III.
Grades
The Graduate Studies Fact Book gives information on the S.F.U. graduate grades of the end of
the Summer 1993 semester; it excludes students who had not yet taken an S.F.U. graduate
course. Data were taken from the Registrar's data files and incorporated into and processed
within the Graduate Studies Database system.
The tremendous range in the grade distributions among departments may stem from two causes:
(1) differences in grading practices and (2) differences in the abilities of students. I believe that,
most likely, it is a mixture of these with the former a larger contributor than the latter. This
range is one of the reasons that I moved away from interdepartmental comparisons of CGPA in
the ranking of applicants for S.F.U. graduate scholarships.
IV.
Special Arrangements
The Senate Graduate Studies Committee serves as the Graduate Program Committee of students
enrolled under Special Arrangements. I have given special attention to these students. With the
goal of ensuring their satisfactory progress, I have brought all their supervisory committees into
compliance with Senate's regulations and require up-to-date progress reports as a condition of
registration. The response of students and supervisors has been excellent.
I am pleased to report that the defences of theses completed under Special Arrangements, which
I chair, have all been quite successful. Table II provides data on degree completion.
Historically, Special Arrangements have been a high risk area; students either succeed or fail
spectacularly. The number of students enrolled have remained roughly constant around 25.
Degree completion has been highly variable: 3 in 1993. 4 in 1992, 6 in 1991, 2 in 1990, 3 in
1989,4 in 1988,7 in 1987, 6 in 1986,2 in 1985, 6 in 1984, 1 in 1983, 2 in 1982, and 4 in 1981.
Some other students have dropped out and others encountered health problems. By the steps
outlined above and by continued rigorous adherence to the criteria for entrance into Special Ar-
rangements, I hope to improve the success rate.
V.
Administration
In September 1993, I agreed to accept a one-year acting appointment as Vice-President, Re-
search, retaining responsibility for the Graduate Studies portfolio as well. Dr. Phyllis Wrenn of
the French Department accepted a one-year half-time appointment as Associate Dean of
Graduate Studies.
In September 1993, a $40 application fee was introduced. Revenues are directed to General
University Revenues and to my office in the proportion of 30:70. Most of the funds directed to
my office are transferred to departments to assist in meeting the costs of recruiting, processing
of the applications and student travel for research and conference attendance.
1993 S.G.S.C. Report to Senate
?
. Page 4
VI. S.G.S.C. Motions
A summary of the motions passed by the S.G.S.C., prepared by the Office of the Registrar, is
presented in Appendix B.
VII. The Future
I remain cautiously optimistic about the future of graduate studies at SFU. Over the last several
years, we introduced a number of new programs which are in the process of implementation.
Several other, exciting new program initiatives are presently in the planning process; some of
these have received approval from the Senate Committee on Academic Planning to proceed with
detailed planning. Others are before the Assessment Committee for New Graduate Programs, a
subcommittee of the Senate Graduate Studies Committee. It will be essential to ensure that suf-
ficient resources are allocated to support present and future programs, while maintaining high
quality.
The quality of our existing programs is high, as is the quality of most of the thesis defences
which I have attended. With rare exception, applicants recommended by departments for entry
into Ph.D. programs have been very strong. Through aggressive recruiting of excellent appli-
cants with the aid-of entrance scholarships, rigorous enforàement of the present requirements for
satisfactory progress, improved financial aid and careful monitoring of student supervision, it
should be possible to improve further the quality of our graduate programs, and to decrease de-
gree completion times and withdrawal rates, thus making more effective use of our resoUrôes.
At the time of writing (early February, 1994), a final decision on the continued combination of
the positions of Dean of Graduate Studies and Vice-President, Research has not yet been made
by the President.
B.P. Clayman
Dean of Graduate Studies
Attachments
SENAT.94DOC 2-Feb-94
?
•
4
Head Count
El FTE
Table I
Annualized Graduate Enrolments for Fiscal Years:
85/86 86/87 87/88 88/89 89/90 90/91 91/92
92/93 93/94
(projected)
Head Count ?
1,377 ?
1,366 ?
1,426 ?
1,444 ?
1,486 ?
1,623 ?
1,864 2,008 2,055
FTE
?
1,125 ?
1,084 ?
1,147 ?
1,169 ?
1,256
?
1,404 ?
1,594 ?
1,720 ?
1,775
2,500
2,000
1,500
1,000
. ?
500
0
85/86 86/87 87/88 88/89 89/90 90/91 91/92 92/93 93/94
Master's
Doctoral
Degrees Granted for Fiscal Years:
85/86 86/87 87/88 88/89 89/90 90/91 91/92 92/93
93/94
?
218 ?
279 ?
211 ?
213 ?
253
?
297 ?
246 ?
315 ?
308
?
37 ?
39 ?
45 ?
50 ?
45 ?
60 ?
58 ?
66 ?
53
S
sgscrep lxi, 28 ]an 94
,l.
Semester
of:
Entry
Completion
79-1
85-3
82-3
85-3
83-3
86-1
83-3
88-3
83-3
88-3
84-3
86-3
85-3
88-1
87-3
89-2
87-3
91-1
87-1
92-1
87-1
92-1
88-3
91-2
89-1
90-3
89-1
92-2
87-3
93-1
92-1
93-2
Master of Science
Semesters
Semester of
Semesters
in Program
Entry:
Completion
in Program
21
78-2
86-2
25
10
79-3
86-3
22
8
80-1
86-2
20
16
80-3
91-1
32
16
81-1
86-2
17
7
81-2
87-1
18
8
82-3
86-3
13
6
82-3
87-1
14
11
82-3
88-3
19
16
83-1
88-1
16
16
83-3
90-3
22
9
85-3
88-1
8
6
85-3
91-1
17
11
85-3
91-3
19
17
86-3
90-2
12
5
87-3
90-1
8
87-1
91-2
14
88-3
92-2
12
Table II
Special Arrangements Graduates
?
I
Semesters 85-3 thtough 93-2
Master of Arts
?
Doctor of Philosophy
?
80-3 ?
85-3
?
85-3 ?
87-3
Summary Statistics
Pgm ?
Graduates
M. A.
?
16
M.Sc. ?
2
M.Publ. ?
1
Ph.D. ?
18
sgscrep2.xls 27 Jan 94
16
7
Completion Times (semesters)
Minimum
Maximum ?
Average
Median
5
21 ?
11.44
10
7
16 ?
11.50
7
6
6 ?
6.00
6
8
32 ?
17.11
17
I
.
APPENDIX A
.
Report to Senate of the Graduate Programs approved for Part-time Study by the Senate
Graduate Studies Committee.
Archaeology
M.A., Ph.D.
Biological Sciences
M.P . M., M. Aq.
Business Administration
Executive MBA
Communication
M.A., Ph.D.
Economics
MA., Ph.D.
Education
MA., M.Sc., M.Ed.
Engineering Science
M.Eng.
English
M.A., Ph.D.
French
M.A.
Liberal Studies
M.A.
Mathematics and Statistics
M.Sc., Ph.D.
Political Science
M.A.
Resource and Environmental Management
M.R.M.
Spanish & Latin American Studies
M.A.
Special Arrangements
Masters, Ph.D.
Women's Studies
M.A.
.
S94ATTCH.DOC 02/09/94
APPENDIX B
SIMON FRASER UNIVERSITY
MEMORANDUM
Report to Senate of the Activities of the Senate Graduate Studies
Committee from January 1993 to December 1993.
Number of Meetings - 4
1.
A sub-committee of the Senate Graduate Studies Committee was
established to consider two graduate student appeals. Both appeals
were denied.
2.
Changes to the degree and supervisory committee requirements in
Women's Studies were approved.
3.
New Graduate Courses in History, Engineering Science, Kinesiology,
Education and Psychology.
?
0
4.
A Change in credit hours (from 3 to
5)
was approved for Educ 864
and 867.
5.
Graduate Curriculum Changes in the Schools of Computing and
Engineering Science and the Faculty of Education.
6.
Proposed programs for a Joint MBNMRM, a Joint Ph.D. Program in
Philosophy, M.A. in French and a new Ph.D. Program in English.
7.
One Recommendation for Admission under Special Arrangements was
approved.
8.
The following motion to delegate authority was approved:
"That Senate delegate to the Senate Graduate Studies Committee
the authority to grant final approval to all changes in prerequisites
of graduate courses and changes in course titles and course des-
criptions where, in the opinion of the Dean of Graduate Studies,
these represent minor changes in course content.
9.
?
A change to Regulation 1.5.4 was approved as follows:
From:
A graduate student is required to maintain a CGPA of at
least 3.0. A student failing to maintain a CGPA of 3.0
is automatically dropped from the program and required
to withdraw from the University unless the Supervisory
Committee or the Chair of the Graduate Program Committee
recommends continuation in the program. Such recommend-
ation is made to the Graduate Program Committee which, if
it concurs, sends it to the Faculty Graduate Studes Committee
for approval.
To: A graduate student is required to maintain a CGPA of at
least 3.0. Failure to do so is evidence of unsatisfactory
progress and the matter will be considered by the Graduate
Program Committee as required under the procedure for the
Review of Unsatisfactory Progress in Regulation 1.8.2
February 3, 1994
.
a
SIMON FRASER UNIVERSITY
Graduate Studies Fact Book
.
January 1994
Office of the Dean of Graduate Studies
Simon Fraser University
Burnaby, British Columbia
V5A1S6
Simon Fraser University
Graduate Studies Fact Book
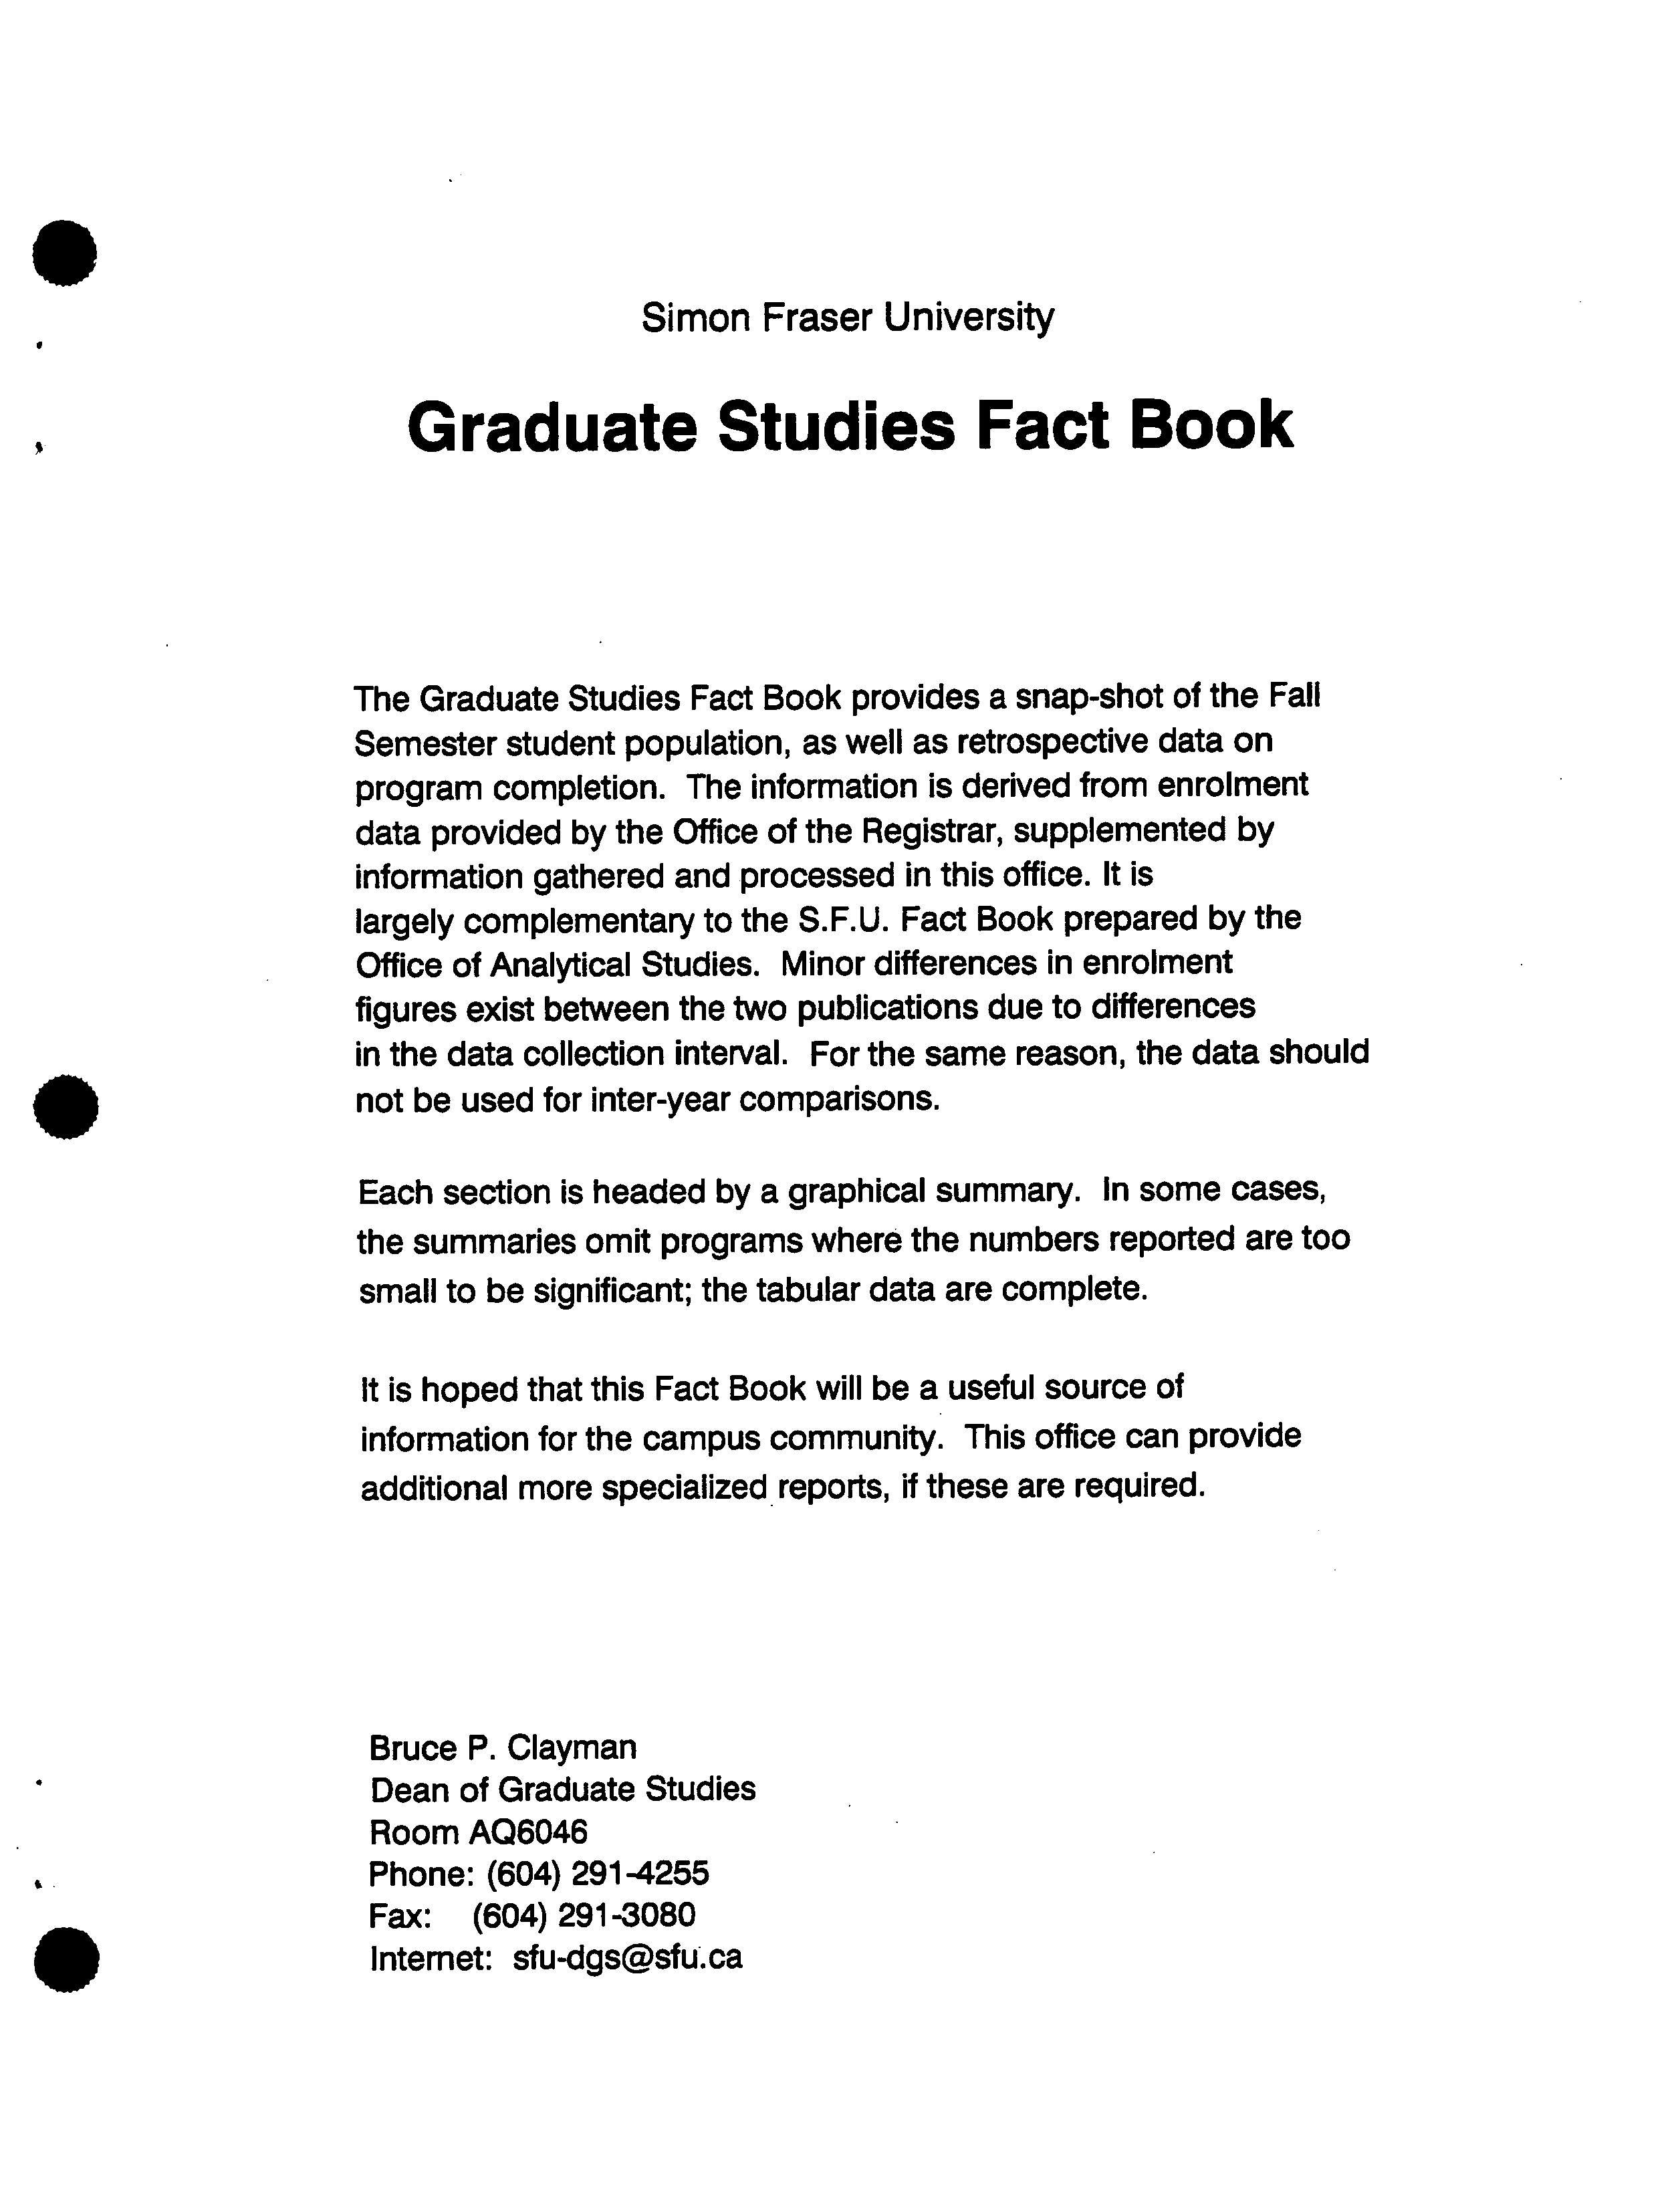
The Graduate Studies Fact Book provides a snap-shot of the Fall
Semester student population, as well as retrospective data on
program completion. The information is derived from enrolment
data provided by the Office of the Registrar, supplemented by
information gathered and processed in this office. It is
largely complementary to the S.F.U. Fact Book prepared by the
Office of Analytical Studies. Minor differences in enrolment
figures exist between the two publications due to differences
in the data collection interval. For the same reason, the data should
not be used for inter-year comparisons.
Each section is headed by a graphical summary. In some cases,
the summaries omit programs where the numbers reported are too
small to be significant; the tabular data are complete.
It is hoped that this Fact Book will be a useful source of
information for the campus community. This office can provide
additional more specialized reports, if these are required.
Bruce P. Clayman
Dean of Graduate Studies
Room AQ6046
Phone: (604) 291-4255
Fax: (604) 291-3080
Internet: sfu-dgs@sfu. ca
.
Simon Fraser University
Graduate Studies Fact Book
Contents
Enrolment
3
Grades
10
Citizenship
14
Age
20
Degree Completion Time
25
Degree Completion by Cohorts
30
Withdrawal Data
42
S.F.U. Financial Awards
47
.
.
Contents.drw
2
C
Simon Fraser University
Annualized Graduate Enrolments for Fiscal Years:
85186 86/87 87/88 88189 89/90 90/91 91/92 92/93 93/94
(projected)
Head Count 1,377 1,366 1,426 1,444 1,486 1,623 1,864 2,008 2,055
FTE
?
1,125 1,084
1,147
1,169 1,256 1,404 1,594 1,720 1,775
Degrees Granted for Fiscal Years:
85/86 86/87 87/88 88189 89/90 90/91 91/92 92/93 93/94
Master's ?
218 ?
279 ?
211 ?
213 ?
253
?
297
?
246 ?
315 ?
308
Doctoral ?
37
?
39
?
45 ?
50
?
45
?
60 ?
58
?
66 ?
53
sgscrepl .xts 28 Jan 94
3
uoctoral 547 26.9%
Master's 1,447 71
101-
Special 21 1.0%
Qualifying 20 1.0%
Female 695 48.0%
Female 218 39.9%
Simon Fraser University
Total Enrolments
Fall 1993
Total = 2038
Male 752 52.0%
?
Male 329 60.1%
S
Master's Enrolments ?
Ph.D. Enrolments
dgsctz
.
Sp. & Lat. Am. S
Blo. Sci. MAq
Philosophy
Lang. & Ling.
Contemp. Arts
Geography MSc
E
Women's Studies
CIO
Archaeology
C)
o ?
Physics
- Eng. Sci. MEng.
Chemistry
Geography MA
Kinesiology
Soc. & Anth.
Blo. Sci. MPM
Political Sd.
.
.
?
Simon Fraser University
Master's Program Enrolments
Fall 1993 - Part
P V V V V V V V V
• a a -
S S
ass
P V V V V V V V V V V V V
i, as as a a a
SS
a a
V VI
a a
4
NOR* I
110011,
NONE
:
V V V V V V
sssssssssa.
V V V V 'V
a
"WV V V V 'WV V V V V V
• as a. a.sa.a. sa
.ssssa
V V 'WV VV
V V V
sa.Ssa.
V V V 'WI
a.
WI F EW-
4
WOO
WIN
P' V V V V V V V V V V V V
V V V V VV
V V VV
V V V VVV
P V V V V V V V 'WV V V V
V V V V VV V V VV
V V V V
V VV V V V V V •
0 ?
10
?
20 ?
30
Total Headcount
dgscftn,1
5
Simon Fraser University
Master's Program Enrolments
Fall 1993 - Part 11
History ?
Education MSc
?
Eng. Sci. MApSc?
Criminology?
Math. & Stats.
?
Psychology
?
Communication
E
?
English
Cz
Economics
2 ?
Computing Sci.
Q..
?
Liberal Studies
Bio. Sci. MSc.
Bus. Admin. WMBA
Res. & Env. Mgmt
Bus. Admin. EMBA
Bus. Admin. DMBA
Education MA
Education MEd
20 40 60 80 100 120 140 160
Total Headcount
dgscttm2
Soc. & Anth.
History
Archaeology
Engineering Sd.
Geography
English
Criminology
Lang. & Ling.
E
Kinesiology
Spi. Arrangemnts
CO
Q..
Math. &Stats.
Communication
Chemistry
Economics
Computing Sci.
Physics
Education
Biological Sci.
Psychology
S
• ?
Simon Fraser University
•
?
Ph.D. Program Enrolments
Fall 1993
0 ?
10
Total
20 30
Headcount
40 50 60 70
dgscttp
S
7
All SFU
Students Registered in
Semester
93-3
January 20, 1994
Status Masters
PhD
?
Qualifying
Special
Other
Total
FT 1192
511 ?
15
15
3
1736
PT
192
3 ?
5
6
0
206
OL 63
33 ?
0
0
0
96
Totals 1447
547 ?
20
21
3
2038
.
Female SFU Students Registered in Semester 93-3
Status
Masters
PhD
Qualifying
Special
Other
Total
FT
540
205
5
9
2
761
PT
119
2
2
2
0
125
OL
36
11
0
0
0
47
Totals
695
218
7
11
2
933
Male SFU Students Registered in Semester 93-3
Status
Masters
PhD
Qualifying
Special
Other
Total
FT
652
306
10
6
1
975
PT
73
1
3
4
0
81
OL
27
22
0
0
0
49
Totals
752
329
13
10
1
1105
SFU Students Registered in Semester 93-3 on Student Visas
Status
Masters
PhD
Qualifying
Special
Other
Total
FT
182
121
4
3
0
310
PT
5
0
0
3
0
8
OL
3
7
0
0
0
10
Totals
190
128
4
6
0
328
S
S
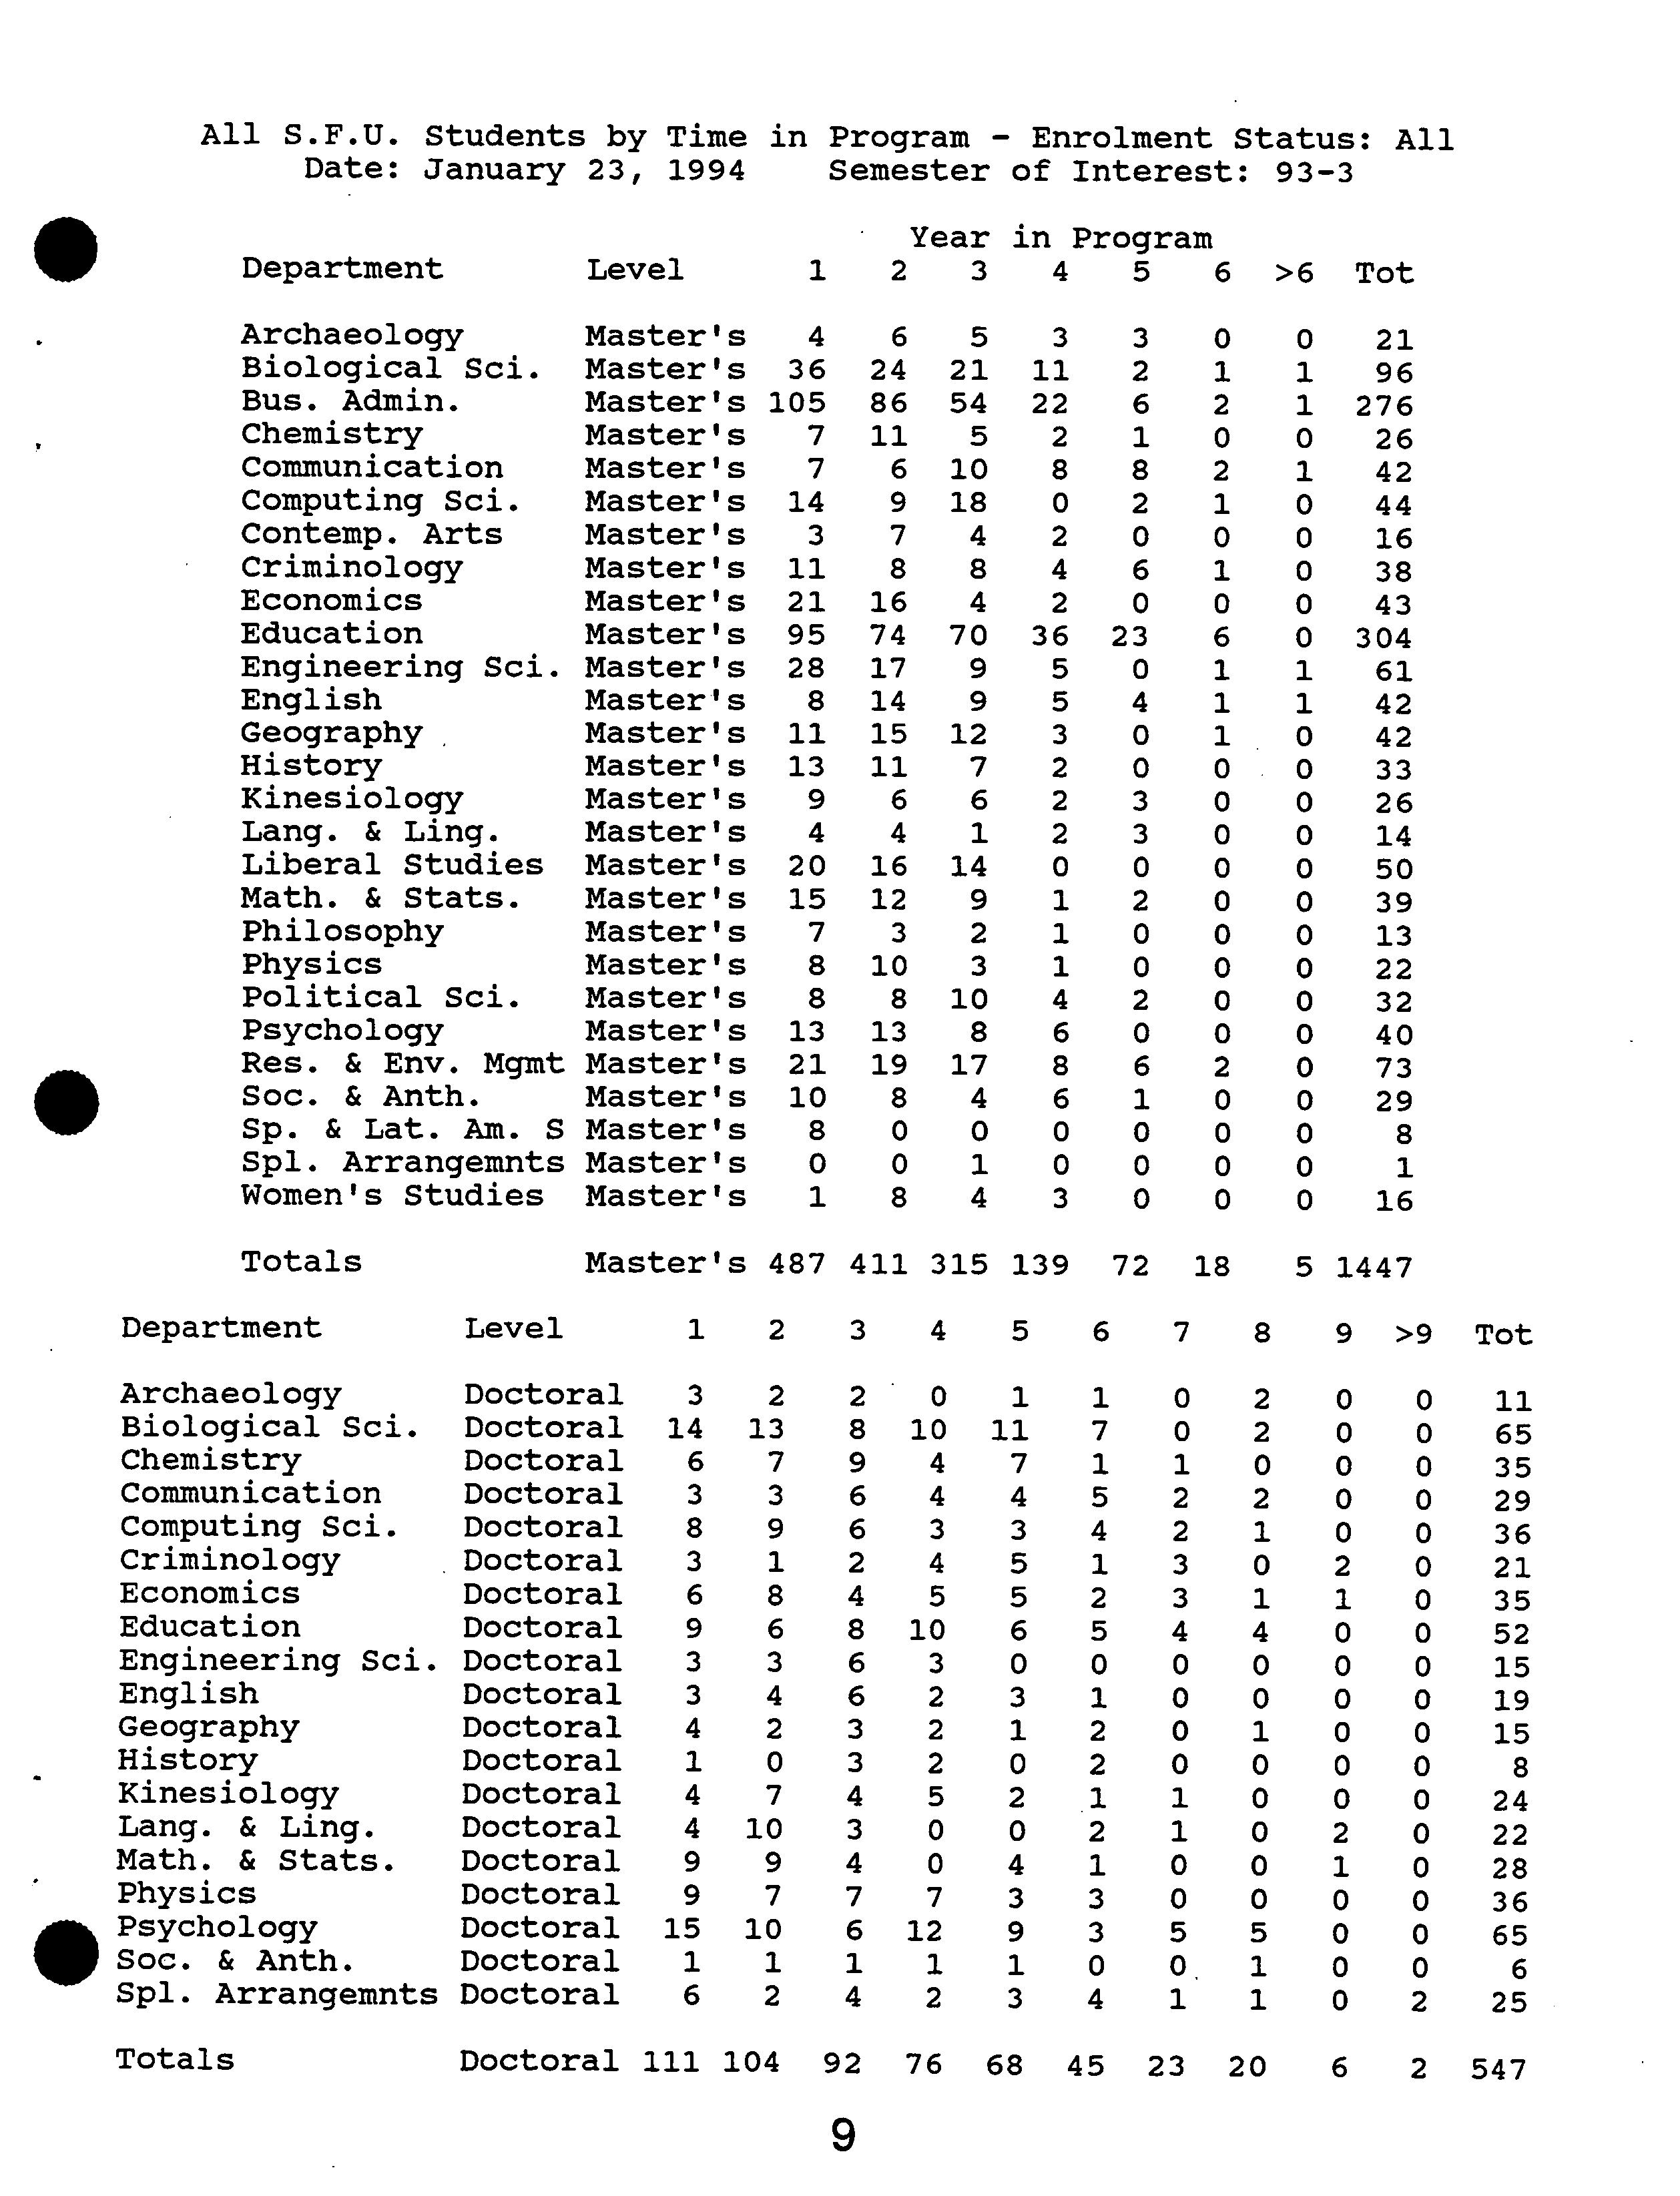
All S.F.U. Students by Time in Program - Enrolment Status: All
?
Date: January 23, 1994
?
Semester of Interest: 93-3
.
Year
in
Program
Department ?
Level
1 2 3
4
5
6
>6 Tot
•
Archaeology ?
Master's
4 6
5 3
3
0
0
21
Biological Sci.
?
Master's
36
24 21
11
2
1
1
96
Bus. Admin. ?
Master's
105
86
54 22
6
2
1
276
Chemistry ?
Master's
7
11
5
2
1
0 0
26
Communication ?
Master's
7 6
10
8 8
2
1
42
Computing Sci.
?
Master's
14 9 18
0
2
1
0
44
Contemp. Arts
?
Master's
3 7
4 2
0
0
0
16
Criminology ?
Master's
11 8 8
4
6
1 0
38
Economics ?
Master's
21
16 4
2
0 0
0
43
Education ?
Master's
95 74 70
36
23
6
0
304
Engineering Sci. Master's
28 17
9
5 0
1 1
61
English ?
Master's
8 14 9
5
4
1
1
42
Geography ?
Master's
11 15 12
3
0
1
0
42
History ?
Master's
13
11 7
2
0 0
0
33
Kinesiology ?
Master's 9
6
6
2
3
0
0
26
Lang. & Ling.
?
Master's
4
4 1
2 3
0
0
14
Liberal Studies ?
Master's
20 16
14
0
0
0
0
50
Math. & Stats. ?
Master's
15 12
9
1
2 0
0 39
Philosophy ?
Master's 7
3
2
1 0
0
0
13
Physics ?
Master's
8
10 3
1
0
0
0
22
Political
Sd. ?
Master's
8 8 10
4
2
0
0
32
Psychology
?
Master's
13 13
8
6
0
0
0
40
•
Res. & Env. Mgmt Master's
Soc. & Anth. ?
Master's
21
10
19
8
17
4
8
6
6
1
2
0
0
0
73
29
Sp. & Lat. Am. S Master's
8
0
0 0
0
0
0
8
Spl. Arrangemnts Master's
0
0
1 0
0
0
0
1
Women's Studies
?
Master's
1
8 4
3
0
0
0
16
Totals ?
Master's
487
411 315
139
72
18
5
1447
Department ?
Level ?
1
2 3
4
5
6 7
8 9
>9
Tot
Archaeology
?
Doctoral ?
3
2
2 0
1
1 0
2
0
0
11
Biological Sci.
?
Doctoral ?
14 13
8
10
11
7
0
2
0 0
65
Chemistry ?
Doctoral ?
6
7
9
4 7
1
1
0
0
0
35
Communication ?
Doctoral ?
3
3
6 4
4
5
2
2
0
0
29
Computing Sci.
?
Doctoral
?
8
9
6 3
3
4
2
1
0
0
36
Criminology ?
Doctoral ?
3
1
2
4
5
1 3
0
2
0
21
Economics ?
Doctoral ?
6
8 4
5
5
2 3
1
1
0
35
Education ?
Doctoral ?
9
6
8
10
6
5
4
4
0 0
52
Engineering Sci. Doctoral ?
3 3
6
3
0
0 0
0
0
0
15
English ?
Doctoral ?
3
4
6
2
3
1 0
0 0
0
19
Geography ?
Doctoral ?
4
2 3
2
1 2 0
1
0
0
15
History ?
Doctoral ?
1
0 3
2
0
2
0
0
0
0
8
Kinesiology ?
Doctoral ?
4 7
4 5
2
1
1
0
0
0
24
Lang. & Ling.
?
Doctoral ?
4 ?
10
3
0
0
2
1
0
2
0
22
Math.
Physics& ?
Stats.
?
DoctoralDoctoral
??
9
9
7
9
47
7
0
4
3
3
1
00 00
0
1
0
0
36
28
Doctoral ?
15 ?
10
6
12
9
3 5 5
0
0
65
•
Psychology
Soc. & Anth. ?
Doctoral ?
1 1
1
1
1
0
0,
1
0
0
6
Spi. Arrangemnts Doctoral
?
6
2
4
2
3
4 1
1
0
2
25
Totals ?
Doctoral 111 104
92
76
68
45 23
20
6
2
547
Philosophy
Economics
Bus. Admin.
Chemistry
History
Kiriesiology
Political Sci.
Res. & Env. Mgmt.
Biol. Sci.
Physics
Eng. Science
E
Computing Sci.
t
Contem p. Arts
CL
English
CD
Geography
Math. & Stats.
Lang. & Ung.
Women's Studies
Communication
Psychology
Education
Soc. & Anth.
Liberal Studies
Criminology
Archaeology
S
Simon Fraser University
Grades of All Students
Fall 1993
dgsgrd
3.30 3.40 3.50 3.60 3.70 3.80 3.90
Grades
University Average: 3.66 Median: 3.75
?
S
10
Simon Fraser University
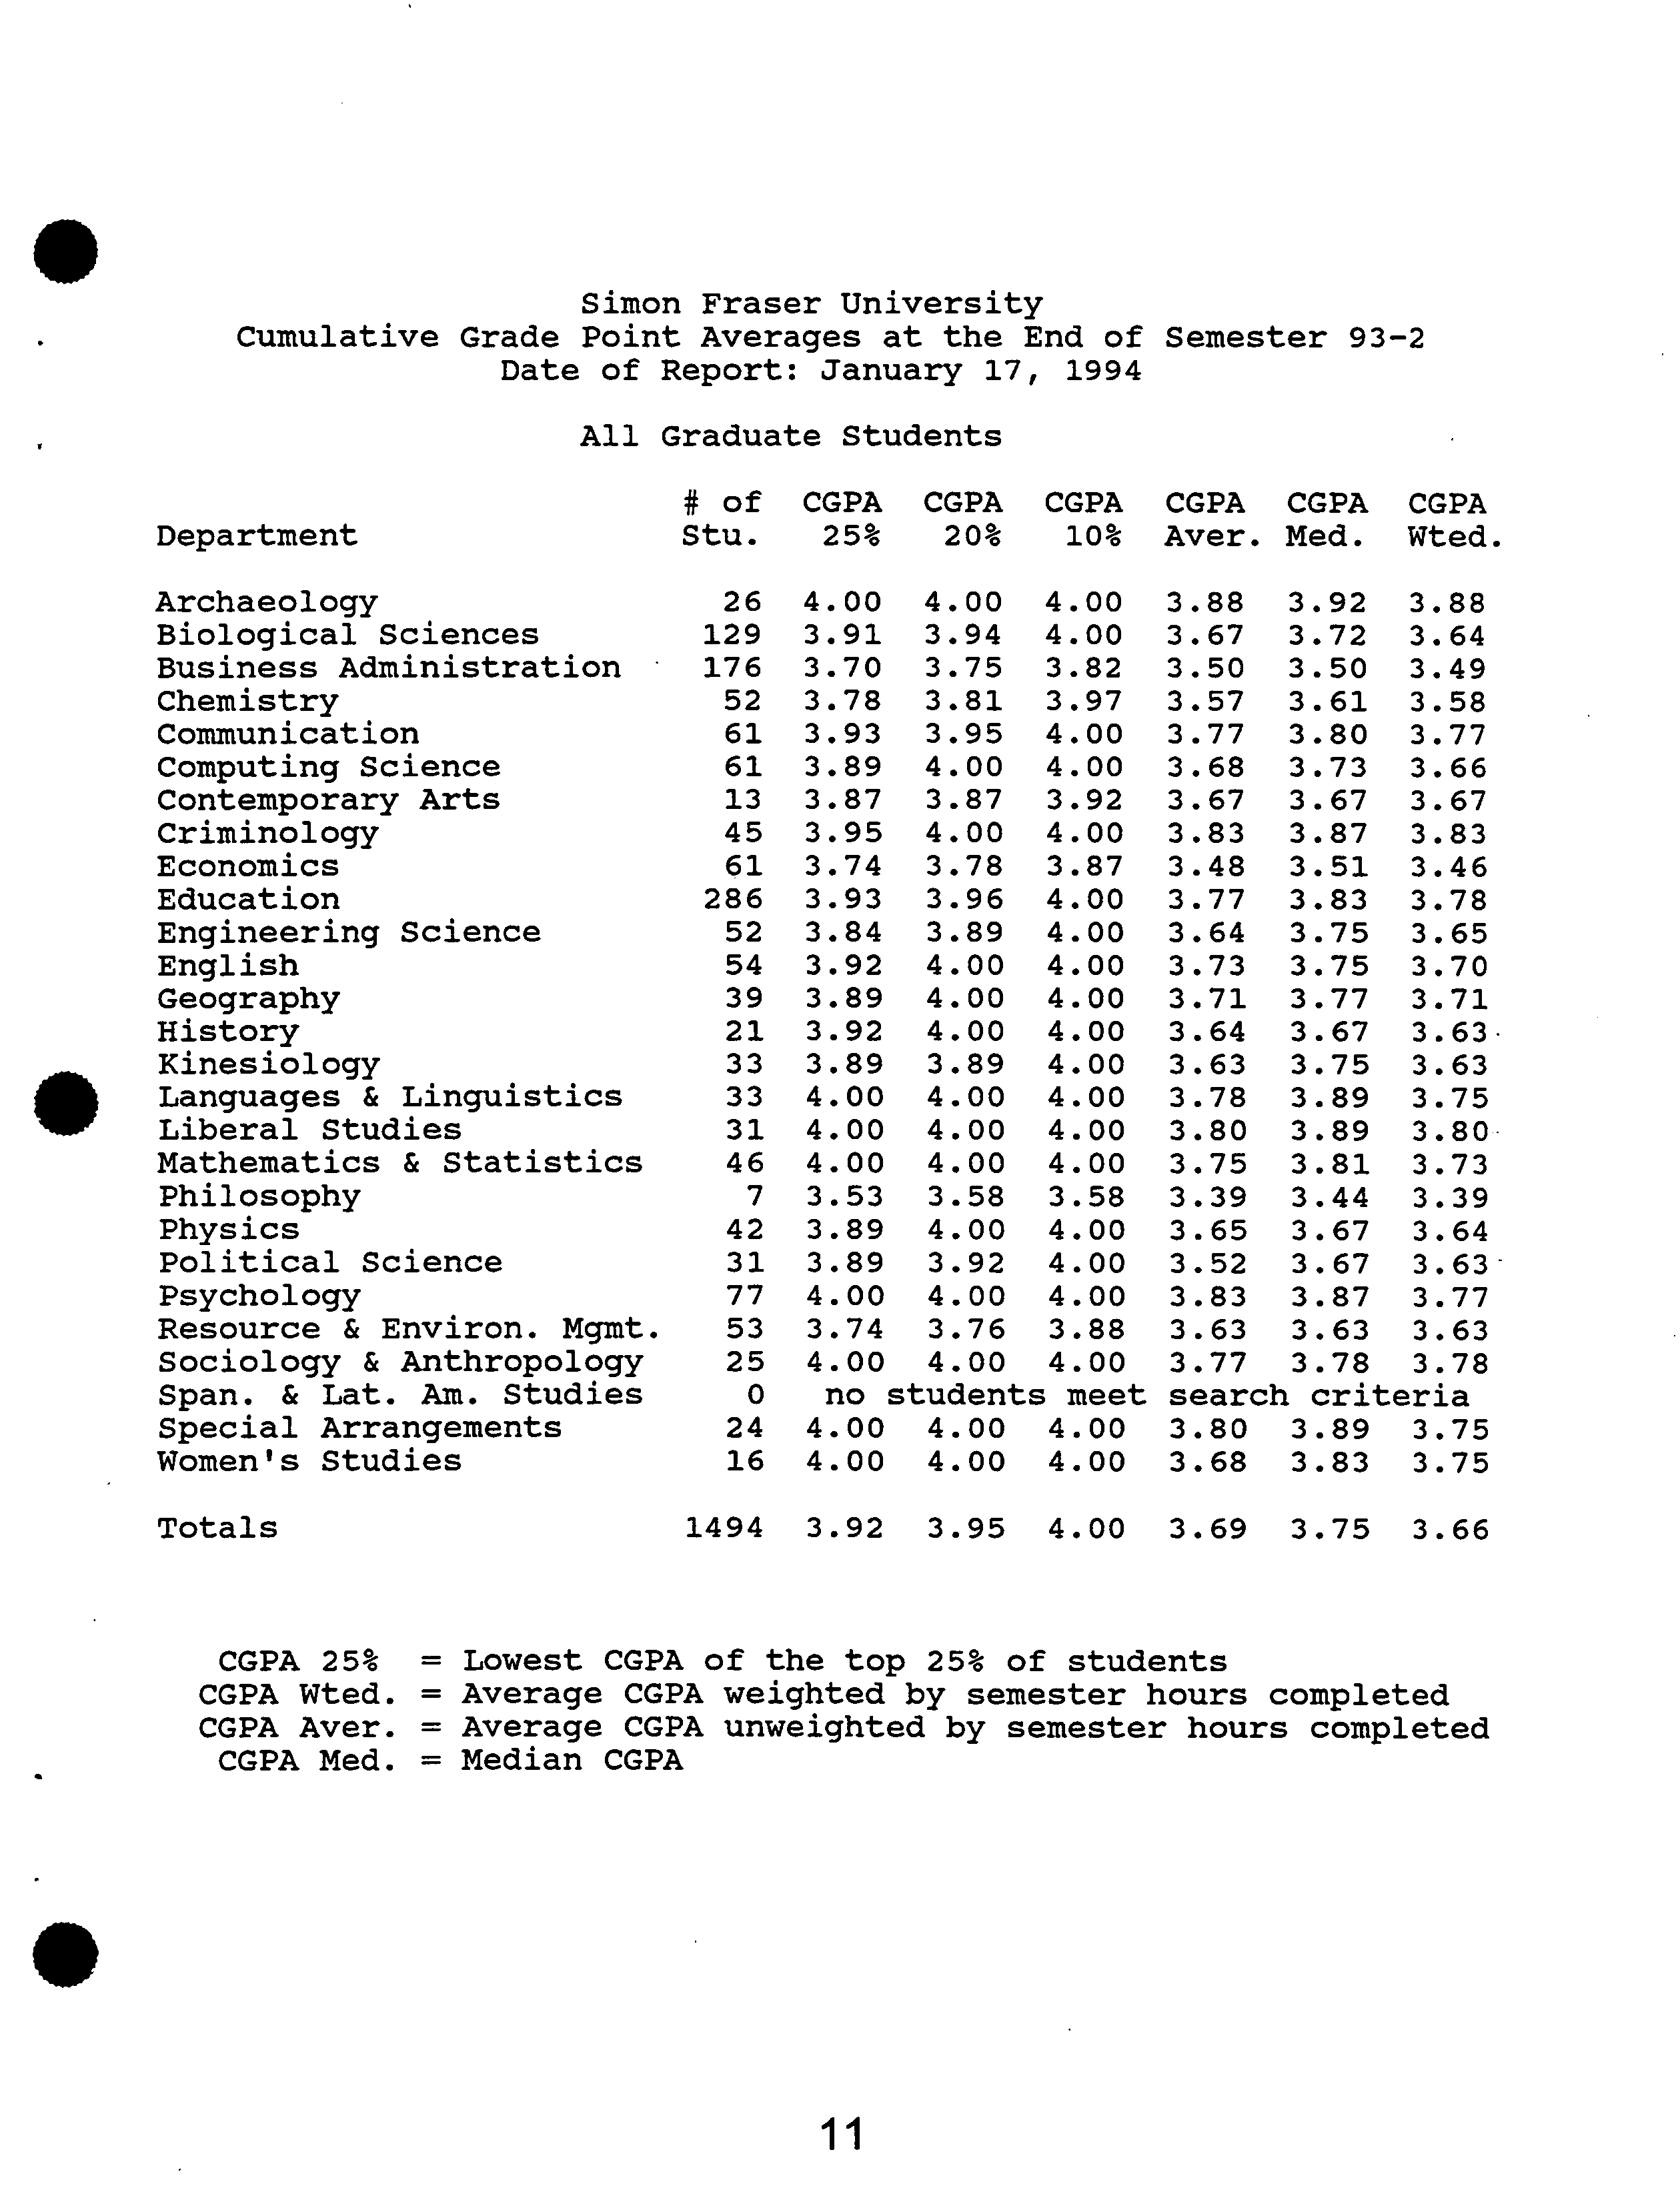
Cumulative Grade Point Averages at the End of Semester 93-2
?
Date of Report: January 17, 1994
All Graduate Students
# of CGPA CGPA CGPA CGPA CGPA CGPA
Department ? Stu. ?
25% 20%
?
10% Aver. Med. Wted.
.
1]
Archaeology
26 4.00
4.00 4.00
3.88
3.92 3.88
Biological Sciences
129 3.91 3.94 4.00 3.67
3.72
3.64
Business Administration
176 3.70 3.75
3.82 3.50 3.50
3.49
Chemistry
52 3.78 3.81 3.97
3.57 3.61
3.58
Communication
61
3.93 3.95
4.00 3.77
3.80 3.77
Computing Science
61 3.89 4.00 4.00
3.68 3.73
3.66
Contemporary Arts
13 3.87 3.87
3.92 3.67 3.67
3.67
Criminology
45 3.95 4.00
4.00
3.83 3.87
3.83
Economics
61
3.74
3.78 3.87
3.48 3.51
3.46
Education
286 3.93 3.96
4.00
3.77
3.83
3.78
Engineering Science
52 3.84 3.89
4.00 3.64
3.75
3.65
English
54 3.92 4.00 4.00
3.73 3.75
3.70
Geography
39 3.89 4.00 4.00
3.71 3.77
3.71
History
21
3.92
4.00 4.00 3.64
3.67
3.63
Kinesiology
33 3.89 3.89 4.00
3.63 3.75
3.63
Languages & Linguistics
33 4.00 4.00 4.00
3.78
3.89 3.75
Liberal Studies
31
4.00
4.00 4.00
3.80 3.89
3.80
Mathematics & Statistics
46
4.00 4.00
4.00
3.75 3.81
3.73
Philosophy
7
3.53
3.58 3.58
3.39 3.44
3.39
Physics
42
3.89 4.00
4.00
3.65 3.67
3.64
Political Science
31 3.89
3.92 4.00
3.52 3.67
3.63
Psychology
77
4.00
4.00 4.00
3.83 3.87
3.77
Resource & Environ. Mgmt.
53 3.74 3.76
3.88
3.63
3.63
3.63
Sociology & Anthropology
25
4.00 4.00 4.00
3.77
3.78
3.78
Span. & Lat. Am. Studies 0 no students
meet
search
criteria
Special Arrangements
24
4.00 4.00 4.00
3.80 3.89
3.75
Women's Studies
16 4.00
4.00 4.00
3.68 3.83
3.75
Totals ?
1494 3.92 3.95 4.00 3.69 3.75 3.66
CGPA 25% = Lowest CGPA of the top 25% of students
CGPA Wted. = Average CGPA weighted by semester hours completed
CGPA Aver. = Average CGPA unweighted by semester hours completed
CGPA Ned. = Median CGPA
.
11
Simon Fraser University
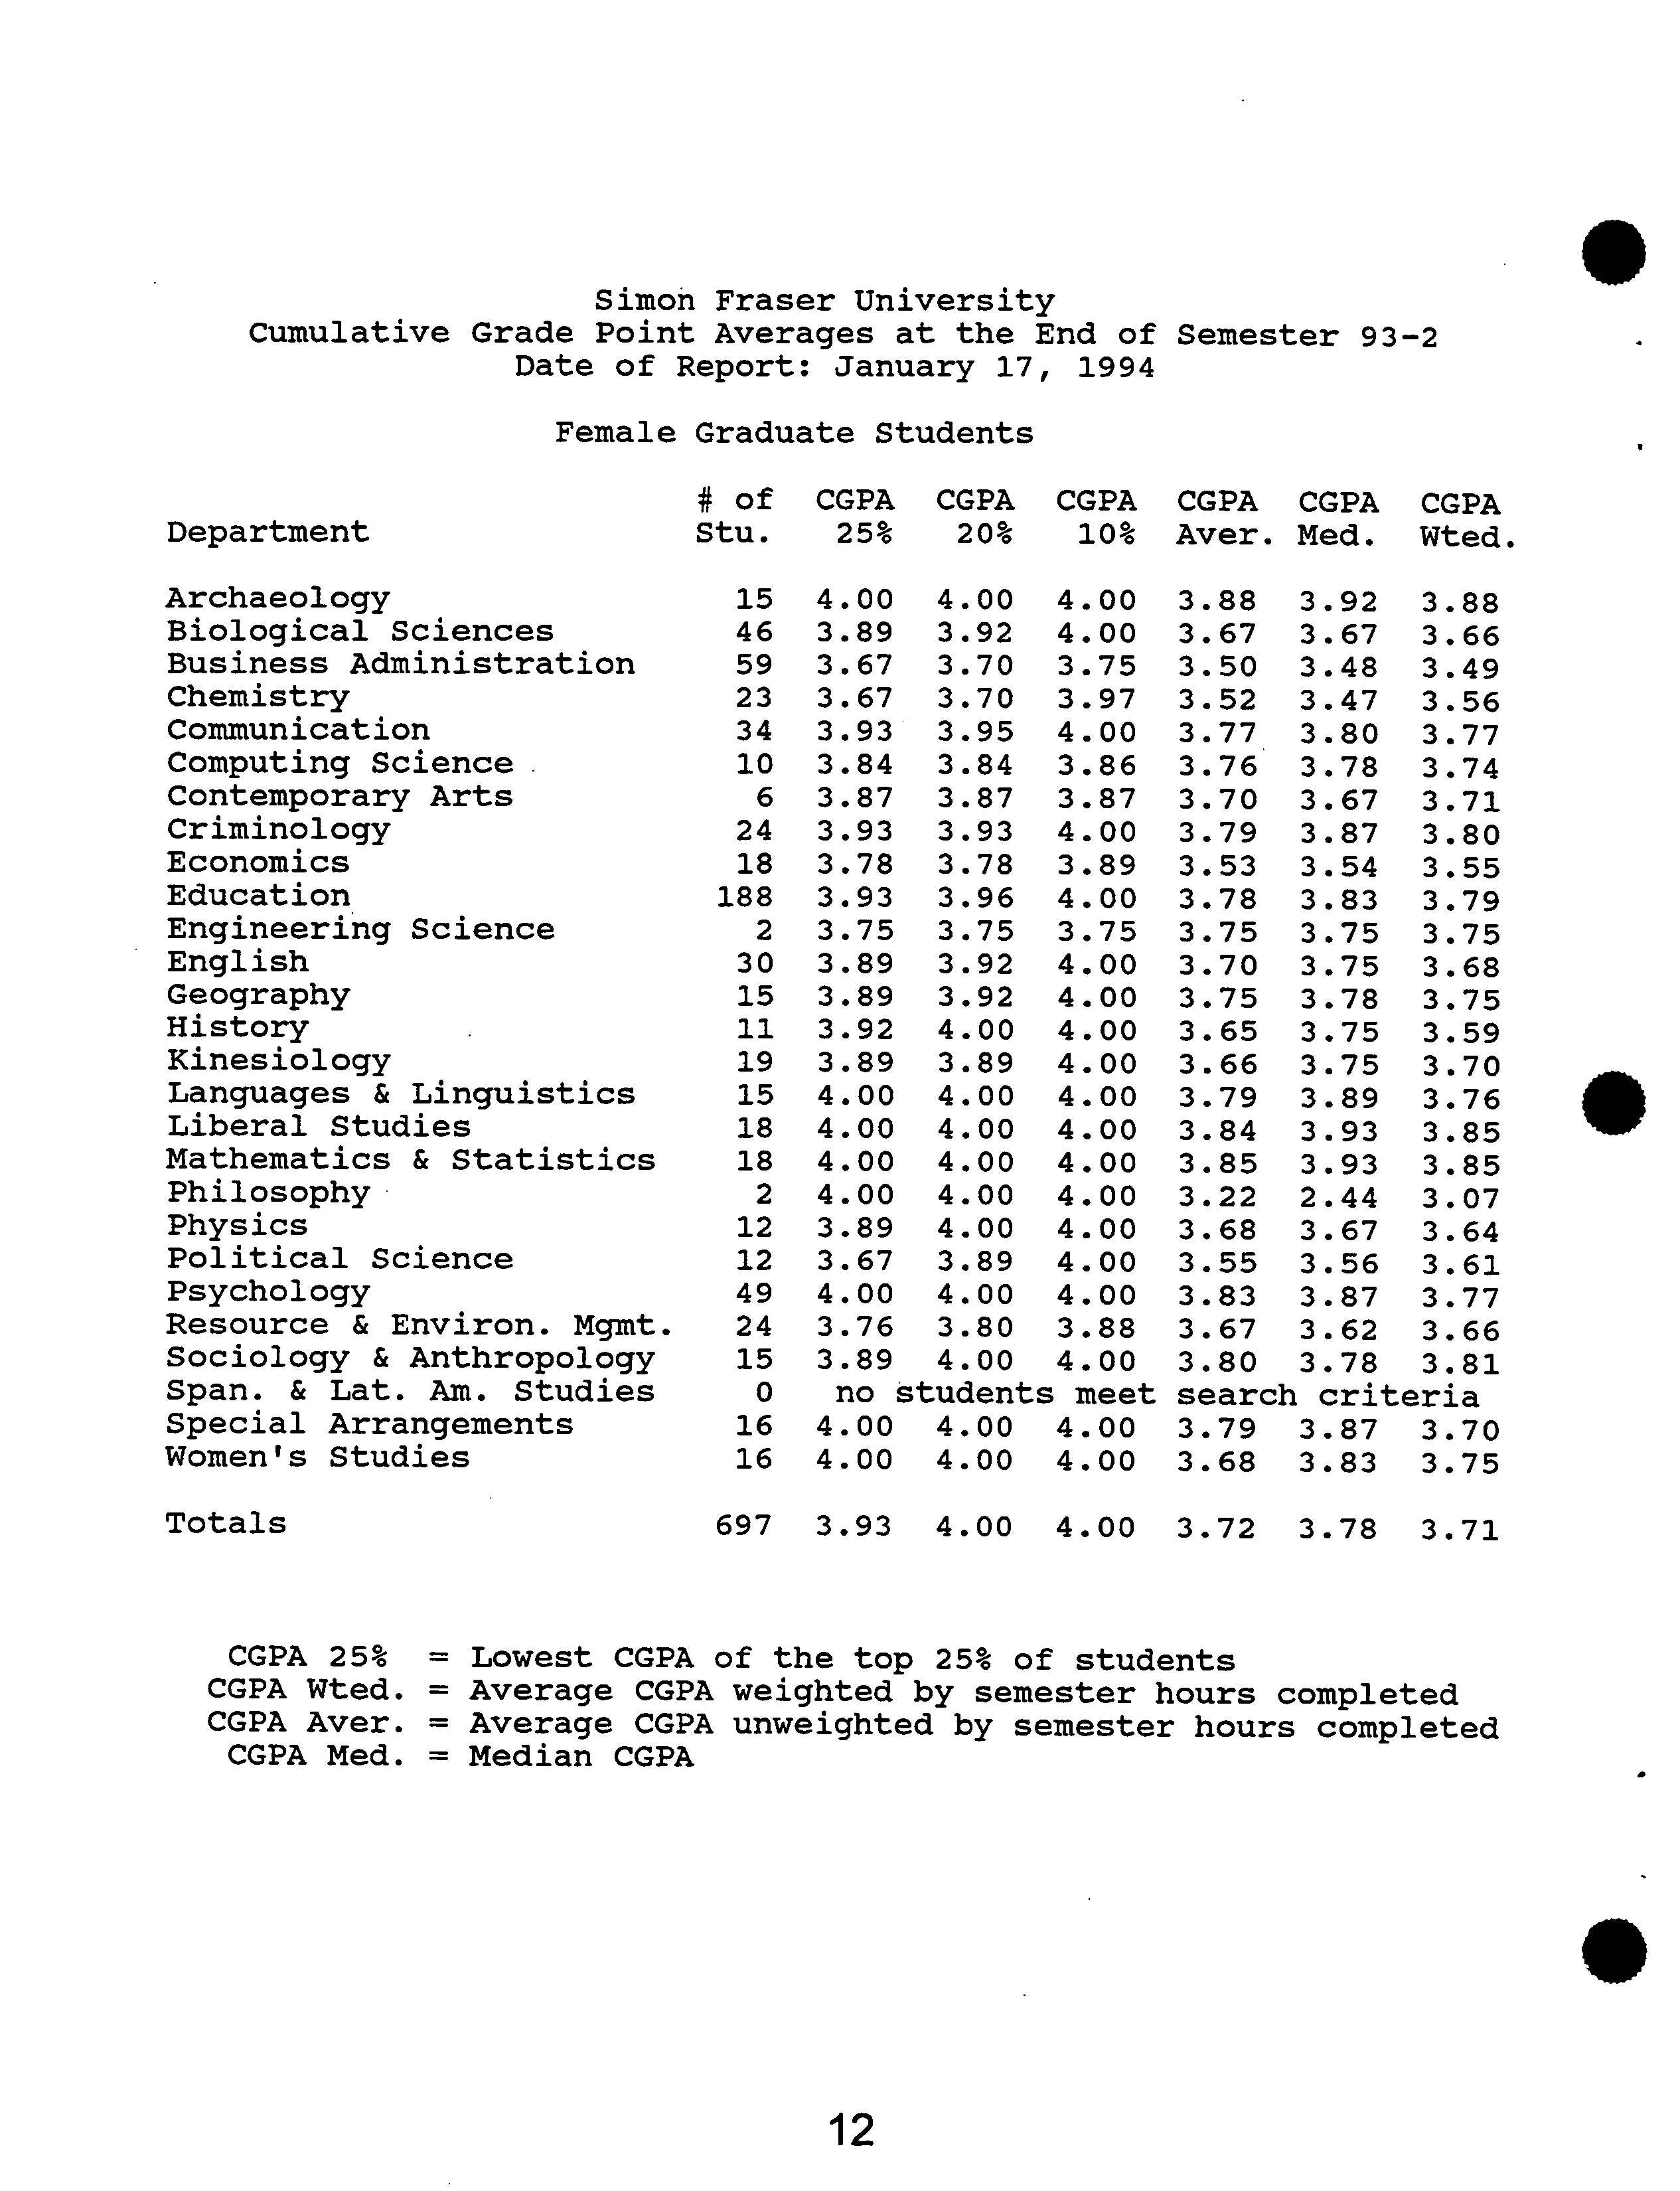
Cumulative Grade Point Averages at the End of Semester 93-2
?
Date of Report: January 17, 1994
Female Graduate Students
# of
CGPA CGPA
CGPA CGPA
CGPA
CGPA
Department
Stu.
25%
20%
10%
Aver.
Med.
Wted.
Archaeology
15 4.00 4.00
4.00
3.88
3.92
3.88
Biological Sciences
46 3.89
3.92
4.00
3.67
3.67
3.66
Business Administration
59 3.67 3.70
3.75
3.50
3.48
3.49
Chemistry
23
3.67 3.70
3.97
3.52
3.47
3.56
Communication
34
3.93 3.95
4.00
3.77
3.80
3.77
Computing Science
10 3.84 3.84
3.86
3.76
3.78
3.74
Contemporary Arts
6
3.87 3.87
3.87
3.70
3.67
3.71
Criminology
24 3.93 3.93
4.00
3.79
3.87
3.80
Economics
18 3.78 3.78
3.89
3.53
3.54
3.55
Education
188
3.93 3.96
4.00
3.78
3.83
3.79
Engineering Science
2 3.75 3.75
3.75
3.75
3.75
3.75
English
30 3.89
3.92
4.00
3.70
3.75
3.68
Geography
15 3.89 3.92
4.00
3.75
3.78
3.75
History
11 3.92 4.00
4.00
3.65
3.75
3.59
Kinesiology
19 3.89
3.89
4.00
3.66
3.75
3.70
Languages & Linguistics
15 4.00
4.00
4.00
3.79
3.89
3.76
Liberal Studies
18 4.00
4.00
4.00
3.84
3.93
3.85
Mathematics & Statistics
18
4.00 4.00
4.00
3.85
3.93
3.85
Philosophy
2
4.00 4.00
4.00
3.22
2.44
3.07
Physics
12
3.89 4.00
4.00
3.68
3.67
3.64
Political Science
12
3.67
3.89
4.00
3.55
3.56
3.61
Psychology
49
4.00
4.00
4.00
3.83
3.87
3.77
Resource & Environ. Mgmt.
24 3.76
3.80
3.88
3.67
3.62
3.66
Sociology & Anthropology
15 3.89
4.00
4.00
3.80
3.78
3.81
Span. & Lat. Am. Studies
0
no students
meet
search criteria
Special Arrangements
16
4.00
4.00
4.00
3.79
3.87
3.70
Women's Studies
16 4.00
4.00
4.00
3.68
3.83
3.75
Totals
697
3.93
4.00
4.00
3.72
3.78
3.71
CGPA 25% = Lowest CGPA of the top 25% of students
CGPA Wted. = Average CGPA weighted by semester hours completed
CGPA Aver. = Average CGPA unweighted by semester hours completed
CGPA Med. = Median CGPA
I
I
12
Simon Fraser University
Cumulative Grade Point Averages at the End of Semester 93-2
?
Date of Report: January 17, 1994
Male Graduate Students
.
S
#
of CGPA
CGPA CGPA
CGPA
CGPA
CGPA
Department
Stu. 25%
20%
10% Aver.
Med.
Wted.
Archaeology
11 4.00 4.00
4.00
3.86 3.89
3.88
Biological Sciences
83
3.91
3.95
4.00 3.67
3.74
3.63
Business Administration
117
3.73
3.75
3.83 3.49
3.50
3.50
Chemistry
29 3.78
3.78
3.87 3.61
3.67
3.60
Communication
27 3.87
3.95
4.00
3.78
3.83
3.78
Computing Science
51 3.89 4.00
4.00
3.67
3.67
3.64
Contemporary Arts
7 3.73
3.89
3.89 3.64
3.67
3.64
Criminology
21 3.96
4.00
4.00 3.86
3.93
3.87
Economics
43 3.72 3.77
3.82
3.46
3.49
3.44
Education
98
3.93 3.95
4.00
3.76 3.80
3.75
Engineering Science
50
3.87 3.89
4.00
3.64
3.67
3.64
English
24 4.00
4.00
4.00 3.76
3.72
3.73
Geography
24 3.89
4.00 4.00
3.69
3.67
3.69
History
10
3.92 3.92
4.00
3.62
3.58
3.68
Kinesiology
14 3.87
3.87
4.00
3.60 3.67
3.56
Languages & Linguistics
18 4.00
4.00
4.00
3.77
3.87
3.74
Liberal Studies
13 3.92
3.92 4.00
3.75 3.75
3.74
Mathematics & Statistics
28 4.00
4.00
4.00 3.69
3.78
3.67
Philosophy
5 3.53
3.53
3.58 3.46
3.44
3.48
Physics
30
3.89 3.95
4.00
3.64
3.67
3.65
Political Science
19
3.92 3.92
3.93
3.51
3.74
3.64
Psychology
28 4.00
4.00
4.00
3.81
3.86
3.76
Resource & Environ. Mgmt.
29 3.73
3.74
3.85
3.61
3.66
3.61
Sociology & Anthropology
10 4.00
4.00
4.00
3.72
3.78
3.75
Span. & Lat. Am. Studies
0
no
students
meet
search
criteria
Special Arrangements
8
4.00
4.00
4.00
3.83
3.93
3.91
Women's Studies
0 no
students
meet
search
criteria
Totals
797
3.89
3.93
4.00 3.66
3.72
3.63
CGPA 25% = Lowest CGPA of the top 25% of students
CGPA Wted. = Average CGPA weighted by semester hours completed
CGPA Aver. = Average CGPA unweighted by semester hours completed
CGPA Med. = Median CGPA
S
13
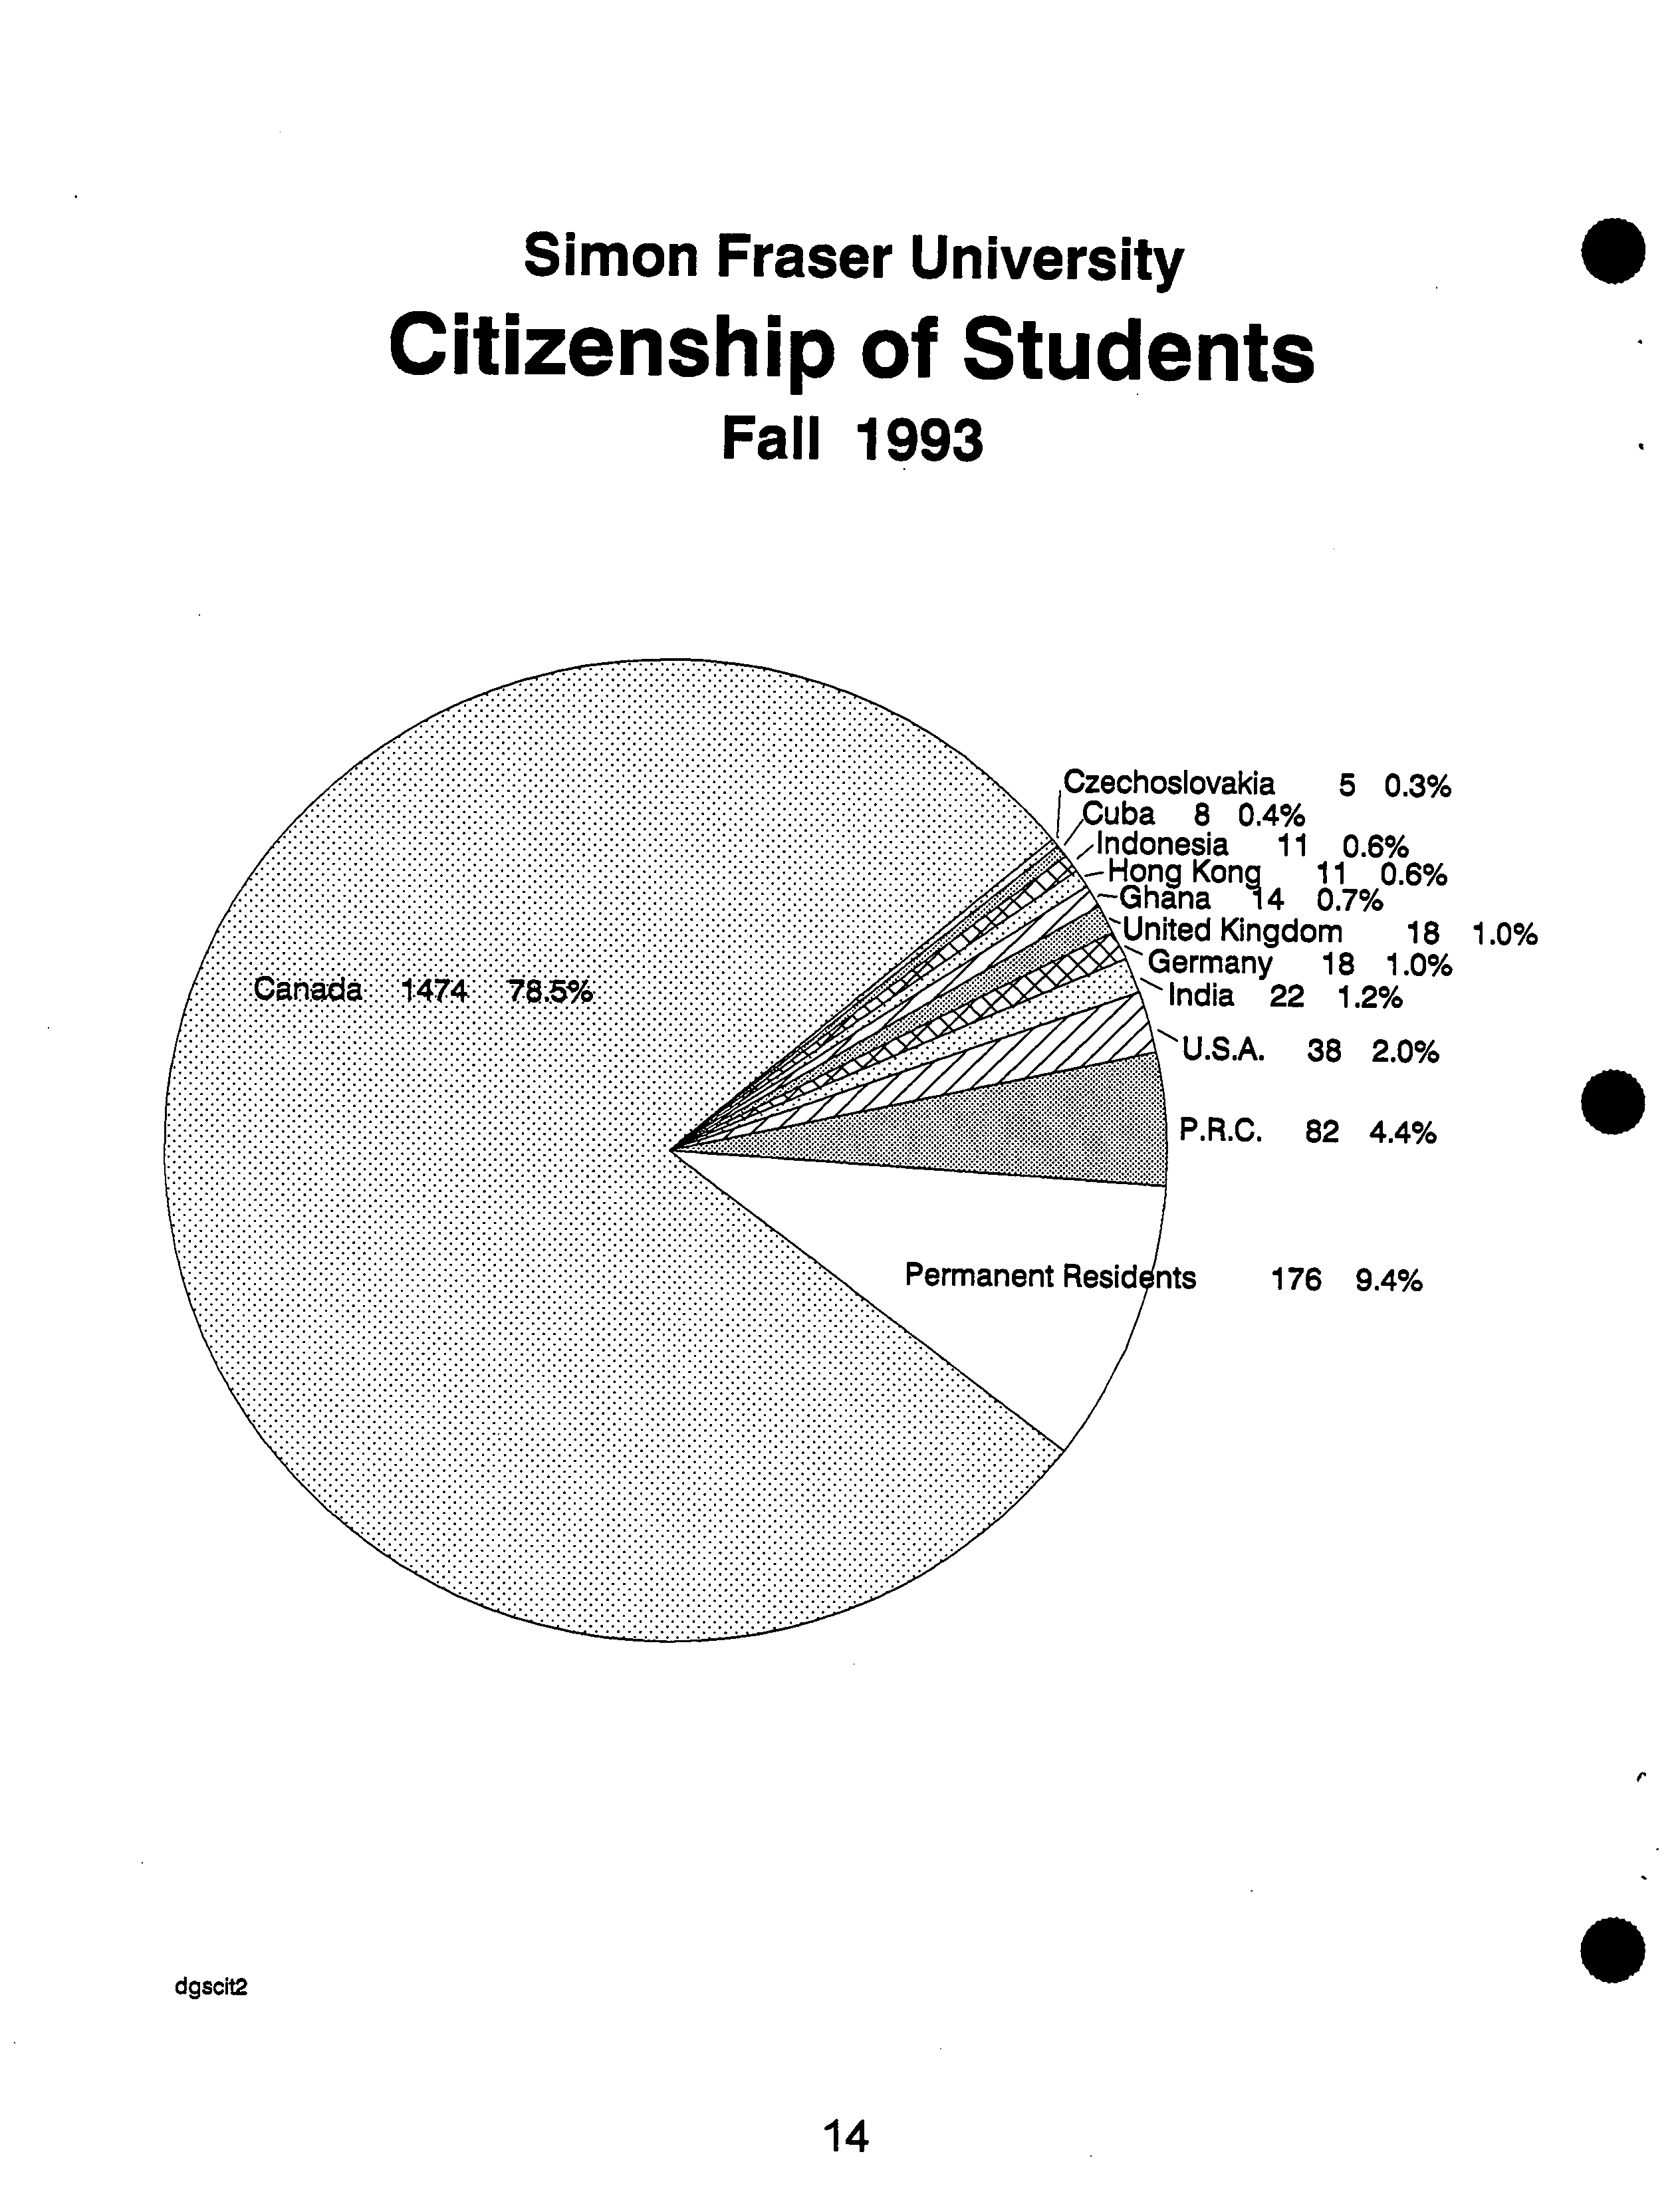
Czechoslovakia
5 ?
0.3%
Cuba ?
8 0.4%
<,Indonesia
:.,—Hon ?
on
?
11
0.6%
11 ?
0.6%
' —
Ghana ?
14
0.7%
:i?tUnited Kingdom
?
18 ?
1.0%
Germany
22
18 ?
1.0%
1.2%
U.S.A. 38 2.0%
P.R.C. 82 4.4%
176 9.4%
.
Fall 1993
Permanent
Simon Fraser University
?
C
Citizenship of Students
dgscit2
?
.
14
Simon Fraser University
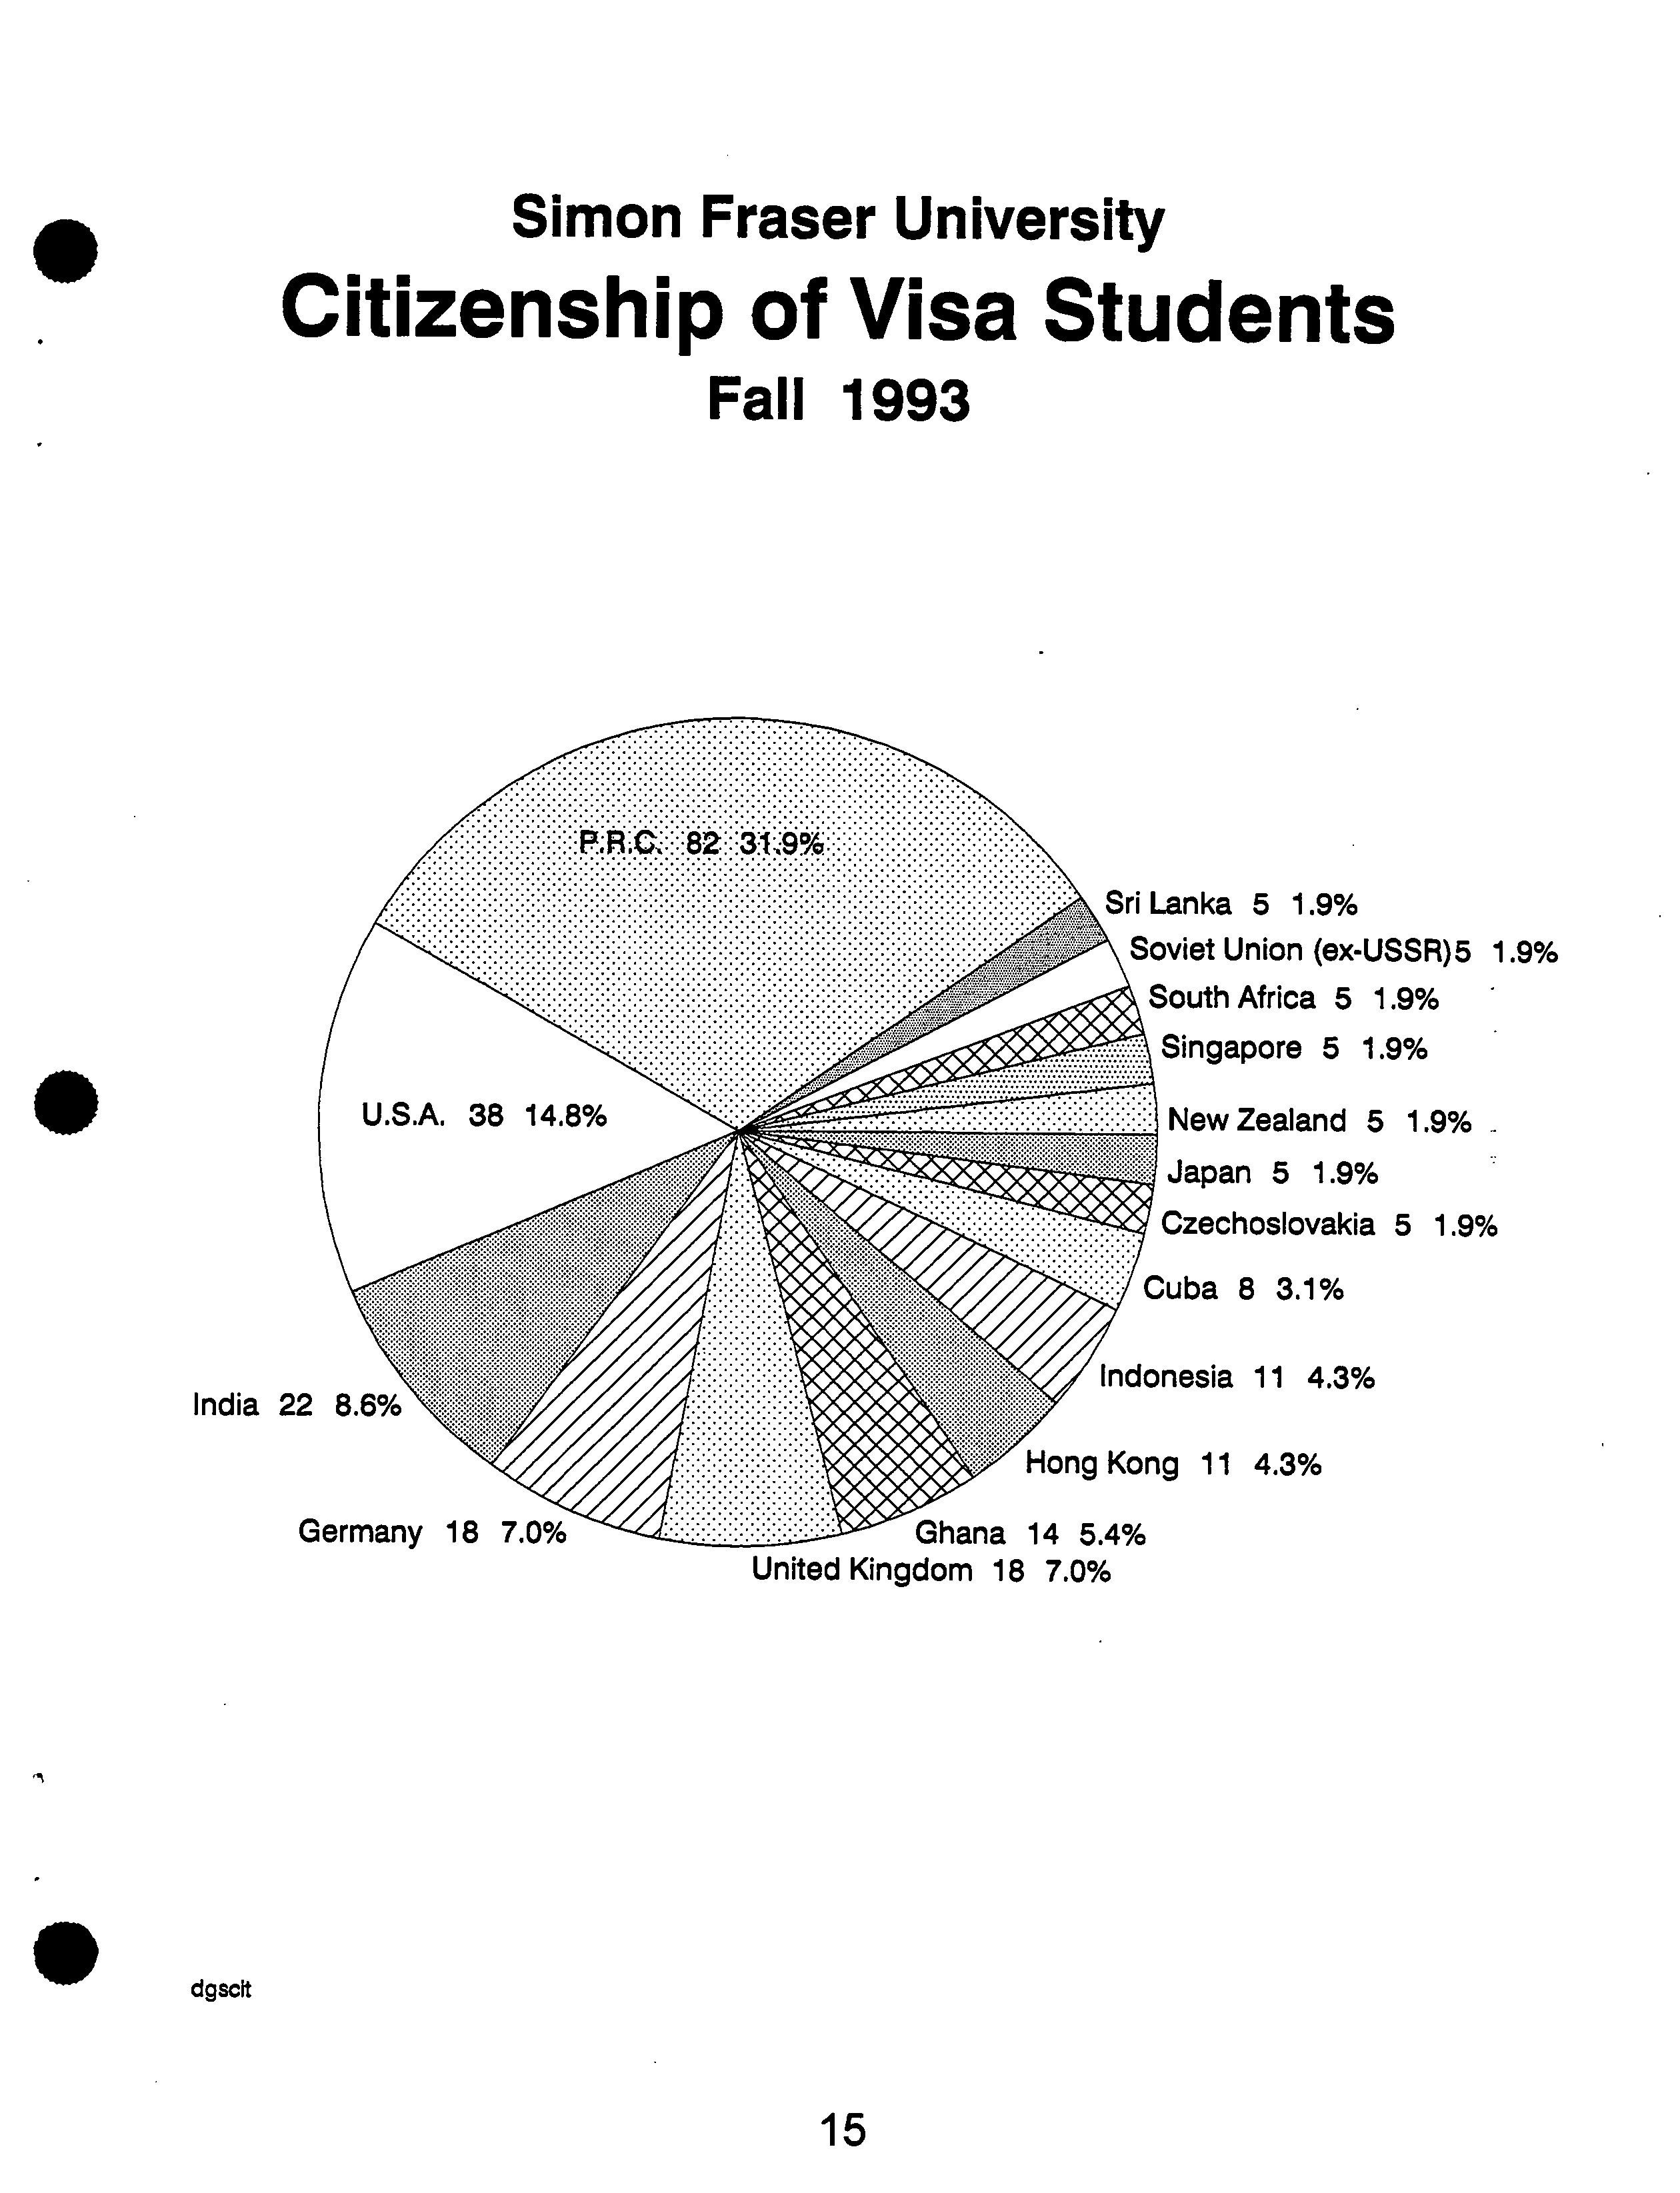
Citizenship of Visa Students
Fall 1993
Sri Lanka 5 1.9%
Soviet Union (ex-USSR)5 1.9%
South Africa 5 1.9%
. Singapore 5 1.9%
.
?
New Zealand 5 1.9%
Japan 5 1.9%
Czechoslovakia 5 1.9%
Cuba 8 3.1%
Indonesia 11 4.3%
India 22 8.6%
.
.
?
dgsclt
Hong Kong 11 4.3%
Germany 18 7.0%
?
Ghana 14 5.4%
United Kingdom 18 7.0%
15
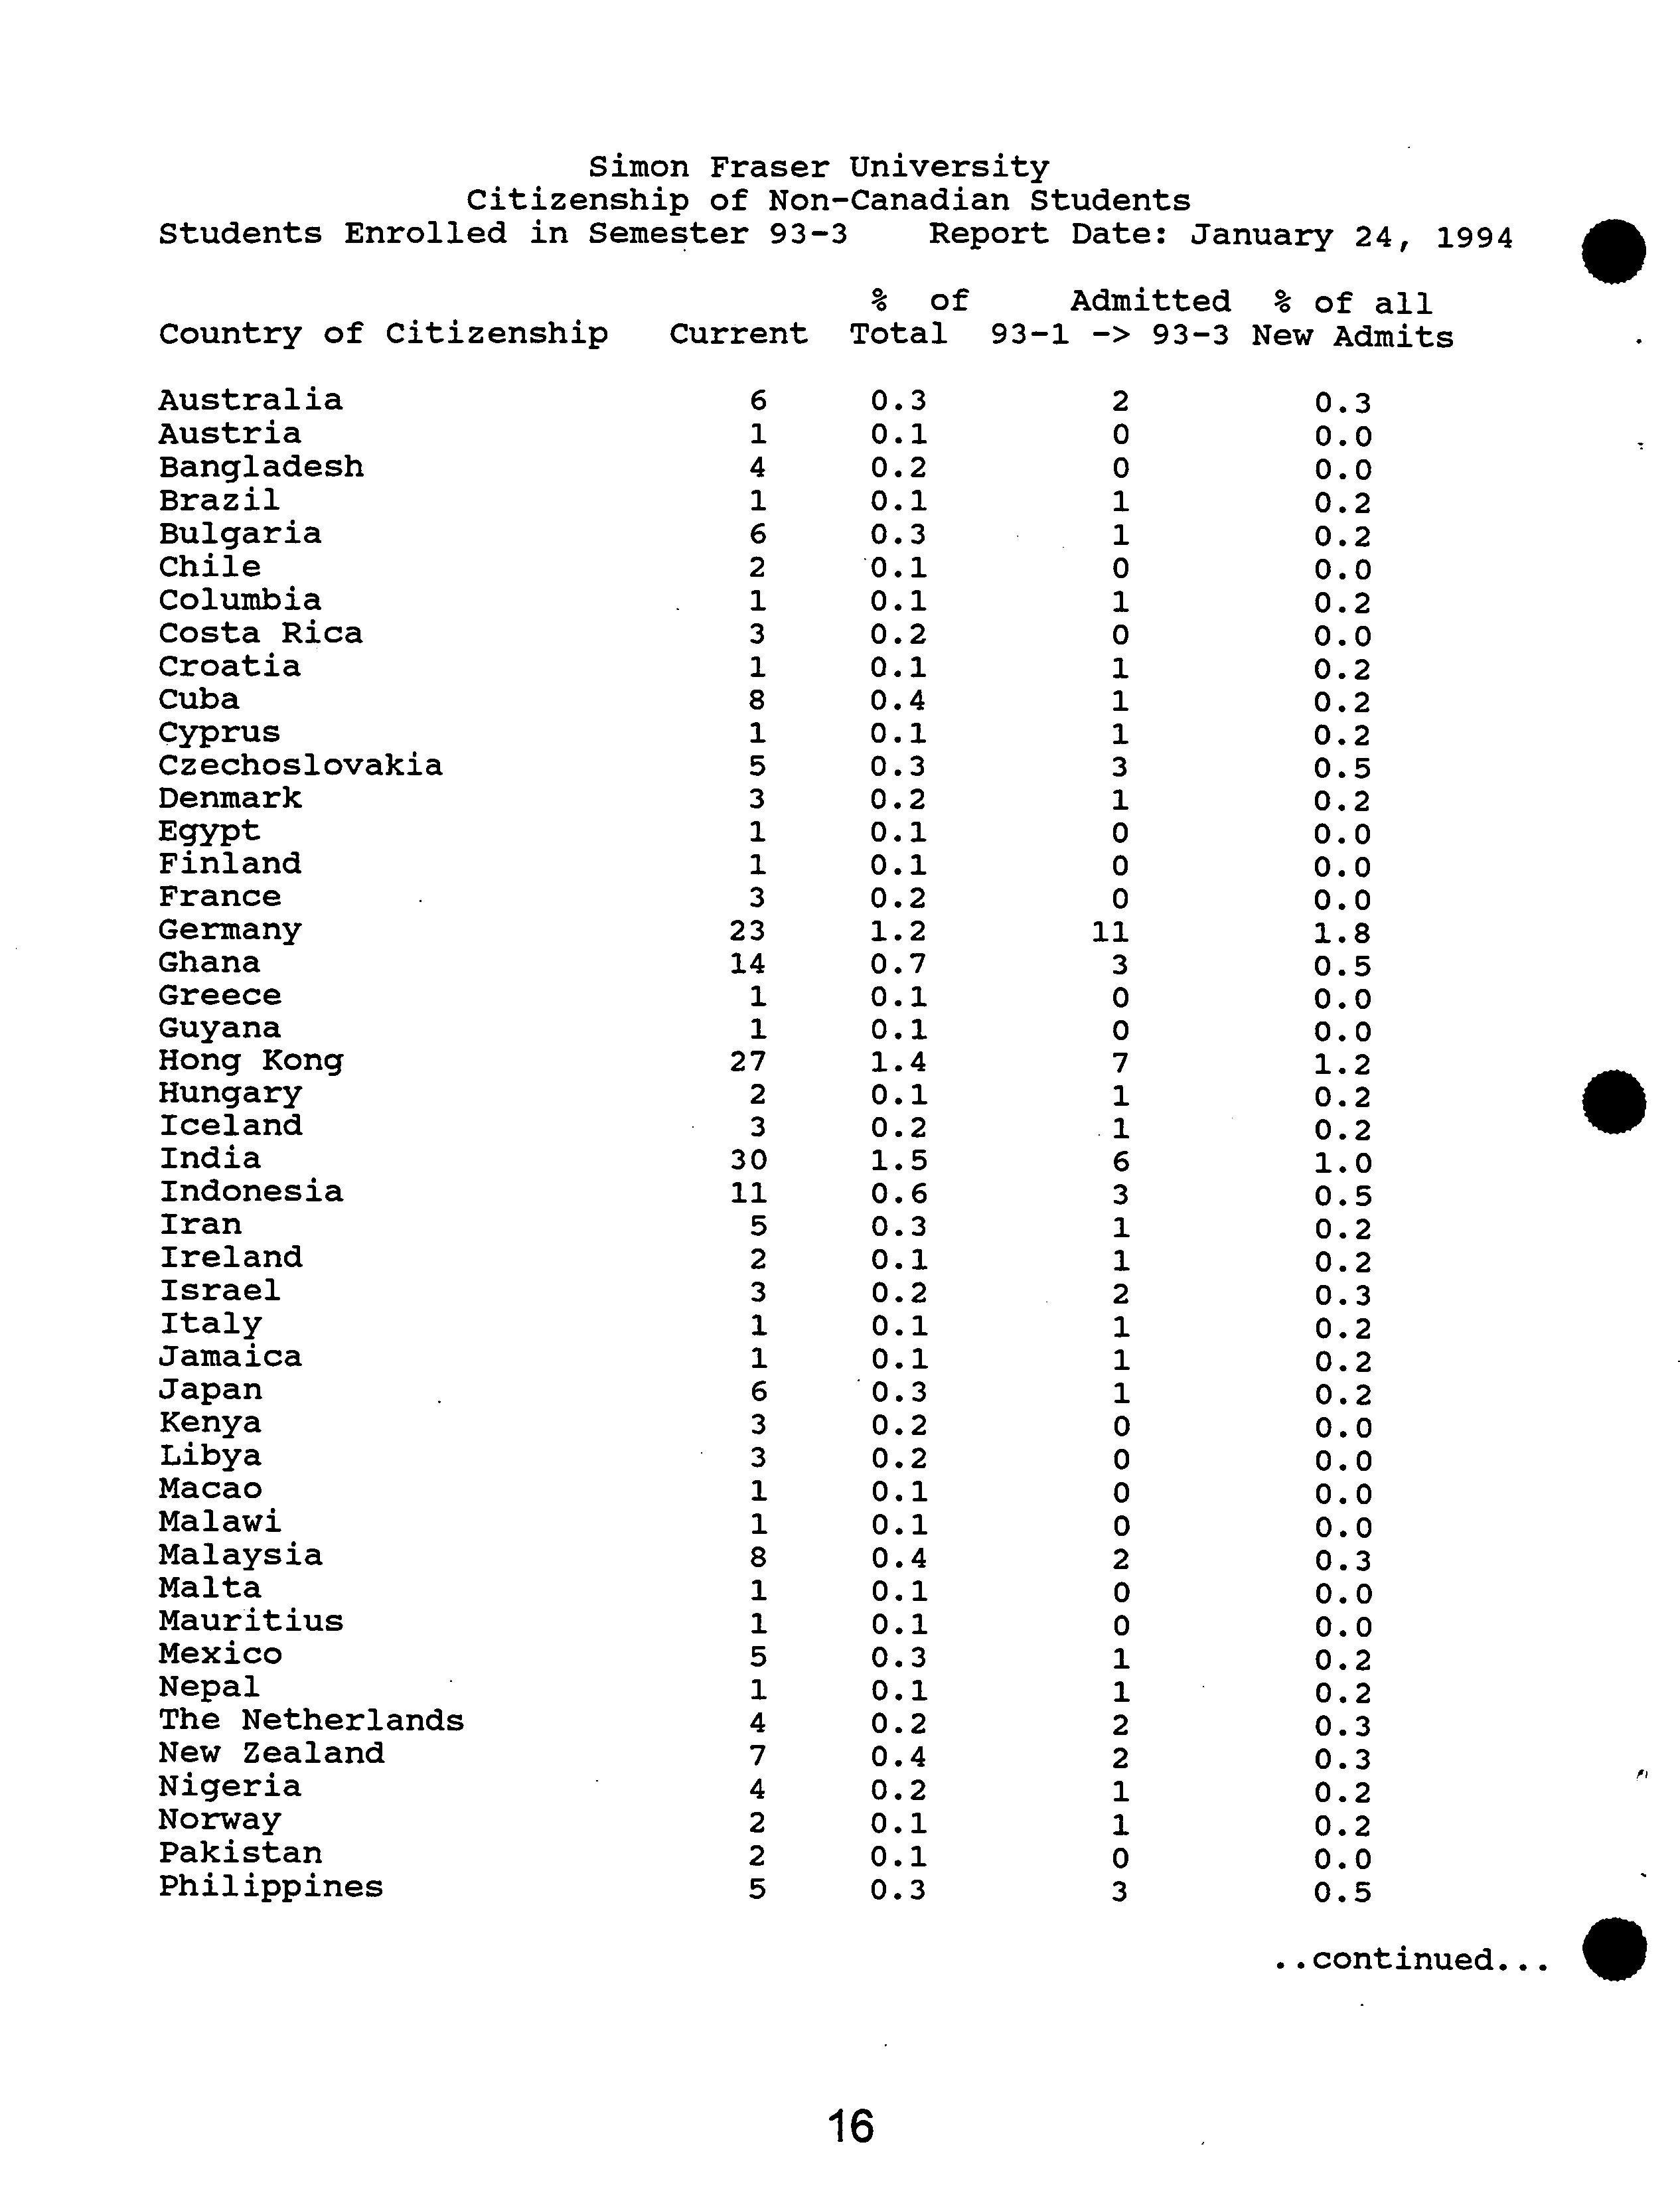
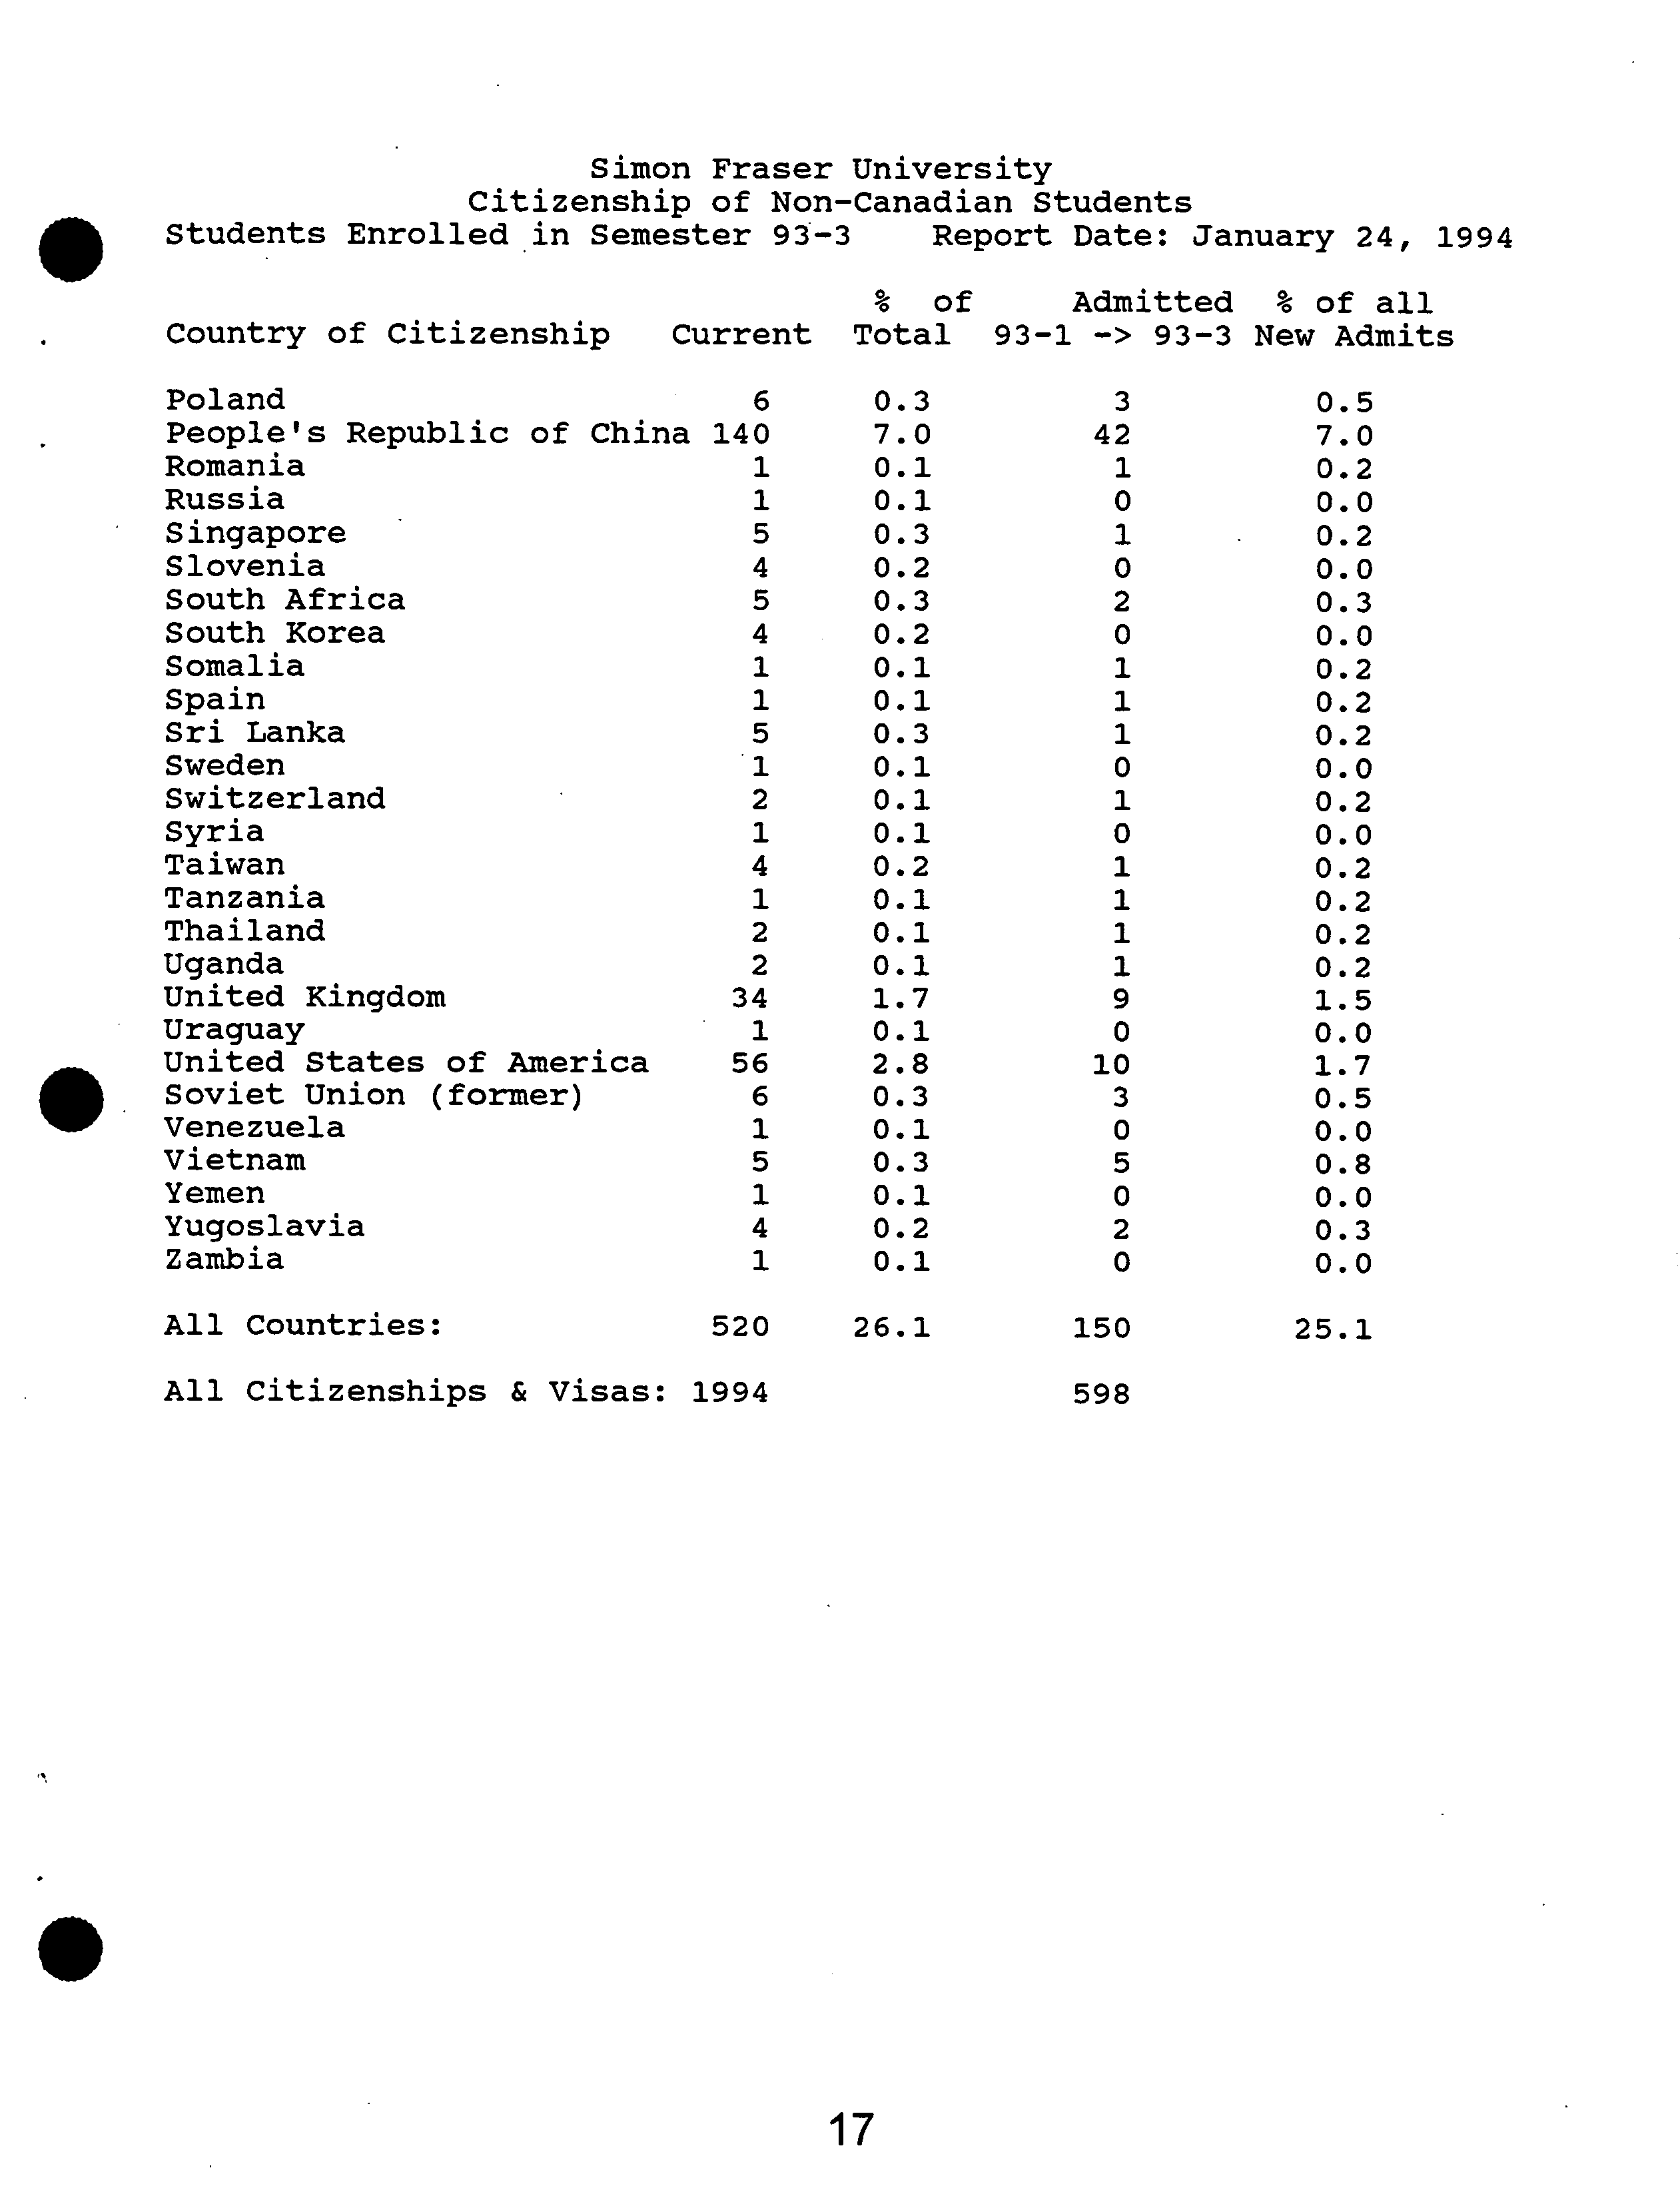
Simon Fraser University
Citizenship of Non-Canadian
Students
Students Enrolled in Semester 93-3 Report
Date: January 24, 1994
% ?
of
Admitted
% of all
Country of Citizenship ?
Current
Total ?
93-1
-> 93-3
New Admits
Australia
6
0.3
2
0.3
Austria
1
0.1
0
0.0
Bangladesh
4
0.2
0
0.0
Brazil
1
0.1
1
0.2
Bulgaria
6
0.3
1
0.2
Chile
2
0.1
0
0.0
Columbia
1
0.1
1
0.2
Costa Rica
3
0.2
0
0.0
Croatia
1
0.1
1
0.2
Cuba
8
0.4
1
0.2
Cyprus
1
0.1
1
0.2
Czechoslovakia
5
0.3
3
0.5
Denmark
3
0.2
1
0.2
Egypt
1
0.1
0
0.0
Finland
1
0.1
0
0.0
France
3
0.2
0
0.0
Germany
23
1.2
11
1.8
Ghana
14
0.7
3
0.5
Greece
1
0.1
0
0.0
Guyana
1
0.1
0
0.0
Hong Kong
27
1.4
7
1.2
Hungary
2
0.1
1
0.2
Iceland
3
0.2
1
0.2
India
30
1.5
6
1.0
Indonesia
11
0.6
3
0.5
Iran
5
0.3
1
0.2
Ireland
2
0.1
1
0.2
Israel
3
0.2
2
0.3
Italy
1
0.1
1
0.2
Jamaica
1
0.1
1
0.2
Japan
6
0.3
1
0.2
Kenya
3
0.2
0
0.0
Libya
3
0.2
0
0.0
Macao
1
0.1
0
0.0
Malawi
1
0.1
0
0.0
Malaysia
8
0.4
2
0.3
Malta
1
0.1
0
0.0
Mauritius
1
0.1
0
0.0
Mexico
5
0.3
1
0.2
Nepal
1
0.1
1
0.2
The Netherlands
4
0.2
2
0.3
New Zealand
7
0.4
2
0.3
Nigeria
4
0.2
1
0.2
Norway
2
0.1
1
0.2
Pakistan
2
0.1
0
0.0
Philippines
5
0.3
3
0.5
..continued...
1E
Simon
Fraser University
Citizenship
of Non-Canadian
Students
Students Enrolled in Semester
93-3 Report
Date: January 24, 1994
% ?
of Admitted
% of all
•
Country of Citizenship
?
Current Total ?
93-1
-> 93-3
New Admits
Poland
6
0.3
3
0.5
•
People's Republic of China
140
7.0
42
7.0
Romania
1
0.1
1
0.2
Russia
1
0.1
0
0.0
Singapore
5
0.3
1
0.2
Slovenia
4
0.2
0
0.0
South Africa
5
0.3
2
0.3
South Korea
4
0.2
0
0.0
Somalia
1
0.1
1
0.2
Spain
1
0.1
1
0.2
Sri Lanka
5
0.3
1
0.2
Sweden
1
0.1
0
0.0
Switzerland
2
0.1
1
0.2
Syria
1
0.1
0
0.0
Taiwan
4
0.2
1
0.2
Tanzania
1
0.1
1
0.2
Thailand
2
0.1
1
0.2
Uganda
2
0.1
1
0.2
United Kingdom
34
1.7
9
1.5
Uraguay
1
0.1
0
0.0
•
United States of America
Soviet Union (former)
56
6
2.8
0.3
10
3
1.7
0.5
Venezuela
1
0.1
0
0.0
Vietnam
5
0.3
5
0.8
Yemen
1
0.1
0
0.0
Yugoslavia
4
0.2
2
0.3
Zambia
1
0.1
0
0.0
All Countries:
520
26.1
150
25.1
All Citizenships & Visas:
1994
598
17
Simon Fraser University
Citizenship of Non-Canadian Students, including Visa Types: SDUV
?
Students Enrolled in Semester 93-3
?
Report Date,: January 24, 1994
% ?
of
Admitted
% of all
Country of Citizenship
Current
Total 93-1 -> 93-3
New Admits
Australia
3
0.2
2
0.3
Austria
1
0.1
0
0.0
Bangladesh
4
0.2
0
0.0
Brazil
1
0.1
1
0.2
Bulgaria
3
0.2
0
0.0
Chile
2
0.1
0
0.0
Columbia
1
0.1
1
0.2
Costa Rica
3
0.2
0
0.0
Croatia
1
0.1
1
0.2
Cuba
8
0.4
1
0.2
Cyprus
0
0.0
0
0.0
Czechoslovakia
5
0.3
3
0.5
Denmark
2
0.1
1
0.2
Egypt
1
0.1
0
0.0
Finland
.0
0.0
0
0.0
France
1
0.1
0
0.0
Germany
18
0.9
10
1.7
Ghana
14
0.7
3
0.5
Greece
1
0.1
0
0.0
Guyana
1
0.1
0
0.0
Hong Kong
11
0.6
5
0.8
Hungary
1
0.1
1
0.2
Iceland
3
0.2
1
0.2
India
22
1.1
4
0.7
Indonesia
11
0.6
3
0.5
Iran
3
0.2
1
0.2
Ireland
0
0.0
0
0.0
Israel
0
0.0
0
0.0
Italy
1
0.1
1
0.2
Jamaica
1
0.1
1
0.2
Japan
5
0.3
1
0.2
Kenya
2
0.1
0
0.0
Libya
3
0.2
0
0.0
Macao
1
0.1
0
0.0
Malawi
1
0.1
0
0.0
Malaysia
3
0.2
2
0.3
Malta
0
0.0
0
0.0
Mauritius
0
0.0
0
0.0
Mexico
3
0.2
0
0.0
Nepal
1
0.1
1
0.2
The Netherlands
3
0.2
2
0.3
New Zealand
5
0.3
1
0.2
Nigeria
2
0.1
1
0.2
Norway
2
0.1
1
0.2
Pakistan
2
0.1
0
0.0
Philippines
2
0.1
2
0.3
.
L
..continued... .
18
Simon
Fraser University
Citizenship of Non-Canadian
Students,
including Visa
Types: SDUV
Students Enrolled in Semester
93-3 Report
Date: January 24, 1994
% ?
of
Admitted
% of all
•
Country of Citizenship
?
Current
Total ?
93-1
-> 93-3
New Admits
Poland
2
0.1
1
0.2
•
People's Republic of China
82
4.1
34
5.7
Romania
0
0.0
0
0.0
Russia
1
0.1
0
0.0
Singapore
5
0.3
1
0.2
Slovenia
4
0.2
0
0.0
South Africa
5
0.3
2
0.3
South Korea
3
0.2
0
0.0
Somalia
0
0.0
0
0.0
Spain
1
0.1
1
0.2
Sri Lanka
5
0.3
1
0.2
Sweden
1
0.1
0
0.0
Switzerland
1
0.1
0
0.0
Syria
0
0.0
0
0.0
Taiwan
3
0.2
1
0.2
Tanzania
1
0.1
1
0.2
Thailand
2
0.1
1
0.2
Uganda
0
0.0
0
0.0
United Kingdom
18
0.9
2
0.3
Uraguay
1
0.1
0
0.0
United States of America
38
1.9
9
1.5
.
Soviet Union (former)
5
0.3
3
0.5
Venezuela
0
0.0
0
0.0
Vietnam
5
0.3
5
0.8
Yemen
1
0.1
0
0.0
Yugoslavia
1
0.1
0
0.0
Zambia
1
0.1
0
0.0
All Countries:
344
17.3
113
18.9
All Citizenships & Visas:
1994
598
19
TS 1kUn.
1
a
:let*
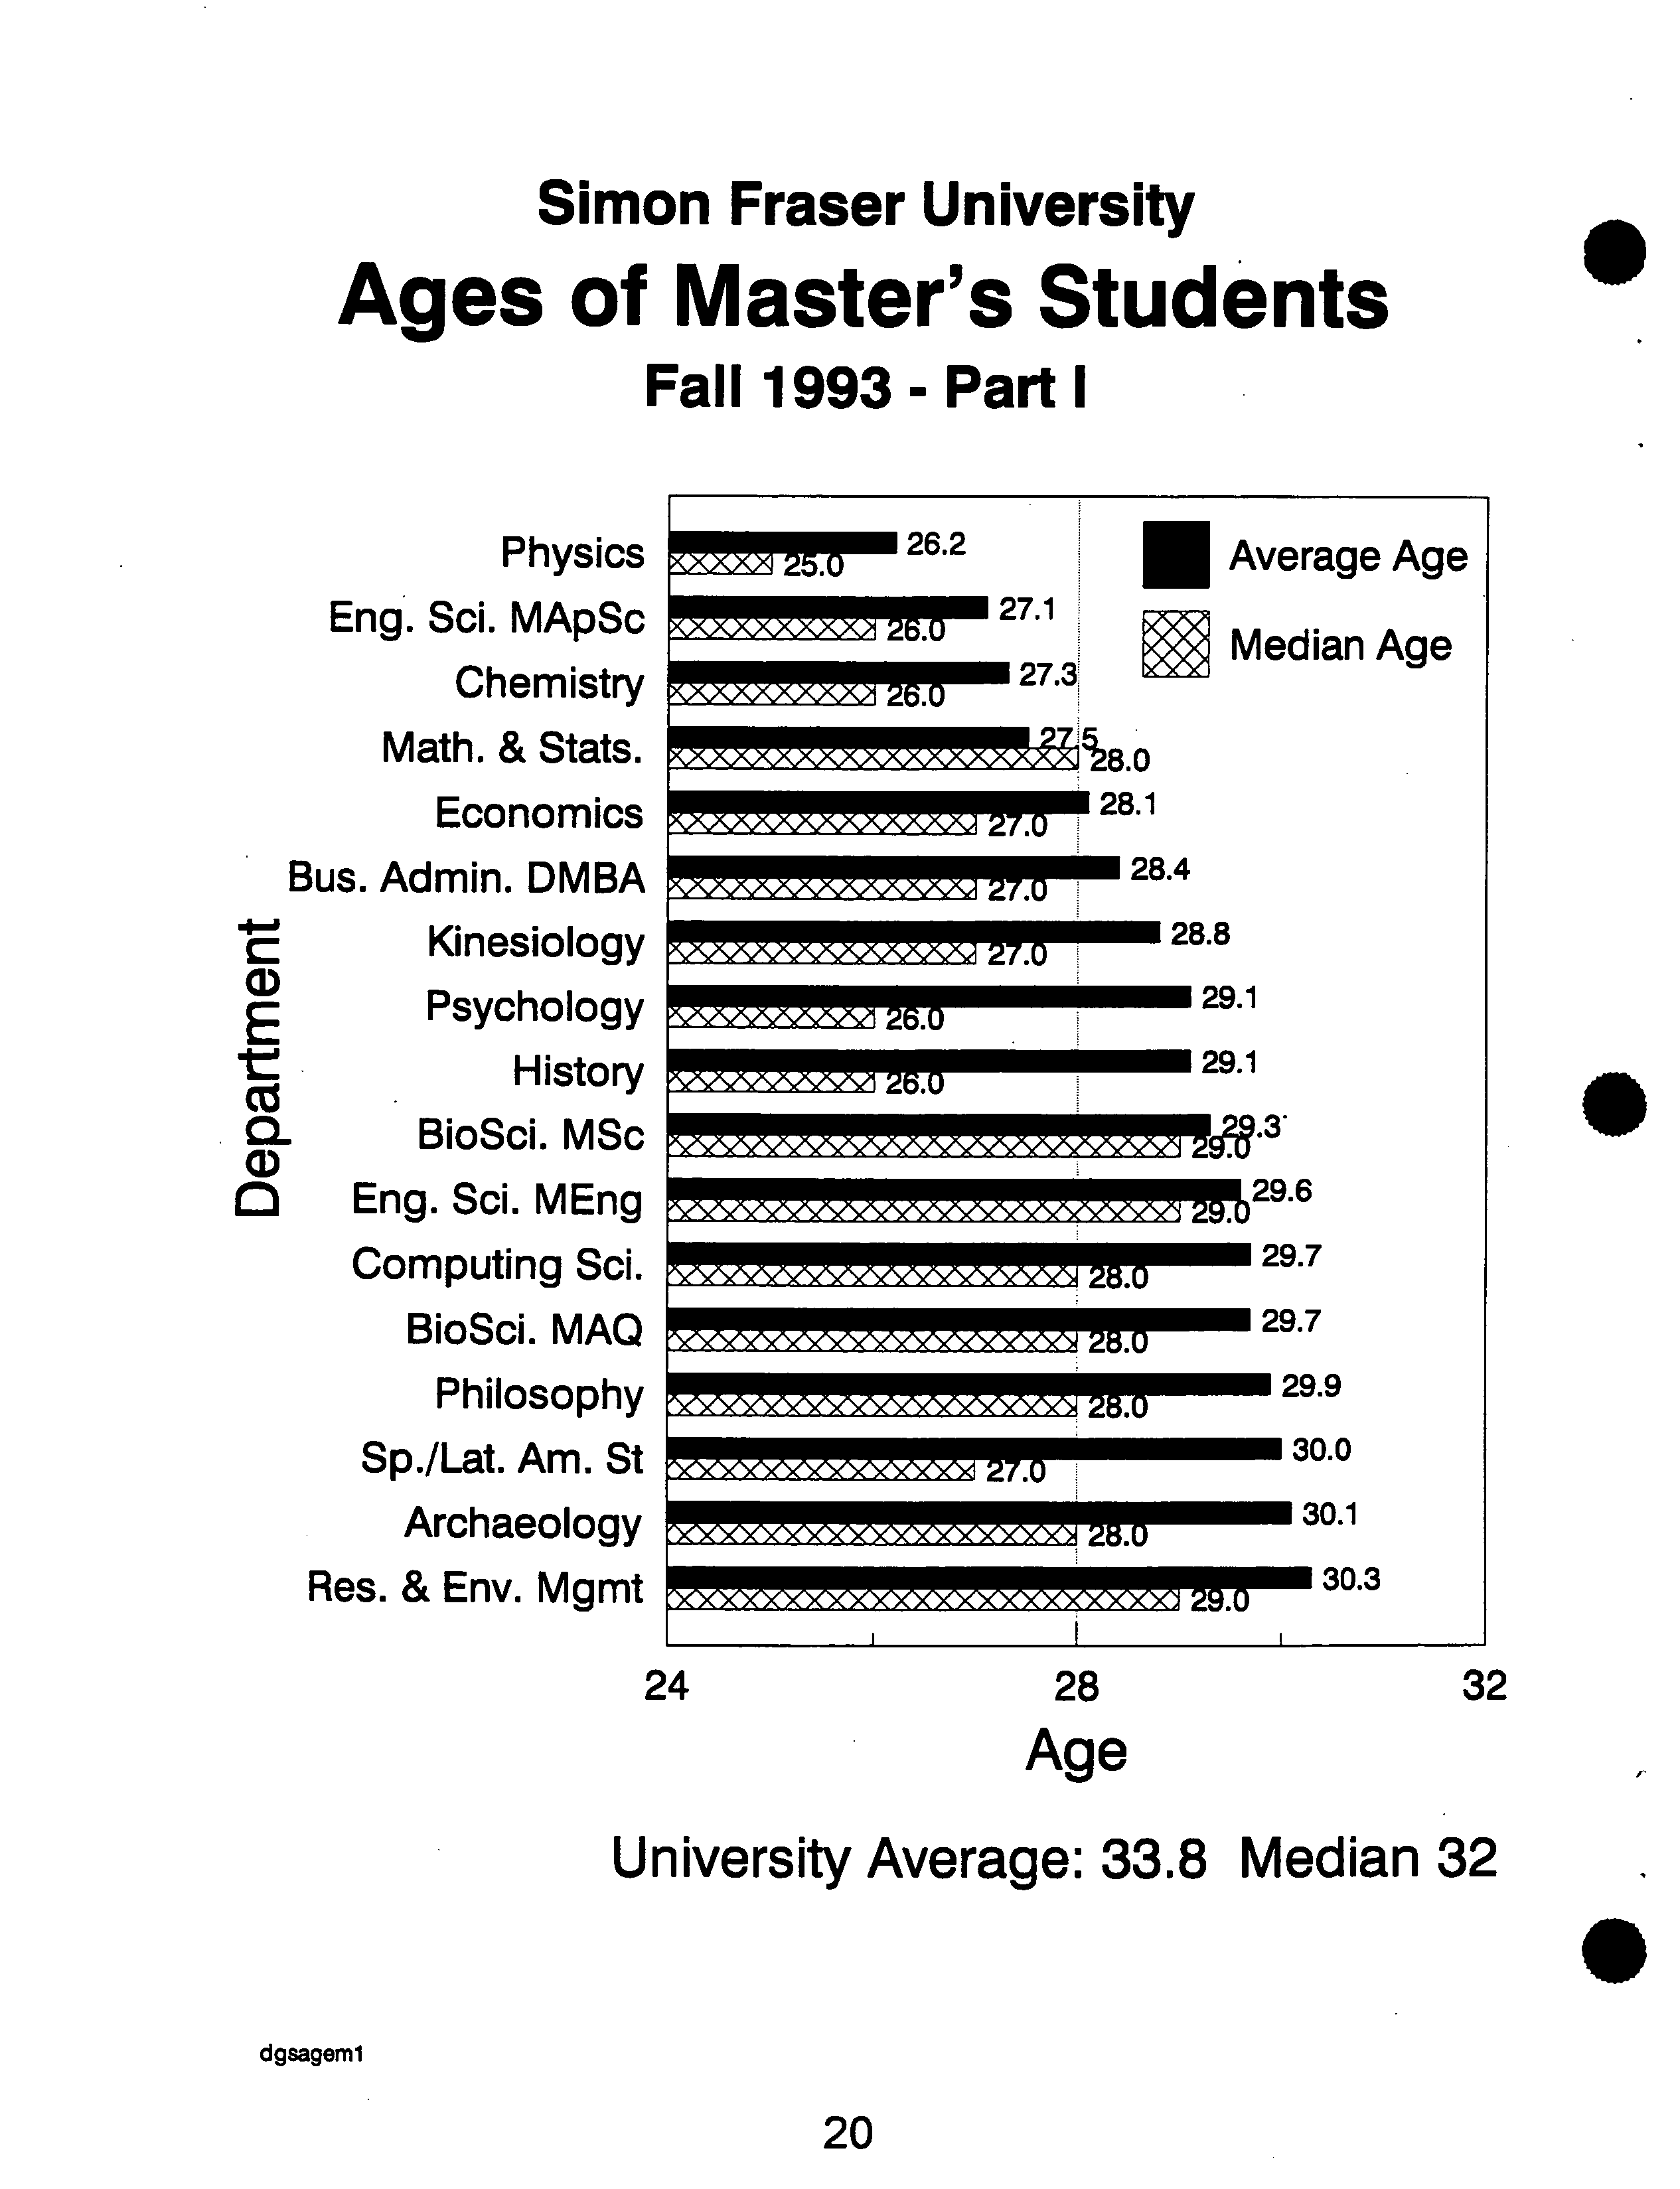
Simon Fraser University
Ages of Master's Students
Fall 1993 - Part II
Geography MSc
?
Political Sci.
?
BioSci. MPM ?
Criminology ?
Geography MA?
Contemp. Arts?
Communication?
English ?
Soc. & Anth.
CZ Women's Studies
CL
Lang. & Ling.
Bus. Admin. WMBA ?
Education MSc?
Education MA
?
Bus. Admin. EMBA ?
Education MEd?
Liberal Studies?
SpI. Arr. MA
6
3.8
1
28
?
32
?
36
?
40 ?
44 ?
48
Age
University Average: 33.8 Median 32
dgsagem2
21
Computing Sd.
Chemistry
Math. & Stats.
Kinesiology
Physics
Engineering Sd.
Biological Sci.
Economics
E ?
Psychology
English
CI ?
Criminology
Soc. & Anth.
Lang. & Ling.
Geography
Communication
History
Archaeology
SpI. Arrangemnts
Education
Simon Fraser University
Ages of Doctoral Students
Fall 1993
.
28 ?
32 ?
36 ?
40 ?
44
Age
University Average: 35.0 Median 33
I
dgsagep
22
S.F.U. Graduate Student Age Distributions
All Master's
Students January
18,
1994
#of
Age
Department
Pgin
Stu.
<20 20-29 30-39 40-49
50-64
>64
Median
Ave.
Archaeology
MA 21 0
13 6
2 0
0
28
30.1
Biological Sci.
MAQ 13 0
8 5
0
0
0
28
29.7
• Biological Sci.
MPM
30 0 13 14
3 0
0
31
31.0
Biological Sci.
MSC 53 0
33 18
2 0
0
29
29.3
Bus. Admin.
MBA 111
0
80 28
3
0
0
27
28.4
Bus. Admin.
MBE 109
0
4 63
37
5 0
38
39.1
Bus. Admin.
MBW 56 0
5 32
18
1 0
37
37.6
Chemistry
MSC
26 0
21 5
0
0
0
26 27.3
Communication
MA 42 0 11
23
8
0 0
32
34.1
Computing
Sd.
MSC
44
0 30
11
3
0
0
28
29.7
Contemp. Arts
MFA 16 0
6 8
2
0 0
31
33.0
Criminology
MA 38 0 20
11 7
0 0
30
31.8
Economics
MA 43 0
33
10 0
0
0
27
28.1
Education
MA 130
0 18 52
49
11
0
39
39.1
Education
MED 139 0 6
56
60
17
0
41
41.4
Education
MSC
35 0 6
14
12
3
0
37
38.8
Engineering Sci.
MAP
37 0
30
7
0
0
0
26
27.1
Engineering Sci.
MEN 24 0
14 9
1
0
0
29
29.6
English
MA 42
0 15
15
10
2 0
34
34.9
Geography
MA 26
0 14
5 7
0
0
29
32.9
Geography
MSC 16
0 10
5
0
1
0
26
30.6
•
History
Kinesiology
MA
MSC
33
26
0
0
24
20
5
5
4
1
0
0
0
0
26
27
29.1
28.8
Lang. & Ling.
MA 14
0
5
3
5
1
0
36
36.4
Liberal Studies
MAL
50 0
1
10
30
9 0
45
44.4
Math. & Stats.
MSC
39 0
31
8 0
0 0
28
27.5
Philosophy
MA
13 0
9
3
1
0
0
28
29.9
Physics
MSC 22
0 19
3
0
0
0
25
26.2
Political Sci.
MA
32 0 17
12
2
1
0
30
30.7
Psychology
MA
40 0
26
12
1
1
0
26
29.1
Res. & Env. Mgmt
NRN
73
0 41
28
4
0
0
29
30.3
Soc. & Anth.
MA 29
0
13
7
5
4
0
31
35.8
Sp. & Lat. Am. S
MA
8
0
5
2
1
0
0
27
30.0
Spi. Arrangemnts
MAS
1
0
0
0
1
0
0
48
48.0
Women's Studies
MA
16
0
6
8
0
1
1
34
36.1
University:
1447
0 607
503
279
57
1
32
33.8
23
# of
Department
Pgm Stu.
Archaeology
PHD
11
Biological Sci.
PHD 65
Chemistry
PHD 35
Communication
PHD 29
Computing Sci.
PHD
36
Criminology
PHD
21
Economics
PHD
35
Education
PHD 52
Engineering Sci.
PHD 15
English
PHD
19
Geography
PHD
15
History
PHD
8
Kinesiology
PHD
24
Lang. & Ling.
PHD
22
Math. & Stats.
PHD 28
Physics
PHD 36
Psychology
PHD 65
Soc. ?
& Anth.
PHD
6
Spi. Arrangemnts
PHS 25
University: ?
547
S.F.U. Graduate Student Age Distributions
All Doctoral Students January 18, 1994
Age
S
<20
20-29
30-39 40-49
50-64
>64
Median
Ave.
0 2
2 5
2 0
42
41.5
0
21
34 7
3
0
32
33.6
0 16
19 0
0
0
30
30.1
0 3
12
14
0 0
38
38.8
0 26
10
0
0 0
29
29.8
0 5
11 5
0 0
37
36.0
0 9
21
4
1 0
32
33.9
0 1
14
28
9 0
43
43.6
0
5
9 1
0
0
32
32.1
0
5
8
6
0 0
35
35.9
0
3
8 3
1 0
38
37.7
0 1
3
3
1 0
40
41.4
0 13
8
3
0 0
29
30.9
0
3
10
8
1 0
35
37.6
0
14
13
1
0 0
30
30.2
o 19
15
1
1
0
29
30.9
0
22
32
10
1
0
32
33.9
0
2
1
3
0
0
33
36.3
0
4
7 8
6
0
43
42.0
0 174
237
110
26
0
33
35.0
.
S
24
I
Simon Fraser University
Master's Degree Completion Times
Fall 1985- Summer 1993 Part II
Lang. & Ling. MA
Bio. Sci. MSc
Education MEd
History
Education MSc
Education MA
SpI. Arr. MA
E
?
Spi. Arr. MSc
Cz
Res. & Env. Mgmt
C)
2
?
Criminology
Geography MA
Soc. & Anth.
Communication
English
Political Sci.
Archaeology
Eng. Sci. MEng
Lang. & Ling. MATF
.
7.0 ?
9.0 ?
11.0
?
13.0
?
15.0
?
17.0
8.0 ?
10.0 ?
12.0 ?
14.0
?
16.0
Semesters to Completion
0
Average Time
0
Median Time
University
Average: 10.16 Median 9
dgstim2
26
inrtnri EJ
1Fi
Simon Fraser University
Time in Program - Completion by Graduation
in 85-3 through 93-2 as of January 25, 1994
Number of ?
Semesters in Program
Department ?
Program
Persons Min
Max
Average
Median
Archaeology
MA
28
6
18
13.61
14
Archaeology
PHD
15
12
27
20.40
22
Biological
Sd.
MAQ
8
3
6
5.00
5
Biological Sci.
MPM
81
5
17
10.35
10
Biological Sci.
MSC
85
5
17
10.74
10
Biological Sci.
PHD
81
10
28
16.36
16
Bus. Admin.
MBA
134
3
18
6.92
6
BUS.
Admin.
MBE
227
5
31
10.29
9
Bus. Admin.
MBW
23
3
7
5.91
6
Contemp. Arts
MFA
7
5
8
6.71
6
ChemistryChemistry
MSCPHD
4141
11
4
2418
17.349.73
17
9
Communication
MA
64
5
45
12.25
12
Communication
PHD
8
11
24
15.88
15
Computing
Computing
Sci.Sci.
MSCPHD
11415
11
4
25
18
16.278.89
15
8
CriminologyCriminology
MA
PHD
63
2
9
3
20
33
11.9814.50
11
9
Lang.
Lang.
Lang.
&
&
&
Ling.Ling.Ling.
MAT
MA
PHD
12
47
14
7
3
242817
18.7510.5816.43
16
11
15
EconomicsEconomics
MA
PHD
12640
11
3
2442
18.506.97
18
6
EducationEducationEducationEducation
MSCMEDMAPHD
20825720
16
84
3
6
23
21
3416
11.3114.9511.2311.39
15
11
12
11
EnglishEnglish
MA
PHD
80
9
12
3
2939
18.2212.66
11
19
Engineering
Engineering
Engineering Sci.Sci.Sci.
MENMAPPHD
4910
1
10
8
3
20
12
8
14.408.006.20
14
8
6
GeographyGeography
MSCMA
26
17
76
21
12
12.128.47
11
9
.continued...
.
.
28
Simon Fraser
University
Time in Program
- Completion by
Graduation
in 85-3 through 93-2 ?
as of January 25,
1994
Number of
Semesters
in Program
Department ?
Program
?
Persons
Min
Max
Average ?
Median
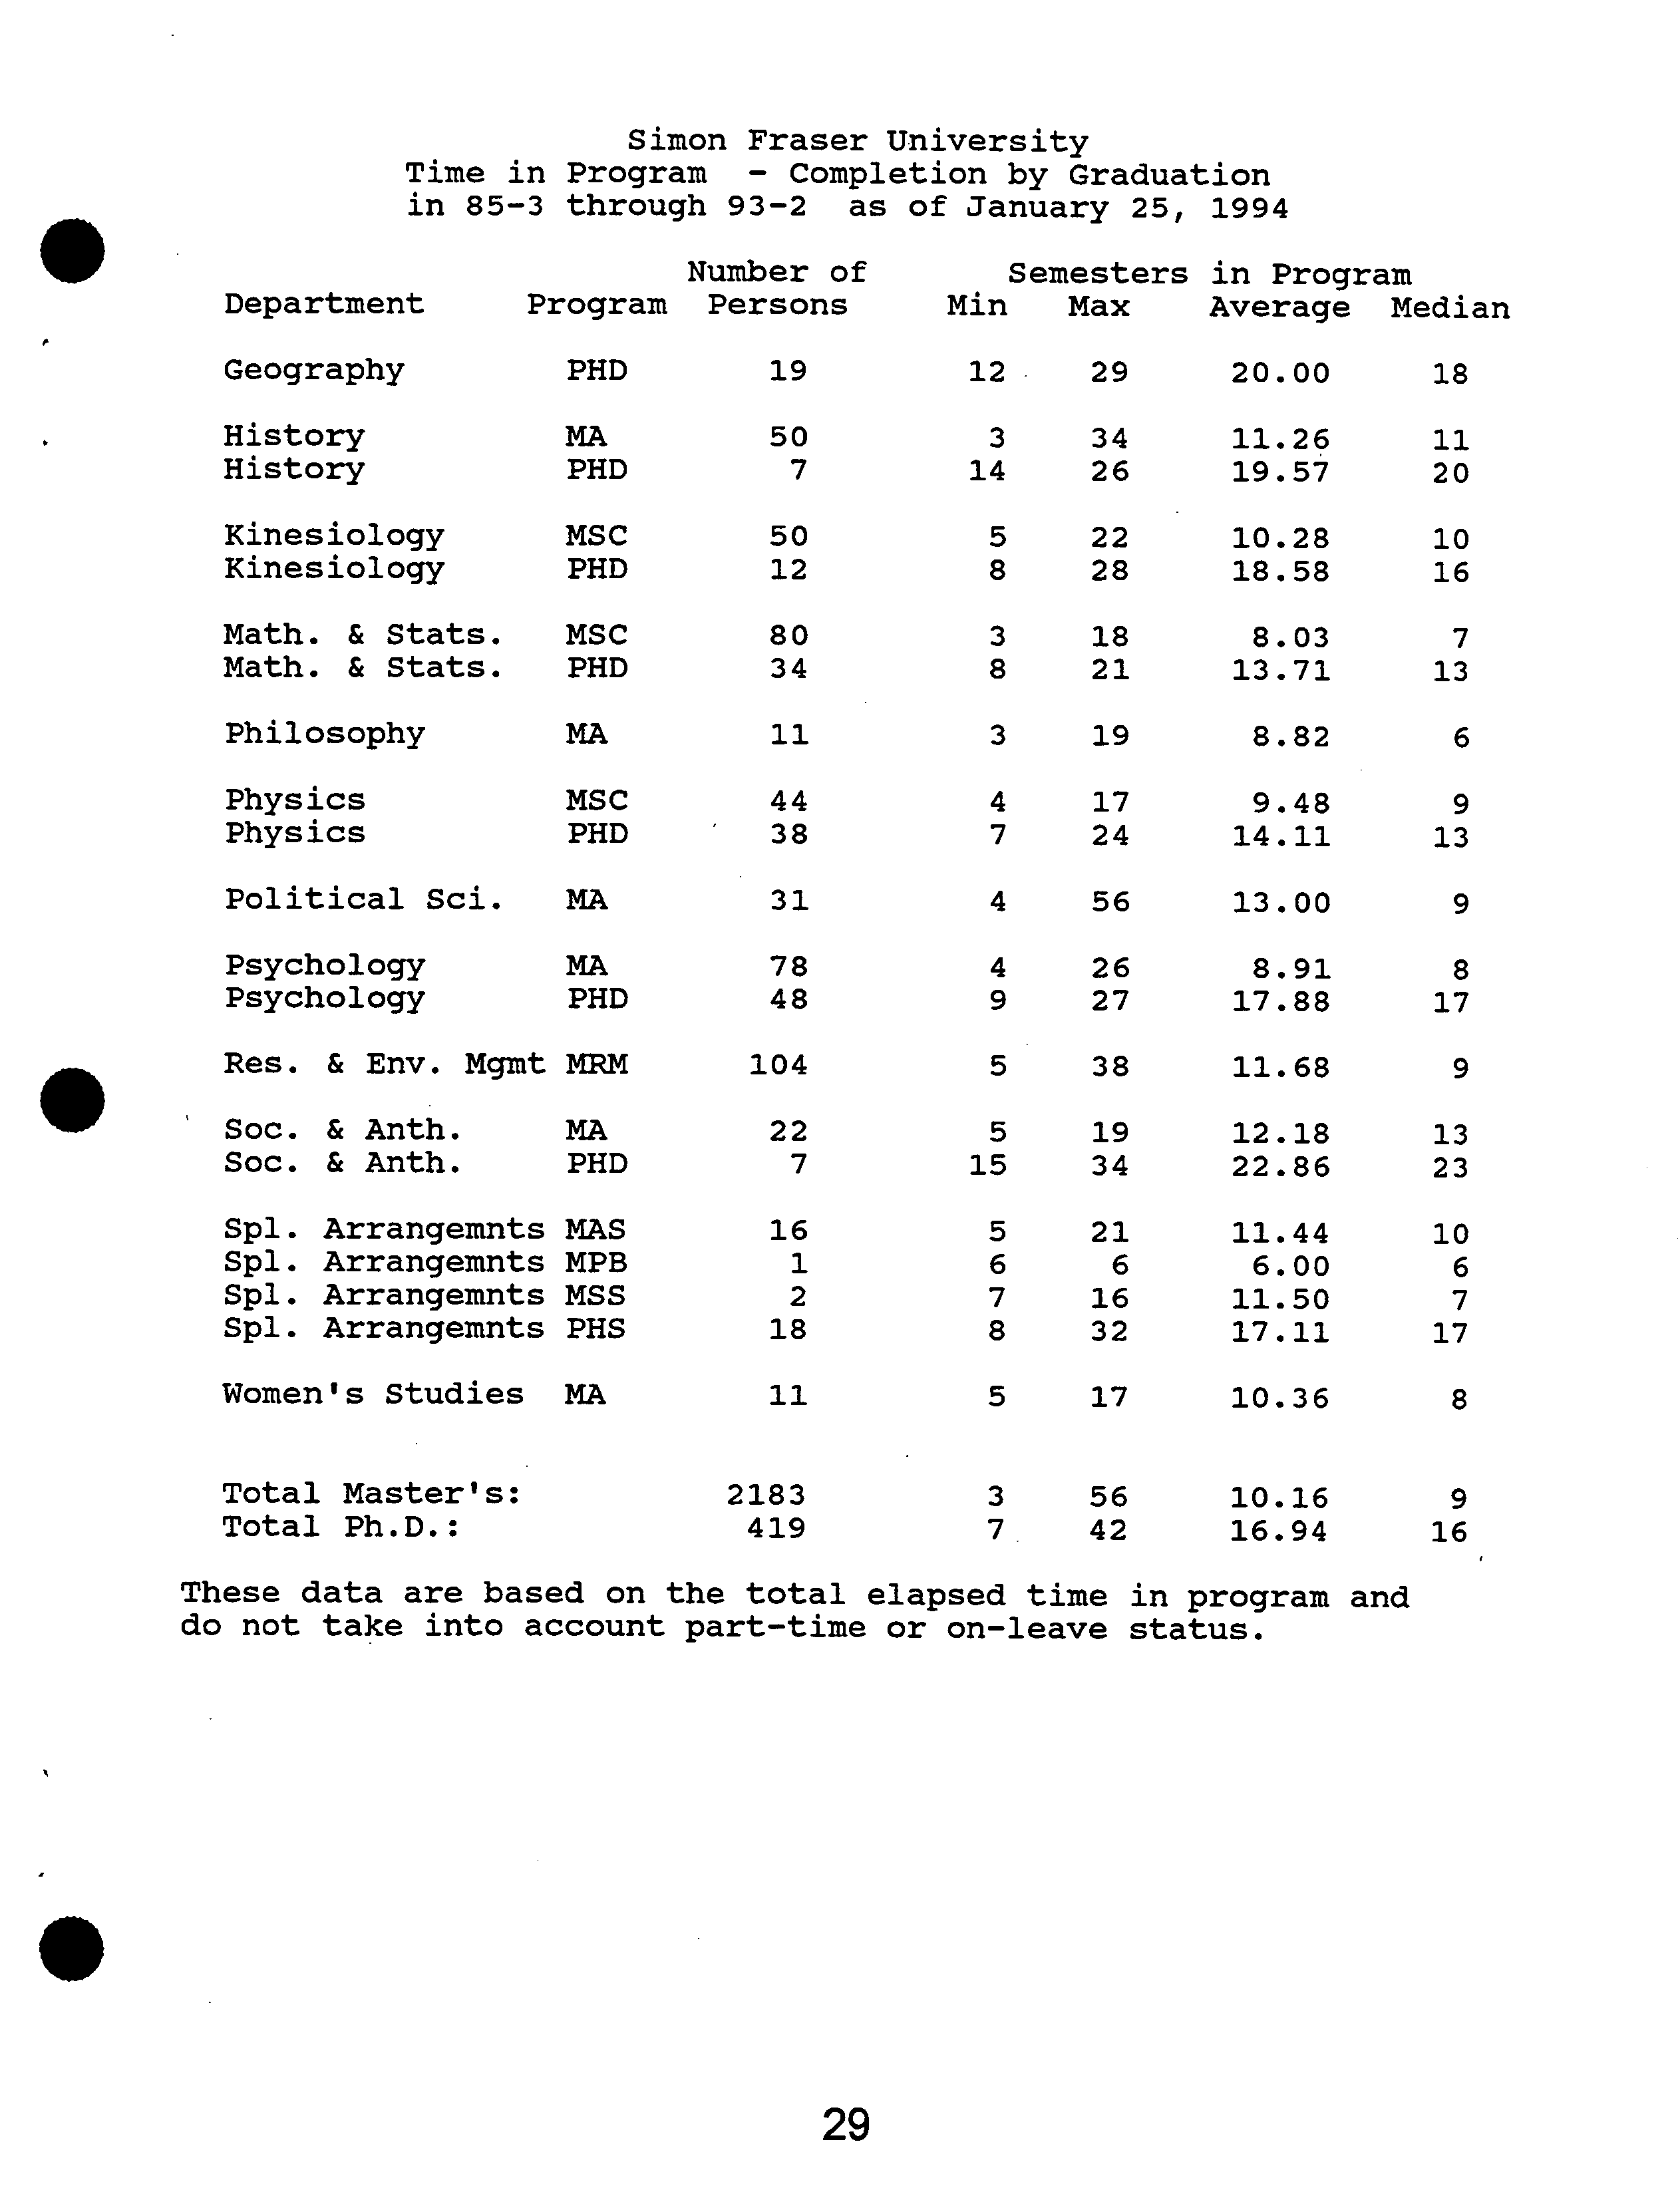
Geography
PHD
19
12
29
20.00
18
History
MA
50
3
34
11.26
11
History
PHD
7
14
26
19.57
20
Kinesiology
MSC
50
5
22
10.28
10
Kinesiology
PHD
12
8 28
18.58
16
Math. & Stats.
MSC
80
3
18
8.03
7
Math. & Stats. PHD
34
8
21
13.71
13
Philosophy
MA
11
3 19
8.82
6
Physics
MSC
44
4 17
9.48
9
Physics
PHD
38
7
24
14.11
13
Political Sci.
MA
31
4 56
13.00
9
Psychology
MA
78
4 26
8.91
8
Psychology
PHD
48
9 27
17.88
17
•
Res. & Env. Mgmt MRN
104
5
38
11.68
9
Soc. & Anth.
MA
22
5 19
12.18
13
Soc. & Anth.
PHD
7
15
34
22.86
23
Spi. Arrangemnts
MAS
16
5
21
11.44
10
Spi. Arrangemnts
MPB
1
6
6
6.00
6
Spi. Arrangemnts
MSS
2
7
16
11.50
7
Spl. Arrangemnts
PHS
18
8
32
17.11
17
Women's Studies
MA
11
5 17
10.36
8
Total Master's: ?
2183 ?
3 ?
56 ?
10.16 ?
9
Total Ph.D.: ?
419 ?
7 ?
42 ?
16.94 ?
16
These data are based on the total elapsed time in program and
do not take into account part-time or on-leave status.
S
29
S
Simon Fraser University
Graduate Program Completion Data
1985/86 Master's Registrants
Women's Studies ?
Eng. Sd. MEng
?
Soc. & Anth.
?
Bio. Sci. MSc?
Bus. Admin. DMBA ?
Kinesiology?
Bio. Sci. MPM
?
Chemistry?
Communication
E
?
History
I t
cz
?
Math. & Stats. ?
CL ?
Physics
Psychology ?
Computing Sci. ?
Res. & Env. Mgmt?
Criminology?
Economics
?
English?
Bus. Admin. EMBA
?
Education MA ?
Education MEd
0
?
10 ?
20 ?
30 ?
40 ?
50 ?
60
Number
Graduated
0
Withdrew ?
Transfered ?
Enrolled
?
S
dgscrdm5
Archaeology
History
Communication
Criminology
Kinesiology
Math. & Stats.
Computing Sci.
Lang. & Ling.
CL
Spi.
Physics
Chemistry
Education
Geography
Economics
Psychology
Biological Sd.
.
Simon Fraser University
Graduate Program Completion Data
1985/86 Doctoral Registrants
0
?
2
?
4
?
6
?
8 ?
10 12 14
Number
Graduated 0Withdrew ?
Transfered ?
Enrolled
dgscrdp5
31
Simon Fraser University
Degree Completion Rates
by Department and
Semester of
Entry
Entry in 85-3
through 86-2
- January
25, ?
1994
Completed
Currently
I
Department
Pgm Total
Degree
Withdrawn
Transfered
Enrolled
Archaeology
MA
2
].
50.0%
1 50.0%
0
0.0%
0
0.0%
Archaeology
PHD 1
1
100.0% 0
0.0% 0
0.0%
0
0.0%
Biological Sci.
MPM
9 7
77.8%
2
22.2%
0
0.0%
0
0.0%
Biological Sci. MSC
6 3
50.0%
1
16.7%
2
33.3%
0
0.0%
Biological Sci.
PHD
13 10
76.9% 3
23.1%
0
0.0%
0
0.0%
Bus. Admin.
MBA
7
7
100.0%
0
0.0%
0
0.0%
0
0.0%
BUS.
Admin.
MBE
23 23
100.0%
0
0.0% 0
0.0%
0
0.0%
Chemistry
MSC 9
3
33.3%
4
44.4%
2
22.2%
0
0.0%
Chemistry
PHD 6 5
83.3%
1
16.7%
0
0.0%
0
0.0%
Communication
MA
9 8
88.9%
1
11.1%
0
0.0% 0
0.0%
Communication
PHD
3 1
33.3%
0
0.0% 0
0.0%
2
66.7%
Computing Sci.
MSC 11
9
81.8%
2
18.2%
0
0.0% 0
0.0%
Computing Sci.
PHD 4
2 50.0%
1
25.0%
0
0.0%
1
25.0%
CriminologyCriminology
MA
PHD
13
3
5
1
33.3%38.5%
80
61.5%0.0%
00
0.0%0.0%
2
0
66.7%
0.0%
Lang. & Ling.
MA
2 1
50.0%
0
0.0%
1
50.0%
0
0.0%
Lang. & Ling.
PHD 4
1
25.0%
1
25.0%
0
0.0%
2
50.0%
Economics
MA 13
8
61.5%
5
38.5% 0
0.0%
0
0.0%.
Economics
PHD
8
1
12.5%
5
62.5%
0
0.0%
2
25.0%
EducationEducationEducationEducation
MA
MSCMEDPHD
4155
26
4429
2
2
100.0%70.7%80.0%33.3%
12
11
0
1
20.0%29.3%16.7%0.0%
00
00
0.0%0.0%0.0%0.0%
000
3
50.0%
0.0%
0.0%
0.0%
English
MA
13
9
69.2%
4
30.8%
0
0.0%
0
0.0%
Engineering
Engineering
Sci.Sci.
MAPMEN
51
01
100.0%0.0%
50
100.0%0.0%
00
0.0%0.0%
00
0.0%
0.0%
GeographyGeographyGeography
MA
MSCPHD
722
411
50.0%50.0%57.1%
3
1
1
50.0%42.9%50.0%
000
0.0%0.0%0.0%
0
00
0.0%
0.0%
0.0%
HistoryHistory
MA
PHD
92 5
0
55.6%0.0%
42
100.0%44.4%
00 0.0%0.0%
00
0.0%
0.0%
KinesiologyKinesiology
MSCPHD 8
3
8
3
100.0%100.0%
0
0
0.0%0.0%
00 0.0%0.0%
00
0.0%
0.0%
S
32
S
Simon Fraser University
?
Degree Completion Rates by Department and Semester of Entry
?
Entry in 85-3 through 86-2 - January 25, 1994
Completed ?
Currently
Department
?
Pgm Total Degree Withdrawn Transfered Enrolled
Math. & Stats.
MSC 9 7 77.8% 2
22.2% 0
0.0%
0
0.0%
Math. & Stats.
PHD 3 0 0.0%
1
33.3% 0
0.0%
2
66.7%
Philosophy
MA 2 0 0.0%
2 100.0% 0
0.0%
0
0.0%
Physics
MSC
10 7
70.0% 2 20.0%
1
10.0% 0
0.0%
Physics
PHD 5 3
60.0% 2 40.0%
0 0.0%
0
0.0%
Political Sci.
MA 2 2
100.0%
0
0.0%
0
0.0%
0
0.0%
Psychology
MA 10 8 80.0%
2 20.0% 0
0.0%
0
0.0%
Psychology
PHD 12 8 66.7%
0 0.0%
0
0.0%
4
33.3%
Res. & Env. Mgmt NRN
11 10 90.9% 1
9.1% 0
0.0%
0
0.0%
Soc. & Anth.
MA 5 4
80.0% 1 20.0%
0
0.0%
0
0.0%
Spl. Arrangemnts
MAS
2 1
50.0%
1 50.0%
0
0.0%
0
0.0%
Spl. Arrangemnts MSS
1 1 100.0% 0
0.0%
0
0.0%
0
0.0%
Spi. Arrangemnts PHD
4 3 75.0%
0 0.0%
0
0.0%
1
25.0%
Women's Studies
MA 3 1
33.3% 2 66.7%
0
0.0%
0
0.0%
All Master's ?
297 216 72.7% 75 25.3%
?
6 ?
2.0% ?
0 ?
0.0%
All Doctoral ?
84 45 53.6% 20 23.8%
?
0 ?
0.0% 19 22.6%
.
S
33
Geography MA
Soc. & Anth.
Women's Studies
Biological Sci. MPM
Chemistry
Archaeology
History
Kinesiology
Political Sci.
Psychology
Communication
.
Math. &Stats.
CO
Physics
CL
Res. & Env. Mgmt
Computing Sd.
Criminology
Engineering Sd. MEng
Economics
English
Biological Sci. MSc
Bus. Admin. DMBA
Bus. Admin. EMBA
Education MA
Education MEd
.
Simon Fraser University
Graduate Program Completion Data
1986/87 Master's Registrants
.
dgscrdm6
0 ?
10 ?
20 ?
30 ?
40
Number
?
Graduated
0
Withdrew
FITransfered
J
Enrolled
?
S
Lang. &
Ling.
Soc. & Anth.
Criminology
Geography
Spi. Arrangemnts
Archaeology
Communication
Kinesiology
Chemistry
CL
History
Computing Sd.
Math. & Stats.
Education
Physics
Psychology
Economics
Biological Sci.
.
Simon Fraser University
Graduate Program Completion Data
1986/87 Doctoral Registrants
.
o
2 ?
4
?
6 ?
8
10 12 14
16 18 20 22
Number
Graduated 0
Withdrew
Transfered
Enrolled
35
Simon Fraser University
?
Degree Completion Rates by Department and Semester of Entry
?
Entry in 86-3 through 87-2 - January 29, 1994
Completed
Currently
Department
Pgm
Total
Degree
Withdrawn
Trans fered
Enrolled
ArchaeologyArchaeology
MA
PHD
9
3
51
33.3%55.6%
4
0
44.4%0.0%
00
0.0%0.0%
2
0
66.7%
0.0%
Biological
Biological
Biological
Sci.Sc!.Sci.
MPMMSC
PHD
21
18
8
1414
7
87.5%77.8%66.7%
2
3
1
14.3%11.1%12.5%
2
0
0
11.1%0.0%0.0%
4
00
19.0%
0.0%
0.0%
Bus.
BUS.
Admin.Admin.
MBA
MBE
2718
21
15
77.8%83.3%
3
6
22.2%16.7%
00
0.0%0.0%
00
0.0%
0.0%
ChemistryChemistry
MSCPHD
4
8
2
5
50.0%62.5%
1
3
25.0%37.5%
00
0.0%0.0%
1
0
25.0%
0.0%
CommunicationCommunication
MA
PHD
12
3
10
0
83.3%0.0%
1
0
8.3%0.0%
00
0.0%0.0%
3
1
100.0%
8.3%
Computing
Computing
Sci.
SC!.
MSC
PHD
13
6
13
2
100.0%33.3%
0
3
50.0%0.0%
00
0.0%0.0%
1
0
16.7%
0.0%
CriminologyCriminology
MA
PHD
13
2
5
0
38.5%0.0%
2
7
100.0%53.8%
0
1
7.7%0.0%
00
0.0%
0.0%
Lang.
Lang.
&
&
Ling.Ling.
MA
PHD
3
1
20
66.7%0.0%
1
0
33.3%0.0%
01
100.0%0.0%
00
0.0%
0.0%
EconomicsEconomics
MA
PHD
1412
11
6
50.0%78.6%
2
3
21.4%16.7%
00
0.0%0.0%
40
33.3%
0.0%
EducationEducationEducationEducation
NEDMSCMA
PHD
4036
2
8
26
27
5
2
100.0%62.5%72.2%67.5%
12
9
0
1
25.0%30.0%12.5%0.0%
000
1
2.5%0.0%0.0%0.0%
2
0
1
0
25.0%
2.8%
0.0%
0.0%
English
MA
14
9
64.3%
5
35.7%
0
0.0%
0
0.0%
Engineering
Engineering
Sci.Sc!.
MAPMEN
13
2
5
2
100.0%38.5%
0
6
46.2%0.0%
0
1
7.7%0.0%
1
0
7.7%
0.0%
GeographyGeographyGeography
MAMSC
PHD
2
4
2
2
3
1
100.0%75.0%50.0%
0
0
1
25.0%0.0%0.0%
000
0.0%0.0%0.0%
00
1
50.0%
0.0%
0.0%
HistoryHistory
MA
PHD
95
51
20.0%55.6%
33
60.0%33.3%
0
1
11.1%0.0%
1
0
20.0%
0.0%
KinesiologyKinesiology
MSC
PHD
10
3
8
1
33.3%80.0%
22
20.0%66.7%
00 0.0%0.0% 00
0.0%
0.0%
36
Simon Fraser University
?
Degree Completion Rates by Department and Semester of Entry
?
Entry in 86-3 through 87-2 - January 29, 1994
S
Completed ?
Currently
Department ?
Pgm Total Degree Withdrawn Transfered Enrolled
I,
S
Math. & Stats.
MSC 12
10
83.3%
2
16.7%
0
0.0%
0
0.0%
Math. & Stats.
PHD 7
3
42.9%
3
42.9%
1
14.3%
0
0.0%
Philosophy
MA 3
1
33.3%
2
66.7%
0
0.0%
0
0.0%
Physics
MSC 12
7
58.3%
3
25.0%
2
16.7%
0
0.0%
Physics
PHD
9
8
88.9%
1
11.1%
0
0.0%
0
0.0%
Political Sci.
MA
10
5 50.0%
5
50.0%
0
0.0%
0
0.0%
PsychologyPsychology
MA
PHD
1011
11
3
100.0%30.0%
00
0.0%0.0%
0
0
0.0%0.0%
70
70.0%
0.0%
Res. & Env. Mgmt
MRM
12 9
75.0%
3
25.0%
0
0.0%
0
0.0%
Soc. & Anth.
MA
4 3
75.0%
1
25.0%
0
0.0%
0
0.0%
Soc. & Anth.
PHD
1
0 0.0%
0
0.0%
0
0.0%
1
100.0%
Spl.
Spi.
ArrangemntsArrangemnts
MASPHD
2
2
22
100.0%100.0%
00
0.0%0.0%
00
0.0%0.0%
00
0.0%
0.0%
Women's Studies
MA
4 2
50.0%
2
50.0%
0
0.0%
0
0.0%
All
All
Master'sDoctoral
??
345
99
247
49 49.5%
71.6%
21
87
21.2%
25.2%
??
2
8
??
2.0%
2.3% ?
27
3 ?
27.3%
0.9%
S
37
Archaeology
Political Sd.
Women's Studies
English
Physics
Eng. Sci. MApSc
Geography MA
Communication
Biological Sd. MPM
Eng. Sci. MEng
History
Math. &
Stats.
CU
Computing Sci.
CL
Kinesiology
Psychology
Chemistry
Criminology
Economics
Res. & Env. Mgmt
Biological Sci. MSc
Bus. Admin. DMBA
Bus. Admin. EMBA
Education MA
Education MEd
n
Simon Fraser University
Graduate Program Completion Data
1987/88 Master's Registrants
.
0 ?
10
?
20
?
30 ?
40 ?
50
Number
Graduated ?
Withdrew
1:1
Transfered ?
Enrolled
dgscrdml
English
History
Kinesiology
Soc. &
Anth.
Archaeology
Geography
Lang. & Ling.
Criminology
Communication
CO
CL
Psychology
Spl. Arrangemnts
Physics
Computing Sci.
Chemistry
Economics
Education
Biological Sci.
Math. &
Stats.
.
Simon Fraser University
Graduate Program Completion Data
1987/88 Doctoral Registrants
.0 ?
2
?
4
?
6 ?
8 ?
10 ?
12 14
Number
Graduated ?
Withdrew
1:1
Transfered [! Enrolled
dgscrdp7
Simon Fraser
University
Degree CompletionEntry
in
87-3
Ratesthrough
by Department
88-2
- Januaryand
Semester
29, ?
1994
of
Entry
Completed
Currently
Department
Pgm
Total
Degree
Withdrawn
Transfered
Enrolled
ArchaeologyArchaeology
MA
PHD
24
22
100.0%50.0% 0
2
50.0%0.0%
0
0
0.0%0.0%
0
0
0.0%
0.0%
Biological
Biological
Biological
Sci.Sci.Sci.
MPMMSC
PHD
20
12
8
11
5
7
41.7%87.5%55.0%
2
3
1
15.0%16.7%12.5% 401
20.0%8.3%0.0%
42
0
33.3%
10.0%
0.0%
Bus.
Bus.-Admin.Admin.
MBA
MBE
23
26
2420
92.3%87.0%
1
3
13.0%3.8%
00
0.0%0.0%
1
0
3.8%
0.0%
ChemistryChemistry
MSCPHD
10
13
86
61.5%60.0%
22
20.0%15.4%
2
3
20.0%23.1%
0
0
0.0%
0.0%
CommunicationCommunication
MA
PHD
74
5
2 50.0%71.4%
2
0
28.6%0.0%
00
0.0%0.0%
20
50.0%
0.0%
Computing
Computing Sci.
Sd.
MSC
PHD
11
9
81
72.7%11.1%
1
5
55.6%9.1%
20
18.2%0.0%
3
0
33.3%
0.0%
CriminologyCriminology
MA
PHD
14
3
80
57.1%0.0%
0
6
42.9%
0.0%
0
0
0.0%0.0%
30
100.0%
0.0%
Lang.
Lang. &
&Ling.
Ling.
MA
PHD
2
1
00
0.0%0.0%
0
1
100.0%0.0%
00
0.0%0.0%
2100..0%
0
00%
EconomicsEconomics
MAPHD
1710
14
5
50.0%82.4%
3
3
30.0%17.6%
00
0.0%0.0%
20
20.0%
0.0%
EducationEducationEducationEducation
MSCMEDMAPHD
424910
2
2830
2
1
100.0%61.2%10.0%66.7%
1115
2
0
26.2%20.0%30.6%
0.0%
00
00
0.0%0.0%0.0%0.0%
47
3
0
70.0%
7.1%
0.0%
8.2%
EnglishEnglish
MA
PHD
51
4
1
100.0%80.0%
01
20.0%0.0%
00
0.0%0.0%
00
0.0%
0.0%
Engineering
Engineering
Sci.Sci.
MENMAP
96
26
100.0%22.2%
6
0
66.7%0.0%
0
0
0.0%0.0%
01
11.1%
0.0%
GeographyGeographyGeography
MSCMAPHD
2
61
24
1
100.0%100.0%66.7%
0
0
2
33.3%0.0%0.0%
0
00
0.0%0.0%0.0%
000
0.0%
0.0%
0.0%
HistoryHistory
MA
PHD
9
1
40
44.4%0.0%
51
100.0%55.6%
0
0
0.0%0.0%
00
0.0%
0.0%
KinesiologyKinesiology
MSCPHD
11
1
80
72.7%0.0%
3
0
27.3%
0.0%
00
0.0%0.0%
1
0
100.0%
0.0%
40
Simon Fraser University
?
Degree Completion Rates by Department and Semester of Entry
?
Entry in 87-3 through 88-2 - January 29, 1994
Completed ?
Currently
Department ?
Pgm Total Degree Withdrawn Transfered Enrolled
Math. & Stats.
MSC 10 7
70.0%
2
20.0%
1 10.0%
0
0.0%
Math. & Stats.
PHD 13 13
100.0%
0
0.0%
0 0.0%
0
0.0%
Philosophy
MA 3 0
0.0%
3
100.0% 0
0.0%
0
0.0%
Physics
MSC 5 1
20.0%
2
40.0% 2
40.0%
0
0.0%
Physics
PHD 8
5 62.5%
0
0.0% 0
0.0% 3
37.5%
Political Sci. MA 4
3 75.0%
1
25.0%
0
0.0% 0
0.0%
Psychology
MA
11
11
100.0% 0
0.0%
0
0.0% 0
0.0%
Psychology
PHD 5
2 40.0%
2
40.0%
0
0.0%
1
20.0%
Res. & Env. Mgmt MRN 17
12
70.6% 5
29.4%
0
0.0%
0
0.0%
Soc. & Anth.
MA
2 1
50.0%
1
50.0%
0
0.0%
0
0.0%
Soc. &Anth.
PHD
1 0
0.0%
1100.0%
0
0.0%
0
0.0%
Spi. Arrangemnts
MAS 3 3
100.0%
0
0.0%
0
0.0%
0
0.0%
Spi. Arrangemnts
MSS 1 0
0.0%
1
100.0%
0 0.0%
0
0.0%
Spi. Arrangemnts
V
PHD
5 1
20.0%
0
0.0%
0 0.0%
4
80.0%
Women's Studies
MA 4
2
50.0% 2
50.0%
0
0.0% 0
0.0%
All Master's
344
236
68.6%
85
24.7%
12
3.5%
11
3.2%
All Doctoral
99
46
46.5% 18
18.2%
3
3.0%
32
32.3%
.
41
Simon Fraser University
Master's Program Withdrawals
Fall 1985 - Fall 1993 Part I
Contemp. Arts
Spi. Arr. MPub
Biological Sci. MPM
Bus. Admin. WMBA
Bus. Admin. EMBA
Psychology
Kinesiology
CO
Bus. Admin. DMBA
Geography MSc
Computing Sci.
Eng. Sci. MApSc
SpI. Arr. MA
Math. & Stats.
Biological Sci. MSc
Education MSc
Biological Sci. MAq
Res. & Env. Mgmt
I
I
k £6666666666
• ?
v
'V 'V'V
'V 'V
"V
'V 'V 'V
V VV
V
64666666666666666.
.6.8.6.6.6.66.8.8.6.6.6.6.6.6.6.6.6.6.6.
V V V V V V V V V V V V V V V 'V V
'V 'V
V
V
£66666666
6 ?
6
1-01
64
6 •
ANN
'V V V V V V
VVV V 'VV V V VV V V
'V
V V V
646644464666444666666664
V V V
'V 'V V V 'V
V
'V
V
'V 'V
V V
'V 'V
V
'V 'V 'V 'V 'V
V V V V V V'
W6
£666666
I
.
0 ?
10 ?
20
Fraction
of
Withdrawals
(%)
University Average:
24%
dgswdrl
42
Simon Fraser University
Master's Program Withdrawals
Fall 1985 - Fall 1993 Part II
Economics
Physics
Communication
SpI. Arr. MSc
Chemistry
Education MA
Education MEd
E ?
Lang. & Ling.
cz
English
C)
2
Geography MA?
Archaeology?
Soc. & Anth. ?
History ?
Political Sci.
?
Criminology ?
Philosophy ?
Women's Studies
?
Eng. Sci. MEng
71
20 30 ?
40 ?
50 60 70
?
80
Li
?
Fraction of Withdrawals (%)
University Average: 24%
dgswdr2
43
Simon Fraser University
Doctoral Program Withdrawals
Fall 1985 - Fall 1993
Physics
Lang. & Ling.
Biological Sd.
Communication
Math. & Stats.
Archaeology
Chemistry
Psychology
Cz
Geography
)
English
SpI. Arrangemnts
Kinesiology
Education
Economics
Soc. & Anth.
Computing Sci.
History
Criminology
Engineering Sd.
V
VVVV V 'V
ww
a_s_a
I
VW'W'Vfl'fl,,
•
?
4
• ' 'WV 'WV 'V
'V
'V'W 'V
,m, ?
as as a a, s a a, a
I
'V'V V V V V V V
•
-
w -w
'
w
w' 'w w ''
?
'
w
'
w
'
n
'
ww
'V 'V
a
?
,a,
,a, ,*, * a a
A A A, A A A A A A,
.a
A
V
V 'V V V V V V V V V V VV
V V 'V V V V V V V
V
..."
•a.,ass
A**a*•A•A•a**a*a•A*a*a•A*A*a*a*i*:j
ssas
A.
a,
AA.5A.A.A.A.A.A.A.555A.5
A
• V V V V V 'WV V 'WV V V V
V V VV V V 'WV V V V V V V V V V V '
.
o io
20 30 40 50 60 70 80 90
Fraction of Withdrawals (%)
University Average: 31%
dgswdrp
Simon Fraser
University
Completion Statistics
All Students
since
Fall 1985
Report Dated:
January
25, 1994
Active
Total
W/D
Department
Pgm Now
Degree
Trf W/D
Completed
Rate (%)
Archaeology
MA
21
28
0
14
42
33
Archaeology
PHD
11
15
0
4
19
21
Biological Sci.
MAQ
13
8
0
2
10
20
Biological Sci.
MPM
30
81
0
7
88
8
Biological Sci.
MSC
53
85
24,
25
134
19
Biological Sci.
PHD
65
81
3
20
104
19
Bus. Admin.
MBA
11].
134
0
23
157
15
Bus. Admin.
MBE
109
227 0
- ?
31
258
12
Bus. Admin.
MBW
56
23
0
2
25
8
Chemistry
MSC
26
41
14
19
74
26
Chemistry
PHD
35
41
6
13
60
22
Communication
MA
42
64
1
22
87
25
Communication
PHD
29
8
0
2
10
20
Computing Sc!.
MSC
44
114
4
23
141
16
Computing Sc!.
PHD
36
15
3
24
42
57
Contemp. Arts
MFA
16
7
0
0
7
0
Criminology
MA 38
63
3
46
112
41
Criminology
PHD
21
2
0
6
8
75
Economics
MA
43
126
1
33
160
21
Economics
PHD
35
40
1
32
73
44
Education
MA 130
208
2
82
292
28
Education
MED
139
257
2
109
368
30
Education
MSC
35
16
1
4
21
19
Education
PHD
52
20
0
12
32
38
Engineering Sci. MAP
37
49
4
10
63
16
Engineering Sci.
MEN
24
10
1
27
38
71
Engineering Sc!.
PHD
15
1
1
6
8
75
English
MA
42
80
0
37
117
32
English
PHD
19
9
0
4
13
31
Geography
MA
26
26
0
12
38
32
Geography
MSC
16
17
0
3
20
15
Geography
PHD
15
19
0
8
27
30
History
MA
33
50
1
32
83
39
History
PHD
8
7
0
11
18
61
.continued...
45
Simon Fraser University
Completion Statistics
All Students since
Fall
1985
Report Dated:
January
25,
1994
Active
Total
W/D
Department
Pgm Now Degree
Trf W/D
Completed
Rate (%)
Kinesiology
MSC
26
50
9
10
69
14
Kinesiology
PHD
24
12
0
7
19
37
Lang. & Ling.
MA
14
19
3
10
32
31
Lang. & Ling. PHD
22
4
1
1
6
17
Liberal Studies
MAL
50
0
0
10
10
100
Math. & Stats.
MSC
39
80
3
17
100
17
Math. & Stats.
PHD
28
34
2
9
45
20
Philosophy
MA
13
11
0
11
22
50
Physics
MSC
22
44
13
15
72
21
Physics
PHD
36
38
0
6
44
14
Political
Sd.
MA 32
31
0
20
51
39
Psychology
MA
40
78
0
11
89
12
Psychology
PHD 65
48
0
15
63
24
Res. & Env. Mgmt
MRN
73
104
1
26
131
20
Soc. & Anth.
MA
29
22
0
11
33
33
Soc. & Anth.
PHD
6
7
0
9
16
56
Sp. ?
& Lat. Am. S
MA
8
0
0
0
0
N/A
Spi. Arrangemnts
MAS
1
16
0
3
19
16
Spi. Arrangemnts
MSS
0
2
1
1
4
25
Spl. Arrangemnts
MPB
0
1
0
0
i
0
Spl. Arrangemnts
PHS
25
18
0
8
26
31
Women's Studies
MA
16
11
0
11
22
50
Totals ?
Masters
1447
2183
88
719
2990
24
Totals ?
Doctoral
547
419
17
197
633
31
Totals
All
1994
2602
105
916
.3623
25
.
S
Active Now = headcount enrolment in the most recent semester.
Degree = number of degrees completed.
Trf = number of students who transferred to a different
degree program without completing the first.
W/D = number of students who withdrew without completing
a degree
W/D Rate = ratio of W/D to Total Completed.
46
.
Ph.D. Stipend 24 17.4%
toral Entrance 4 2.9%
Entrance 10 7.2%
• ?
Simon Fraser University
Distribution of S.F.U. Awards
Fall 1993
Master's GF 69 50.0%
Doctoral GF 31 22.5%
Total Awards = 138
•
?
dgsawl
47
Male 306 59.9%
Female 205 40.1%
Male 652 54.7%
Female 540 45.3%
Simon Fraser University
Gender Distribution of S.F.U. Awards
Fall 1993
Male 41 52.6%
?
Male 41 68.3%
I
Female 37 47.4%
?
Female 19 31.7%
Master's Awards
?
Doctoral Awards
Total = 78
?
Total = 60
Gender Distributions of Full-time Students
?
are shown below for comparison
FT Master's Enrol.
?
FT Doctoral Enrol.
Total = 1192
?
Total = 511
dgsaw2
?
L
U-01
C