For Information
?
S.95-19
. ?
SIMON FRASER UNIVERSITY
1il,
Senate Graduate Studies Committee
1994 REPORT TO SENATE
The Dean of Graduate Studies is responsible for the general supervision of graduate.work at the
University. This report outlines the position of graduate studies at Simon Fraser University, de-
scribes some changes made in 1994 and makes recommendations for future directions.
In January 1994, the combination of the positions of Dean of Graduate Studies and Vice-
President, Research was formalized by the President and Board of Governors. In July 1994, I
agreed to accept a 26-month appointment as Vice-President, Research, retaining responsibility for
the Graduate Studies portfolio as well. Dr. Phyllis M. Wrenn of the French Department accepted
a 3 /4-time appointment as Associate Dean of Graduate Studies for the same period. Dr. Wrenn has
primary responsibility for matters related to individual student and individual programs, and chairs
• the Senate Graduate Awards Adjudication Committee and the Assessment Committee for New
Graduate Programs. I am responsible for policy matters and external relations and chair the Sen-
ate Graduate Studies Committee.
The enclosed copy of the current S.F.U. Graduate Studies Fact Book describes, in quantitative
terms, the graduate student body in Fall 1994 and provides some retrospective data on completion
rates. It is the fifth edition. It is designed to complement information in the Simon Fraser Uni-
versity Fact Book, produced by the Office of Analytical Studies.
I. Enrolments and Degrees
The first section of the Graduate Studies Fact Book shows the recent history of graduate enrol-
ments and degrees granted. The enrolment figures should be treated with caution on two
grounds. Prior to the Fall 1989, they were determined through a reporting process which was
subject to considerable variation between departments. Starting in the Fall 1989, a new, rigorous
definition of Part-Time status was adopted; this was primarily responsible for the large change in
the (Head Count)IFTE ratio between 1988/89 and 1989/90. The official recognition of Part-Time
status and the introduction of a reduced semester tuition fee for Part-Time students were major
advances in improving the accessibility of our graduate programs. Programs approved for Part-
Time study are listed in Appendix A.
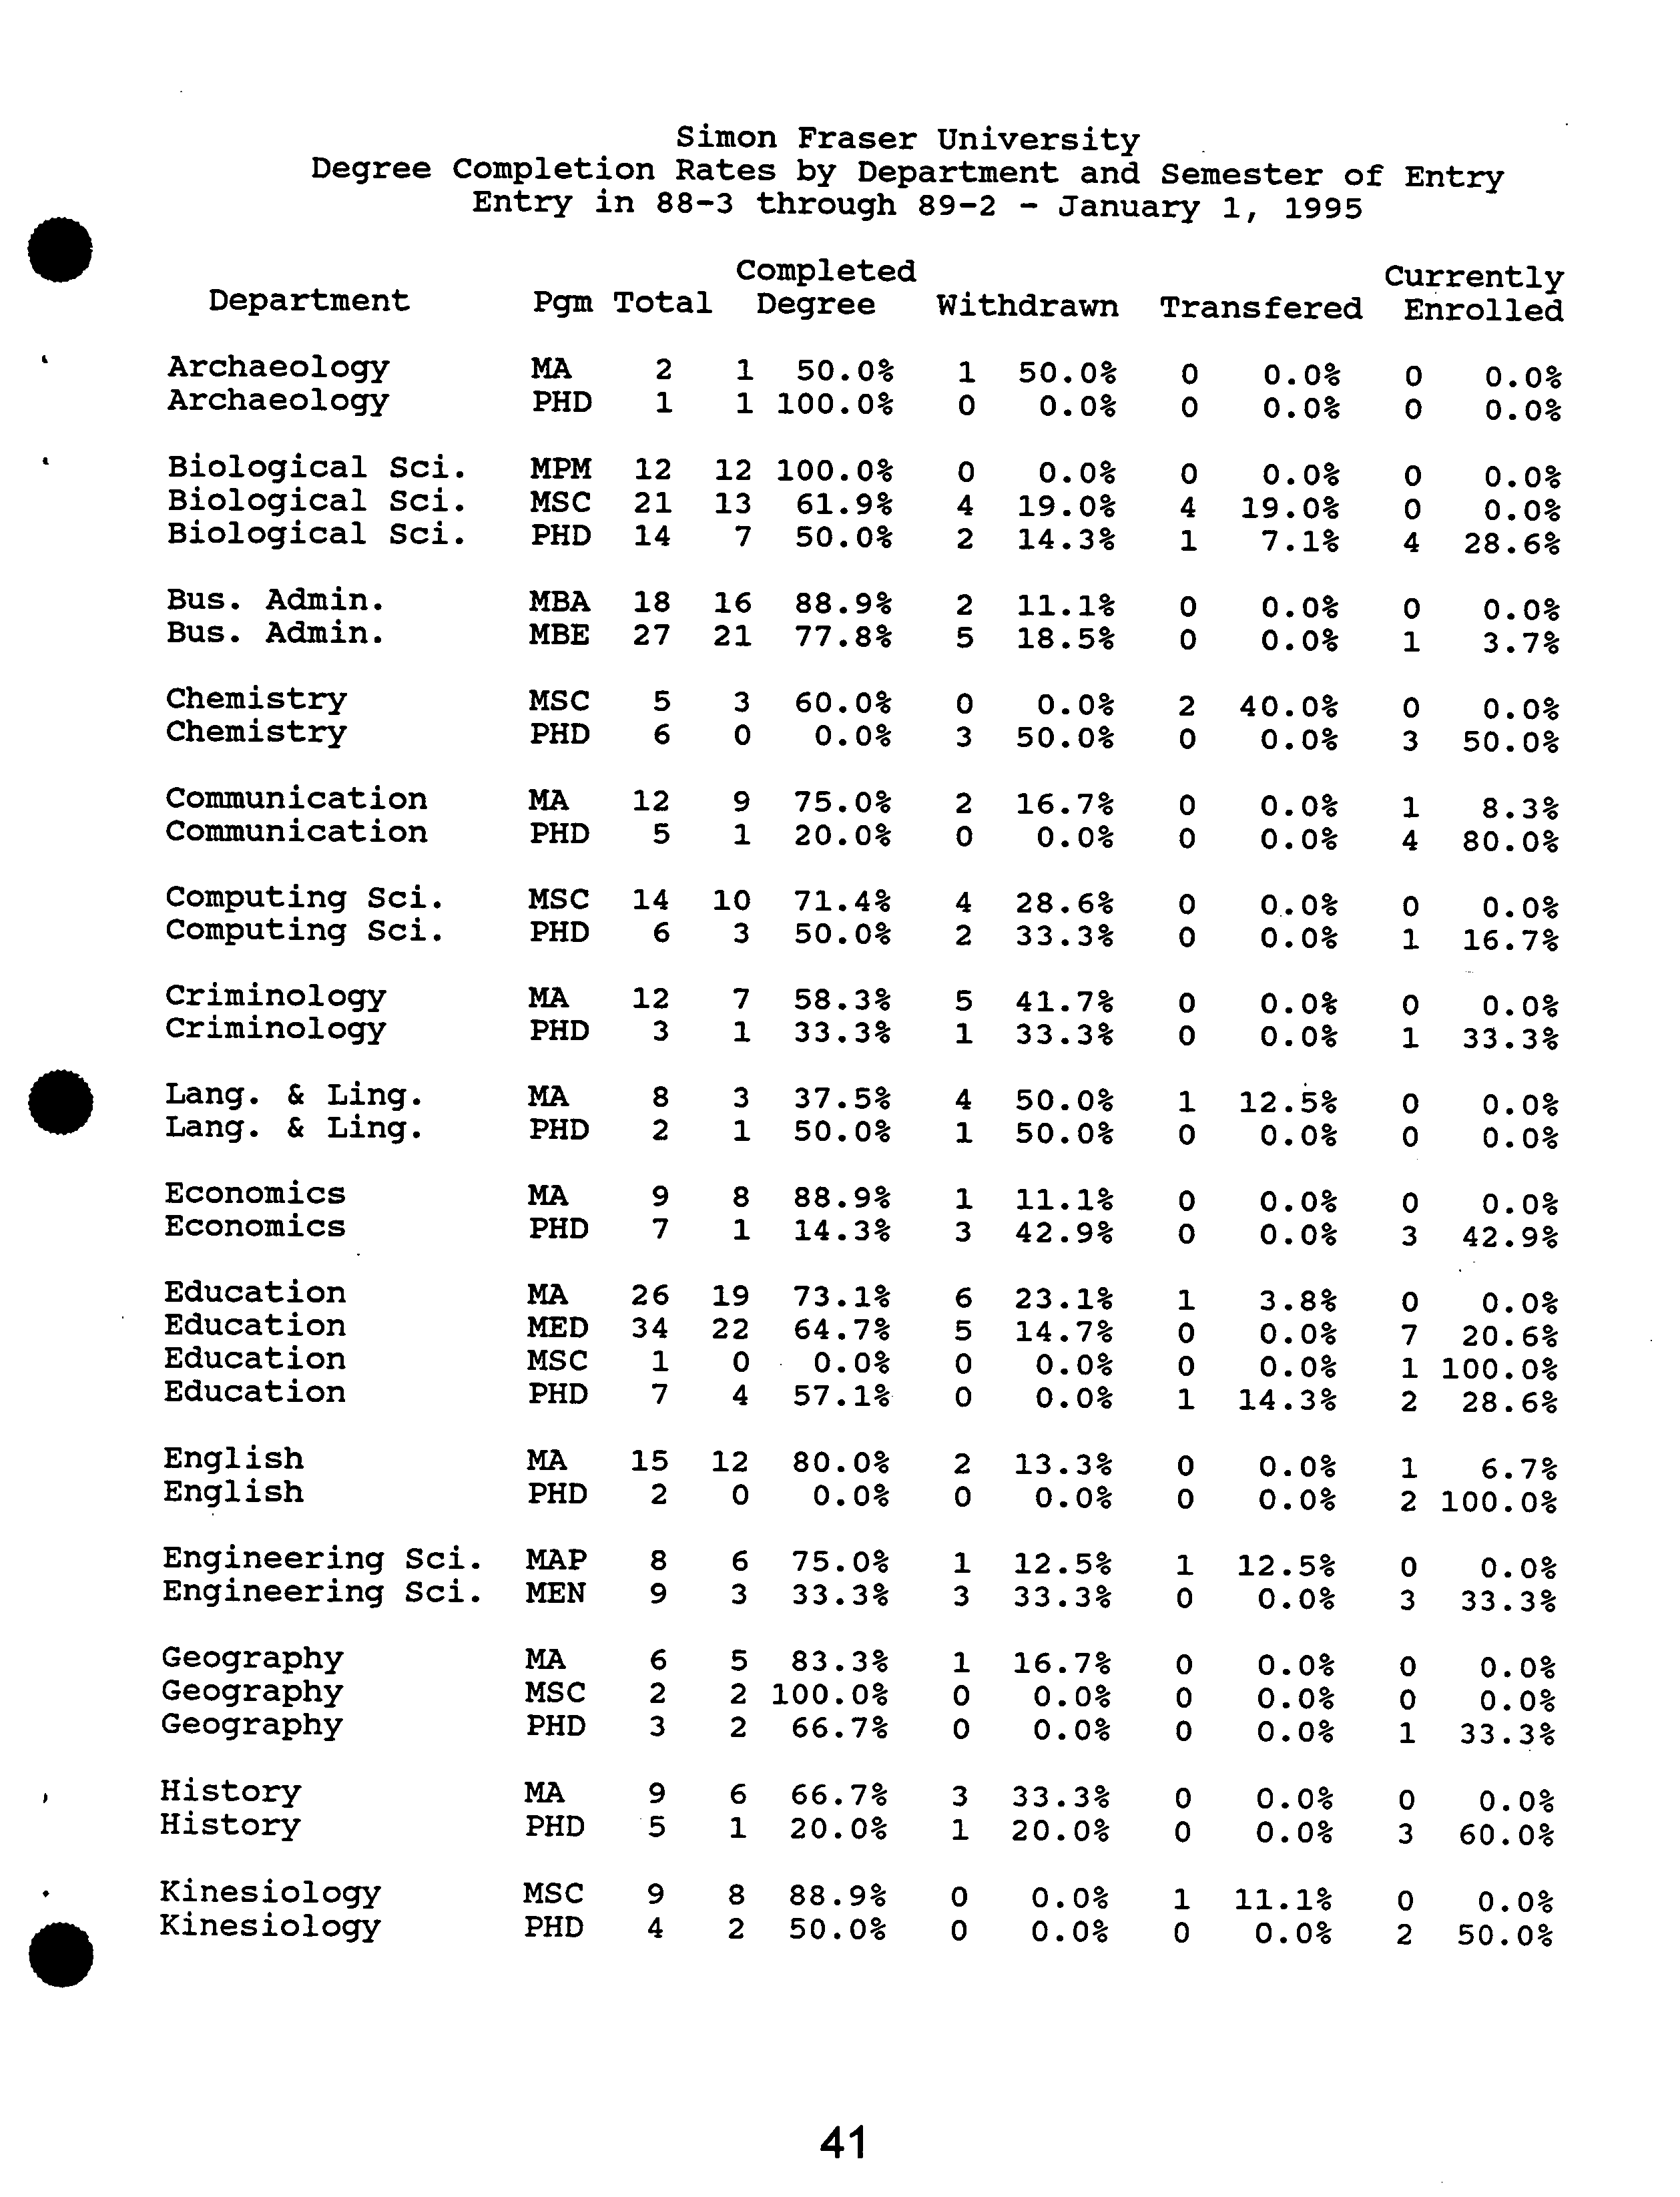
U. Degree Completion/Withdrawal
Degree completion times are presented in the Graduate Studies Fact Book. It should be noted
•
?
that these data do not take into account the possibility that a student may have been enrolled Part-
Time for
all or part of the program and thus overstate completion times, especially for programs
with large numbers of Part-Time students.
I7-hn9 SENAT.9.DOC
1994 S.G.S.C. Report to Senate ....
. Page 2
I remain concerned by what appear in many cases to be excessive times for degree completion.
When resources are limited, it is especially important that they be used effectively and efficiently.
I am actively encouraging departments to ensure both that their degree requirements are realistic
and that their students make satisfactory progress; as required by Senate regulations, toward
meeting those requirements. The Graduate Studies Handbook, first published in 1991, contains
guidelines for supervisors and students that (if followed) should improve prospects for expedi-
tious degree completion. I am also considering more rigorous enforcement of the regulations re-
quiring annual progress reports and have provided Graduate Program Chairs with samples of
forms used at SFU and elsewhere for that purpose.
I am also pressing for timely appointment of supervisory committees. In establishing the. Gradu-
ate Studies Database, I encountered many students who had been here for several years, yet ap-
parently had no supervisory committees. This situation has largely been remedied; each semester,
reminders about 'delinquent' students are sent to departments by my office; a minor flood of
committee recommendations typically follows.
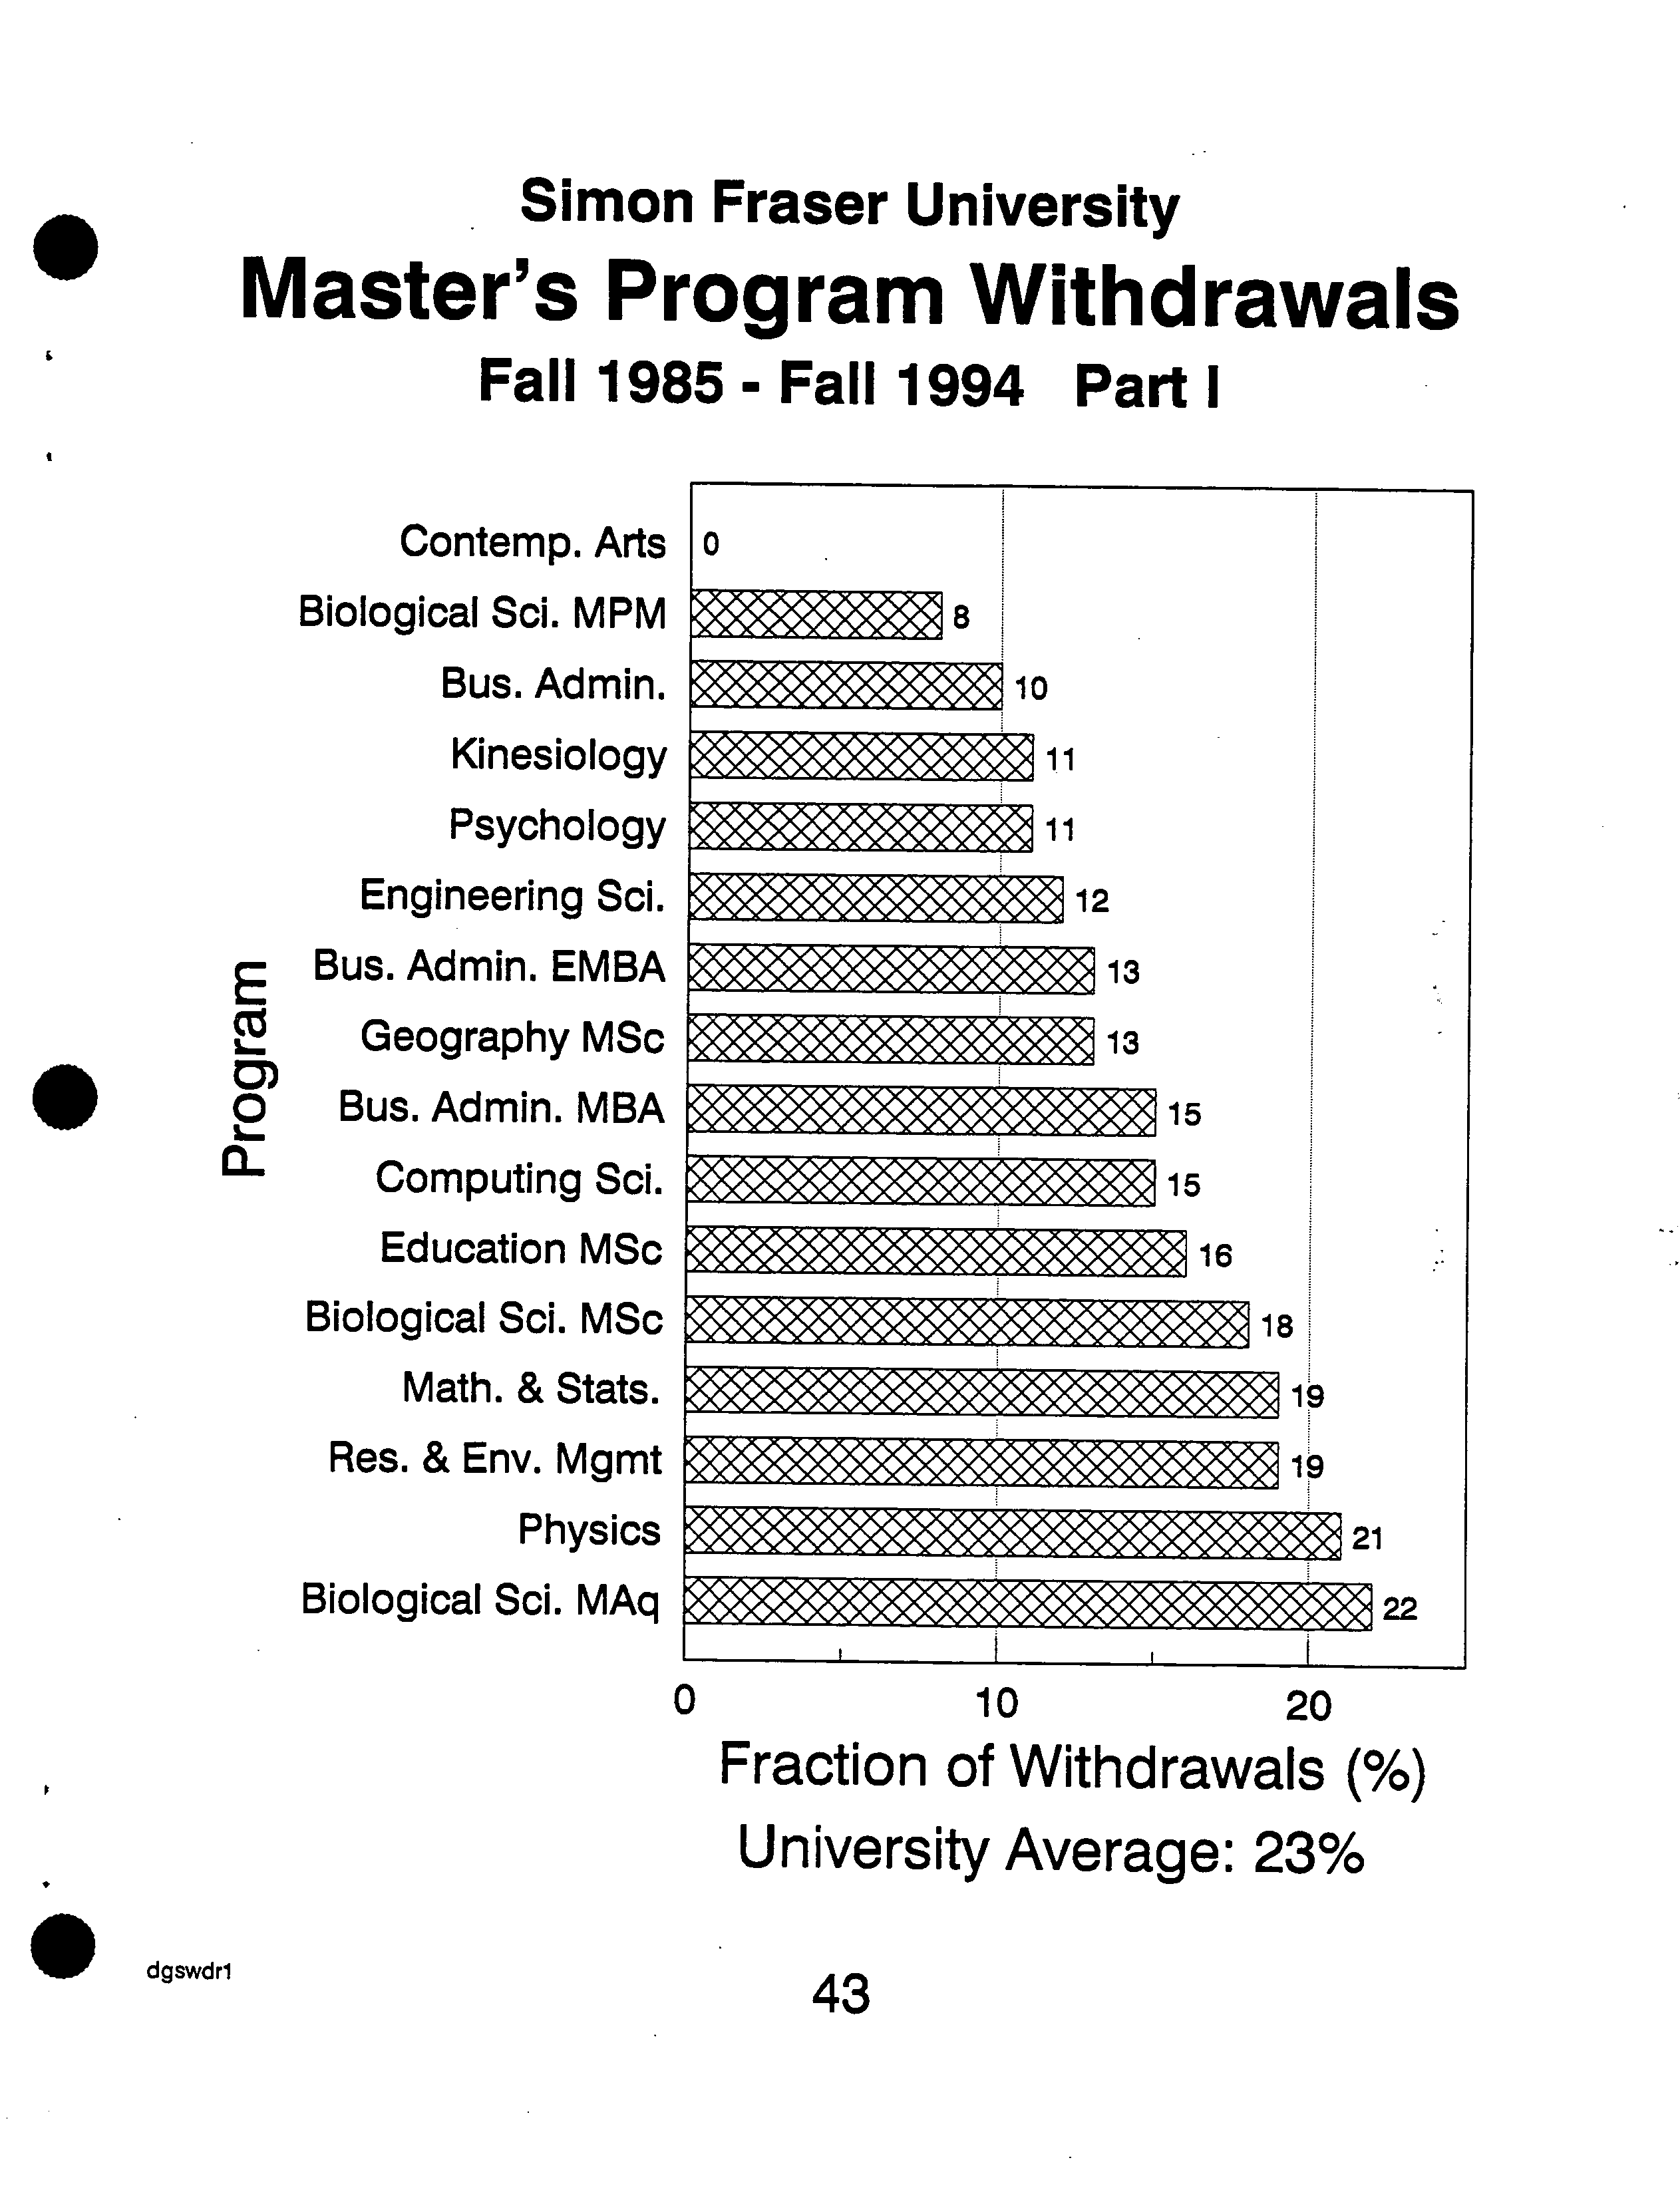
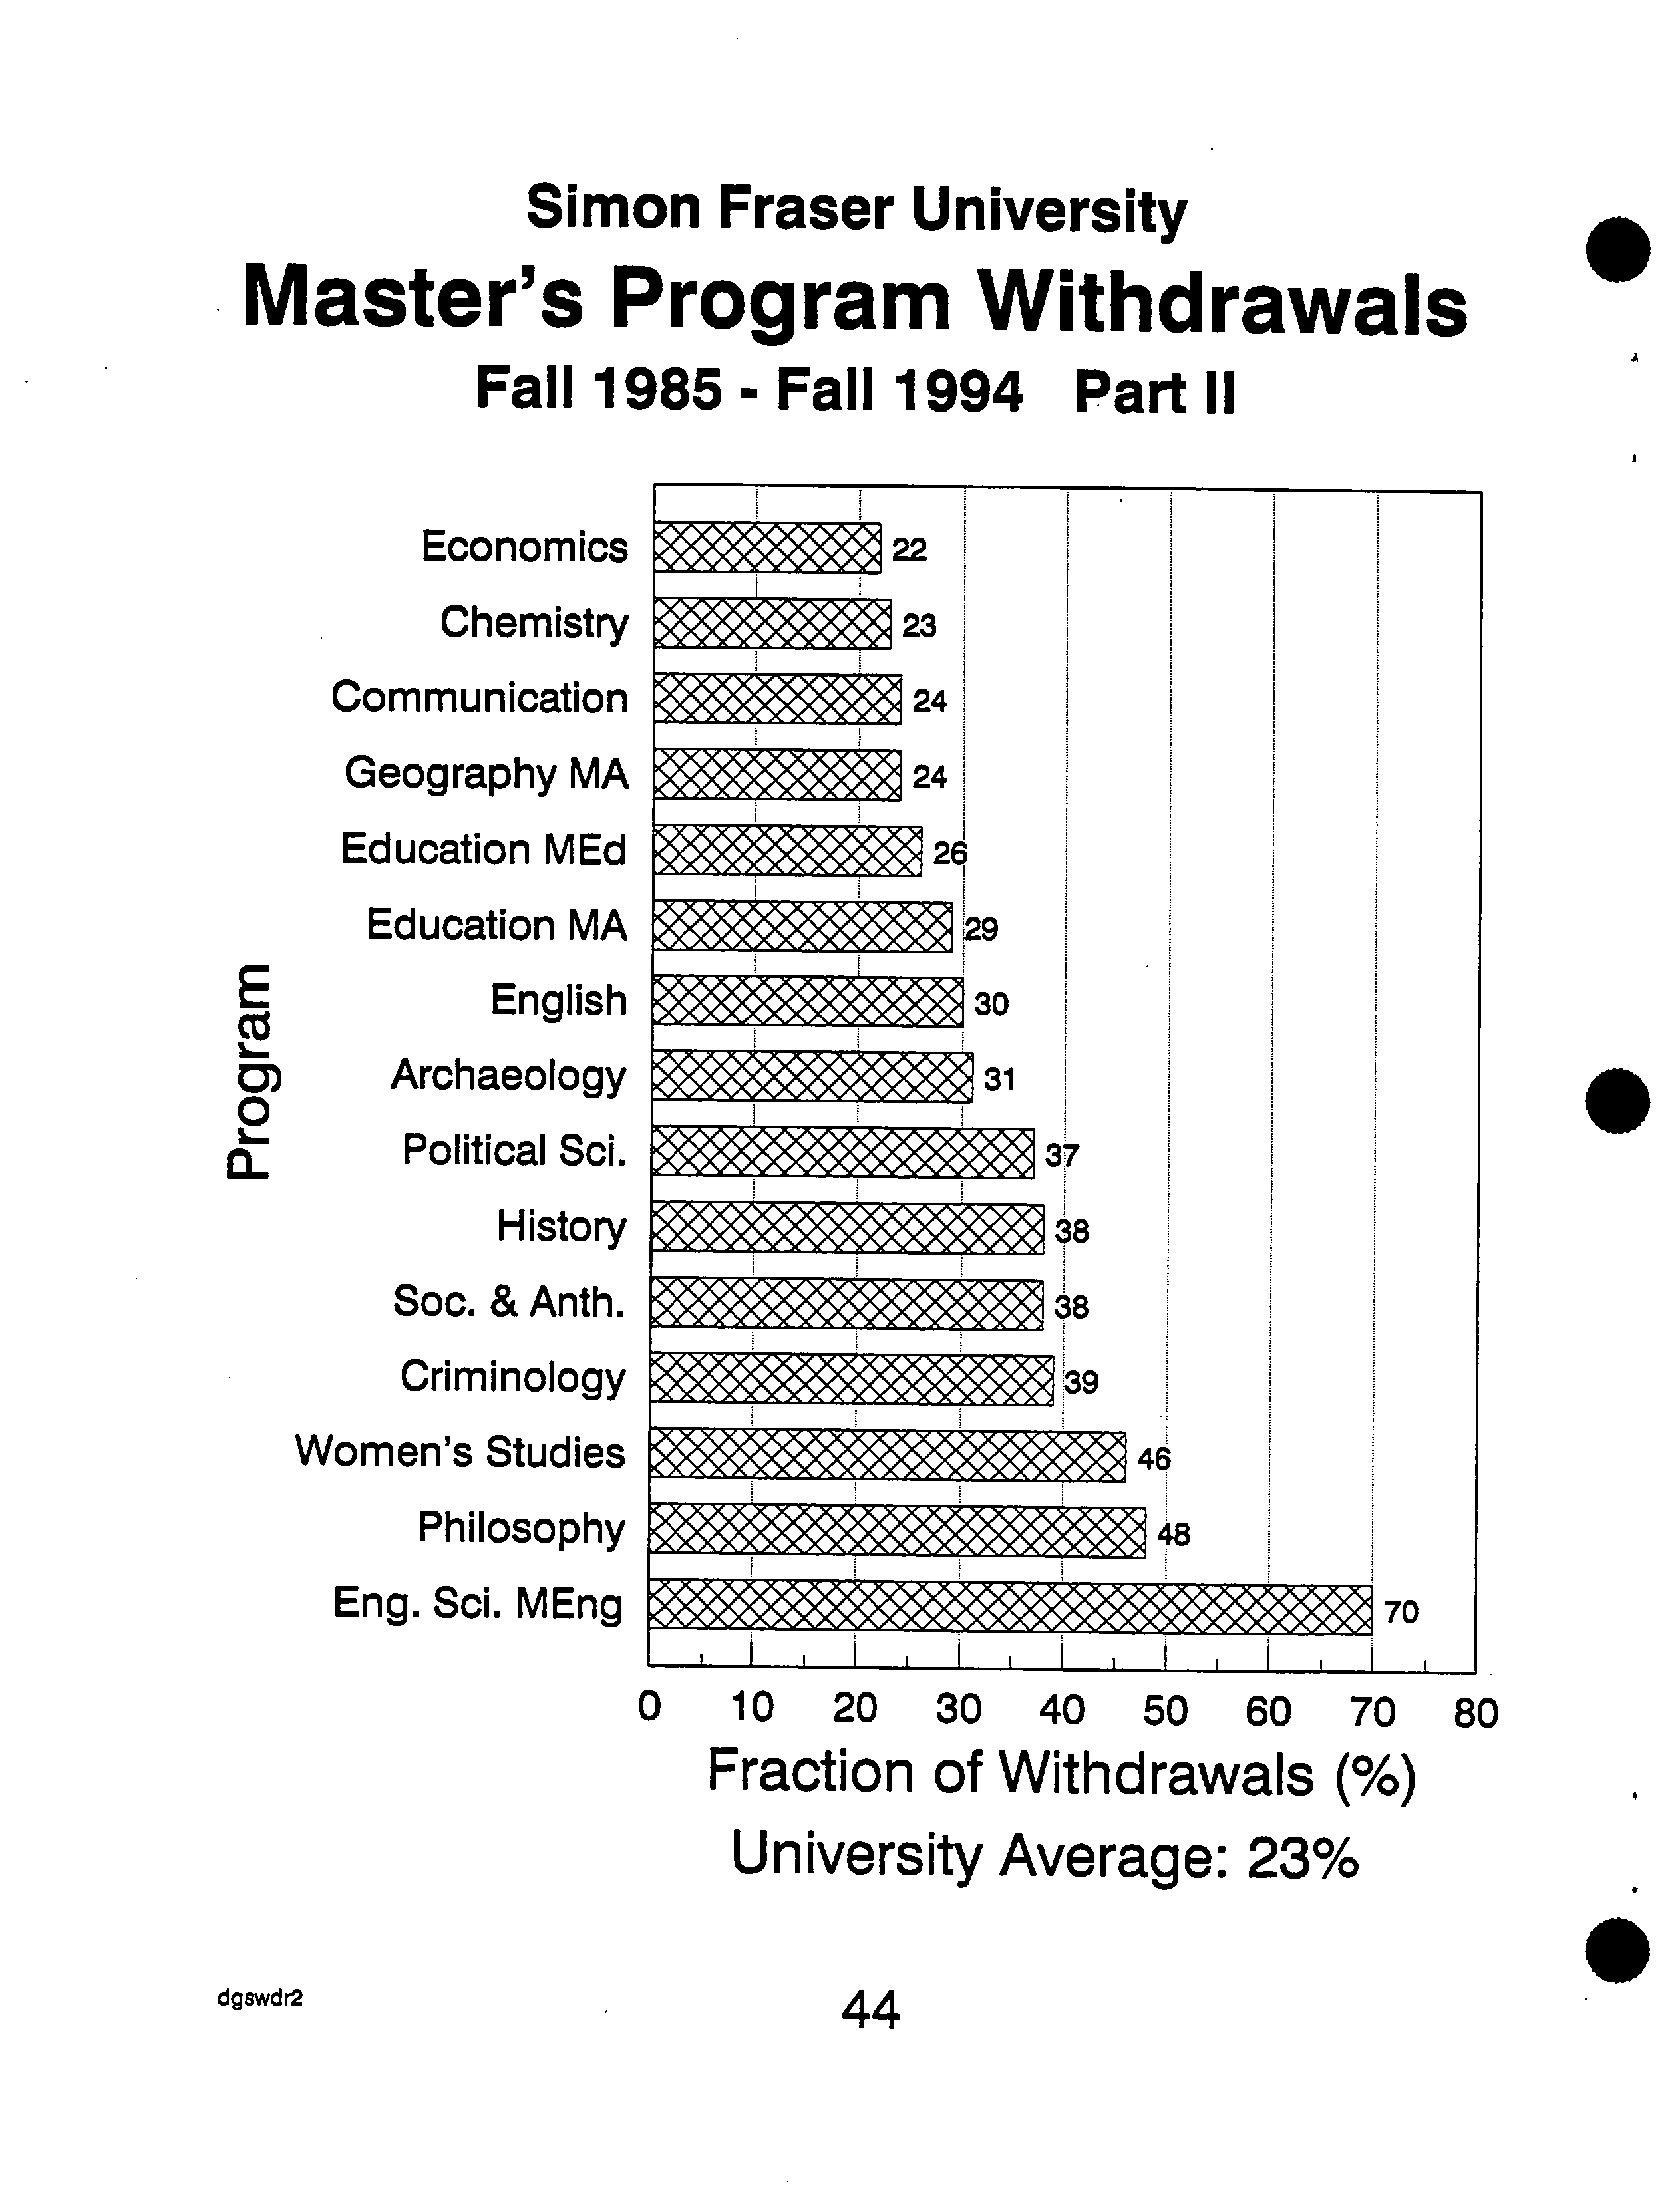
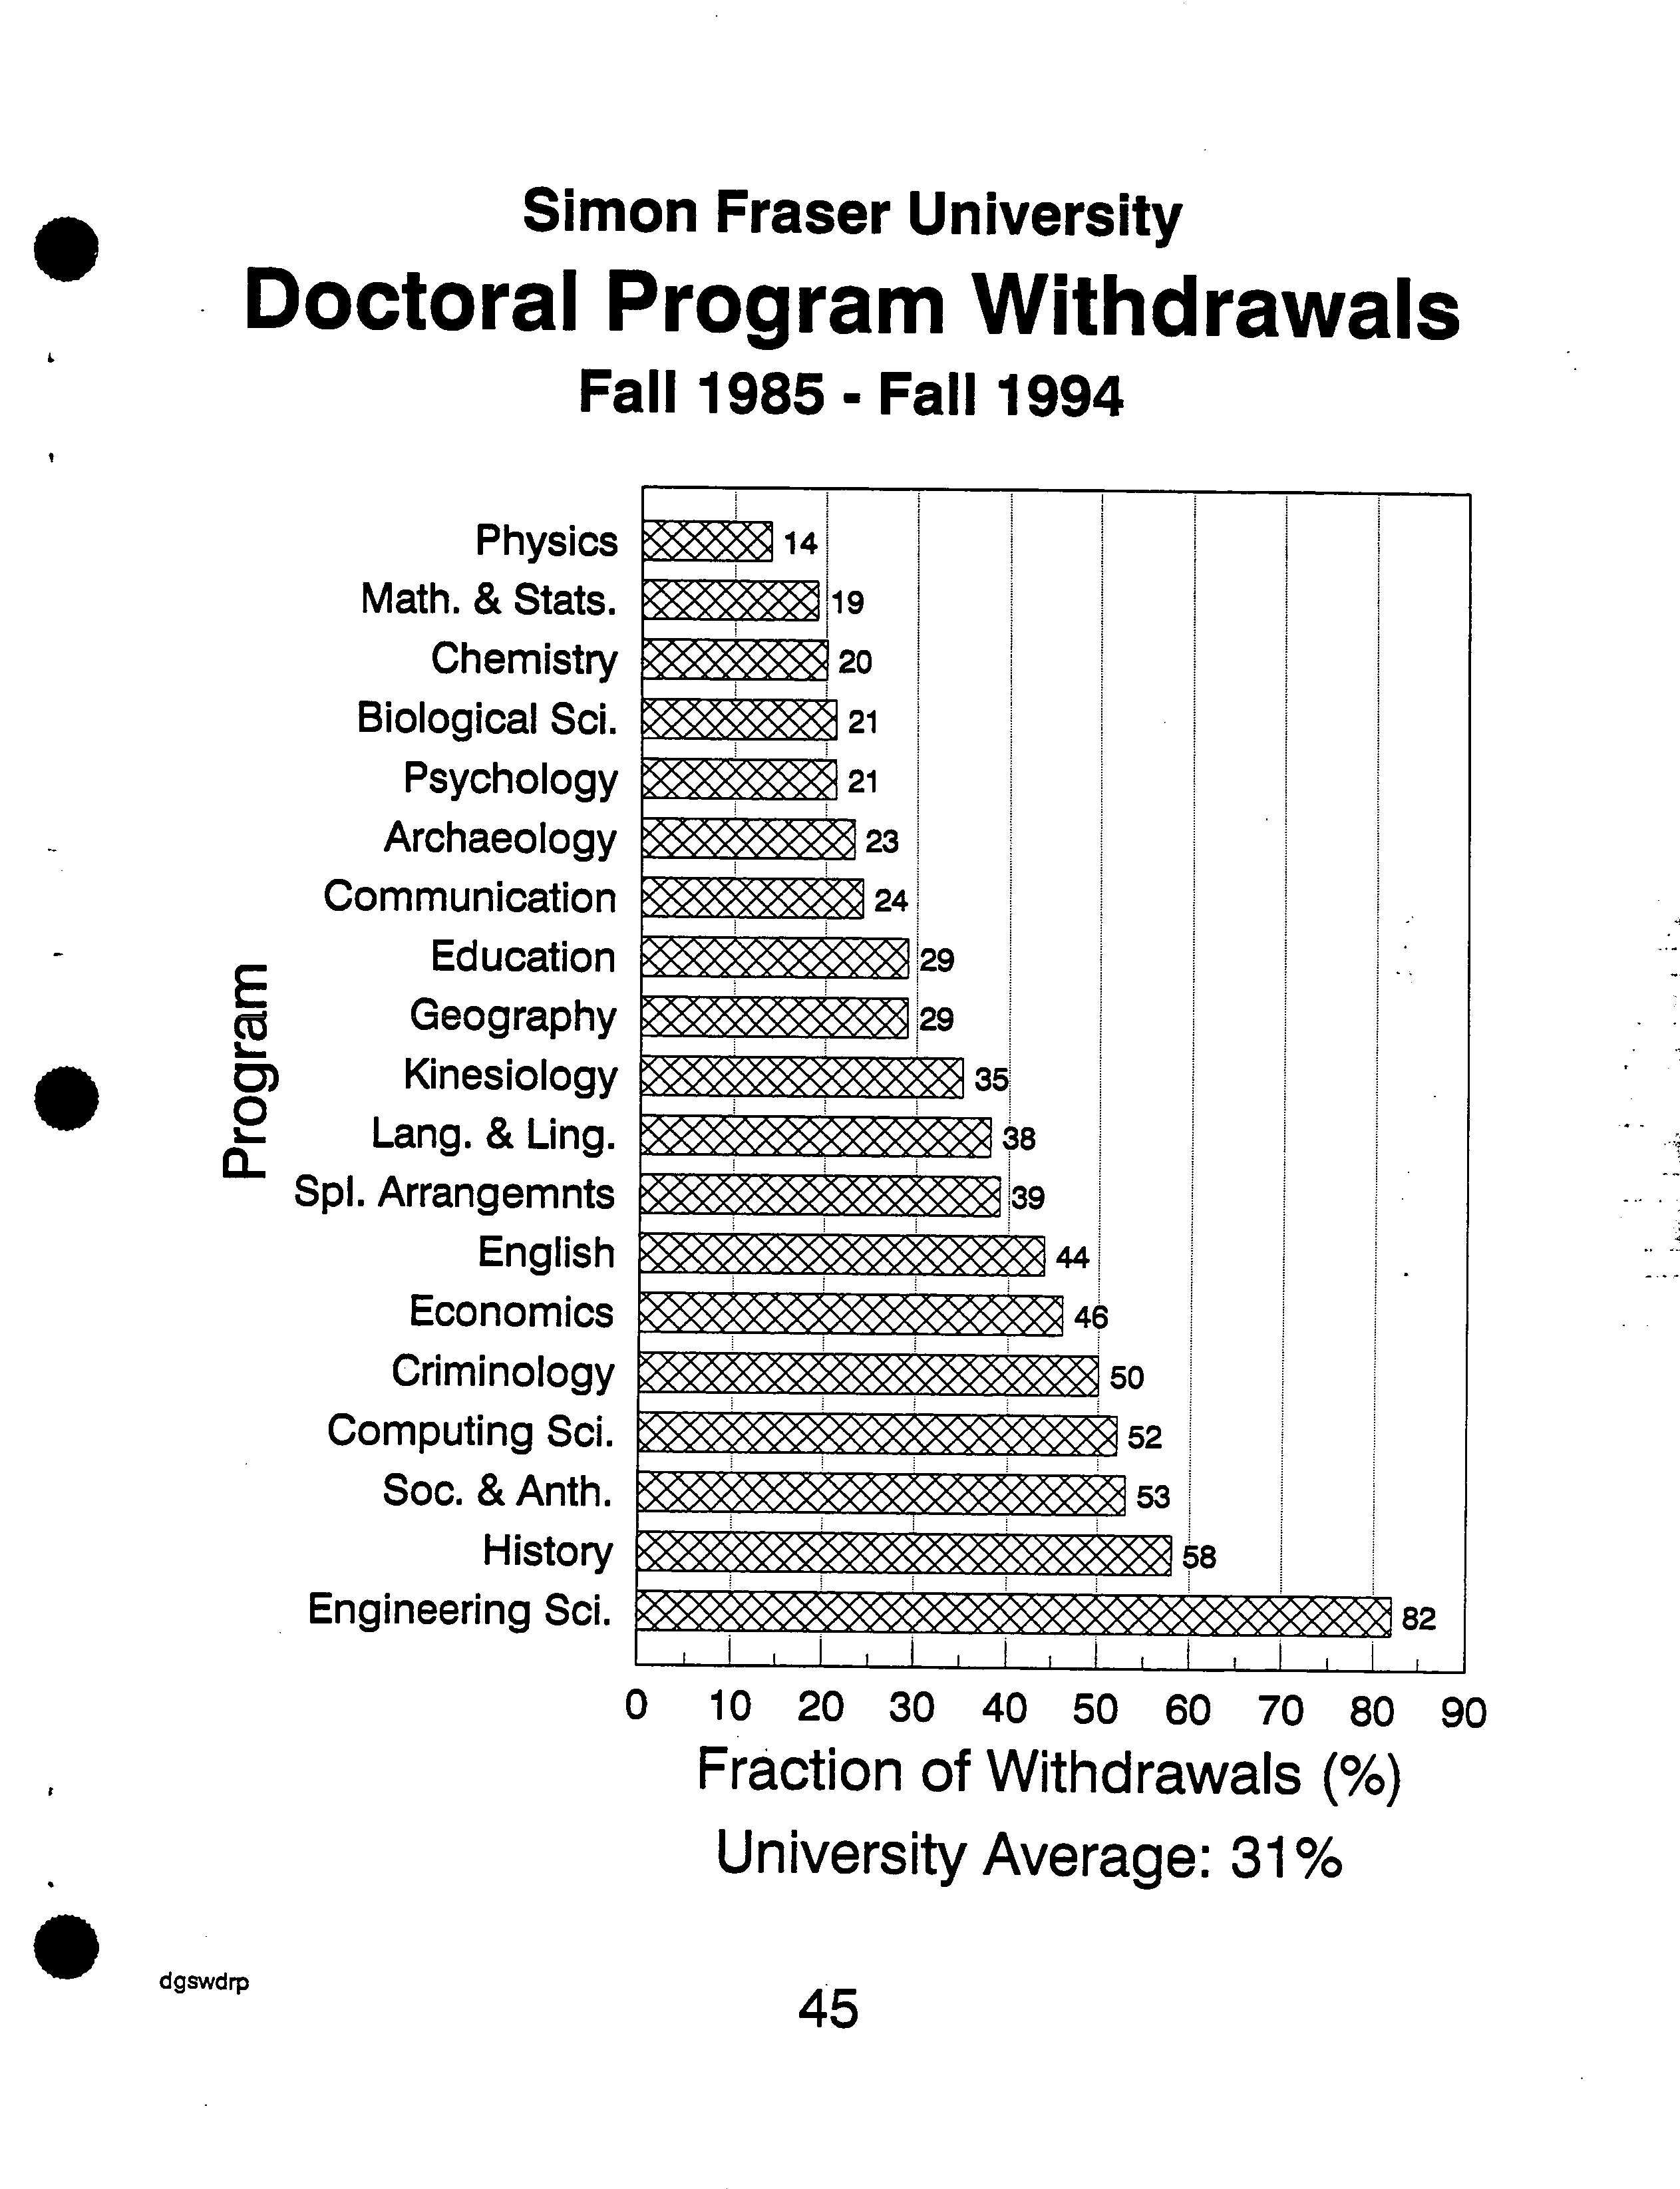
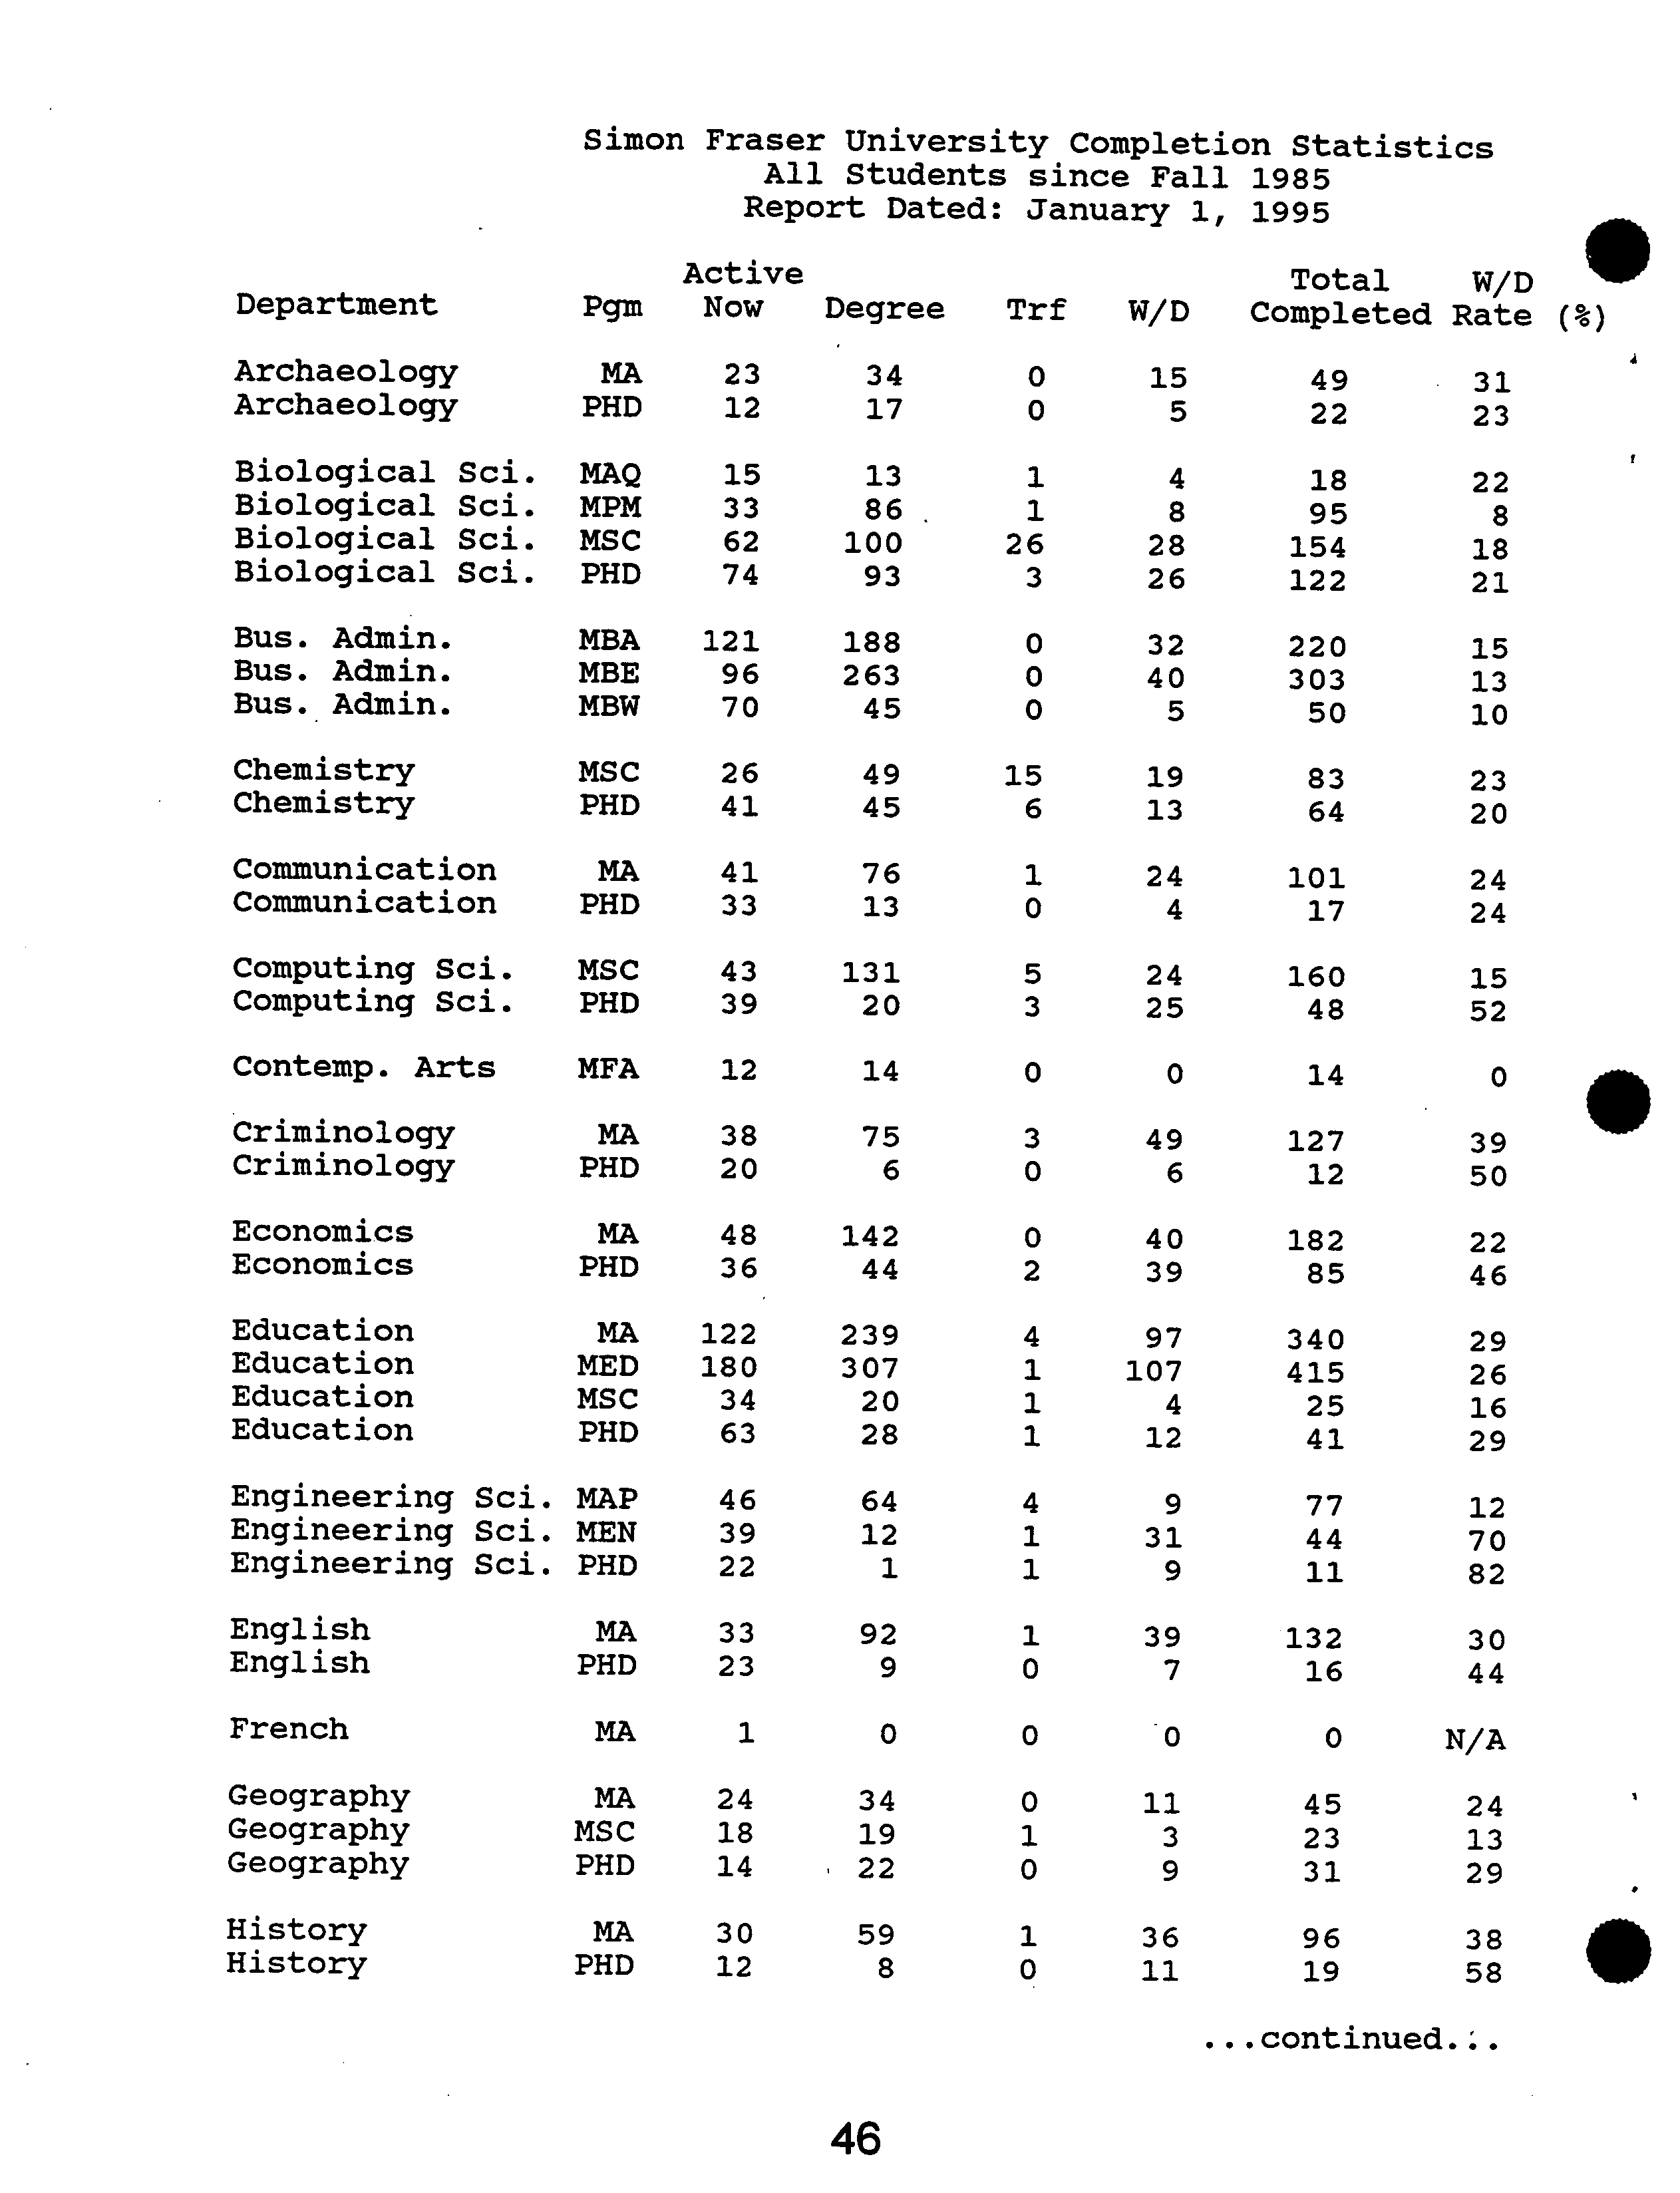
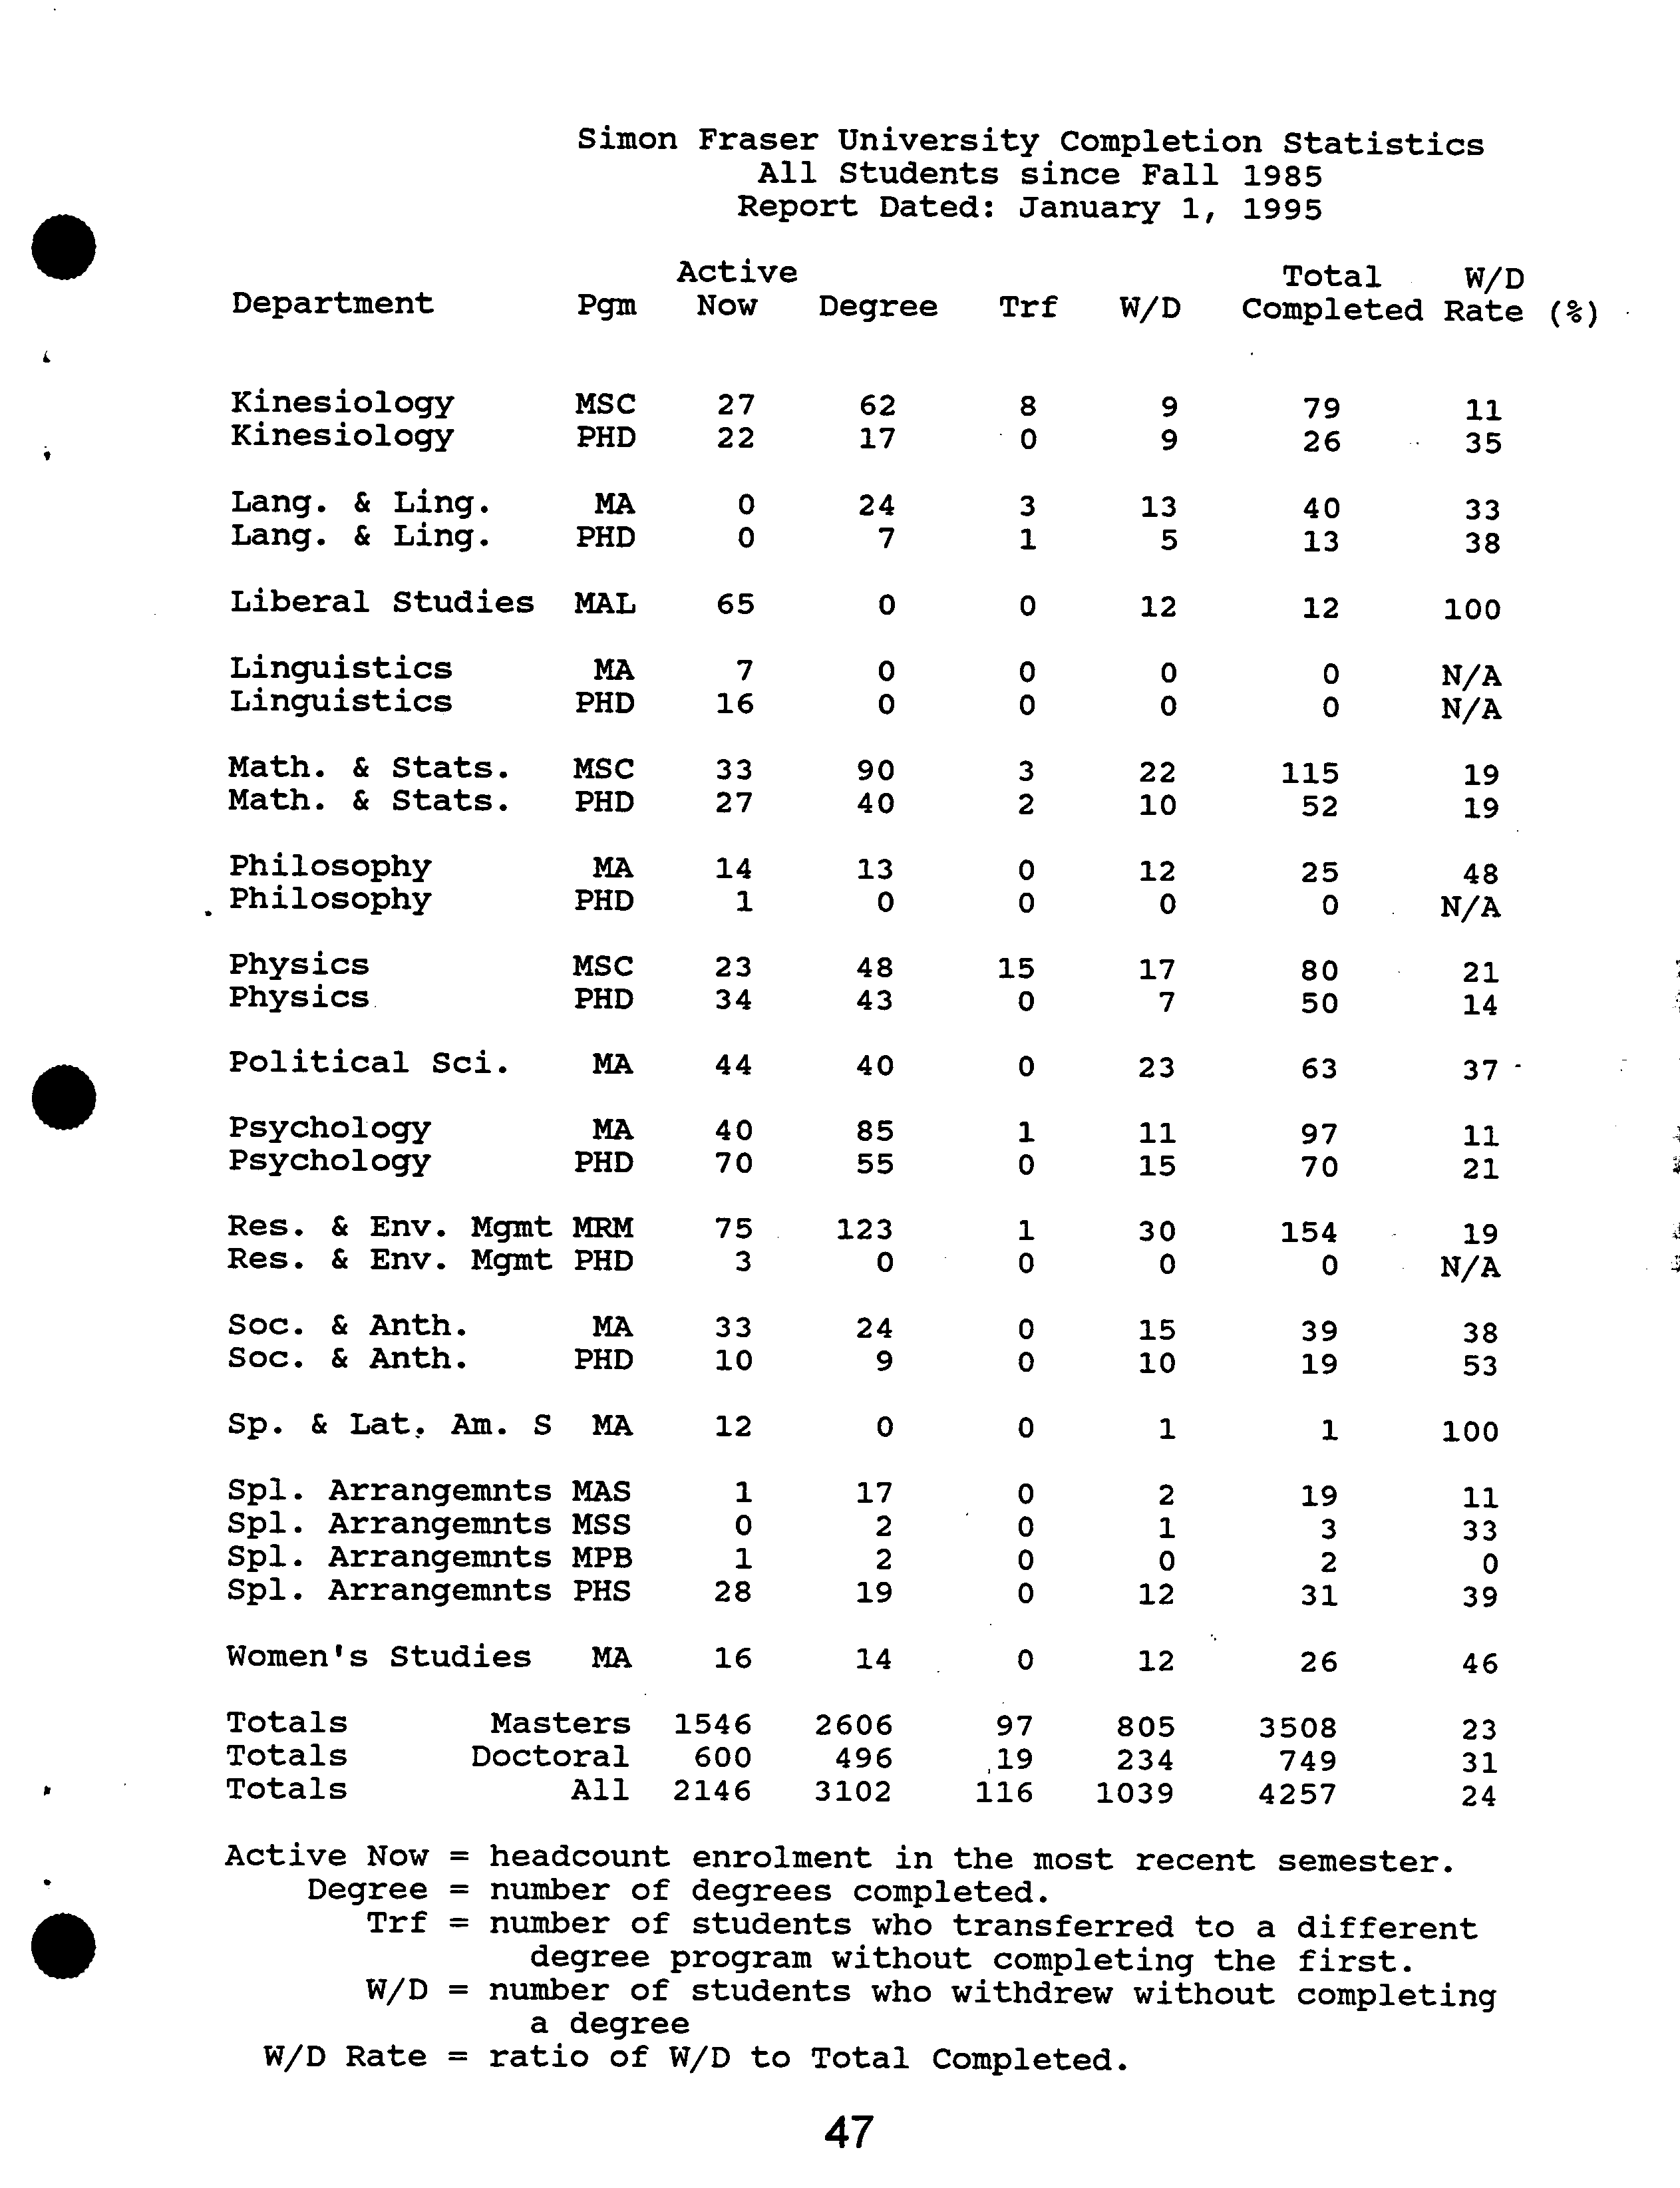
Withdrawal rates are also presented in the Graduate Studies Fact Book. There are tremendous
variations in rates between programs. The overall rates for the University as a whole are in line
with the results of similar studies performed in the U.S. and with a similar study performed by the
Canadian Association for Graduate Studies.
Nonetheless, I am very concerned about the low completion rates in some of our graduate pro-
grams. Withdrawal may be due to any one of or a combination of factors including: lack of abil-
ity, lack of motivation, lack of financial resources, health problems, and deficiencies in the gradu-
ate programs and/or their implementation. As of January 1, 1993, I have instituted an exit ques-
tionnaire to gather information about many aspects of our graduate programs from students who
successfully complete their degrees and from those who withdraw. Because of the need for con-
fidentiality, the results are analyzed only statistically, once enough students respond; analysis of
the second data-set is now underway, as is data obtained from similar questionnaires sent to stu-
dents who withdrew from their programs without completing the degree.
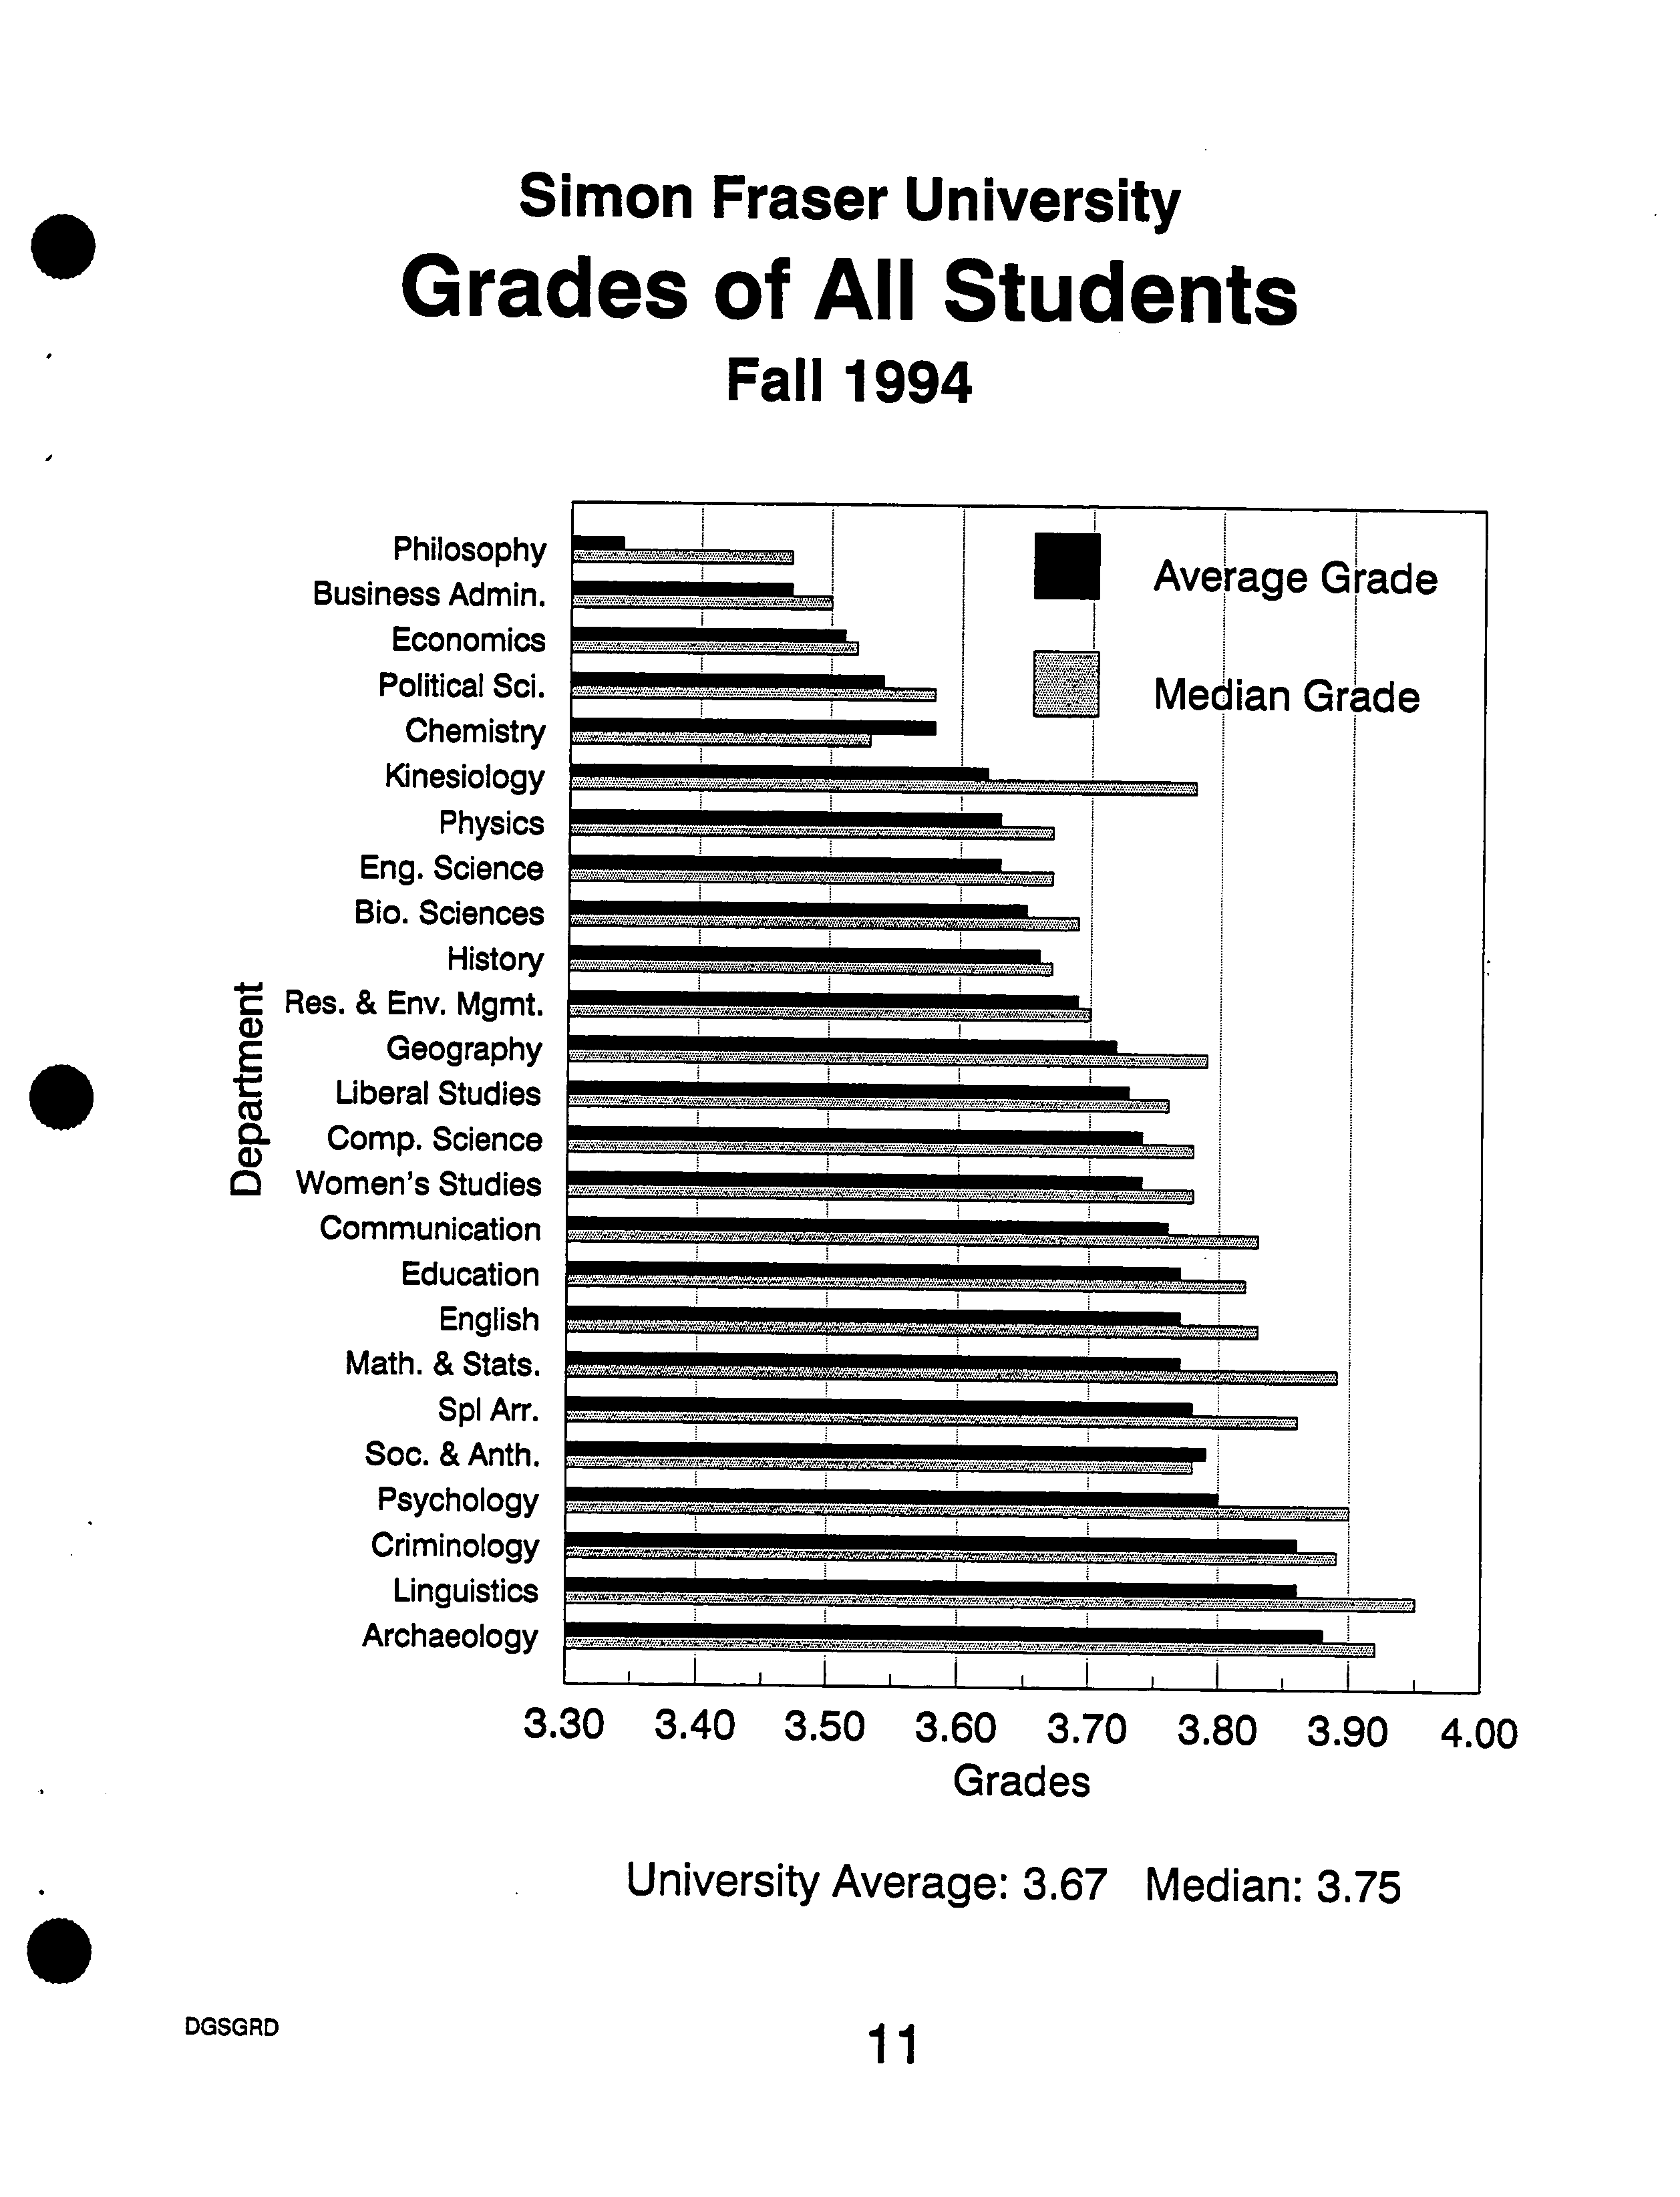
M. Grades
The Graduate Studies Fact Book gives information on the S.F.U. graduate grades of the end of
the Summer 1994 semester; it excludes students who had not yet taken an S.F.U. graduate
course. Data were taken from the Registrar's data flies and incorporated into and processed
within the Graduate Studies Database system.
The tremendous range in the grade distributions among departments may stem from two causes:
(1) differences in grading practices and (2) differences in the abilities of students. I believe that,
most likely, it is a mixture of these with the former a larger contributor than the latter. This range
is one of the reasons that I moved away from interdepartmental comparisons of CGPA in the
ranking of applicants for S.F.U. graduate scholarships.
1V. Special Arrangements
The Senate Graduate Studies Committee serves as the Graduate Program Committee of students
enrolled under Special Arrangements. Dr. Wrenn has given special attention to these students.
With the goal of ensuring their satisfactory progress, we have brought all their supervisory
I'M
1994 S.G.S.C.
Report to Senate
?
. Page 3
committees into compliance with Senate's regulations and require up-to-date progress reports as a
condition of registration. The response of students and supervisors has been excellent.
I am pleased to-report that the defences of theses completed under Special Arrangements, which
Dr. Wrenn chairs, have
all
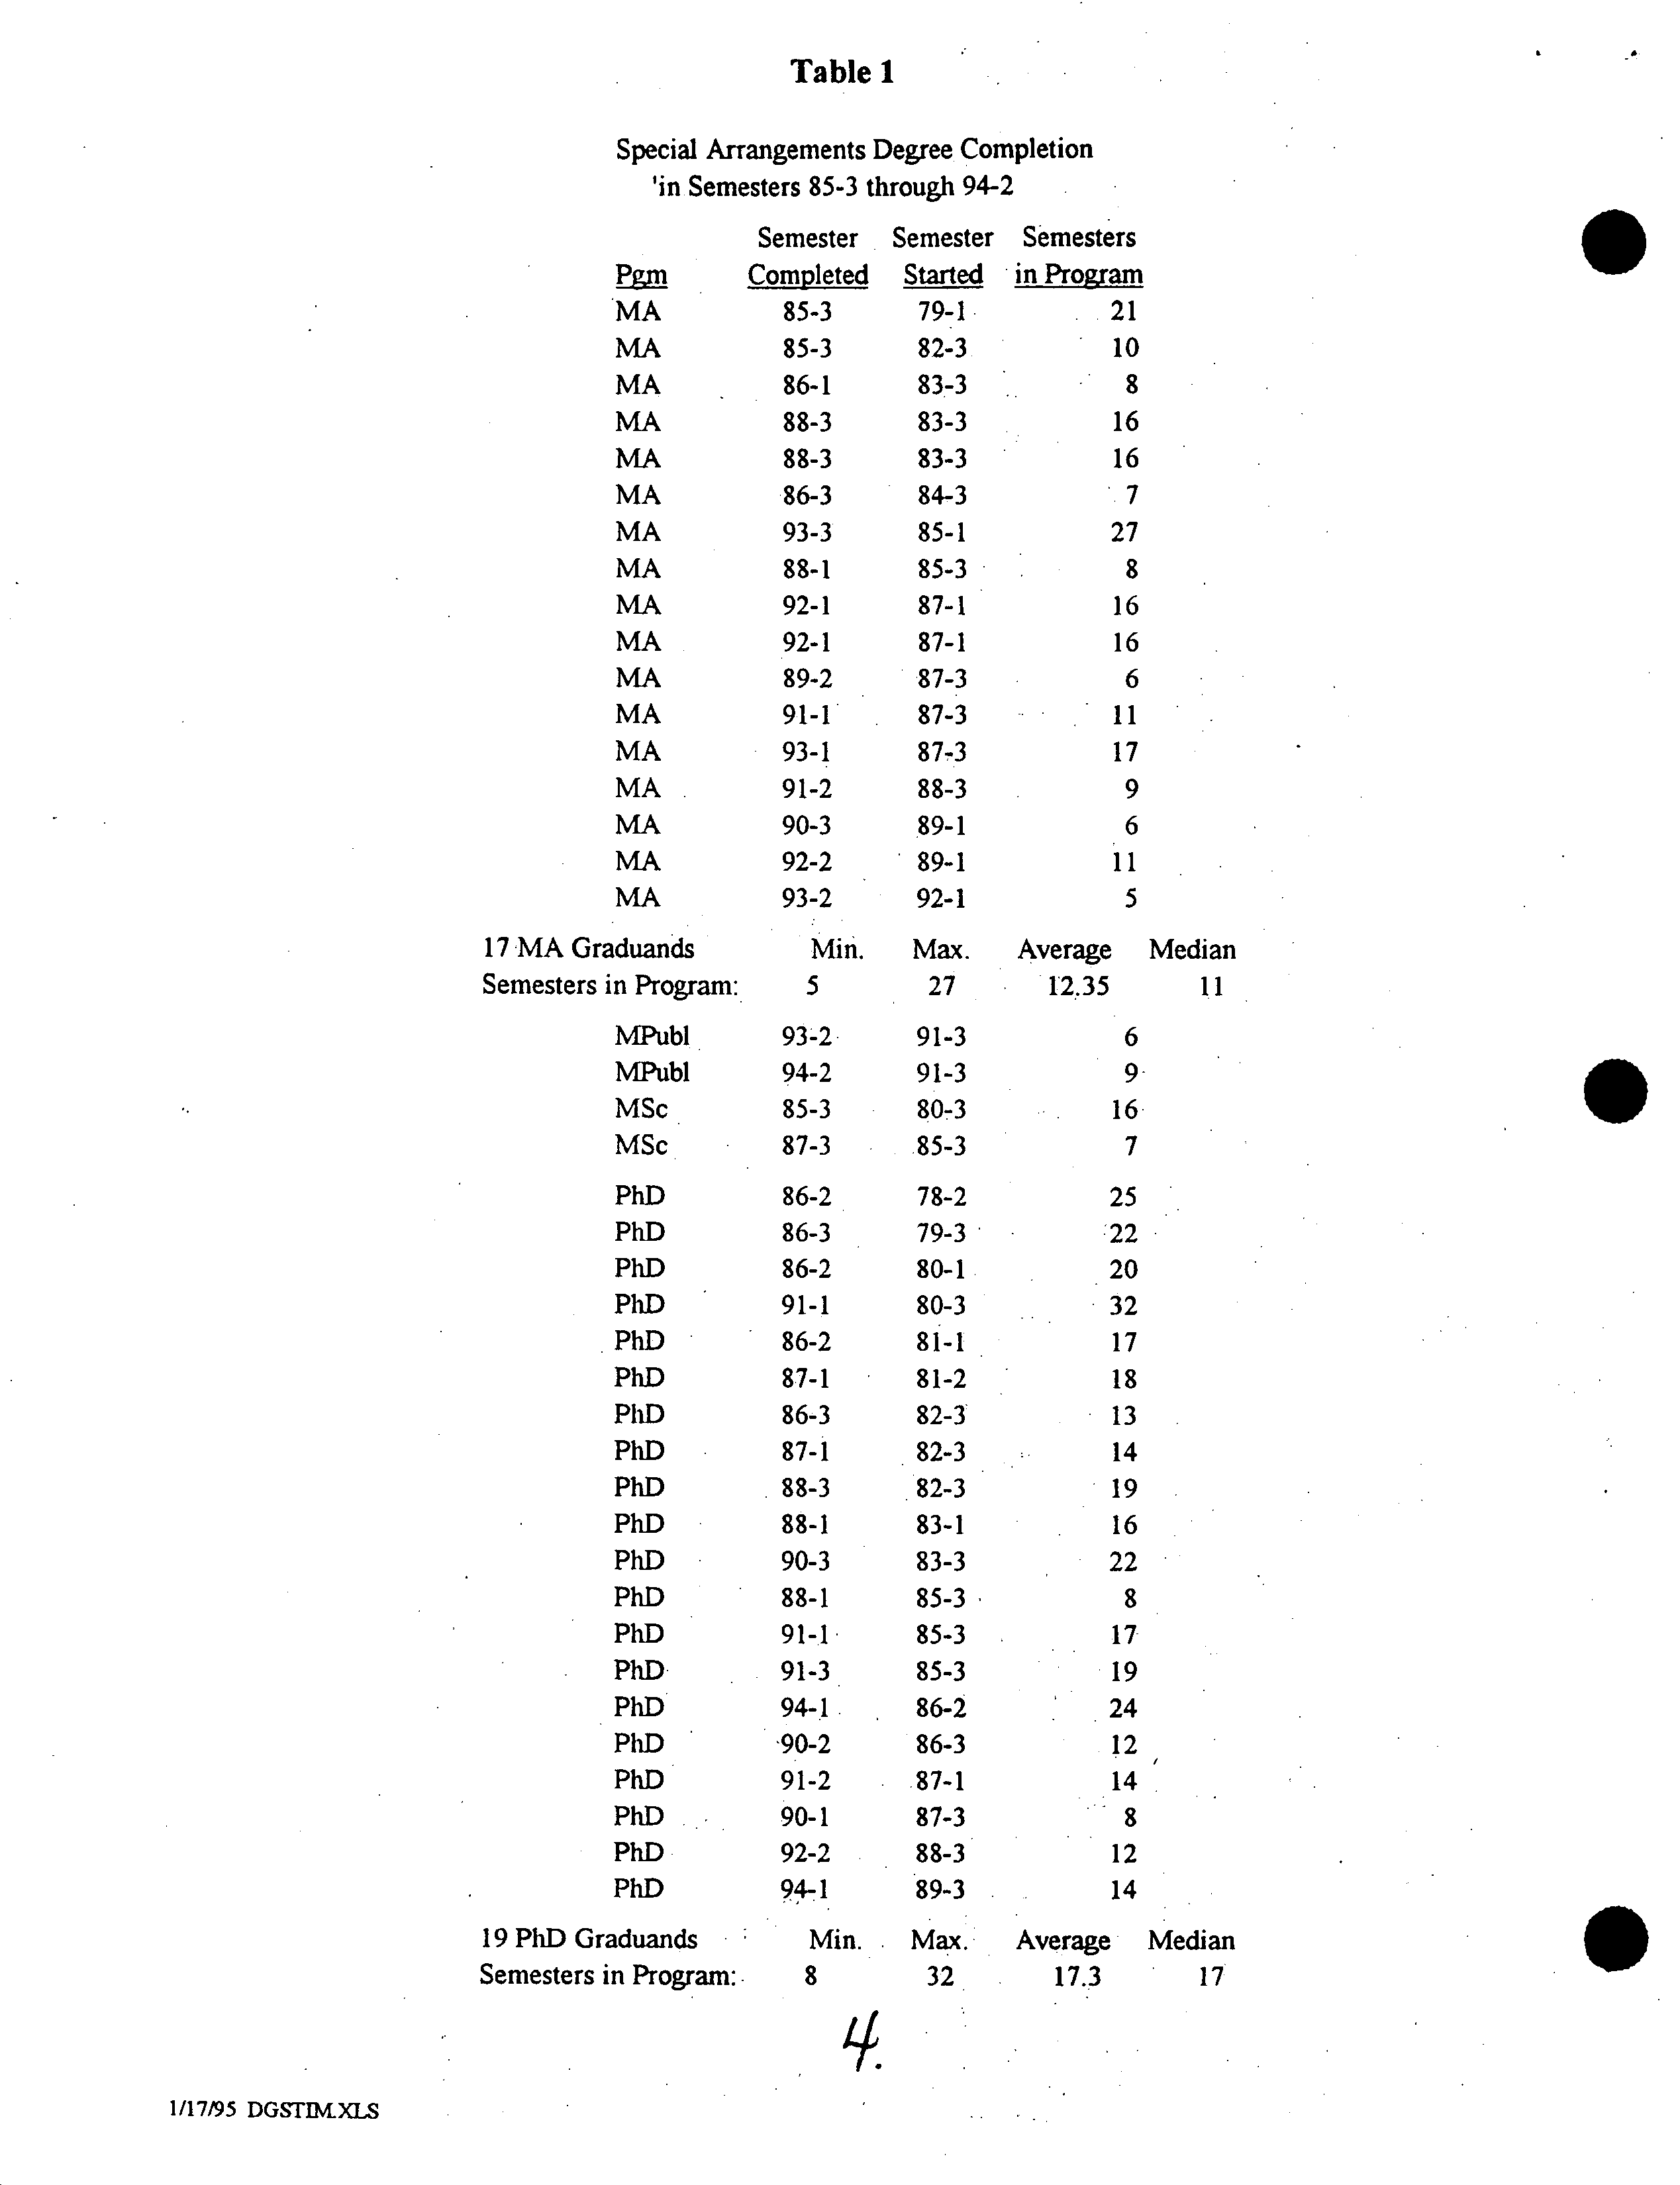
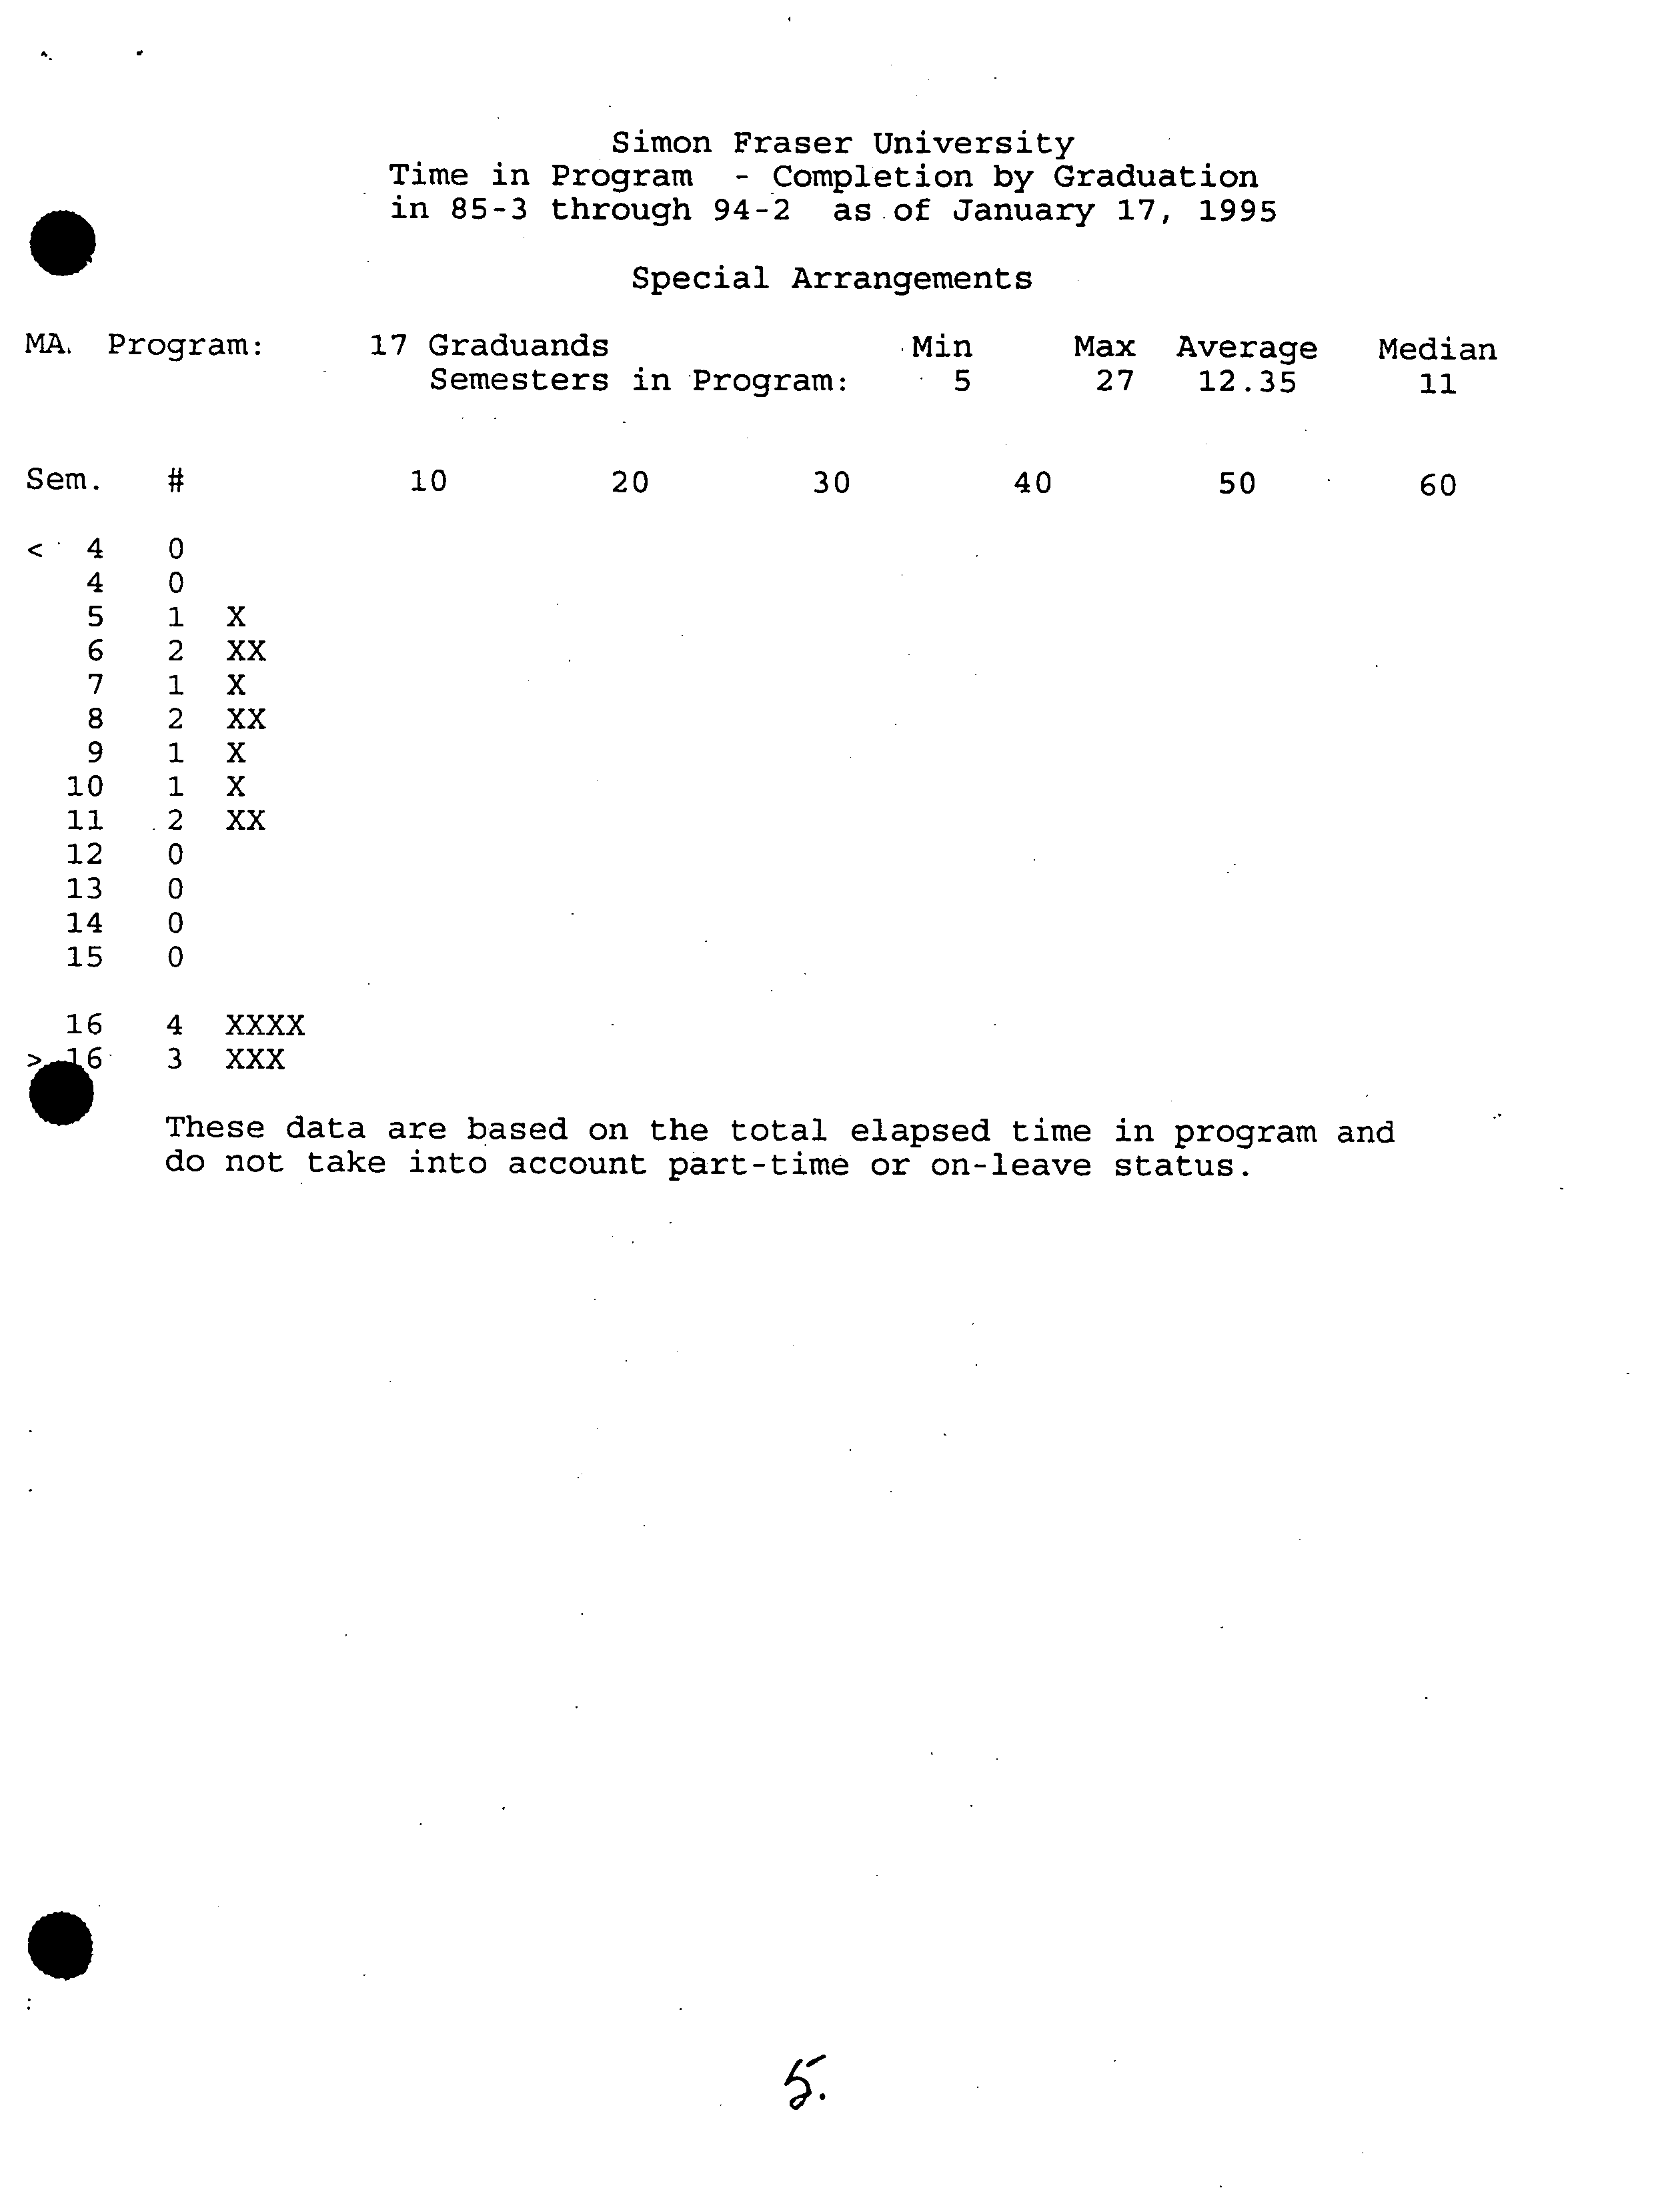
been quite successful. Historically, Special Arrangements has been a
high risk area; students either succeed or fail spectacularly. The number of students enrolled
have remained roughly constant around 25- 30. Degree completion has been highly variable; see
Table I and the table below (degrees completed in each year):
1981 4 ?
1984 6 ?
1987 7
?
1990 2 ?
1993 3
1982 2 ?
1985
2 ?
1988 4
?
1991 6
?
1994 3
1983 1 ?
1986 6 ?
1989 3
?
1992 4
Some other students have dropped out and others encountered health problems. By the steps
outlined above and by continued rigorous adherence to the criteria for entrance into Special Ar-
rangements, we hope to improve the success rate.
V.
Administration
In September 1993, a $40 application fee was introduced. Revenues are directed to General Uni-
versity Revenues and to my office in the proportion of 30:70. Most of the funds directed to my
office are transferred to departments to assist in meeting the costs of recruiting, processing of the
applications, and student travel for research and conference attendance.
Vt. S.G.S.C. Motions
A summary of the motions passed by the S.G.S.C. in 1994, prepared by the Office of the Regis-
trar, is presented in Appendix
B.
VU.
The Future
I remain cautiously optimistic about the future of graduate studies at SFU. Over the last several
years, we introduced a number of new programs which are in the process of implementation.
Other exciting new program initiatives are presently in the planning process; some of these have
received approval from the Senate Committee on Academic Planning to proceed with detailed
planning. It will be essential to ensure that sufficient resources are allocated to support present
and future programs, while maintaining high quality.
The quality of our existing programs is high, as is the quality of most of the thesis defences which
I have attended. With rare exception, applicants recommended by departments for entry into
Ph.D. programs have been very strong. Through aggressive recruiting of excellent applicants
with the aid of entrance scholarships, rigorous enforcement of the present requirements for satis-
factory progress, improved financial aid and careful monitoring of student supervision, it should
be possible to improve further the quality of our graduate programs, and to decrease degree
completion times and withdrawal rates, thus making more effective use of our resources.
S ?
B.P. Clayman
Dean of Graduate Studies
Attachments
3.
Table 1
Special Arrangements Degree Completion
'in Semesters 85-3 through 94-2
Semester
Semester
Semesters
P
Rm
Completed
Started
in Program
MA
85-3
79-1
21
MA
85-3
82-3
10
MA
86-1
83-3 ?
.
8
MA
88-3
83-3
16
MA
88-3
83-3
16
MA
86-3
84-3
7
MA
93-3
85-1
27
MA
88-1
85-3
8
MA
92-1
87-1
16
MA
92-1
87-1
16
MA
89-2
87-3
6
MA
91-1
87-3
11
MA
93-1
87-3
17
MA
91-2
88-3
9
MA
90-3
89-1
6
MA
92-2
89-1
11
MA
93-2
92-1
5
17 MA Graduands
Mm.
Max.
Average
Median
Semesters in Program:
5
27
12.35
11
MPubl
93-2
91-3
6
MPubl
94-2
91-3
9
MSc
85-3
803
. ?
16
MSc
87-3
85-3
7
PhD
86-2
78-2
25
PhD
86-3
79-3
22
PhD
86-2
80-1
20
PhD
91-1
80-3
32
PhD
86-2
81-1
17
PhD
87-1
81-2
18
PhD
86-3
82-3
13
PhD
87-1
82-3
. ?
14
PhD
88-3
82-3
19
PhD
88-1
83-1
16
PhD
90-3
83-3
22
PhD
88-1
85-3
8
PhD
91-1
85-3
17
PhD
91-3
85-3
19
PhD
944.
86-2
.24
PhD
90-2
86-3
12
PhD
91-2
87-1
14
PhD
90-1
87-3
8
PhD
92-2
88-3
12
PhD
94-1
89-3
14
19 PhD Graduands
Min. . ?
Max.
Average Median
Semesters in Program:.
8
32
17.3
17
Li
.
.
1117195
DGSTTh&XLS
Simon Fraser University
Time in Program
?
- Completion by Graduation
•
in 85-3 through 94-2
?
as of January 17,
1995
Special Arrangements
MA,
Program:
17 Graduands ?
•Min ?
Max
Average ?
Median
Semesters in Program: ?
5 ?
27
12.35 ?
11
Sem.
#
10 ?
20 ?
30 ?
40
50 ?
60
<4
0
4
0
S lx
6
2
XX
7
lx
8 2
XX
9
lx
10
1
X
11
.2
XX
12
0
13
0
14
0
15
0
16
4 XXXX
>
?
6
3 XXX
These data
are based on the total elapsed time in
program and
do not
take into account part-time or on-leave status.
S
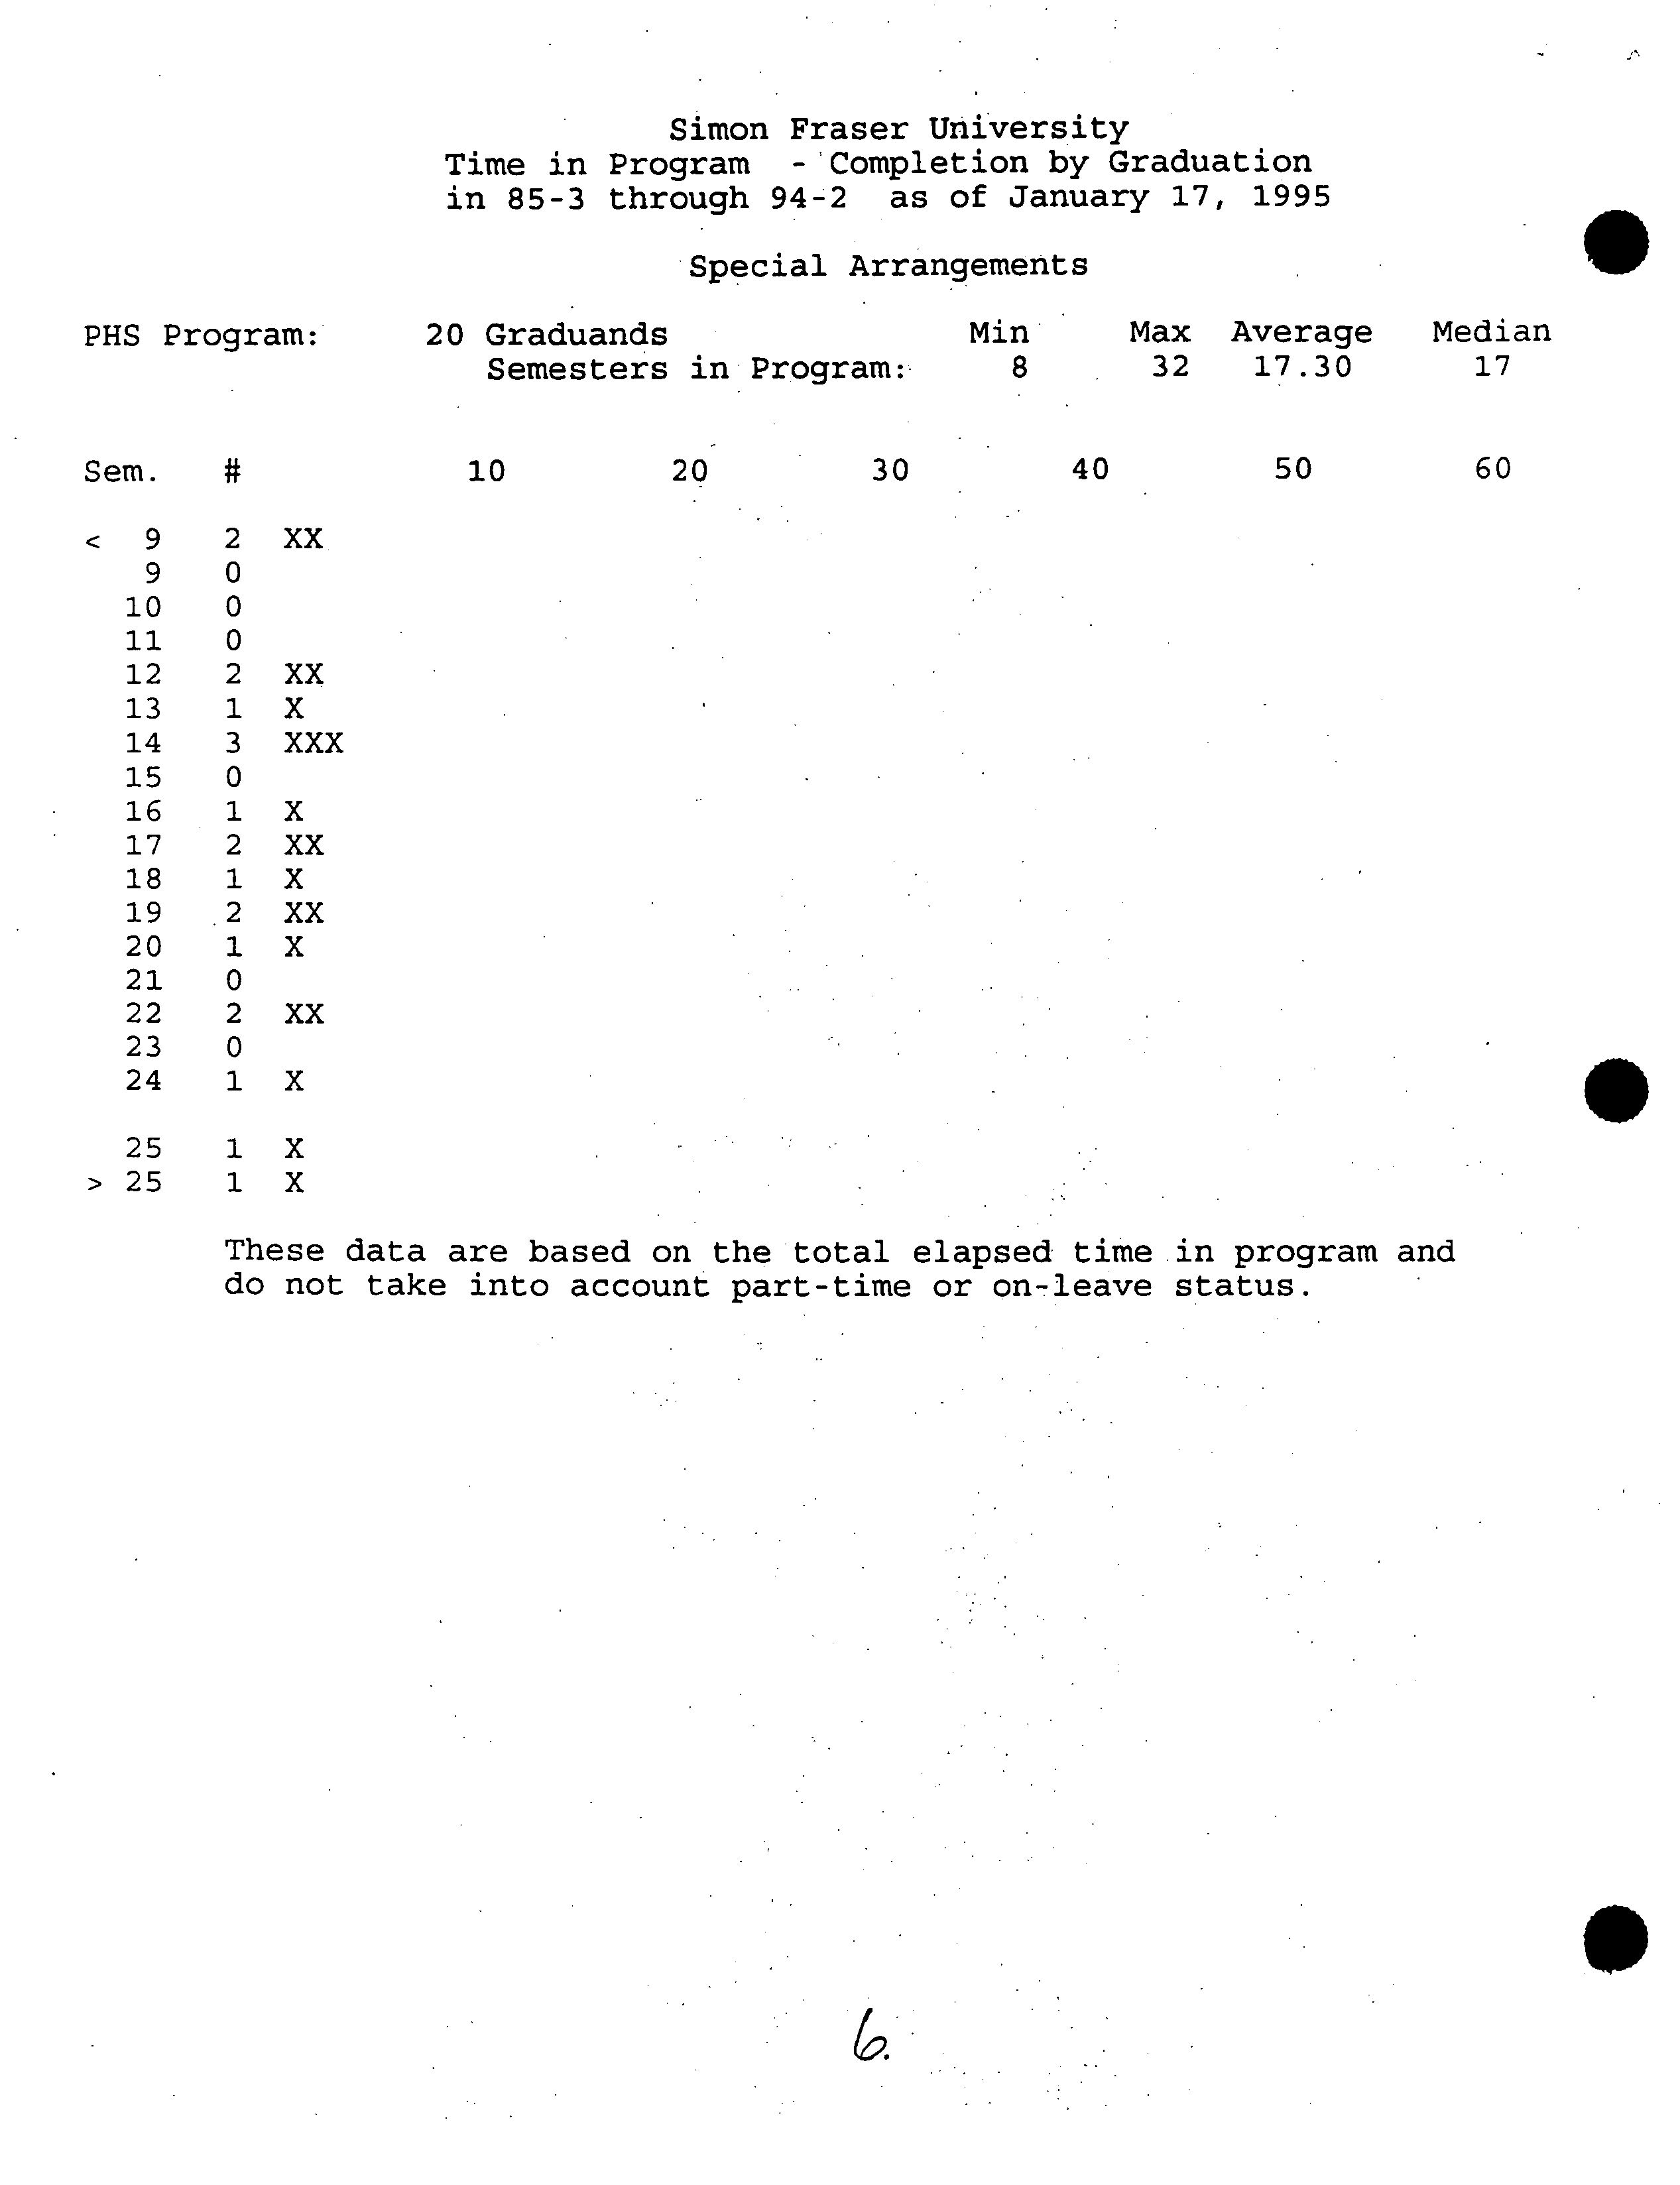
Simon Fraser University
Time in Program
?
-'Completion by Graduation
in 85-3 through 94-2
?
as of January 17,
1995
Special Arrangements
PHS
Program: 20 Graduands
?
min
?
Max Average ?
Median
Semesters in Program: ?
8 ?
32
17.30 ?
17
Sem.
#
10 ?
20 ?
30 ?
40
50 ?
60
<9
2
XX
9
0
10 0
11 0
12
2
XX
13
1X
14
3
XXX
15
0
16
1
X
17
2
XX
18
1X
19
. 2
XX
20
1
X
21
0
22
2
XX
>:
;
These
data are based on the total elapsed time in
program and
do
not
take into account part-time or on-leave status.
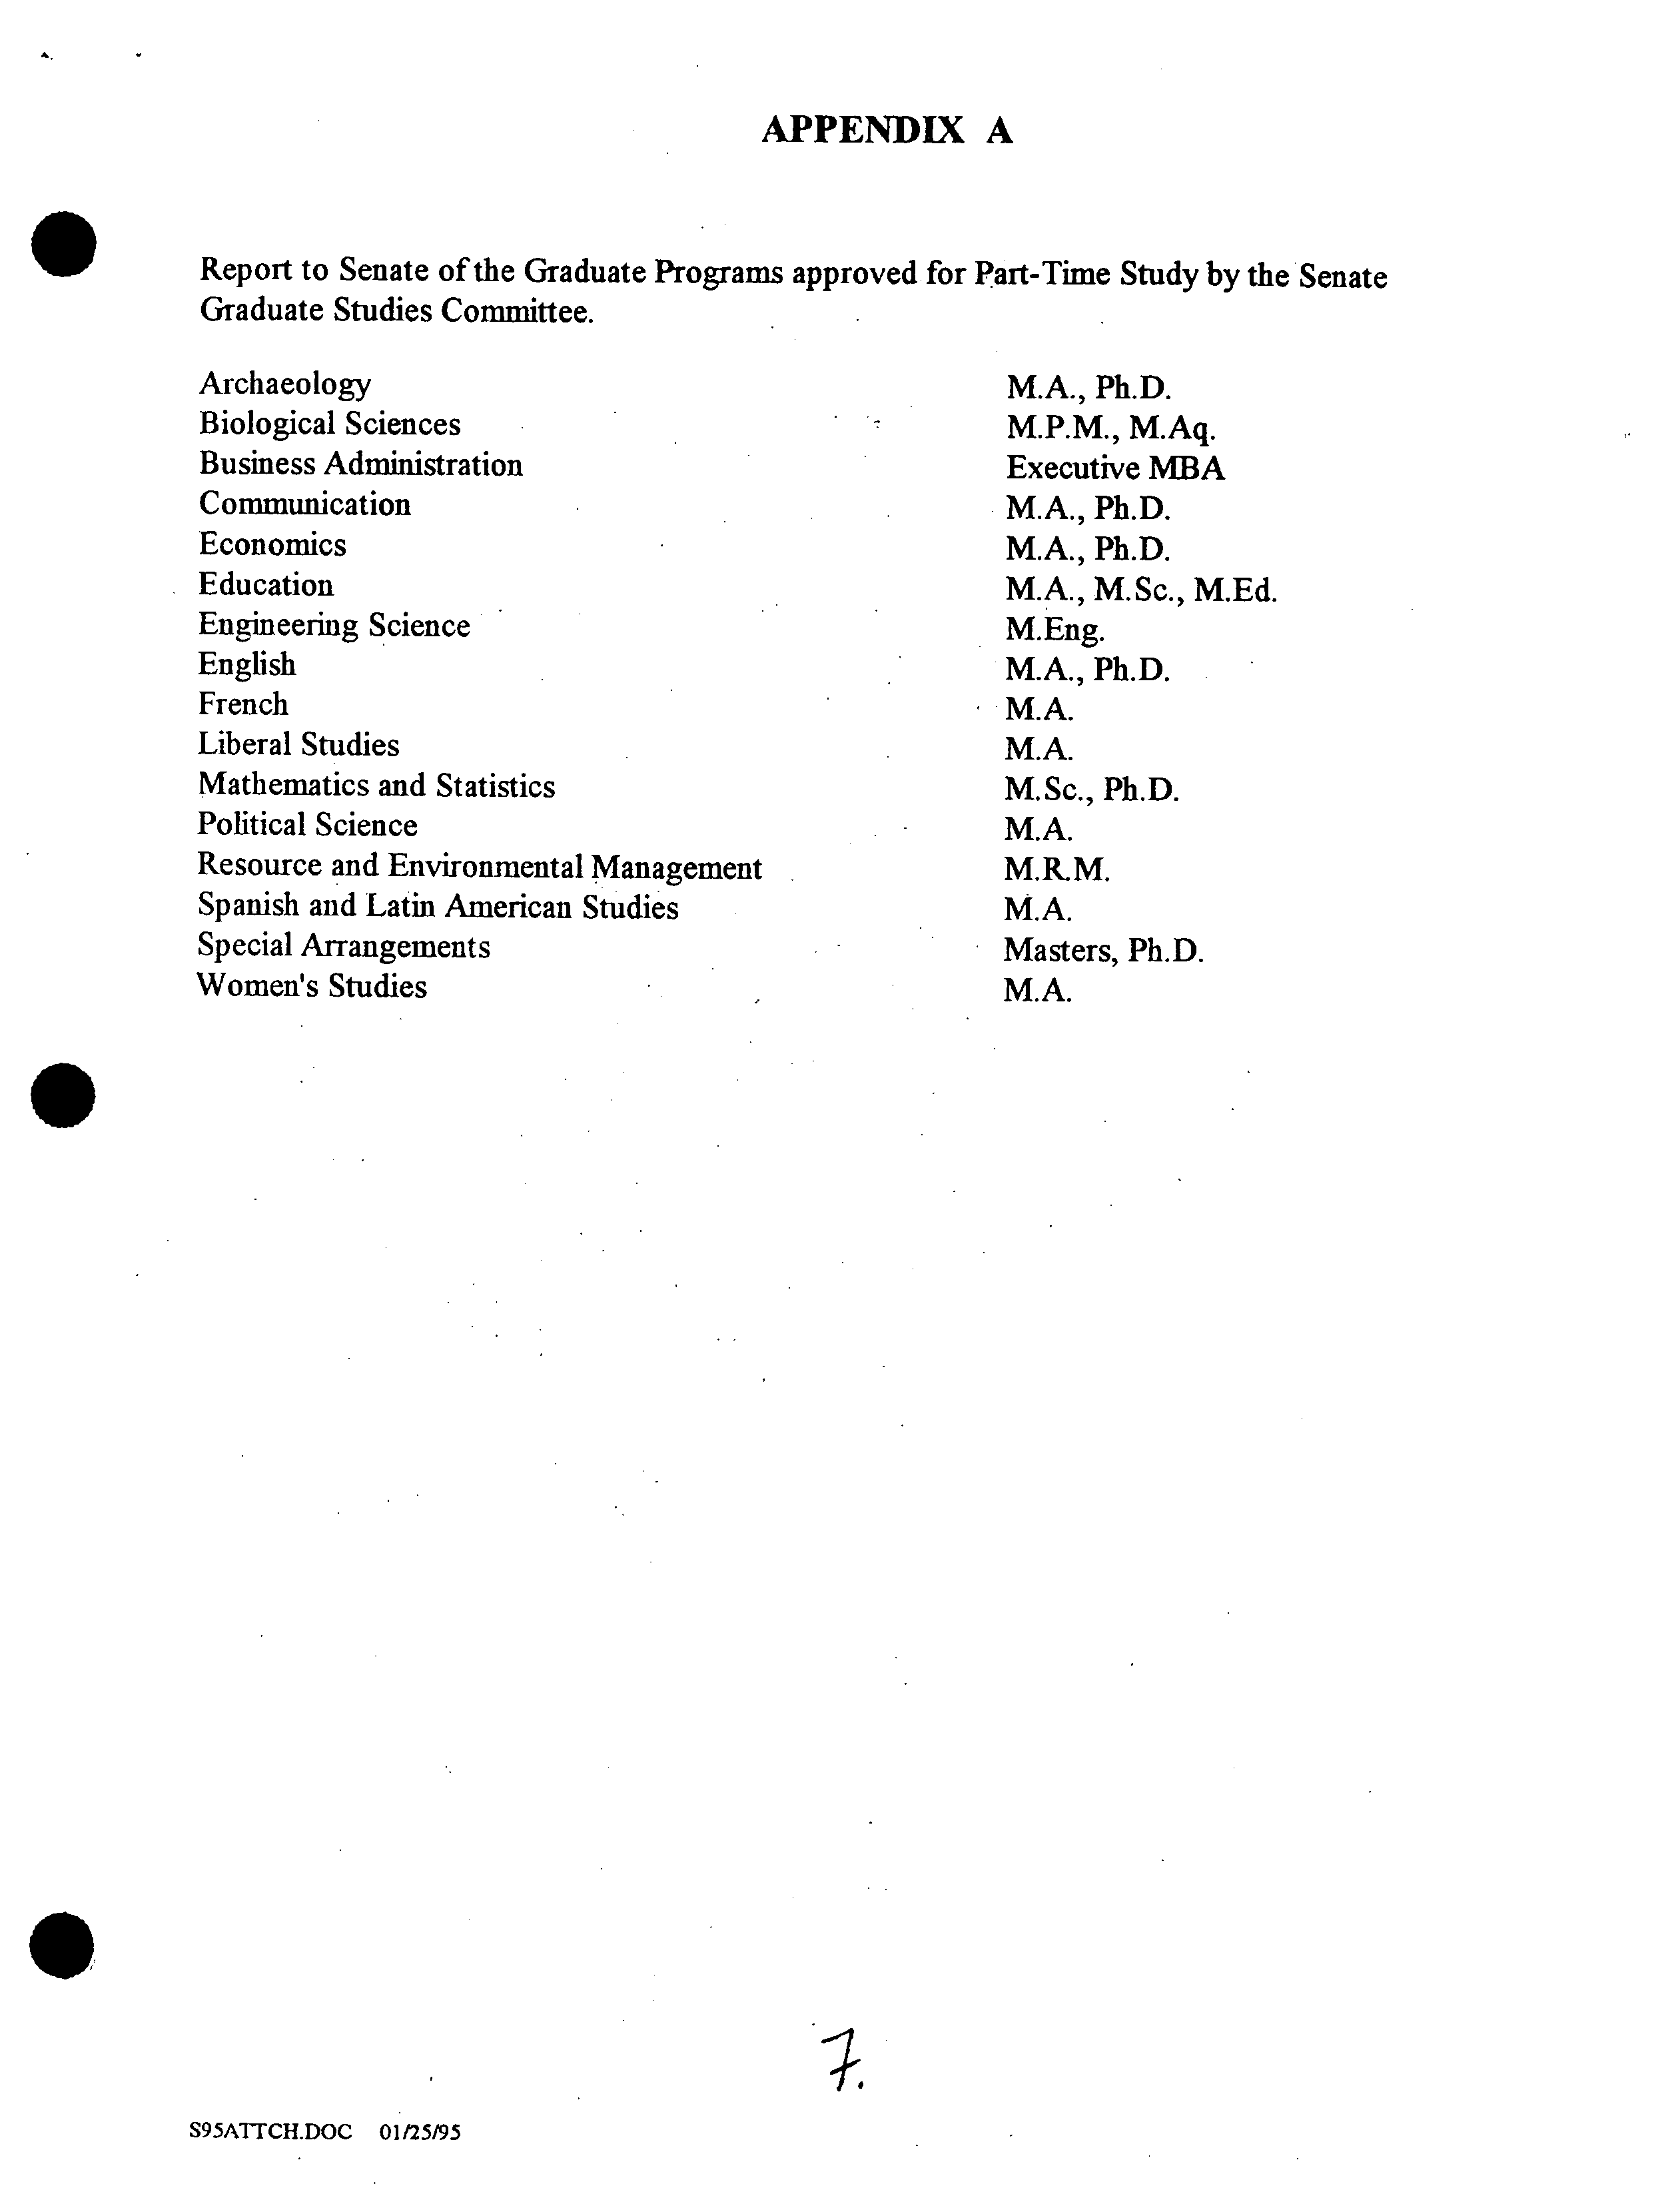
APPENDIX
A
Report to Senate of the Graduate Programs approved for Part-Time Study by the Senate
Graduate Studies Committee.
Archaeology
M.A., Ph.D.
Biological Sciences
M.P.M., M.Aq.
Business Administration
Executive MBA
Communication
M.A., Ph.D.
Economics
M.A., Ph.D.
Education
M.A., M.Sc., M.Ed.
Engineering Science
M.Eng.
English
M.A.,Ph.D.
French
M.A.
Liberal Studies
M.A.
Mathematics and Statistics
M.Sc., Ph.D.
Political Science
M.A.
Resource and Environmental Management
M.R.M.
Spanish and Latin American Studies
M.A.
Special Arrangements
Masters, Ph.D.
Women's Studies
M.A.
.
.
S95ATFCI-1 DOC 01125/95
APPENDIX B
?
.
SIMON FRASER UNIVERSITY
MEMORANDUM
Report to Senate of the Activities of the Senate Graduate Studies
Committee from January 1994 to December 1994.
Number of Meetings - 5
1.
Proposed Programs for:
- Coursework/Examination MED Program in Arts Education
- Masters Program in Mathematics Education
- MA/PhD in Linguistics
- PHD in the School of Resource and Enviornmental Management
- Masters in Publishing
- MED in Counselling Psychology
- Chemistry Co-Op Option
- Arts Education Emphasis within the Curriculum Theory and
Implementation PhD
- Joint Masters in Teacher Education and Teacher Development
A
A
New Graduate Courses in Business, Mathematics and Education
Change in General Regulations:
- 1.6.4 Supervisory Committee
Prerequisite changes for courses in Education
Change in credit hours for Educ 874-3
Varied credit hours for Special Topics courses in Education
2.
3.
4.
5.
6.
7.
Graduate Curriculum Changes in the Schools of
.
Kinesiology and
Natural Resources, Management
S ?
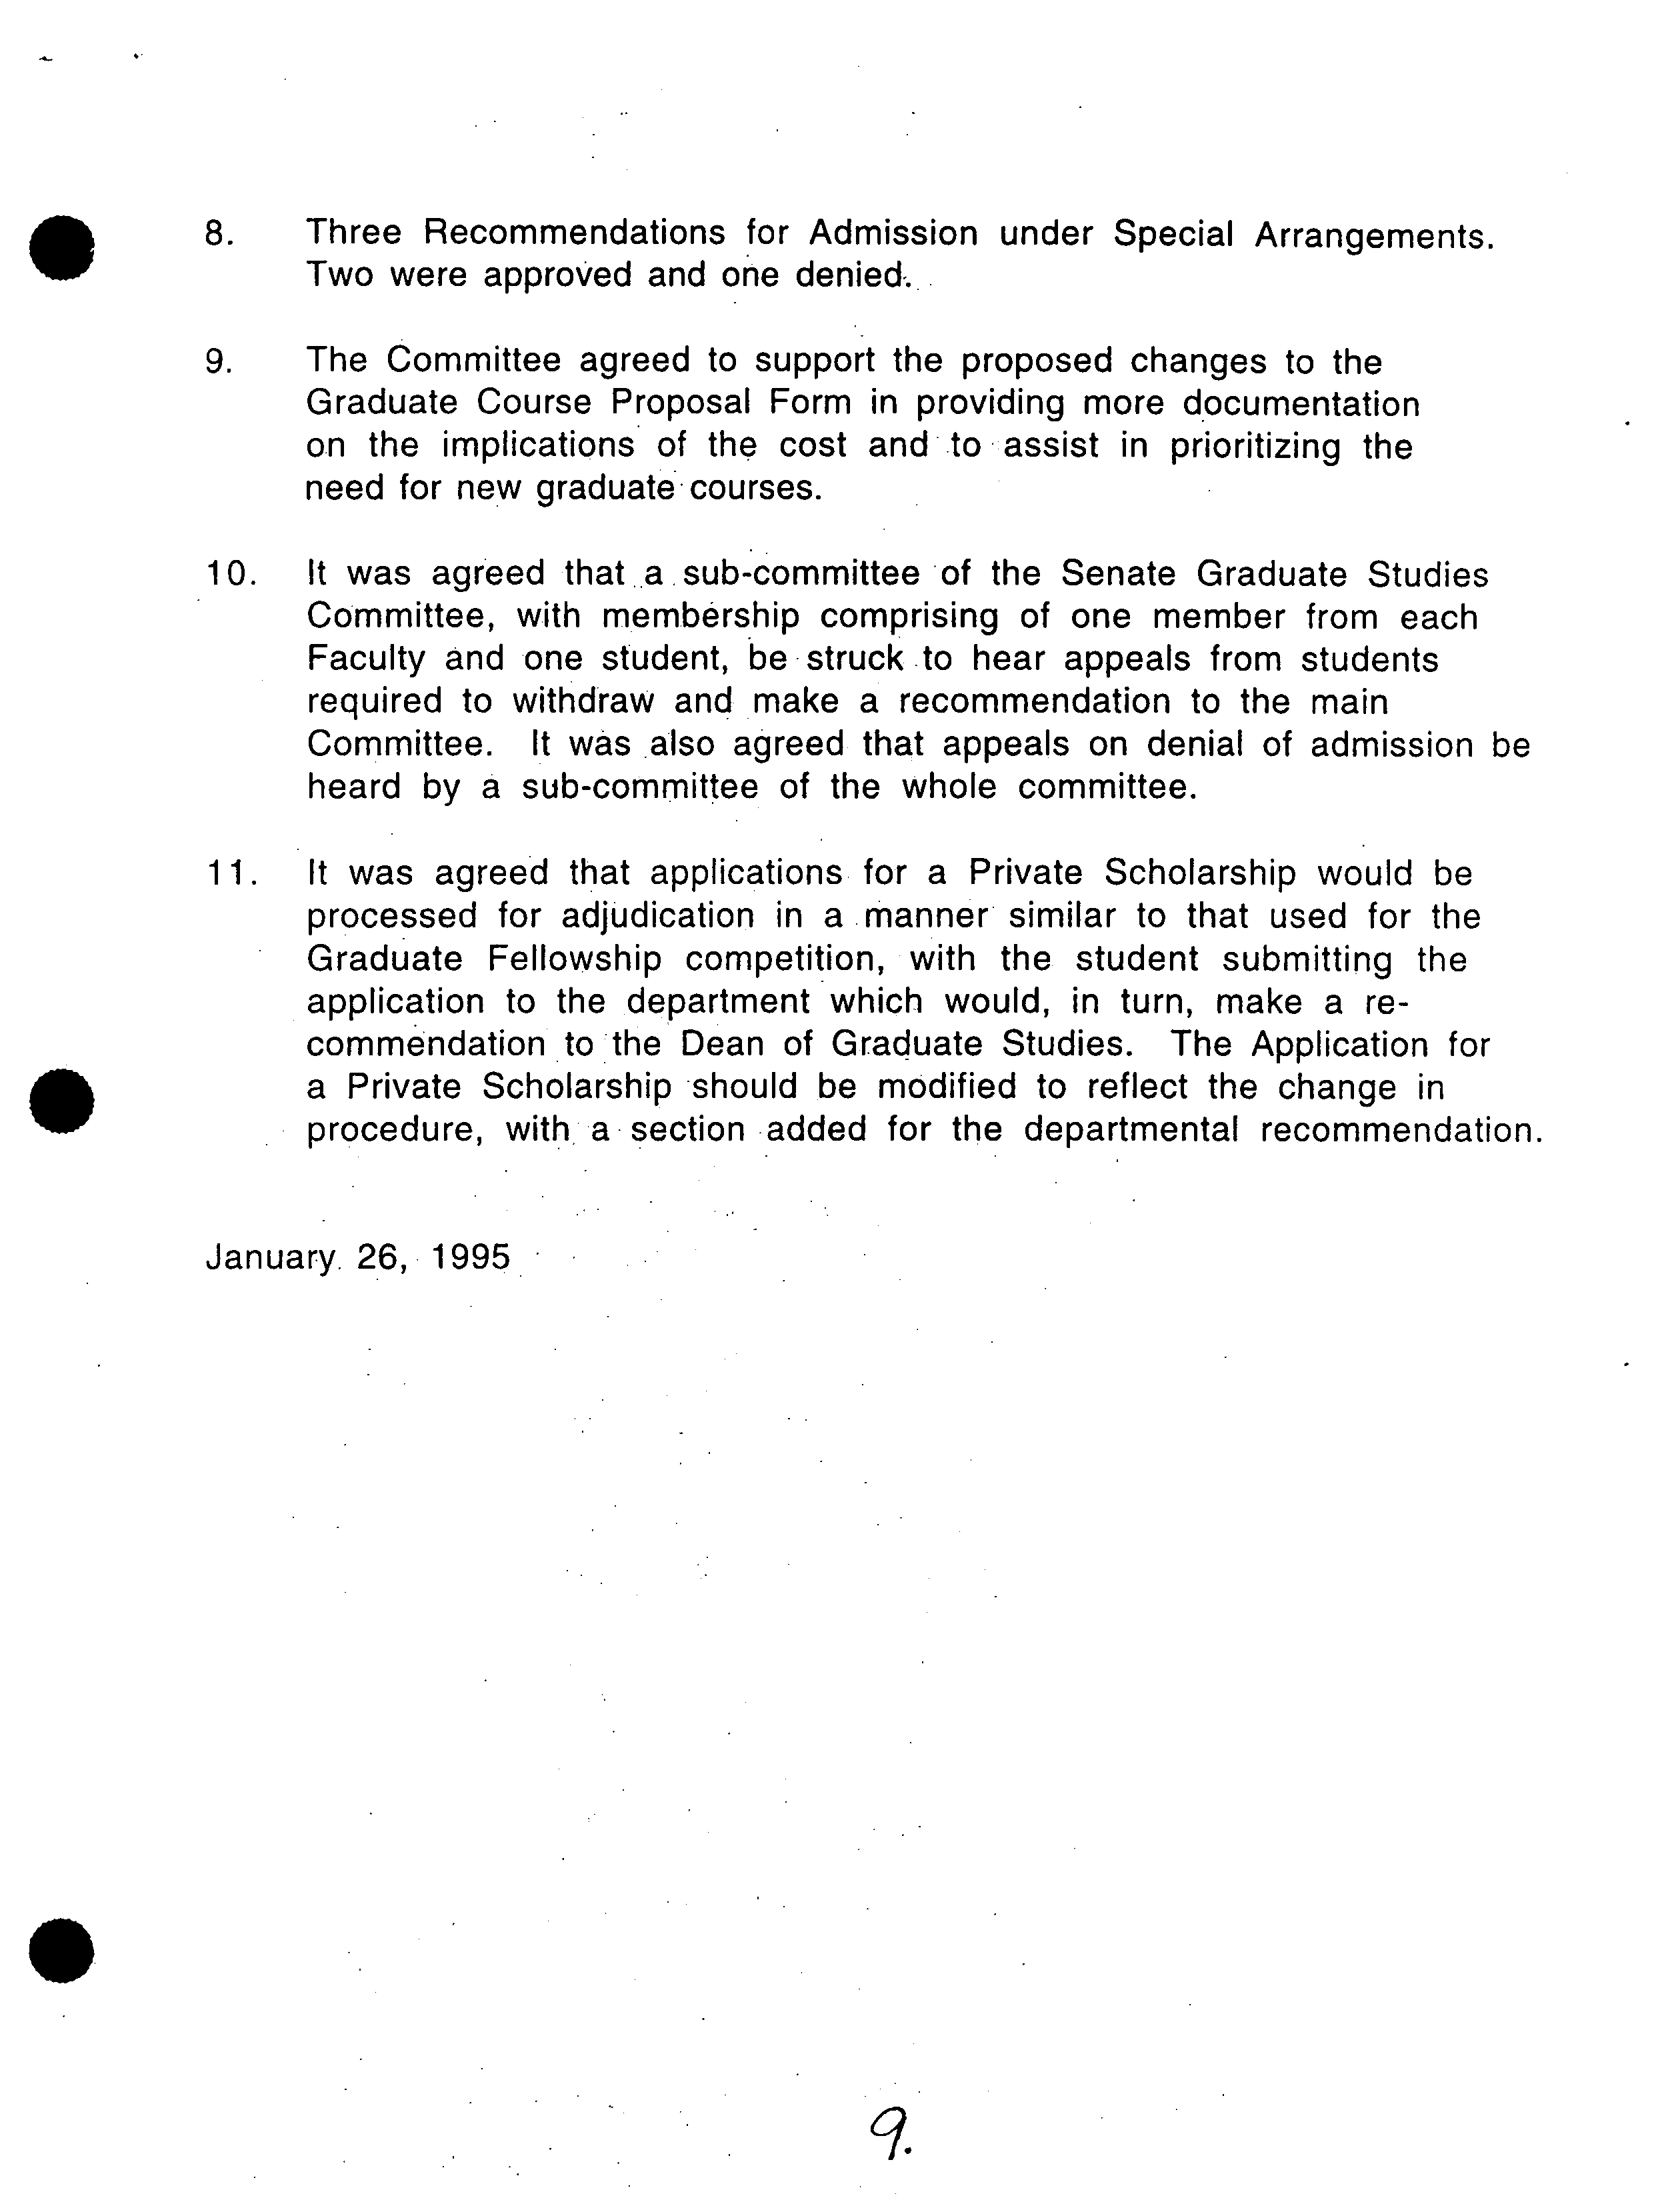
8.
?
Three Recommendations for Admission under Special Arrangements.
Two were approved and one denied-.
9.
The Committee agreed to support the proposed changes to the
Graduate Course Proposal Form in providing more documentation
on the implications of the cost and to assist in prioritizing the
need for new graduate* courses.
10.
It was agreed that
.
a sub-committee of the Senate Graduate Studies
Committee, with membership comprising of one member from each
Faculty and one student, be struck .to hear appeals from students
required to withdraw and make a recommendation to the main
Committee. It was also agreed that appeals on denial of admission be
heard by a sub-committee of the whole committee.
11.
It was agreed that applications for a Private Scholarship would be
processed for adjudication in a manner similar to that used for the
Graduate Fellowship competition, with the student submitting the
application to the department which would, in turn, make a re-
commendation to the Dean of Graduate Studies. The Application for
S
??
a Private Scholarship should be modified to reflect the change in
procedure, with
.
a section added for the departmental recommendation.
January. 26, 1995
0
11
SIMON FRASER UNIVERSITY
Graduate Studies Fact Book
January 1995
Office of the Dean of Graduate Studies
Simon Fraser University
Burnaby, British Columbia
V5A 1S6
.
Simon Fraser University
Graduate Studies Fact Book
The Graduate Studies Fact Book provides a snap-shot of the Fall
Semester student population, as well as retrospective data on
program completion. The information is derived from enrolment
data provided by the Office of the Registrar, supplemented by
information gathered and processed in this office. It is
largely complementary to the S.F.U. Fact Book prepared by the
Office of Analytical Studies. Minor differences in enrolment
figures exist between the two publications due to differences
• in data collection intervals. For the same reason, the data should
not be used for inter-year comparisons. Note also that the program
in Languages and Linguistics was separated into the Departments
of French and Linguistics in 1994.
Each section is headed by a graphical summary. In some cases,
the summaries omit programs where the numbers reported are too
small to be significant; the tabular data are complete.
It is hoped that this Fact Book will be a useful source of
information for the campus community. This office can provide
additional more specialized reports, if these are required.
Bruce P. Clayman
Dean of Graduate Studies
• ?
Room A06046
Phone: (604) 291- 4255
• ?
Fax: (604) 291- 3080
Internet: sfu-dgs@sfu.ca
.
Simon Fraser University
Graduate Studies Fact Book
Contents
Enrolment
?
3
•
?
Grades
?
11
Citizenship
?
15
Age
?
21
Degree Completion Time
?
26
Degree Completion by Cohorts
?
31
Withdrawal Data
?
43
S.F.U. Financial Awards
?
48
a
Contents.drw ?
2
Simon Fraser University
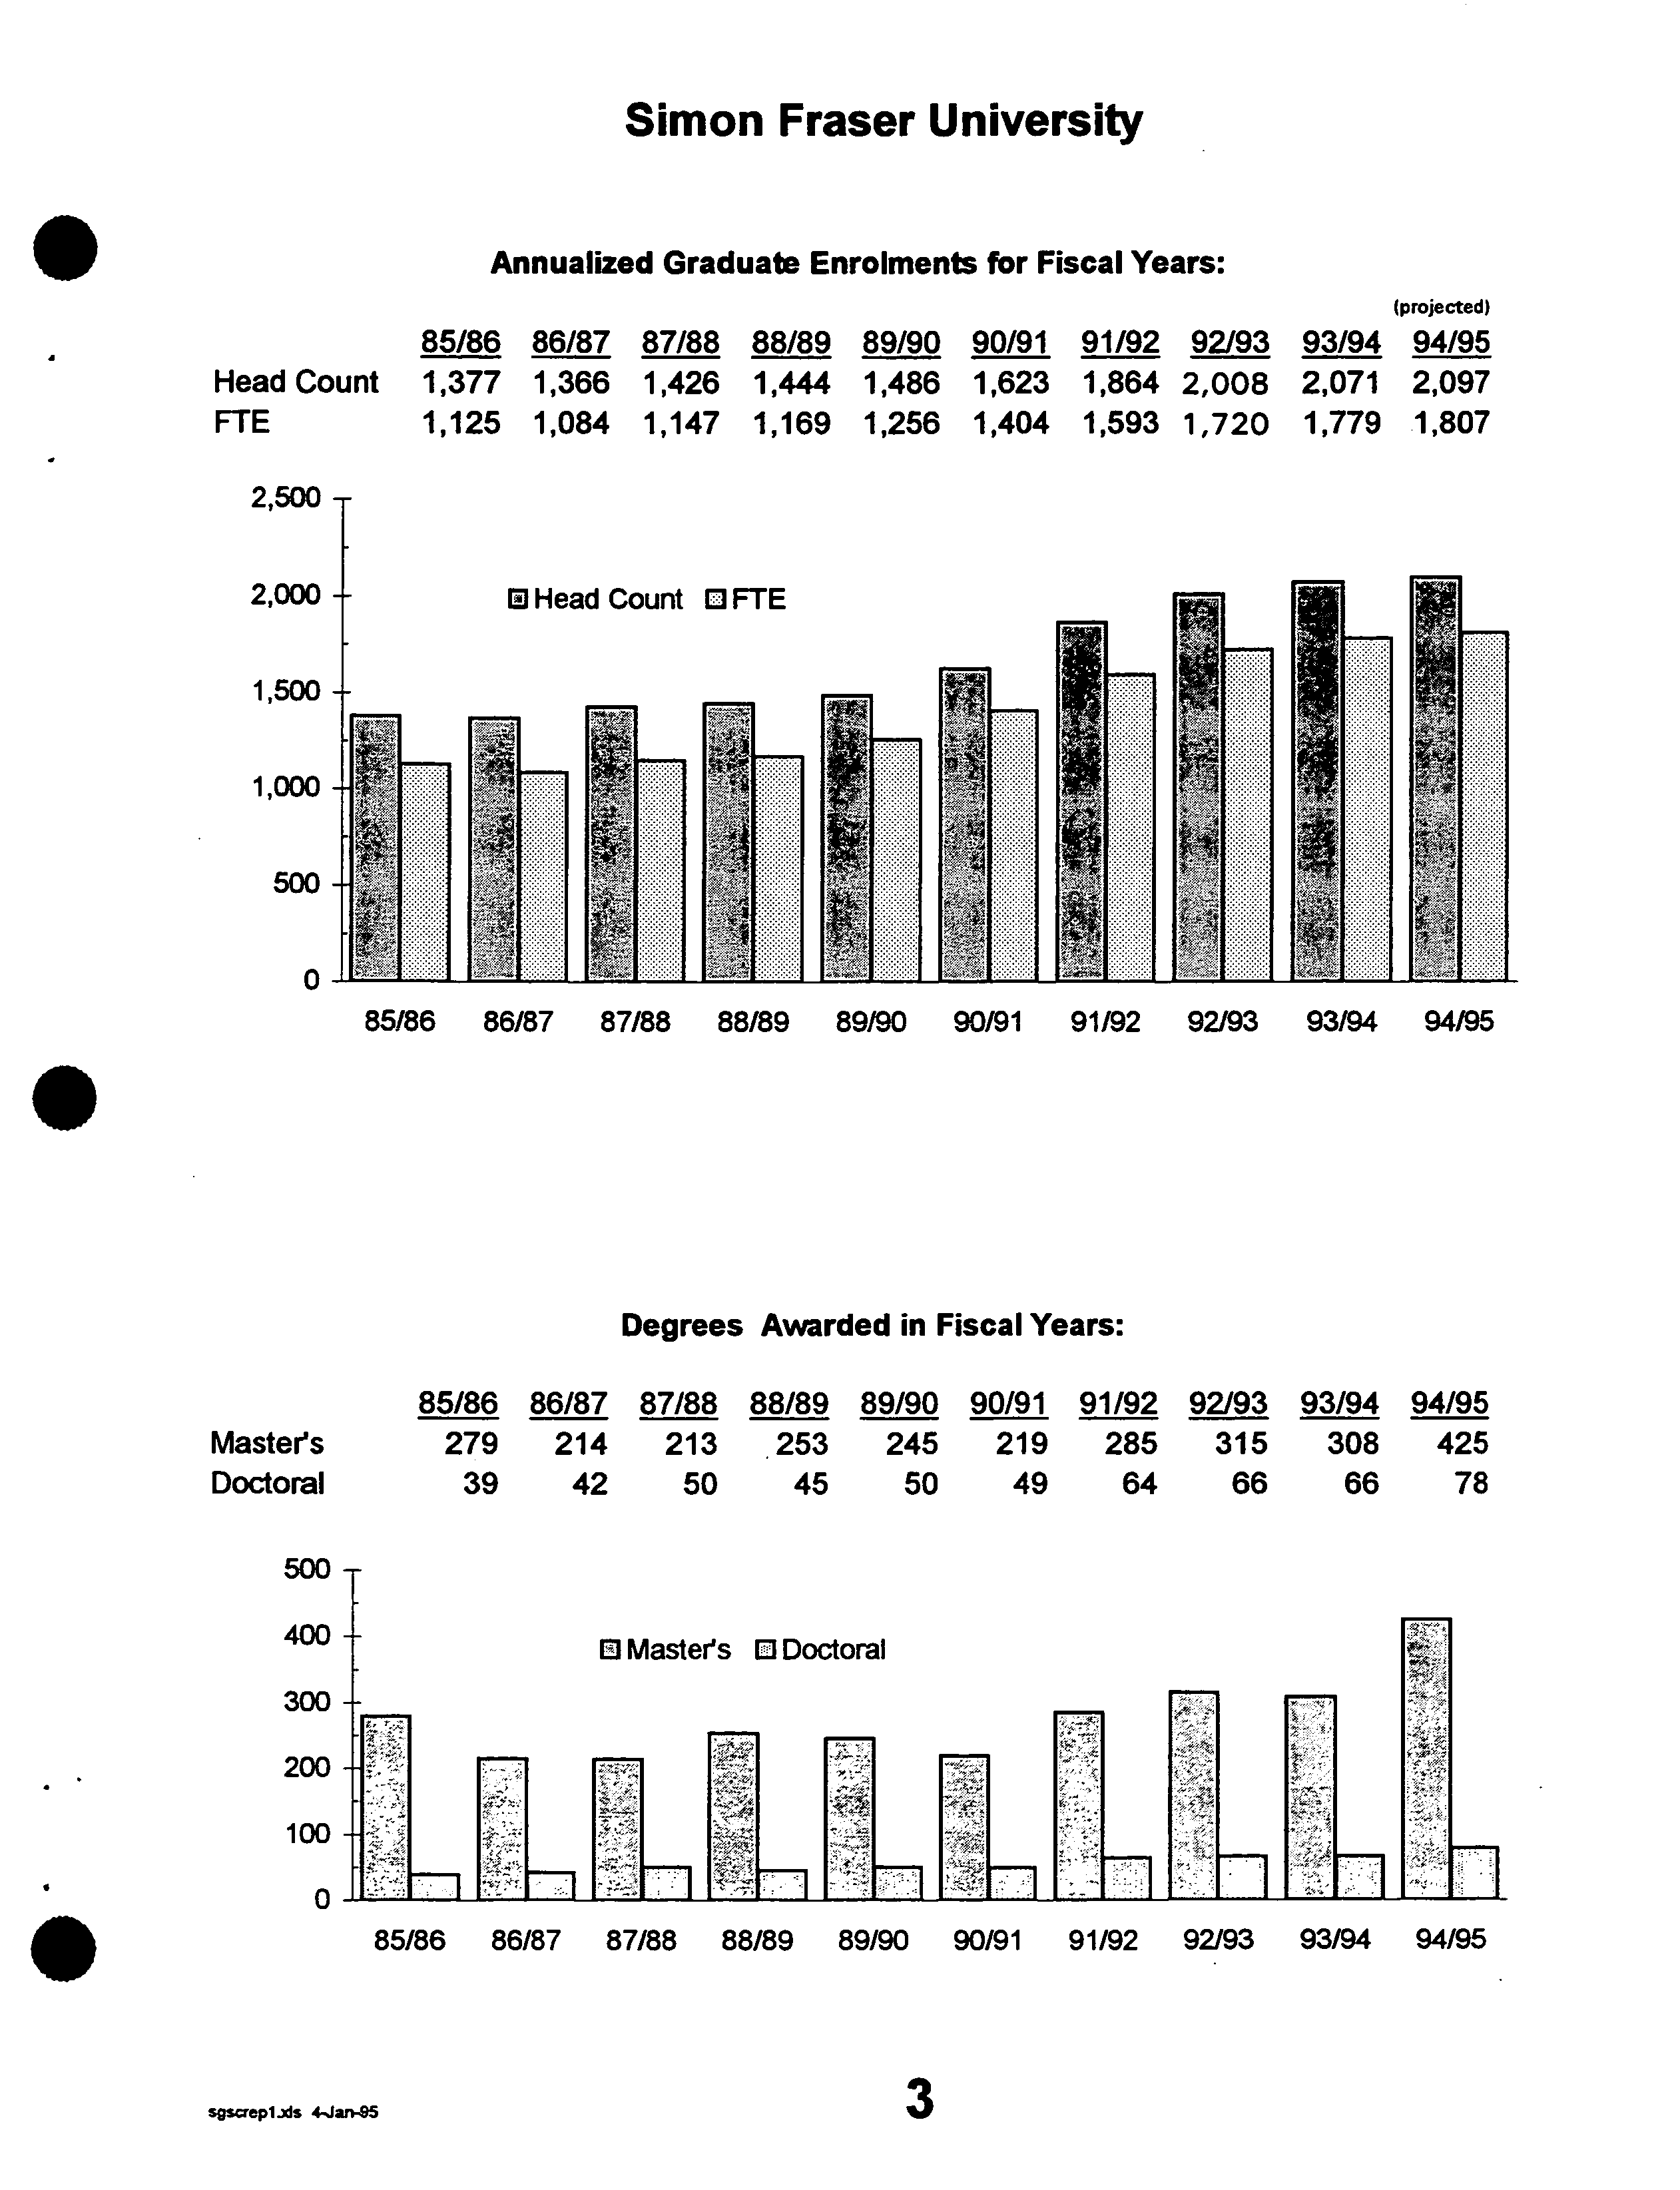
Annualized Graduate Enrolments for Fiscal Years:
(projected)
85/86 86/87 87/88 88/89 89/90 90/91 91/92 92/93 93/94 94/95
Head Count
1,377 1,366 1,426 1,444 1,486 1,623 1,864 2,008 2,071 2,097
FTE ?
1,125 1,084 1,147 1,169 1,256 1,404 1,593 1,720 1,779 1,807
2,500 ?
2,000 ?
1,500 ?
1,000 ?
500 ?
0
85/86 86/87 87/88 88/89 89/90 90/91 91/92 92/93 93/94 94/95
.
Degrees
Awarded
in
Fiscal Years:
85/86 ?
86/87 ?
87/88 88/89 ?
89/90 ?
90191 ?
91/92 ?
92/93 ?
93/94 ?
94/95
Master's ?
279 ?
214 ?
213 253 ?
245 ?
219 ?
285 ?
315 ?
308 ?
425
Doctoral ?
39 ?
42 ?
50 45 ?
50 ?
49 ?
64 ?
66 ?
66 ?
78
85/86 86/87 87/88 88/89
89/90
90/91 91/92 92/93 93/94
94/95
500
400
300
200
100
0
sgscrep1.s 4.Jan-95
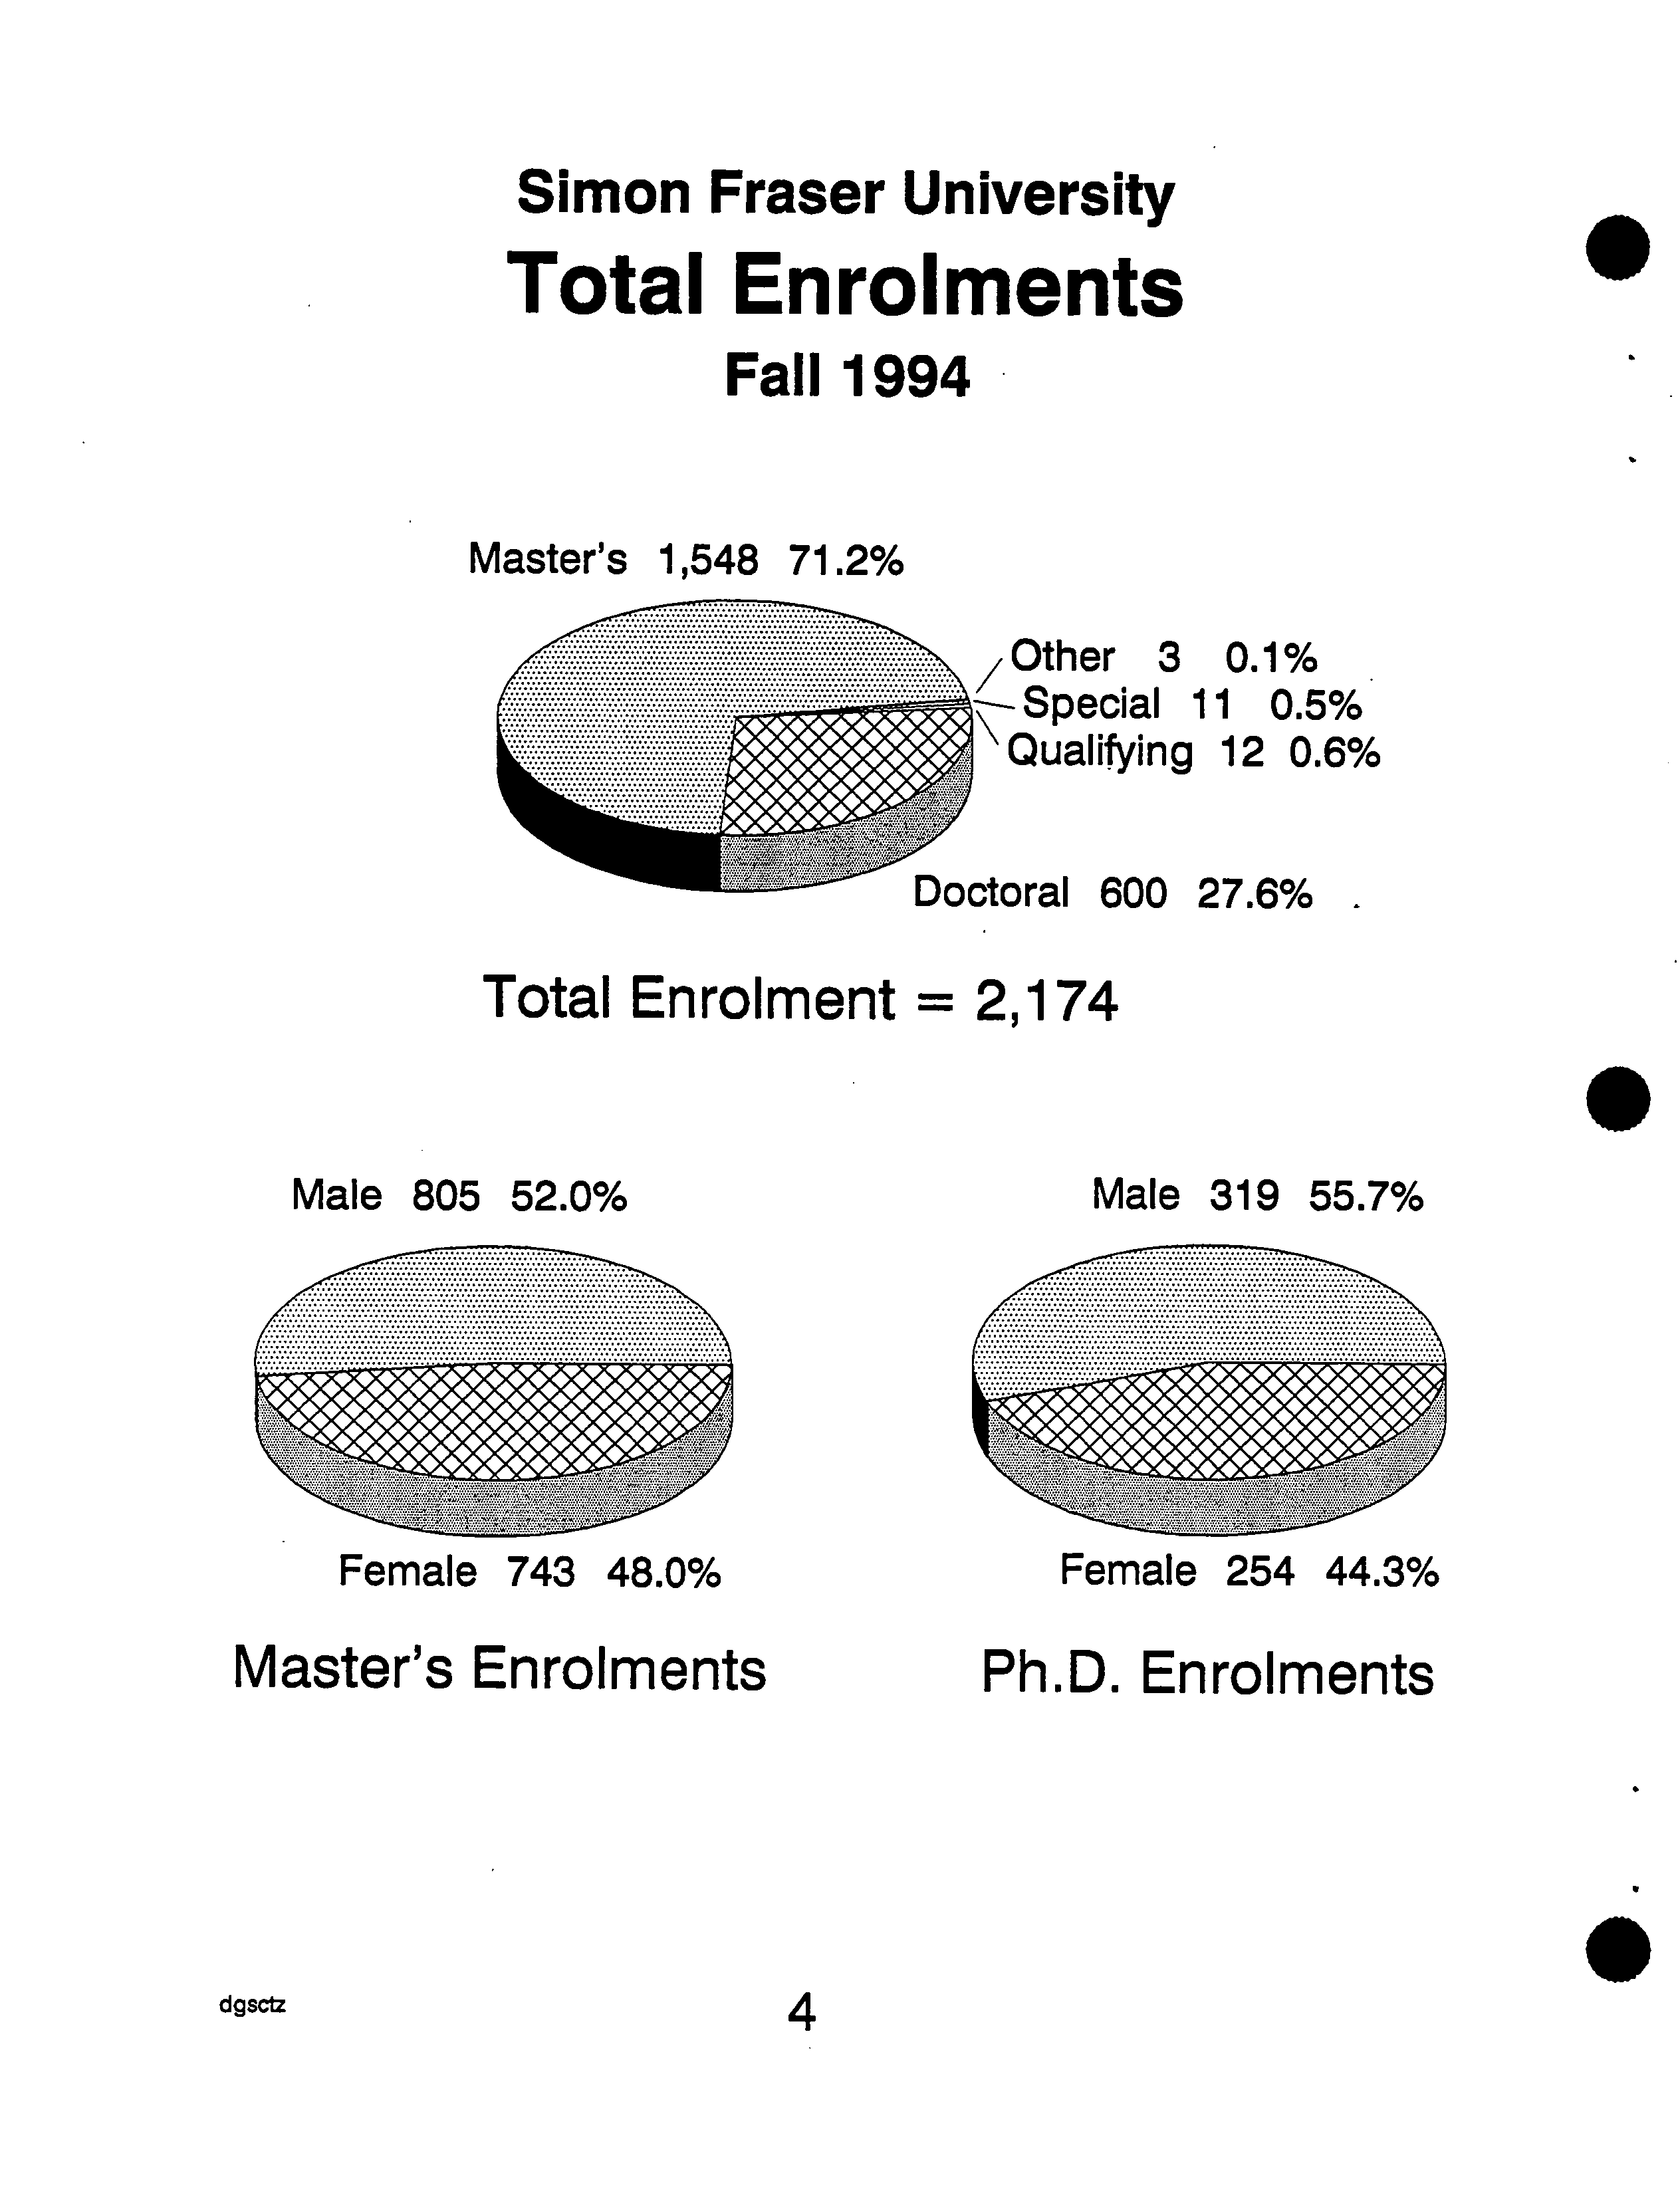
Other 3 0.1%
Special 11 0.5%
uaIi
f
ying
12 0.6%
JLLJraI 600 27.6%
Male 805 52.0%
Female 743 48.0%
Male 319 55.7%
Female 254 44.3%
Simon Fraser University
Total Enrolments
Fall 1994
Master's 1,548 71.2%
.
Total Enrolment = 21174
.
Master's Enrolments
?
Ph.D. Enrolments
a
dgsc ?
4
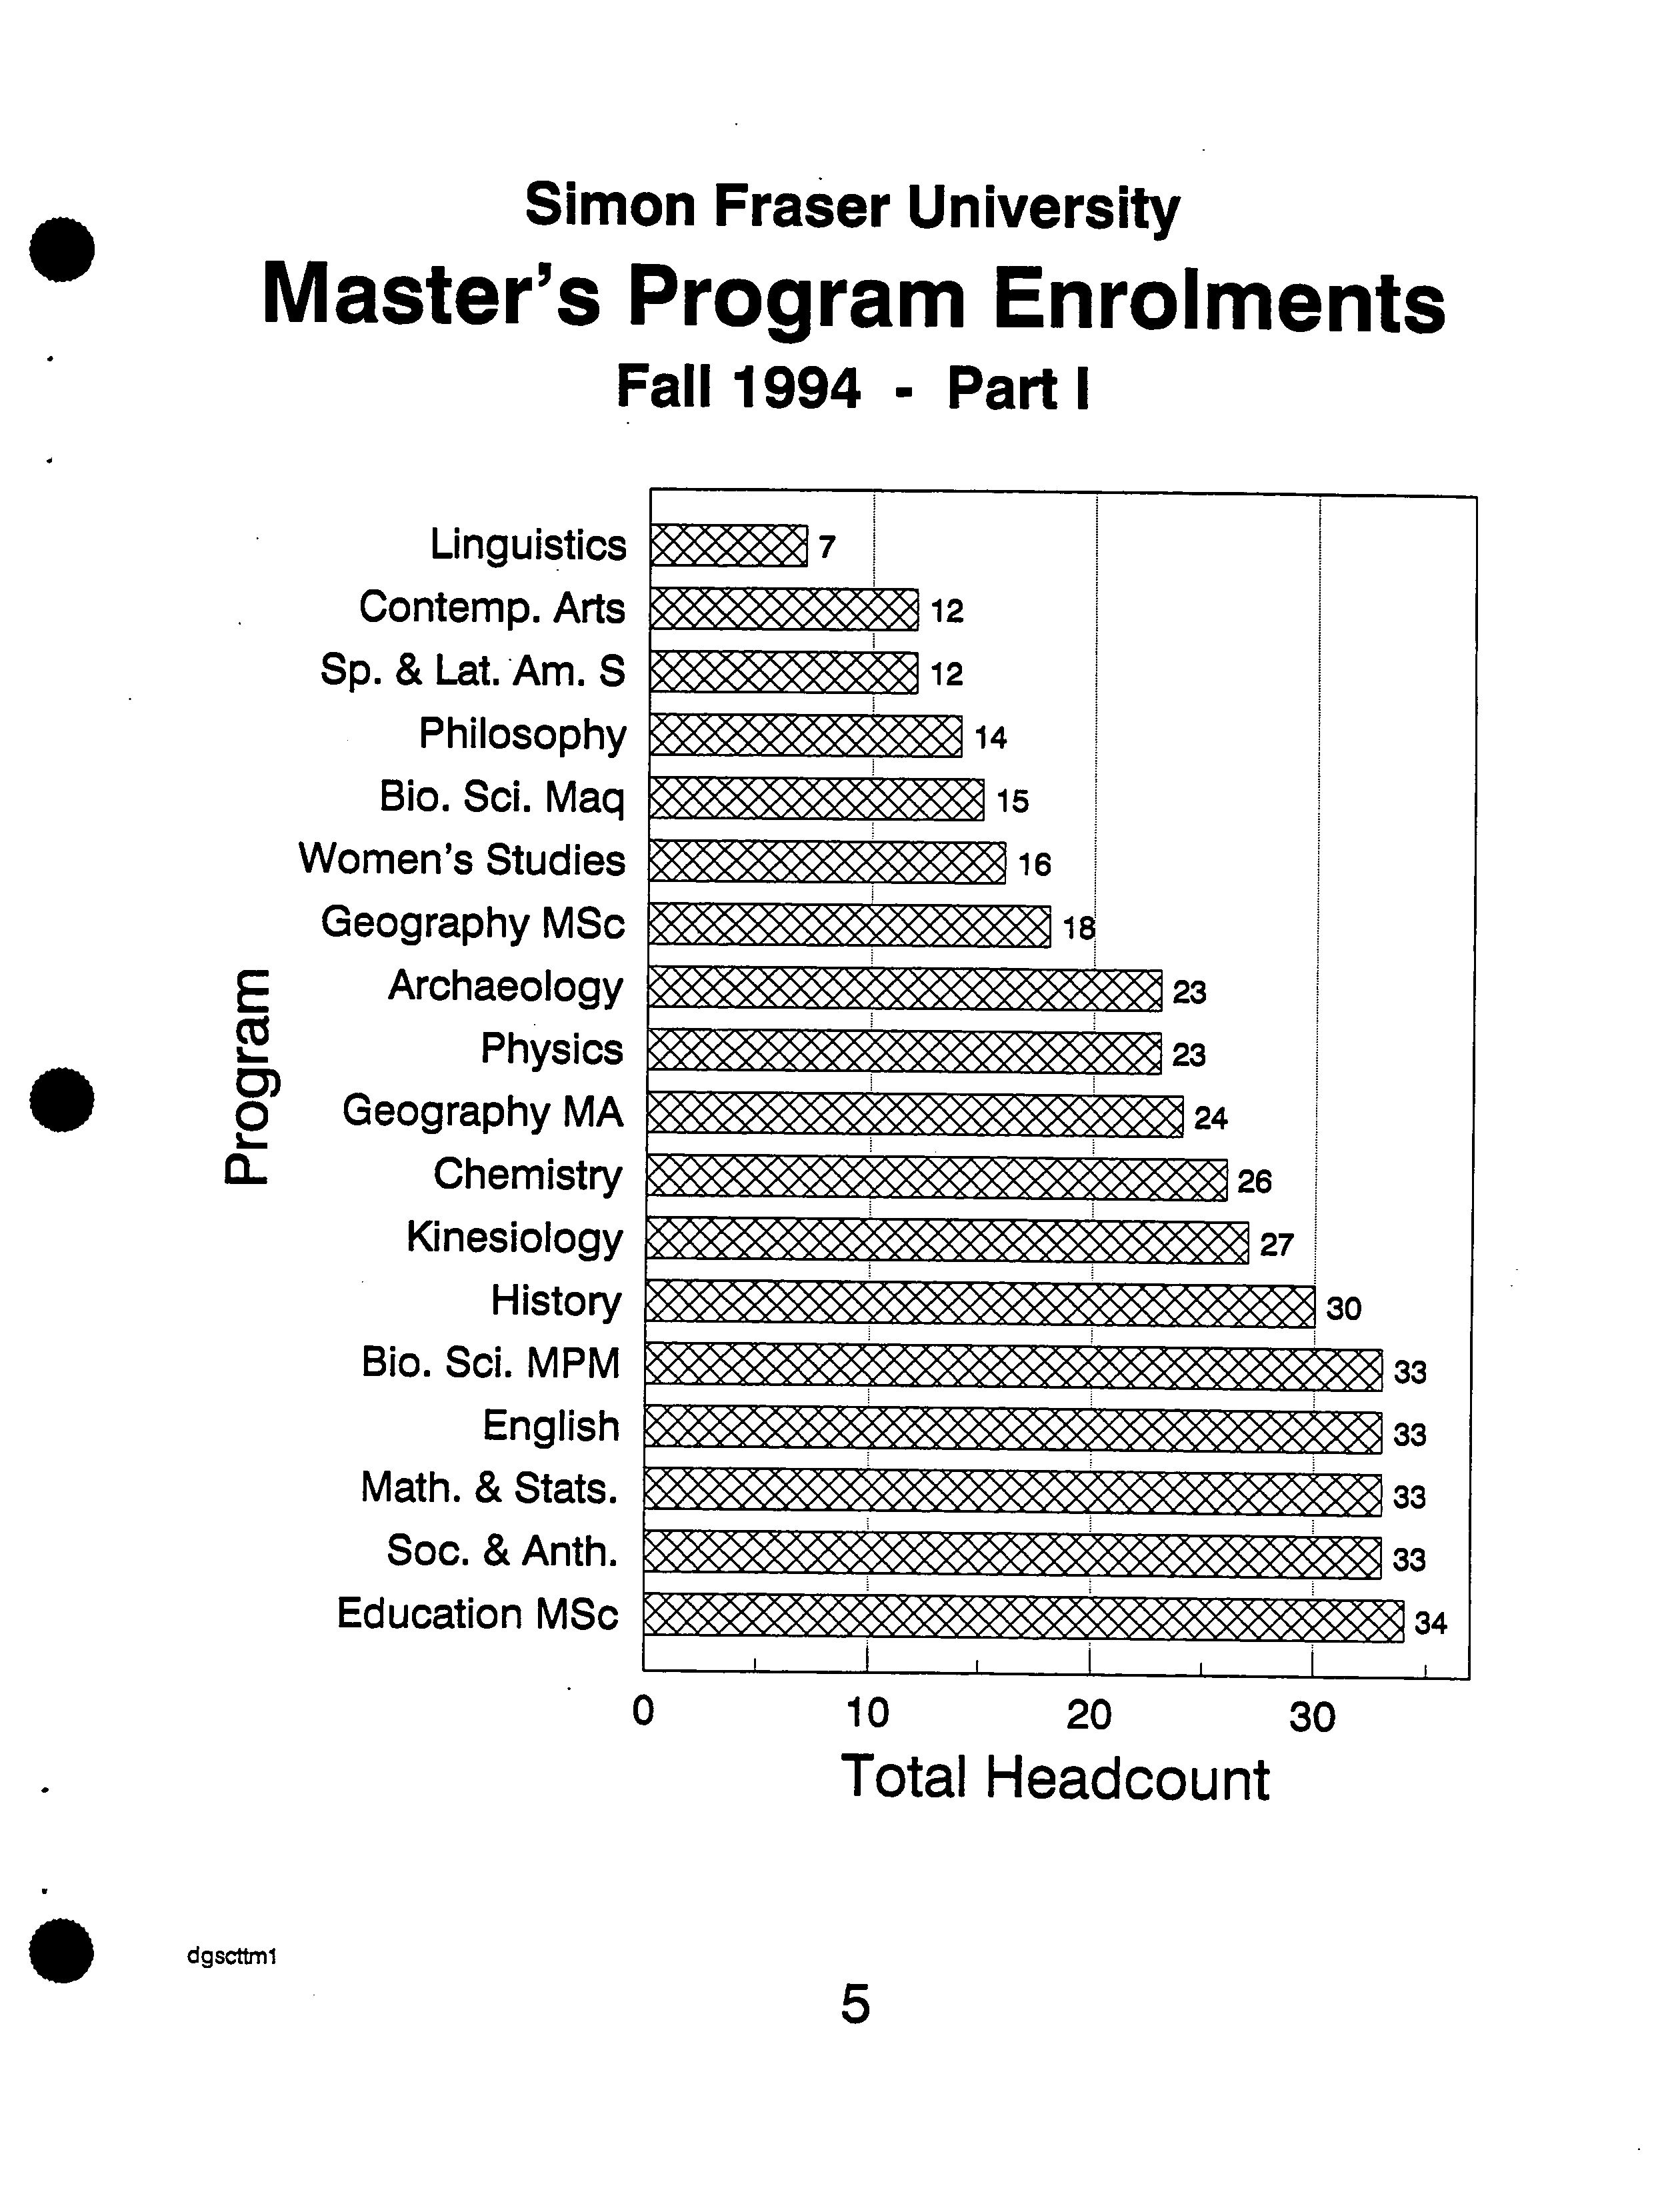
33
33
33
33
34
Simon Fraser University
Master's Program Enrolments
Fall 1994 - Part
cz
E
. C)
0-
2
Linguistics
Contemp. Arts
Sp. & Lat. Am. S
Philosophy
Bio. Sci. Maq
Women's Studies
Geography MSc
Archaeology
Physics
Geography MA
Chemistry
Kinesiology
History
Bio. Sci. MPM
English
Math. & Stats.
Soc. & Anth.
Education MSc
0 ?
10 ?
20
?
30
Total Headcount
dgscttml
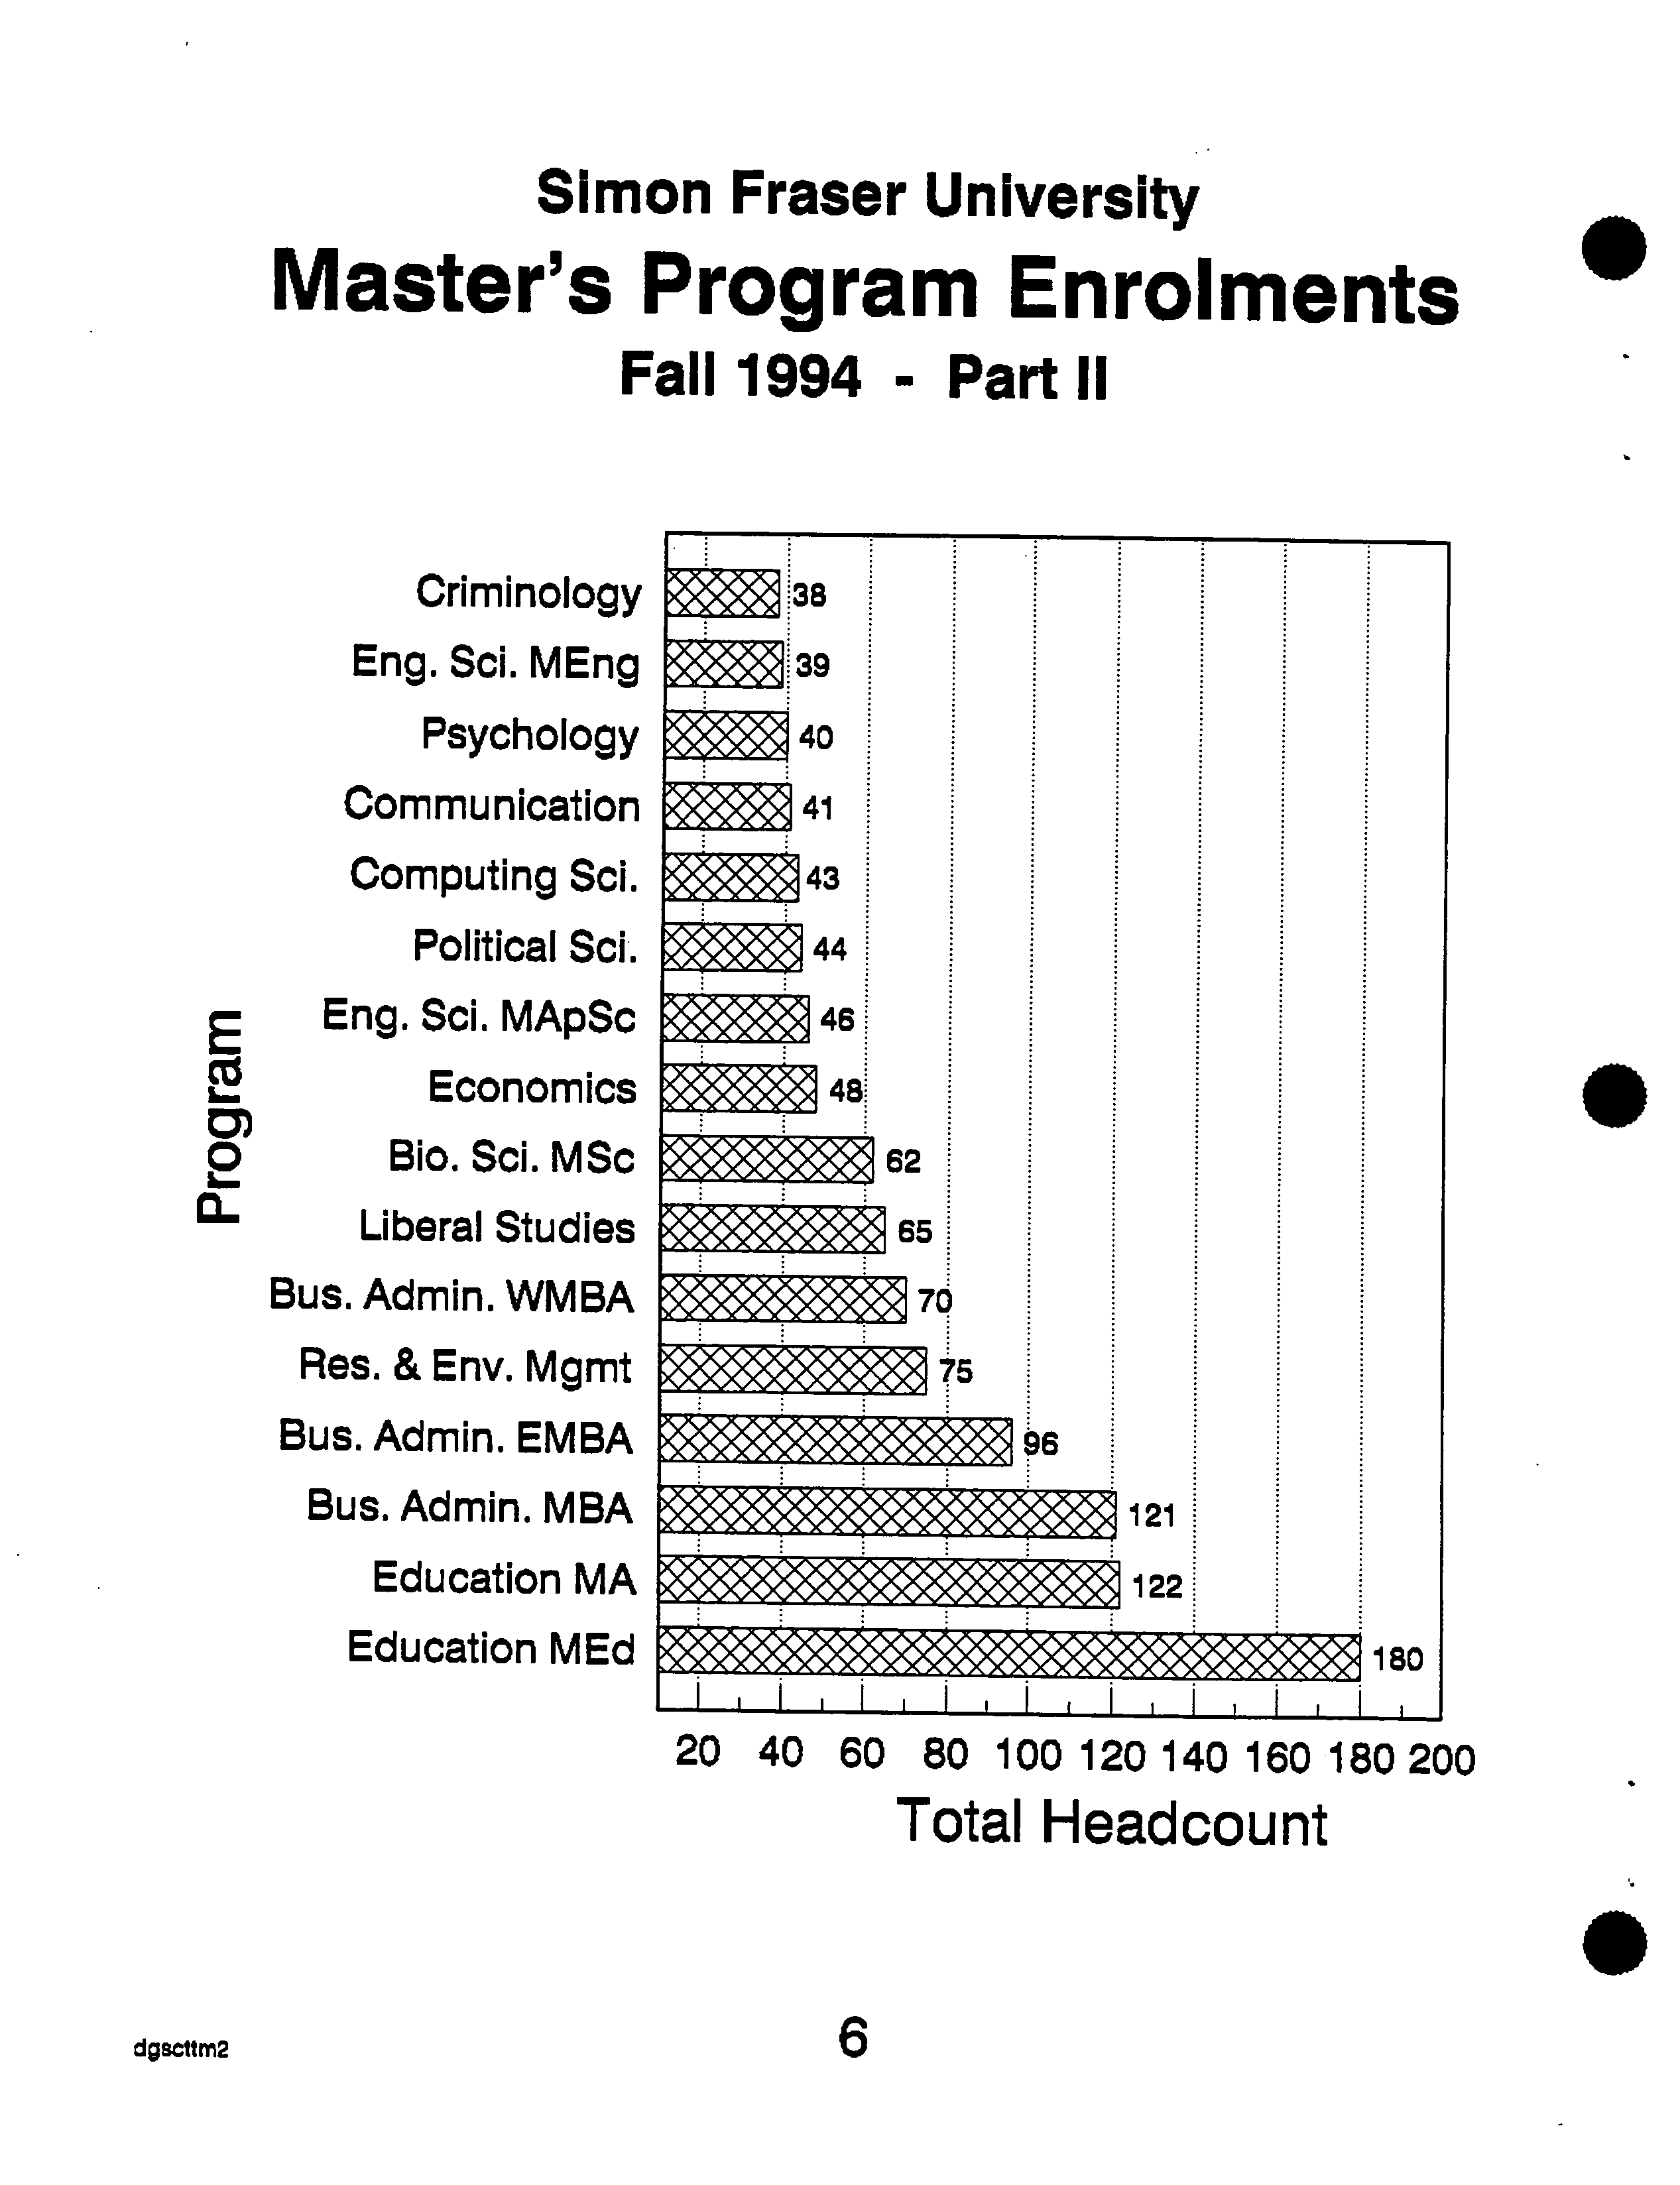
Simon Fraser University
Master's Program Enrolments
Fail 1994 - Part 11
Criminology
Eng. Sd. MEng
Psychology
Communication
Computing Sd.
Political Sci.
E ?
Eng. Sci. MApSc
Economics
tm
Bio.Sci.MSc
Liberal Studies
Bus. Admin. WMBA
Res. & Env. Mgmt
Bus. Admin. EMBA
Bus. Admin. MBA
Education MA
Education MEd
20 40 60 80 100 120 140 160 180 200
Total Headcount
.
a
dgscttm2
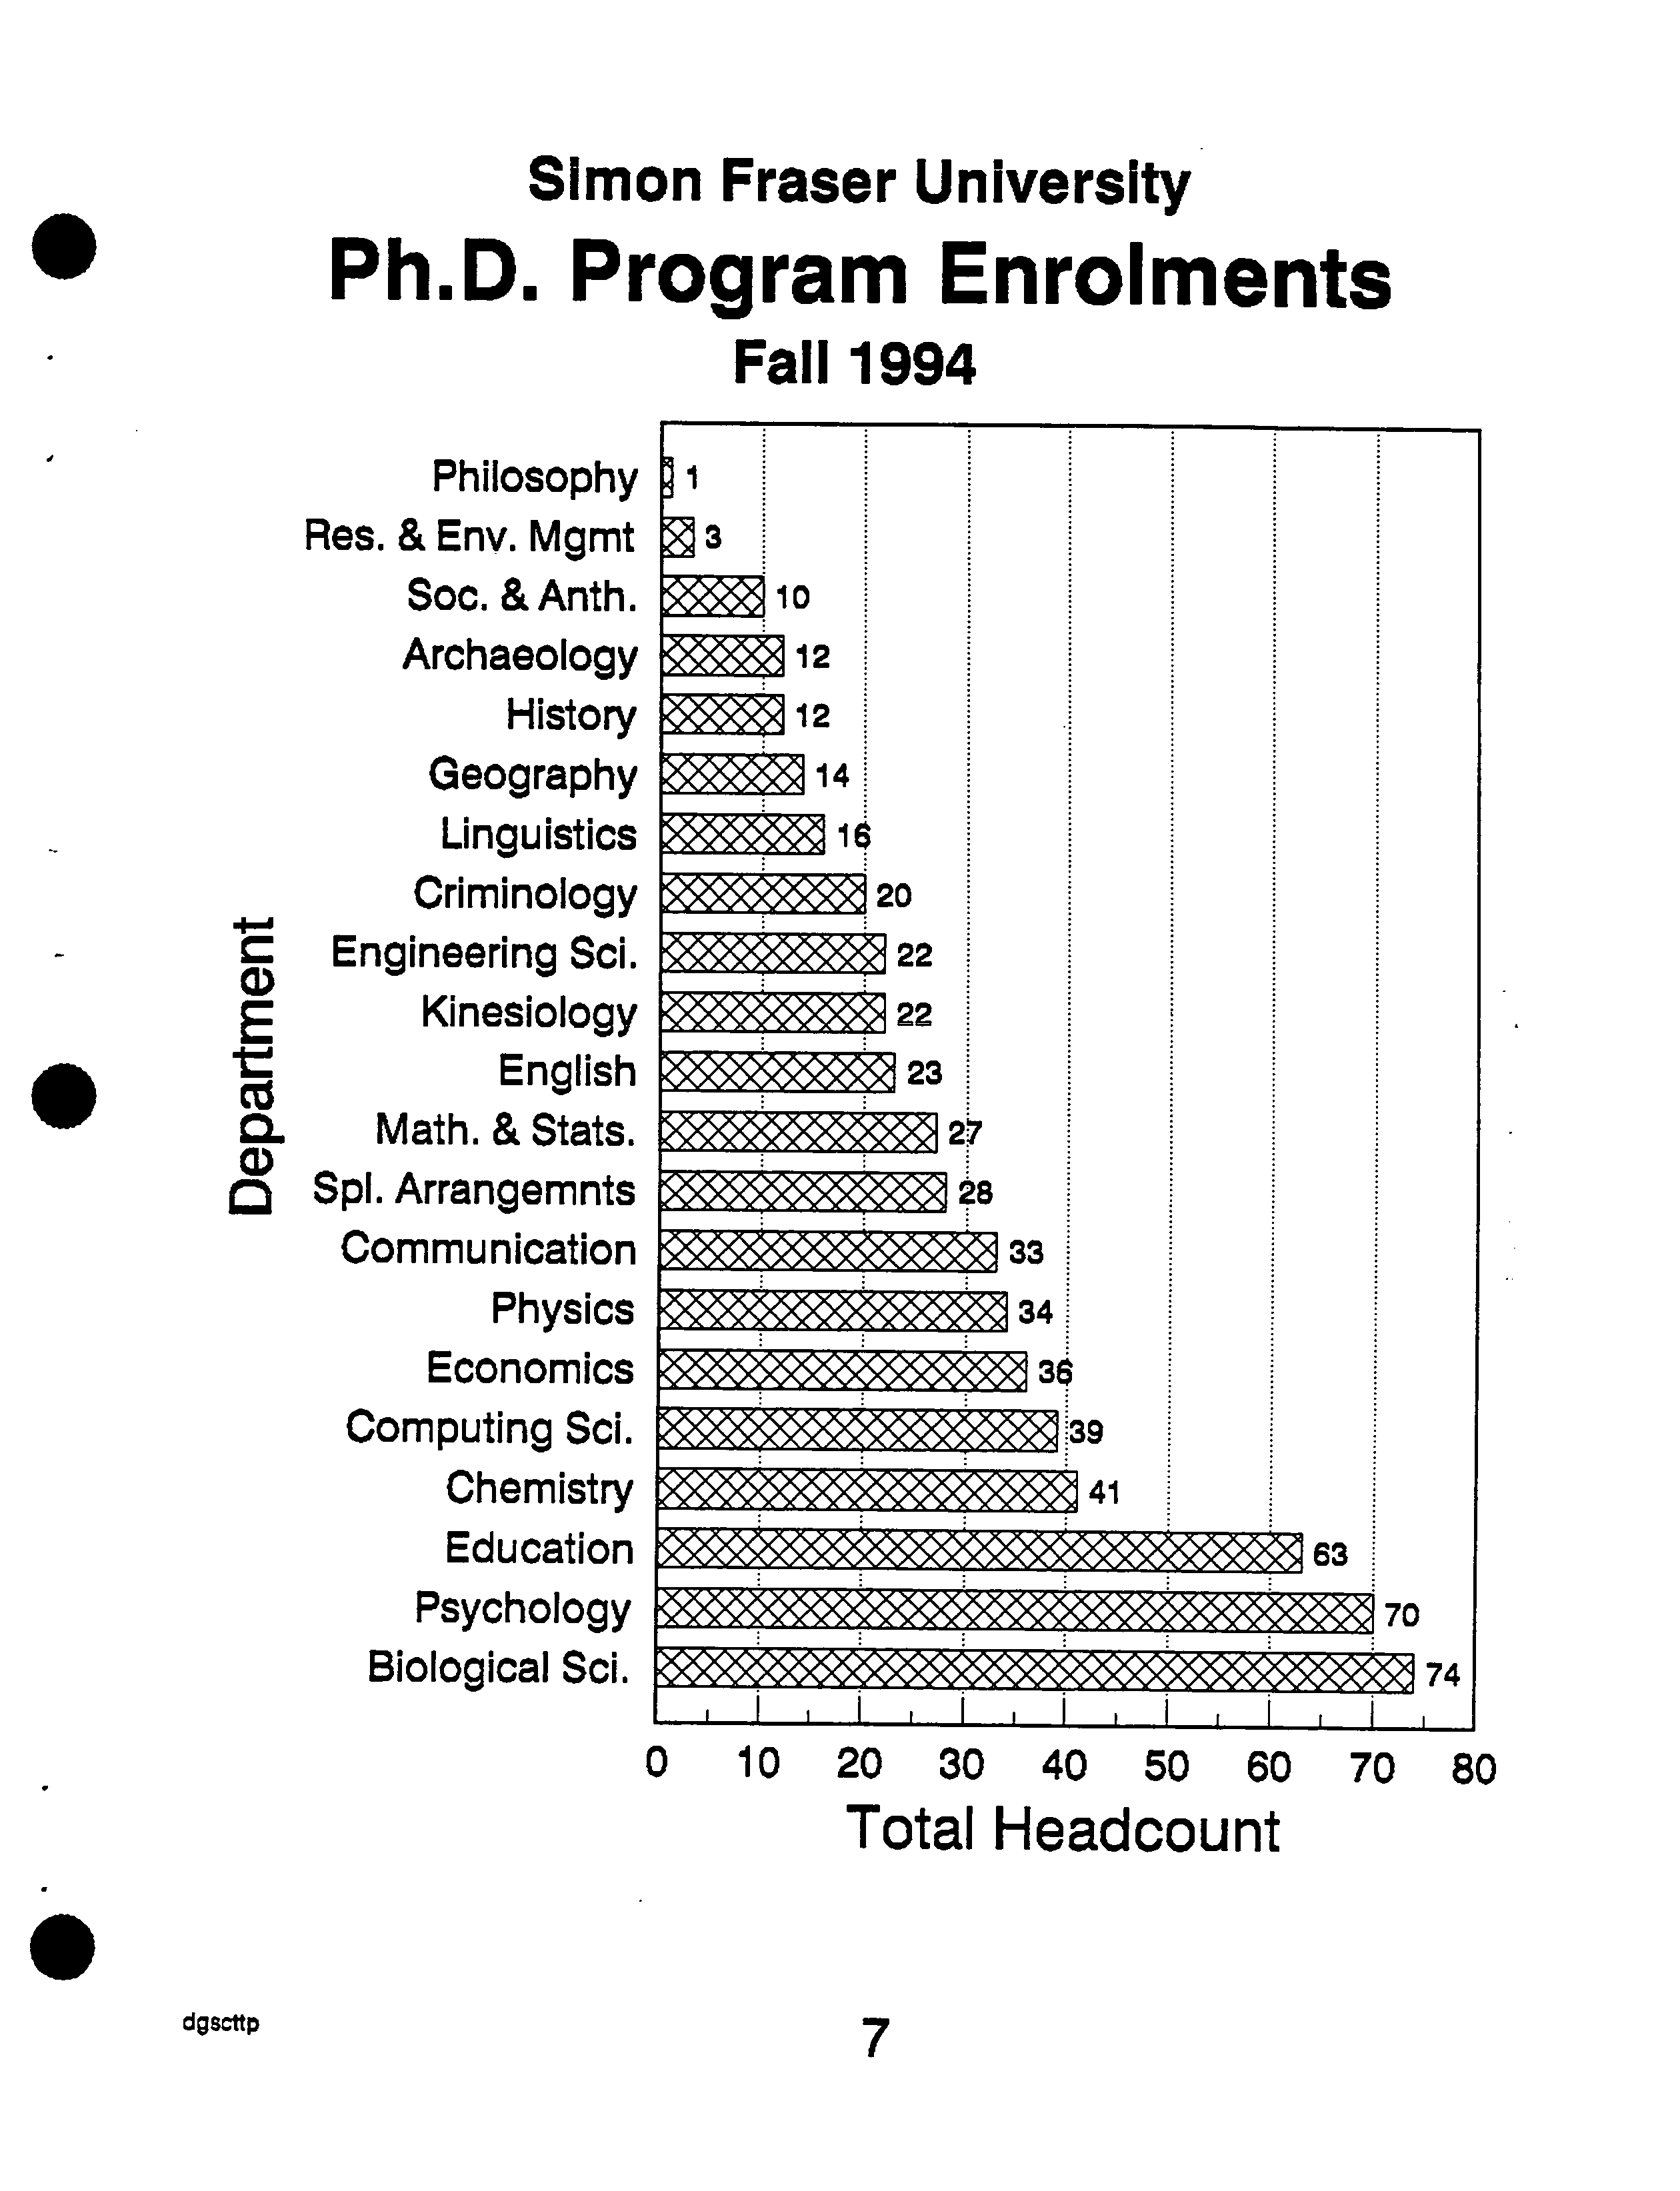
Philosophy
Res. & Env. Mgmt
Soc. &Anth.
Archaeology
History
Geography
Linguistics
Criminology
Engineering Sci.
E
Kinesiology
octs
English
CL
Math. & Stats.
SpI. Arrangemnts
Communication
Physics
Economics
Computing Sci.
Chemistry
Education
Psychology
Biological Sd.
p
S
INNIN
11
Simon Fraser University
O ?
Ph.D. Program Enrolments
•
?
Fall 1994
o io
20 30 40 50 60 70 80
Total Headcount
a
dgscttp ?
7
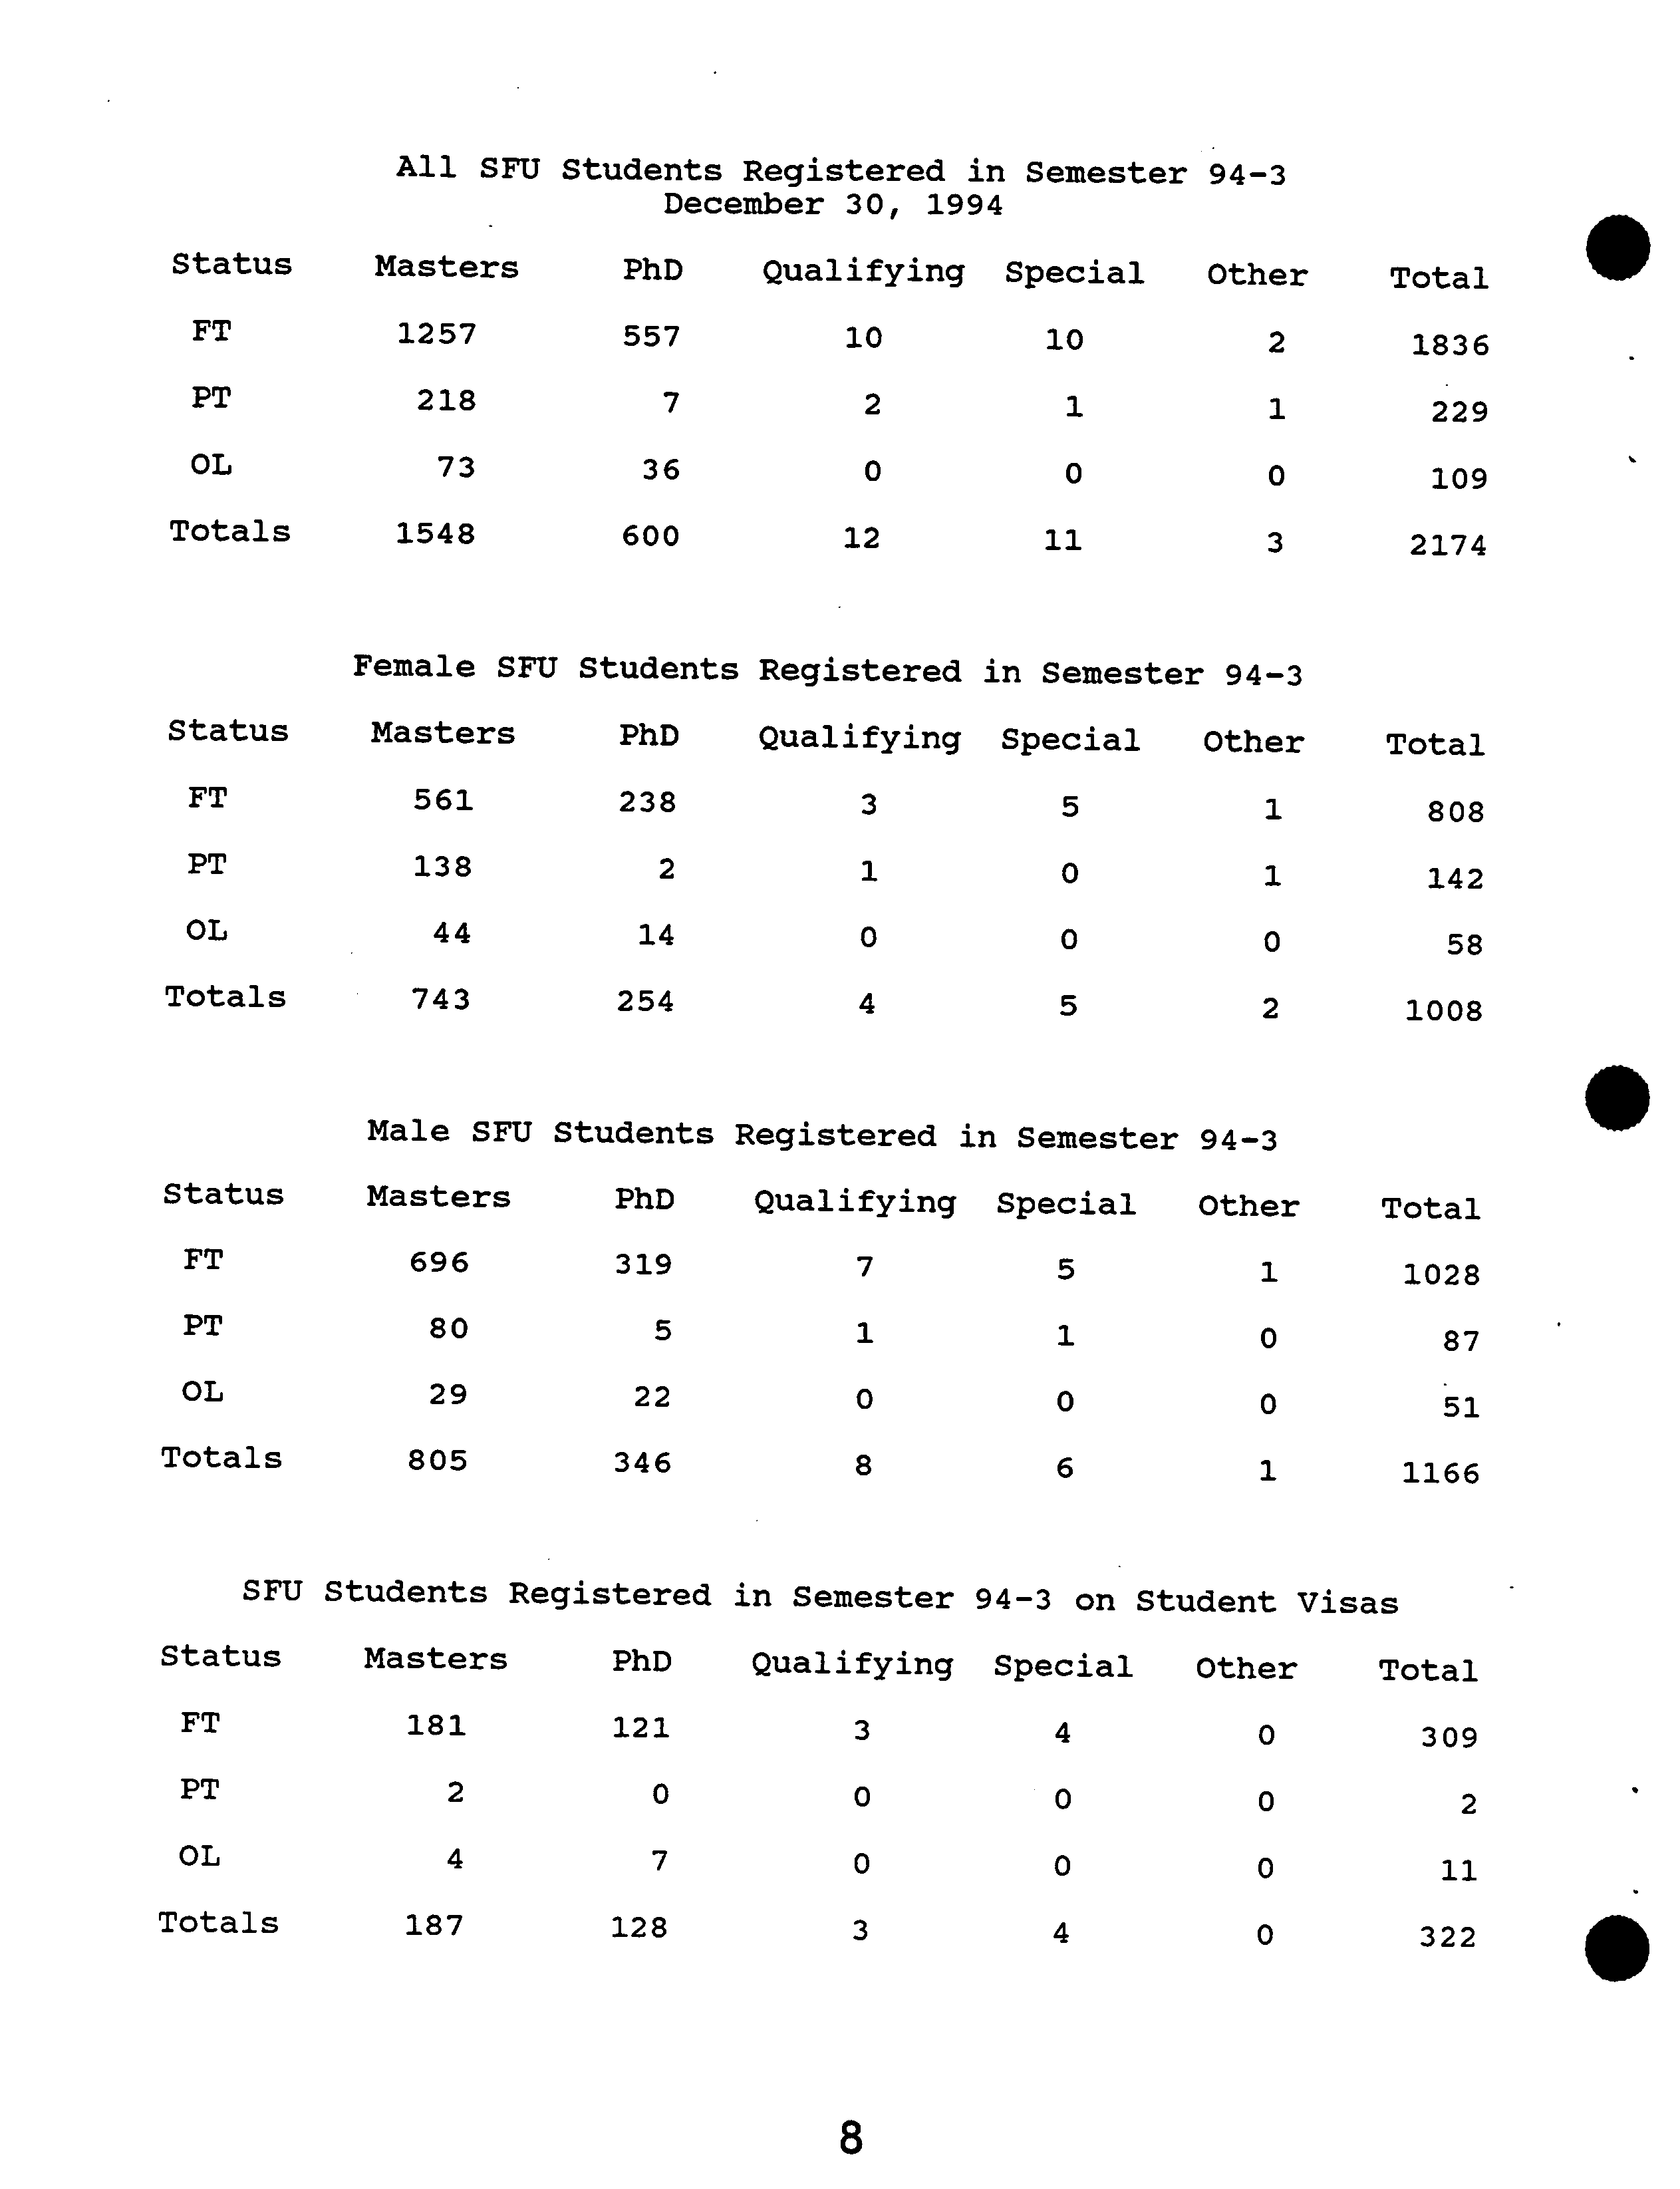
All SFTJ
Students
Registered in
Semester
94-3
December 30, 1994
Status
Masters
PhD
Qualifying
Special
Other
FT
1257
557
10
10
2
PT
218
7
2
1
OL
73
36
0
0
0
Totals
1548
600
12
11
3
Total
I
1836
229
109
2174
Status
Masters
PhD
Qualifying
Special
Other
FT
561
238
3
5
1
PT
138
2
1
0
1
OL
44
14
0
0
0
Totals
743
254
4
5
2
Male SF11
Students
Registered in Semester
94-3
Status
Masters
PhD
Qualifying
Special
Other
FT
696
319
7
5
1
PT
80
5
1
1
0
OL
29
22
0
0
0
Totals
805
346
8
6
1
Total ?
808 ?
142 ?
58 ?
1008
I
Total
?
1028 ?
87 ?
5]. ?
1166
Female SF11 Students Registered in Semester 94-3
SF11 Students Registered in Semester 94-3 on Student Visas
Status
Masters
PhD
Qualifying
Special
Other
Total
FT
181
121
3
4
0
309
PT
2
0
0
0
0
2
OL
4
7
0
0
0
11
Totals
187
128
3
4
0
322
I
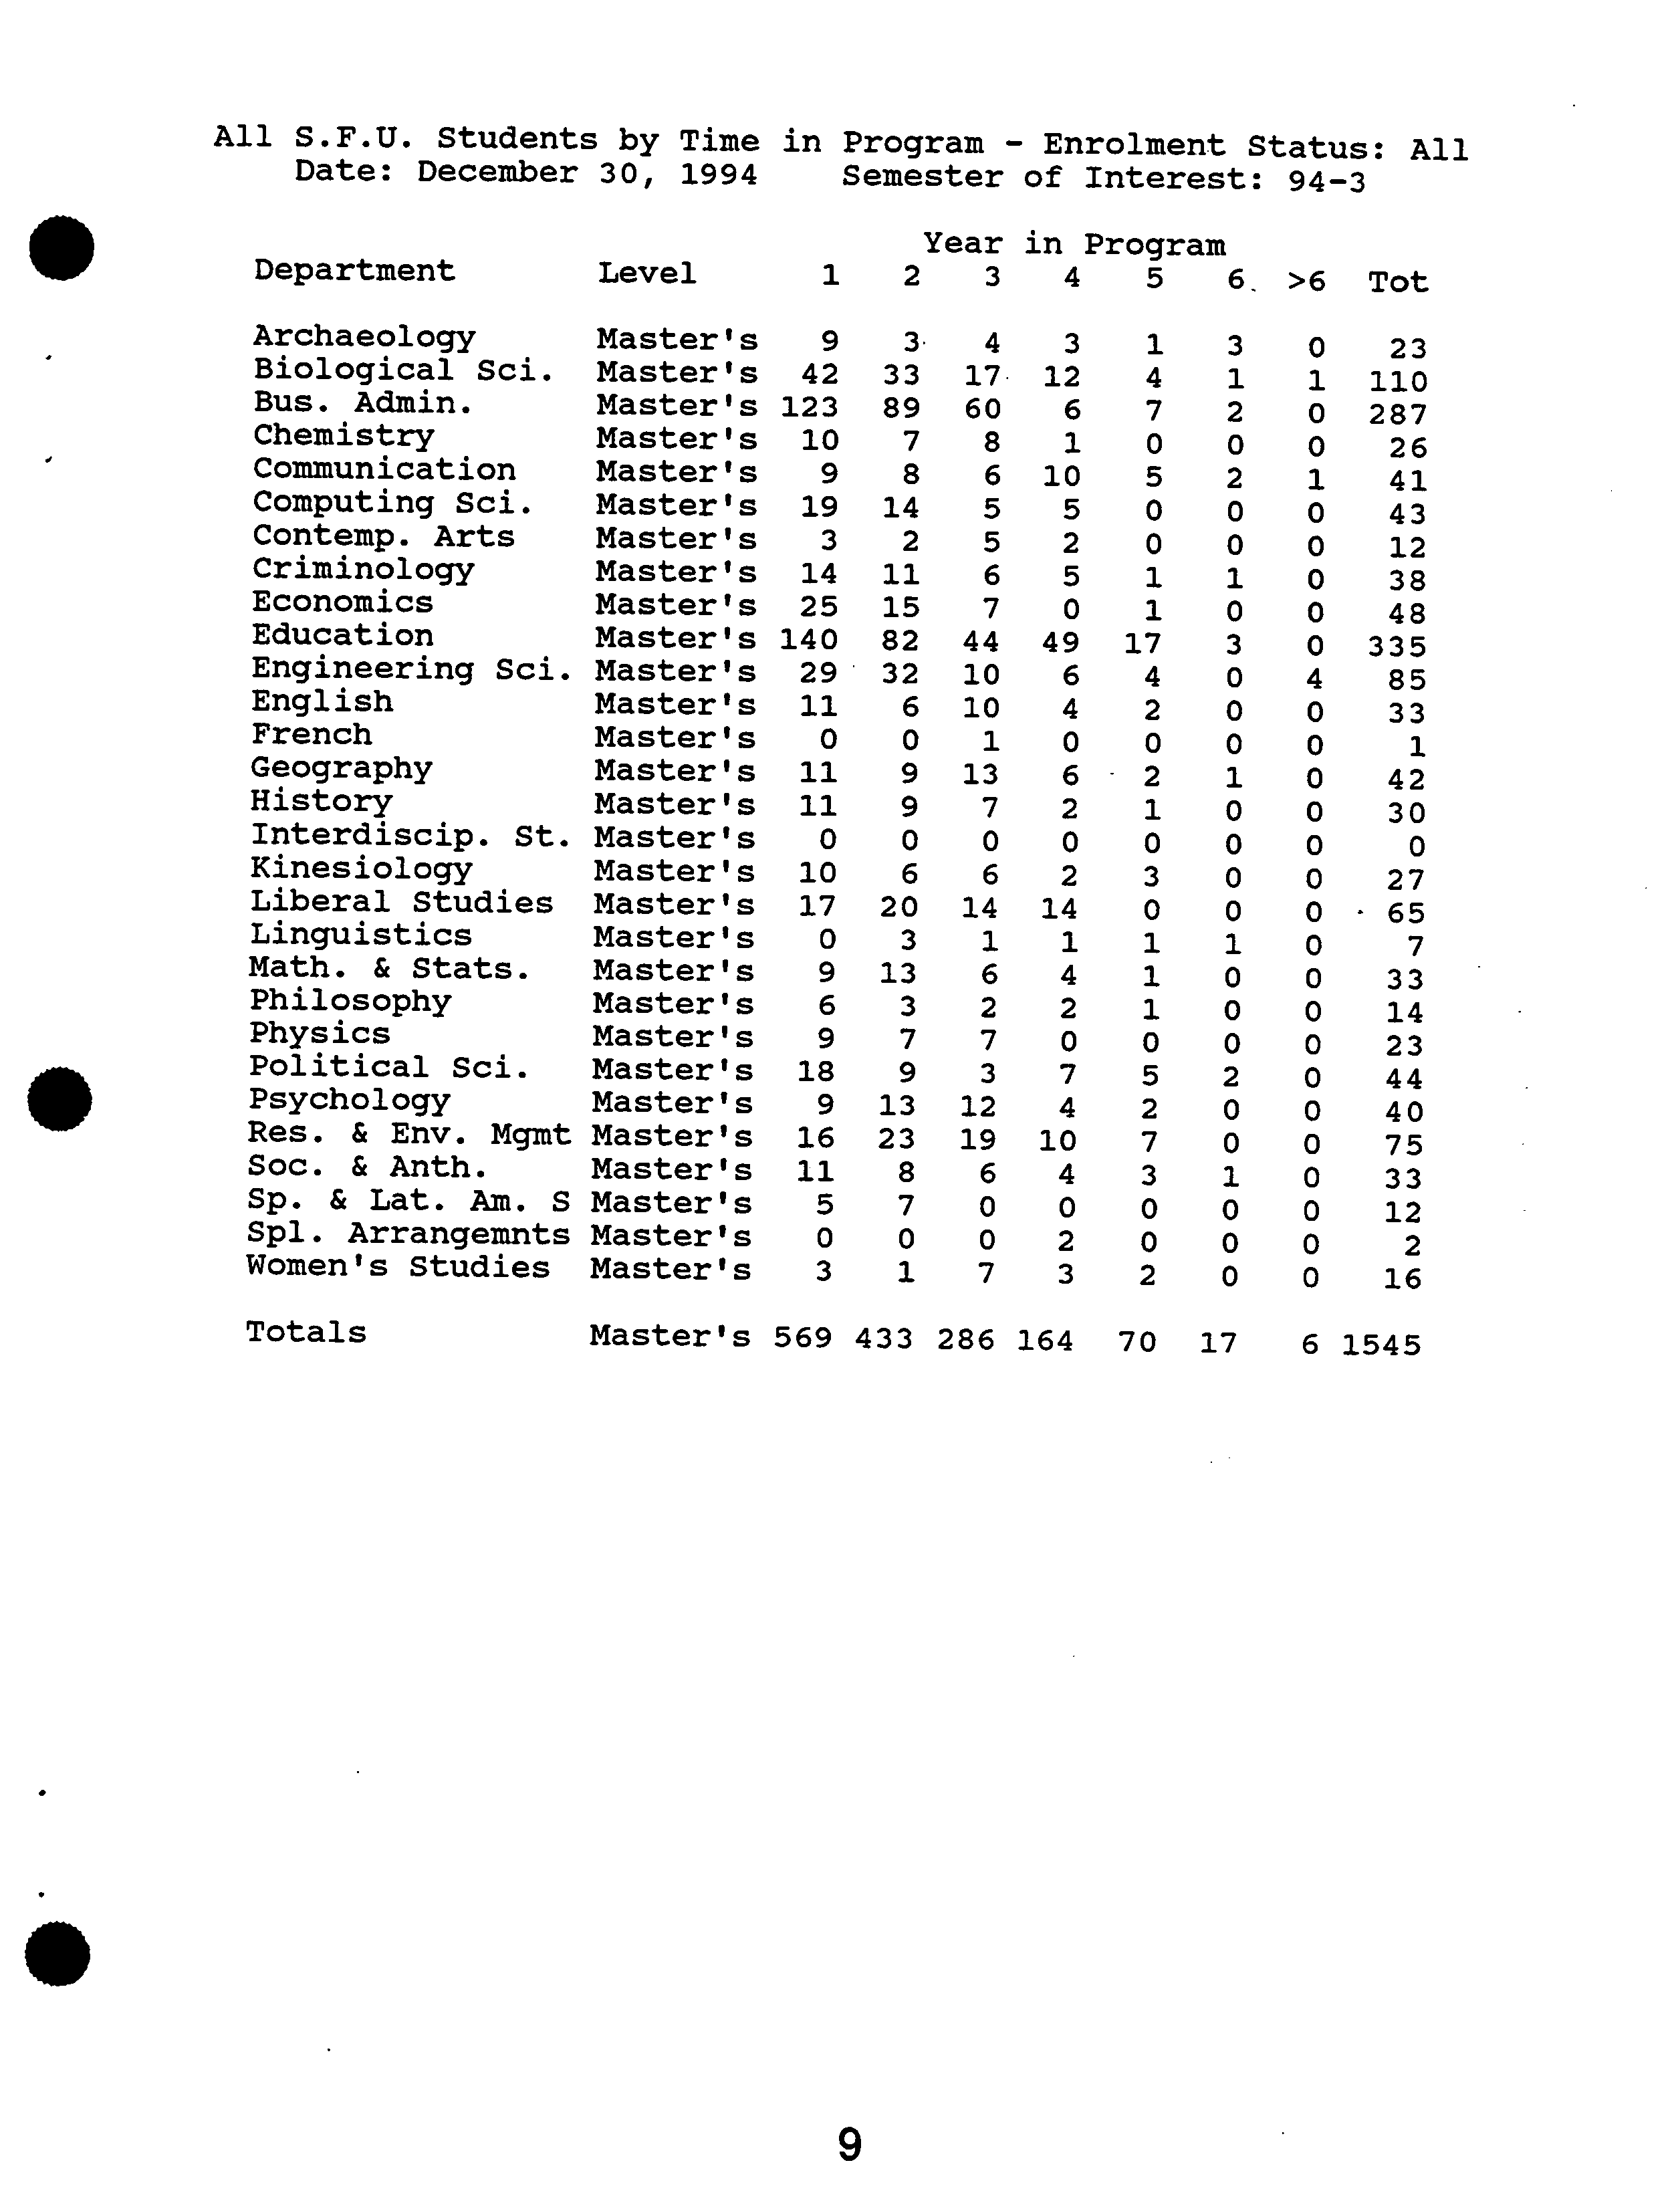
All S.F.U.
Date: December
Students
30,
by
1994Time
?
in Program
Semester
-
of
Enrolment
Interest:
Status:
94-3
All
?
•
Year
in
Program
Department
Level
1
2
3
4
5
6.
>6
Tot
Math.
PhysicsPhilosophyHistoryKinesiologyLiberal
GeographyLinguisticsEnglishEngineering
Interdiscip.
FrenchEconomicsEducationArchaeologyCriminology
Conteinp.
CommunicationComputing
ChemistryBiological
Bus. Admin.&
Stats.Studies
Arts
Sci.Sci.Sci.St.
Master'sMaster'sMaster'sMaster'sMaster'sMaster'sMaster'sMaster'sMaster'sMaster'sMaster'sMaster'sMaster'sMaster'sMaster'sMaster'sMaster'sMaster'sMaster'sMaster'sMaster'sMaster's
140123
1110
1729
111125
19144210
99600
09
3
9
20
13
82
32
11891415
33
7
3
99
3
0
6
0
2
678
3
14441010136017
7
2
61
7
1
7
60
5
5
866
4
14
4910
12
4
2022
1
4
606
0
5
2
5
0
1
3
6
17
01
1
2
3
10010
24
1
7
04
051
0
1
00
1
0
00
00
3
0011
0022
00
3
0
1
00
0
000004000000100000
1
335
287
110
23
33
27
14
42
65
85
33
30
48
43
41
38
12
23
26
7
0
1
•
Political Sci.
Psychology
Master's
Master's
18
9
9
13
3
12
7
4
5
2
2
0
44
0
0
40
Women's
Sp.
Res.
Spl.
Soc.
&
Arrangemrits
&
&
Lat.
Anth.
Env.
StudiesAm.
MgmtS
Master'sMaster'sMaster'sMaster'sMaster's
1611
5
3
0
23
17
80
19
7
006
10
2
3
40
2
007
3
0001
0
0
00
00
16
33
75
12
2
Totals
Master's
569
433
286
164
70
17
6
1545
ra
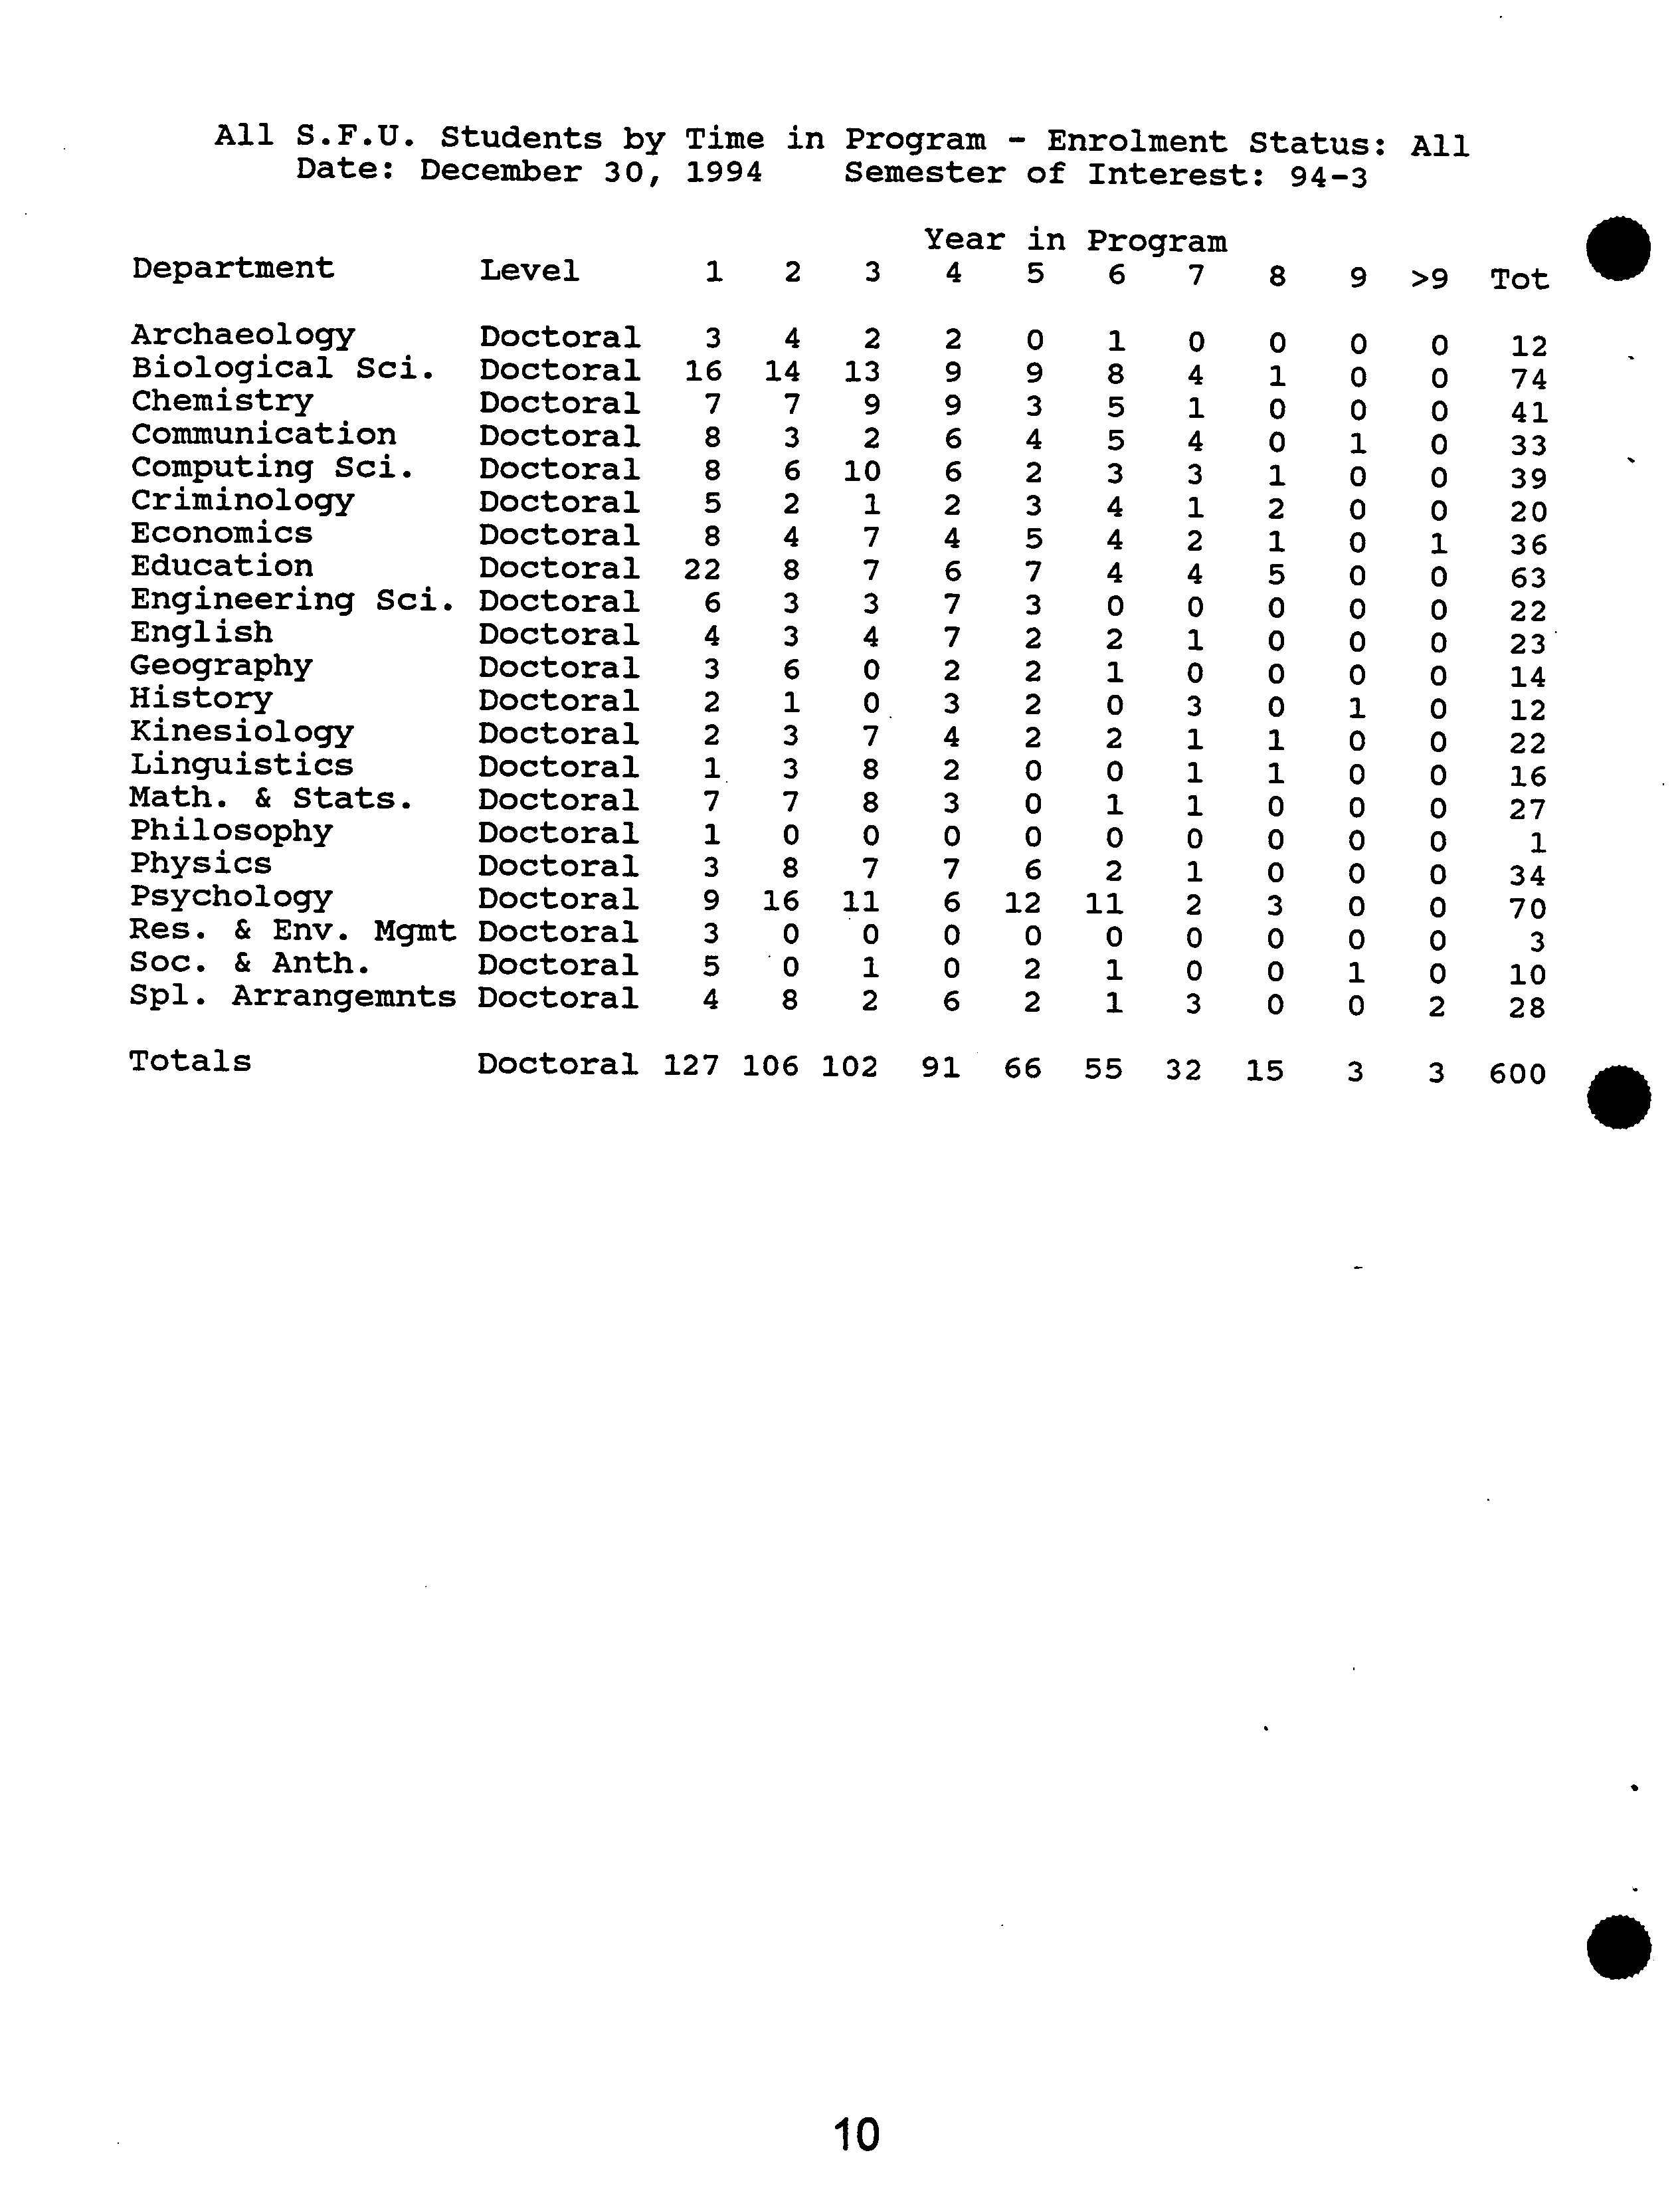
All S.F.U.
Date: December
Students
30,
by
1994Time
?
in Program
Semester
-
of
Enrolment
Interest:
Status:
94-3
All
?
Year in
Program
Department
Level
1
2 3
4
5
6
7
8
9
>9 Tot
Math.
Res.
Spl.
HistoryPhysicsPhilosophyGeographyEnglishArchaeology
Soc.
PsychologyKinesiologyEconomicsEngineering
EducationLinguisticsCommunicationCriminologyComputing
Biological
Chemistry&
&
Arrangemnts&
Anth.
Env.
Stats.Sci.Sci.Sci.Mgmt
DoctoralDoctoralDoctoralDoctoralDoctoralDoctoralDoctoralDoctoralDoctoralDoctoralDoctoralDoctoralDoctoralDoctoralDoctoralDoctoralDoctoralDoctoralDoctoralDoctoralDoctoral
2216
5
49
3
71
3
5
224
1
88
3
687
3
1614
88
7
08204
33
0
3
17
6346
3
1110
13
87
2
7870
410020
37
1
92
764
2
6
0
02
3
3
7
2
740
6
9
29
66
12
22
0
22
0
5
02
2
067
2334930
11
2
2
2
101
04
0
4
11
04
855
3
0
1
200
3
01
4
1
2
3
01
1
1
3
440
101
0
3
000000101
200
5
01
1
00
].
0000
0
10
0
00
1
0
00
0
00
1
000
2
00
000000000100000000
28
27
70
22
23
22
10
34
14
16
12
36
20
33
41
39
74
63
12
3
1
Totals
Doctoral
127
106
102
91
66
55
32
15
3
3
600
10
Simon Fraser University
Grades of All Students
Fall 1994
Philosophy
Business Admin.
Economics
Political Sci.
Chemistry
Kinesiology
Physics
Eng. Science
Bio. Sciences
History
Res. & Env. Mgmt.
Geography
Cz
Liberal Studies
.
Comp. Science
Women's Studies
Communication
Education
English
Math. & Stats.
Spi Arr.
Soc. & Anth.
Psychology
Criminology
Linguistics
Archaeology
3.30 3.40 3.50 3.60 3.70 3.80 3.90 4.00
?
Grades
• ?
University Average: 3.67 Median: 3.75
S
DGSGRD ?
11
Simon Fraser University
Cumulative Grade Point Averages at the End of Semester 94-2
Date of Report: December 30, 1994
All Graduate Students
# of
CGPA
CGPA
CGPA
CGPA
CGPA
CGPA
Department
Stu.
25%
20%
10%
Aver.
Med.
Wted.
Women's
Mathematics
Resource
Special
Span.
Sociology
HistoryGeographyEnglishKinesiologyPhysicsPsychologyPolitical
Engineering
LinguisticsPhilosophyFrenchEducationEconomicsLiberal
Archaeology,CommunicationCriminologyContemporary
Computing
Business
ChemistryBiological
&
StudiesStudiesArrangementsLat.
&
Administration&
ScienceScienceEnviron.
Sciences&
AnthropologyScienceAm.
ArtsStatisticsStudiesMgmt.
272172148
9244282730
21
52
3541
14
60
22
7944ii5730
40
58522361
7
19
4.003.944.003.794.00
3.923.74
4.003.583.934.003.753.923.92
3.934.003.543.924.003.763.843.933.843.953.67
4.00
3.723.91
4.004.003.843.953.924.003.873.953.754.004.004.003.544.004.003.953.923.833.784.003.873.954.003.843.744.004.003.67
4.004.004.004.004.004.004.004.004.004.004.004.003.874.004.003.933.894.003.813.544.004.004.003.953.854.003.784.00
3.803.713.503.853.683.793.693.663.543.733.803.793.443.623.603.713.683.873.863.503.763.743.773.703.533.483.703.88
3.673.673.863.903.473.783.783.703.783.793.953.763.543.673.583.893.833.673.523.823.893.803.783.833.533.503.693.92
3.74
3.78
3.34
3.54
3.73
3.80
3.69
3.63
3.66
3.71
3.79
3.62
3.77
3.86
3.54
3.77
3.77
3.72
3.63
3.51
3.67
3.86
3.76
3.74
3.65
3.58
3.47
3.88
Totals
1530
3.92
3.95
4.00
3.69
3.75
3.67
CGPA 25%
?
= Lowest CGPA
of the top
25% of
students
CGPA
CGPA
CGPA
Aver.
Wted.
Med. =
=
=
Median
Average
Average
CGPACGPA
CGPA
unweightedweighted
by
by
semestersemester
hours
hours
completed
completed
.
S
12
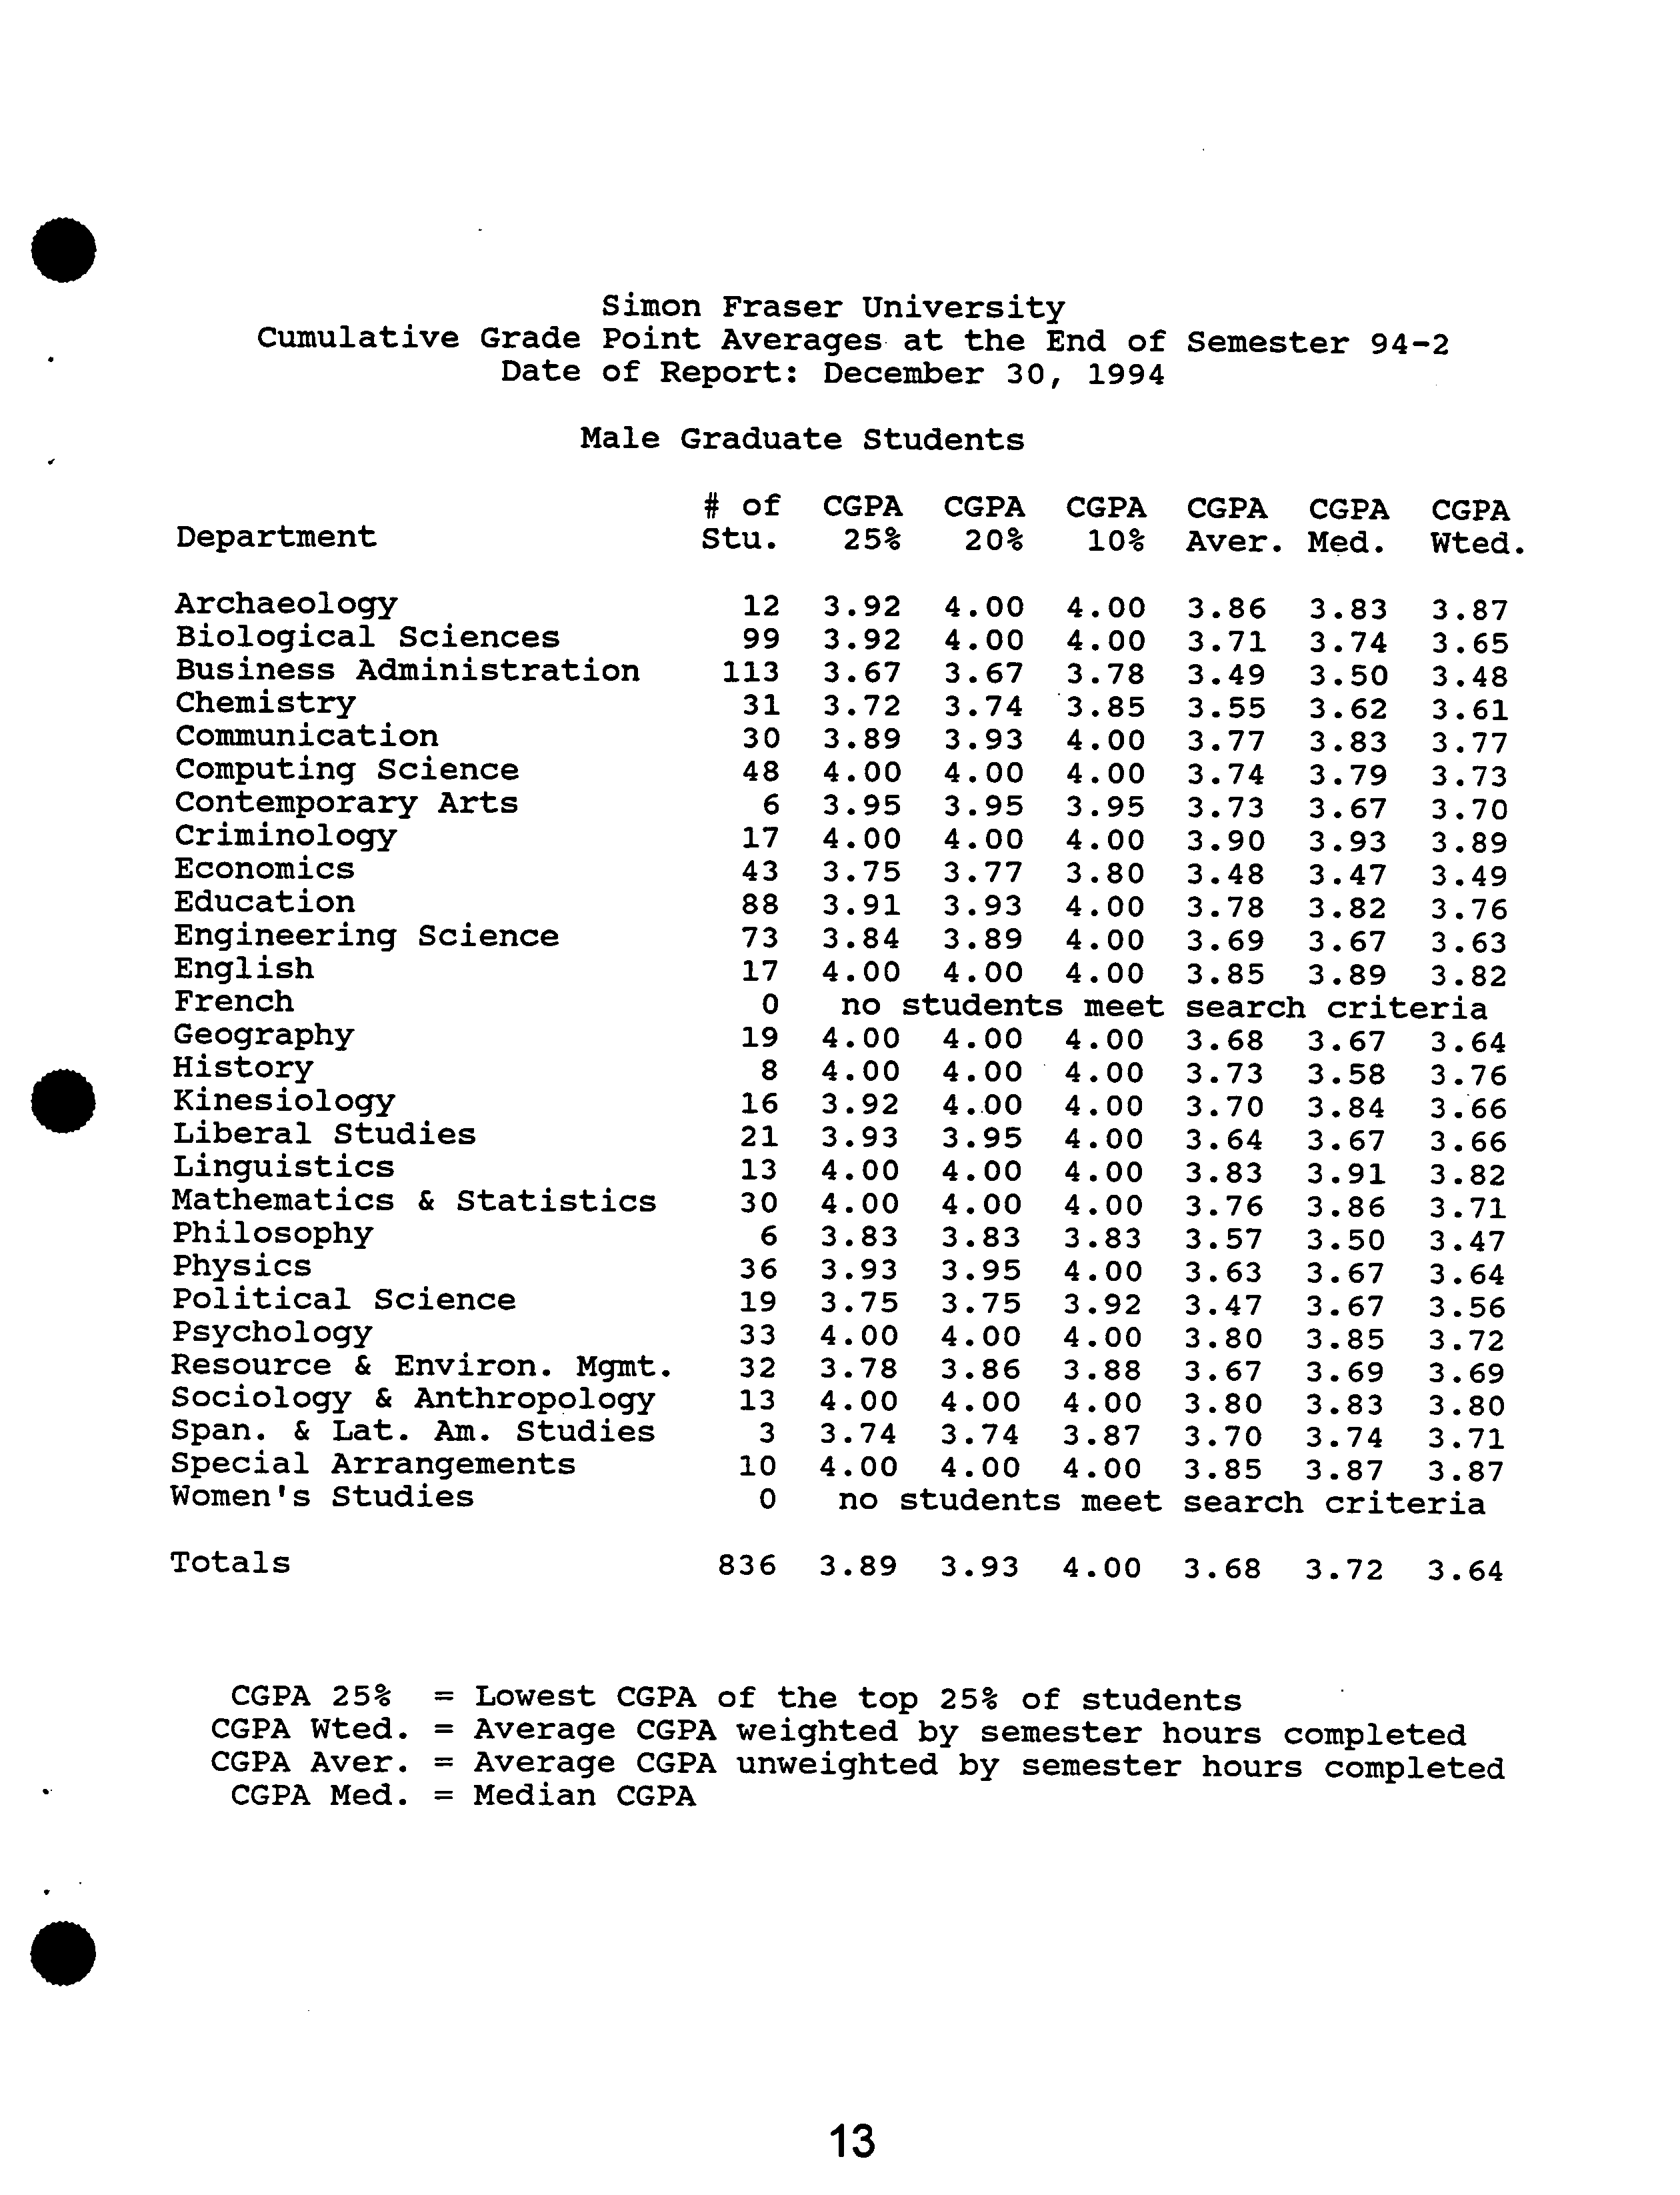
Simon Fraser University
Cumulative Grade Point Averages at the End of Semester 94-2
Date of Report: December 30, 1994
Male Graduate Students
# of CGPA CGPA CGPA CGPA CGPA CGPA
Department ?
Stu.
?
25% 20% 10% Aver. Med. Wted.
.
Archaeology
Biological Sciences
Business Administration
Chemistry
Communication
Computing Science
Contemporary Arts
Criminology
Economics
Education
Engineering Science
English
French
Geography
History
Kinesiology
Liberal Studies
Linguistics
Mathematics & Statistics
Philosophy
Physics
Political Science
Psychology
Resource & Environ. Mgmt.
Sociology & Anthropology
Span. & Lat. Ant. Studies
Special Arrangements
Women's Studies
Totals
12 3.92 4.00 4.00
?
99 3.92 4.00 4.00
?
113 3.67 3.67 3.78
31 3.72 3.74 3.85
30 3.89 3.93 4.00
48 4.00 4.00 4.00
6 3.95 3.95 3.95
17 4.00 4.00 4.00
43 3.75 3.77 3.80
88 3.91 3.93 4.00
73 3.84 3.89 4.00
17 4.00 4.00 4.00
0 no students meet
19 4.00 4.00 4.00
8 4.00 4.00 4.00
16 3.92 4.00 4.00
21 3.93 3.95 4.00
13 4.00 4.00 4.00
30 4.00 4.00 4.00
6 3.83 3.83 3.83
36 3.93 3.95 4.00
19 3.75 3.75 3.92
33 4.00 4.00 4.00
32 3.78 3.86 3.88
13 4.00 4.00 4.00
3 3.74 3.74 3.87
10 4.00 4.00 4.00
0 no students meet
836 3.89 3.93 4.00
3.86 3.83 3.87
3.71 3.74 3.65
3.49 3.50 3.48
3.55 3.62 3.61
3.77 3.83 3.77
3.74 3.79 3.73
3.73 3.67 3.70
3.90 3.93 3.89
3.48 3.47 3.49
3.78 3.82 3.76
3.69 3.67 3.63
3.85 3.89 3.82
search criteria
3.68 3.67 3.64
3.73 3.58 3.76
3.70 3.84 3.66
3.64 3.67 3.66
3.83 3.91 3.82
3.76 3.86 3.71
3.57 3.50 3.47
3.63 3.67 3.64
3.47 3.67 3.56
3.80 3.85 3.72
3.67 3.69 3.69
3.80 3.83 3.80
3.70 3.74 3.71
3.85 3.87 3.87
search criteria
3.68 3.72 3.64
CGPA 25% = Lowest CGPA of the top 25% of students
CGPA Wted. = Average CGPA weighted by semester hours completed
CGPA Aver. = Average CGPA unweighted by semester hours completed
CGPA Med. = Median CGPA
.
13
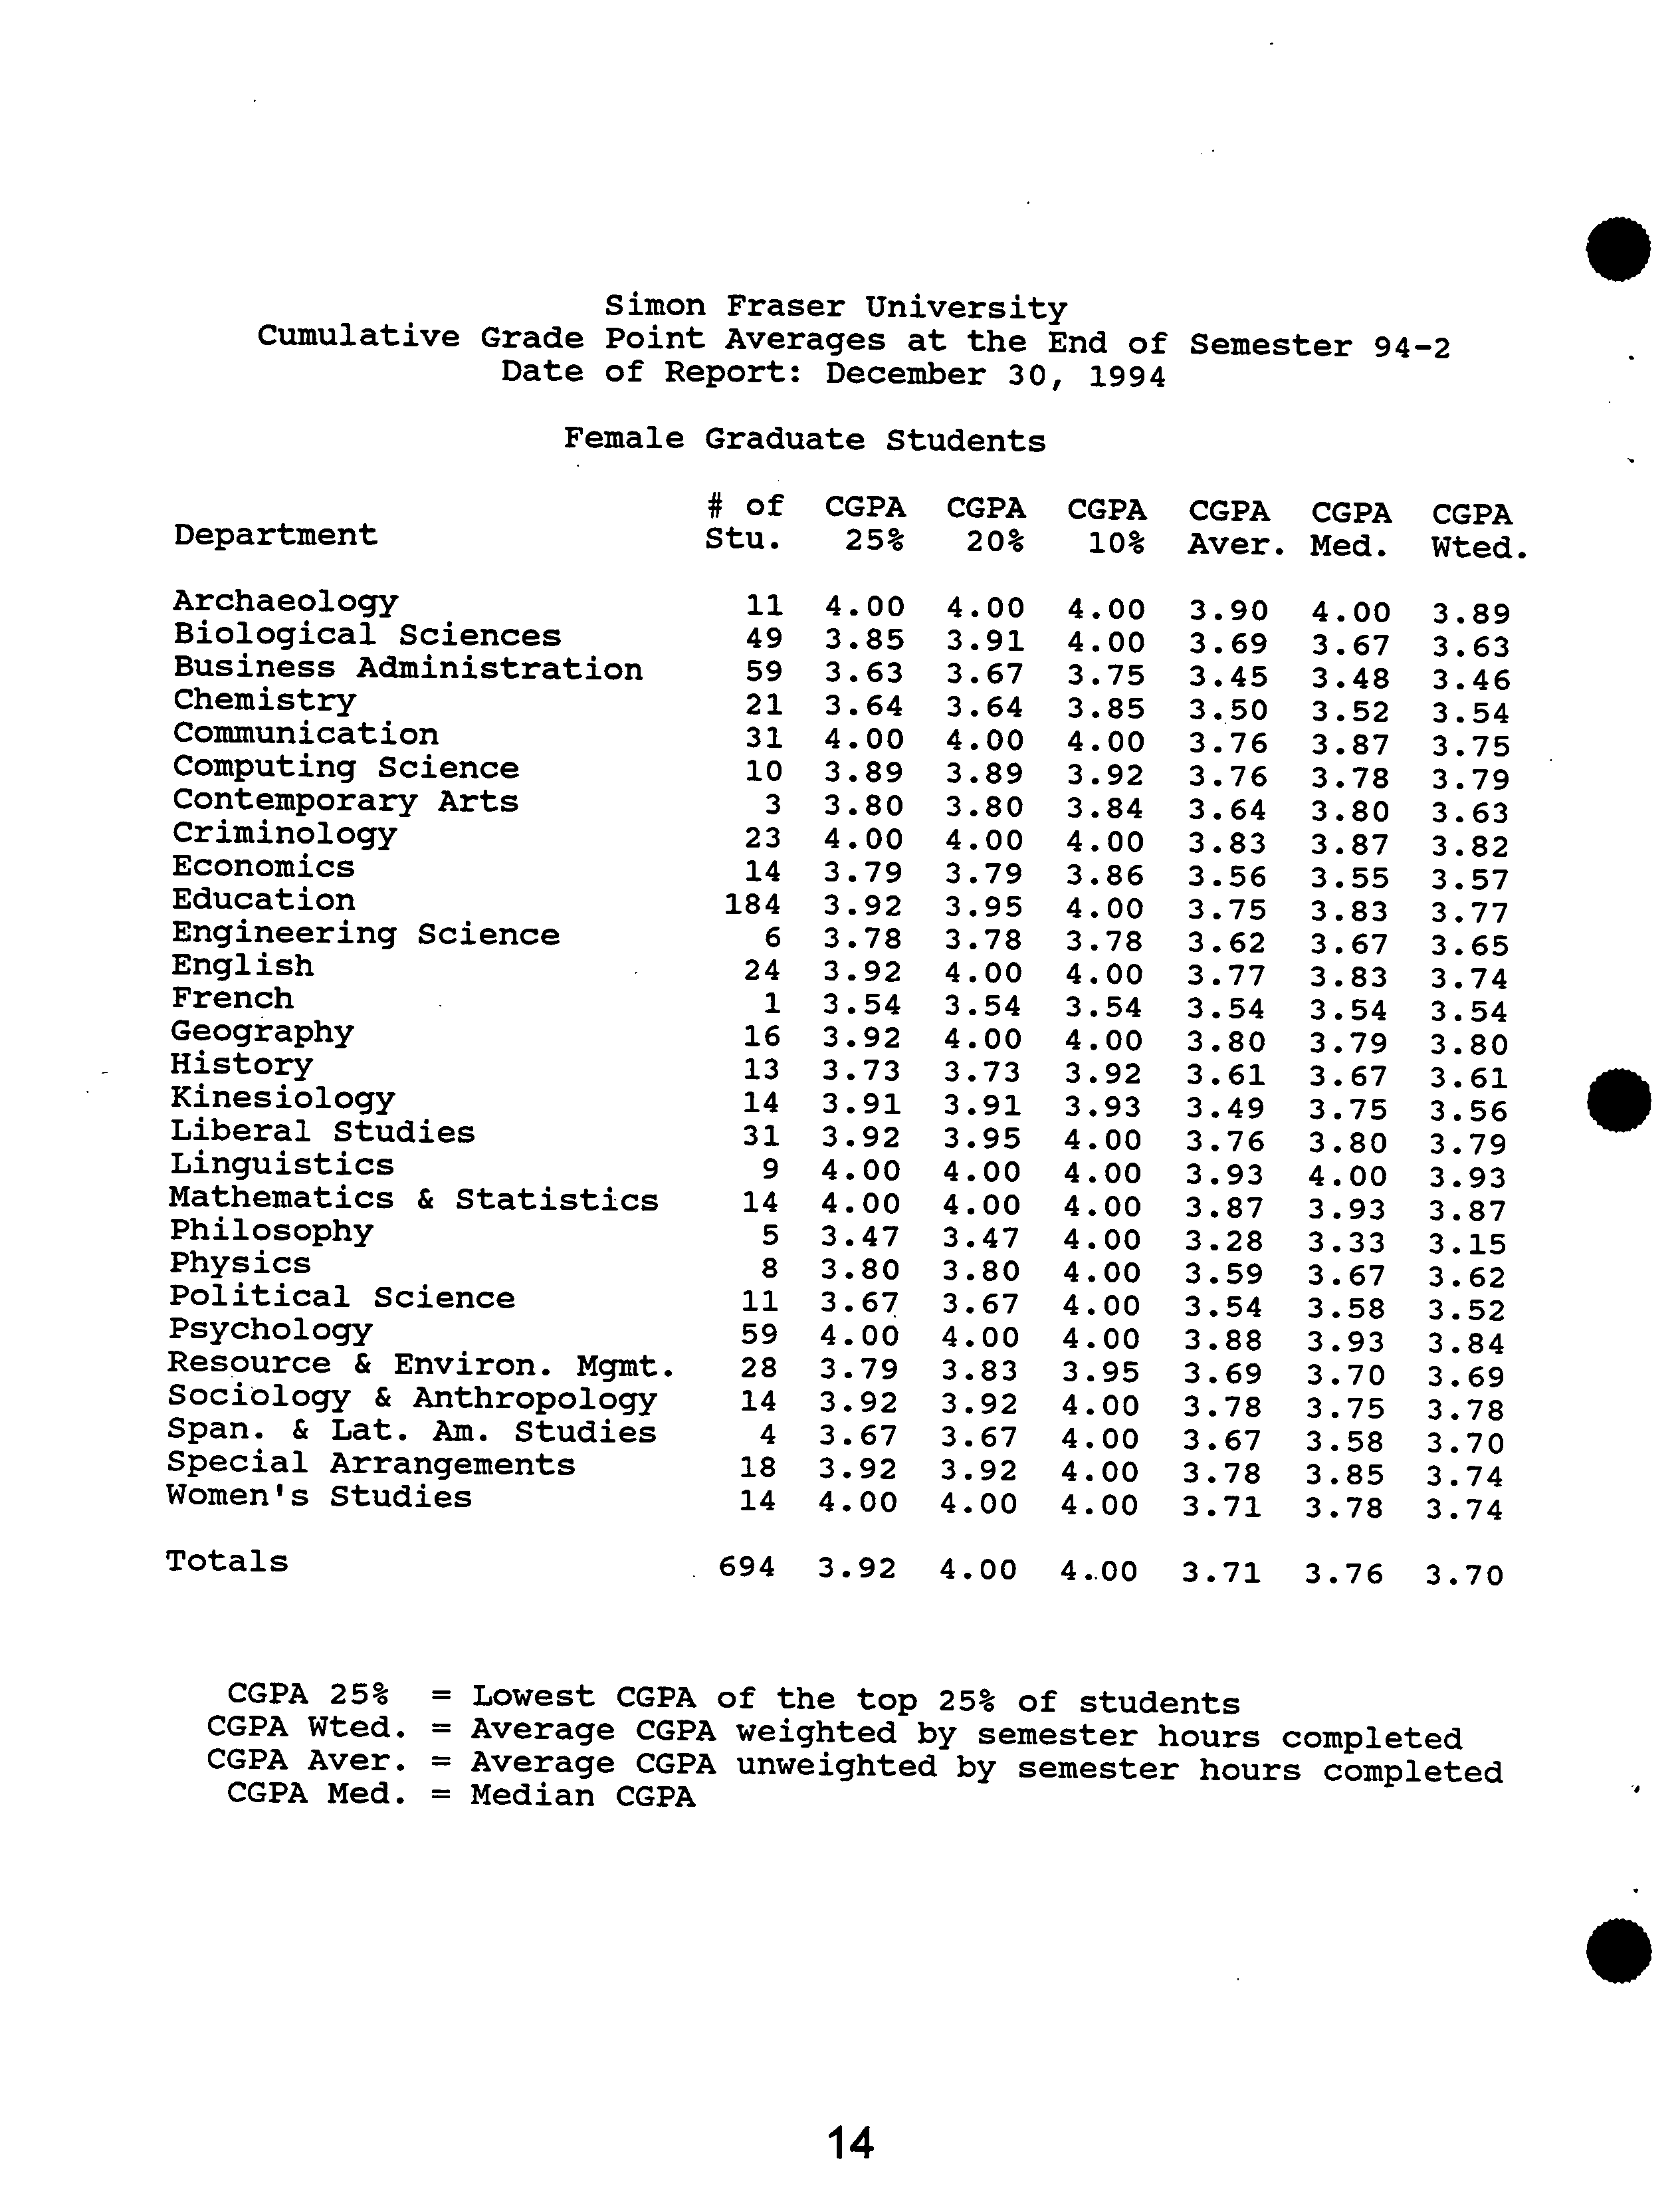
Simon Fraser University
Cumulative Grade Point Averages at the End of Semester 94-2
Date of Report: December 30, 1994
Female Graduate Students
#
of
CGPA
CGPA
CGPA
CGPA
CGPA
CGPA
Department
Stu.
25%
20%
10%
Aver.
Med.
Wted.
Women's
Resource
Special
Span.
Mathematics
Sociology
PsychologyPhysicsPolitical
HistoryPhilosophyKinesiologyLinguisticsLiberal
GeographyEnglishEducationFrenchArchaeologyEconomicsEngineering
CriminologyContemporary
CommunicationComputing
Business
ChemistryBiological
&
StudiesArrangementsLat.
Studies&
Administration&
ScienceScienceEnviron.
SciencesAnthropology&
ScienceAm.
ArtsStatisticsStudiesMgmt.
184
141814
592811
14311424161323
21
1449io
315911
485
916
3
4.003.923.674.003.793.923.673.473.804.004.003.923.923.733.913.543.794.003.783.923.923.893.804.003.854.003.643.63
4.003.923.924.003.673.833.473.803.674.004.003.913.734.003.953.544.003.953.794.003.783.804.003.893.643.913.674.00
4.004.004.004.003.954.004.004.004.004.004.004.003.933.924.003.544.004.004.003.783.864.004.003.843.923.854.003.75
3.713.783.783.673.693.883.543.283.873.593.763.933.613.803.493.543.773.753.563.623.833.643.503.693.763.763.453.90
3.783.853.753.583.703.933.583.673.933.334.003.803.753.673.793.833.673.543.553.833.873.783.874.003.803.523.673.48
3.74
3.74
3.70
3.78
3.84
3.69
3.15
3.52
3.62
3.87
3.93
3.56
3.79
3.61
3.80
3.54
3.77
3.65
3.57
3.74
3.63
3.82
3.63
3.75
3.46
3.79
3.54
3.89
Totals
694
3.92
4.00
4.00
3.71
3.76
3.70
CGPA 25% = Lowest CGPA of the top 25% of students
CGPA Wted. = Average CGPA weighted by semester hours completed
CGPA Aver. = Average CGPA unweighted by semester hours completed
CGPA Med. = Median CGPA
.
L
.
14
.
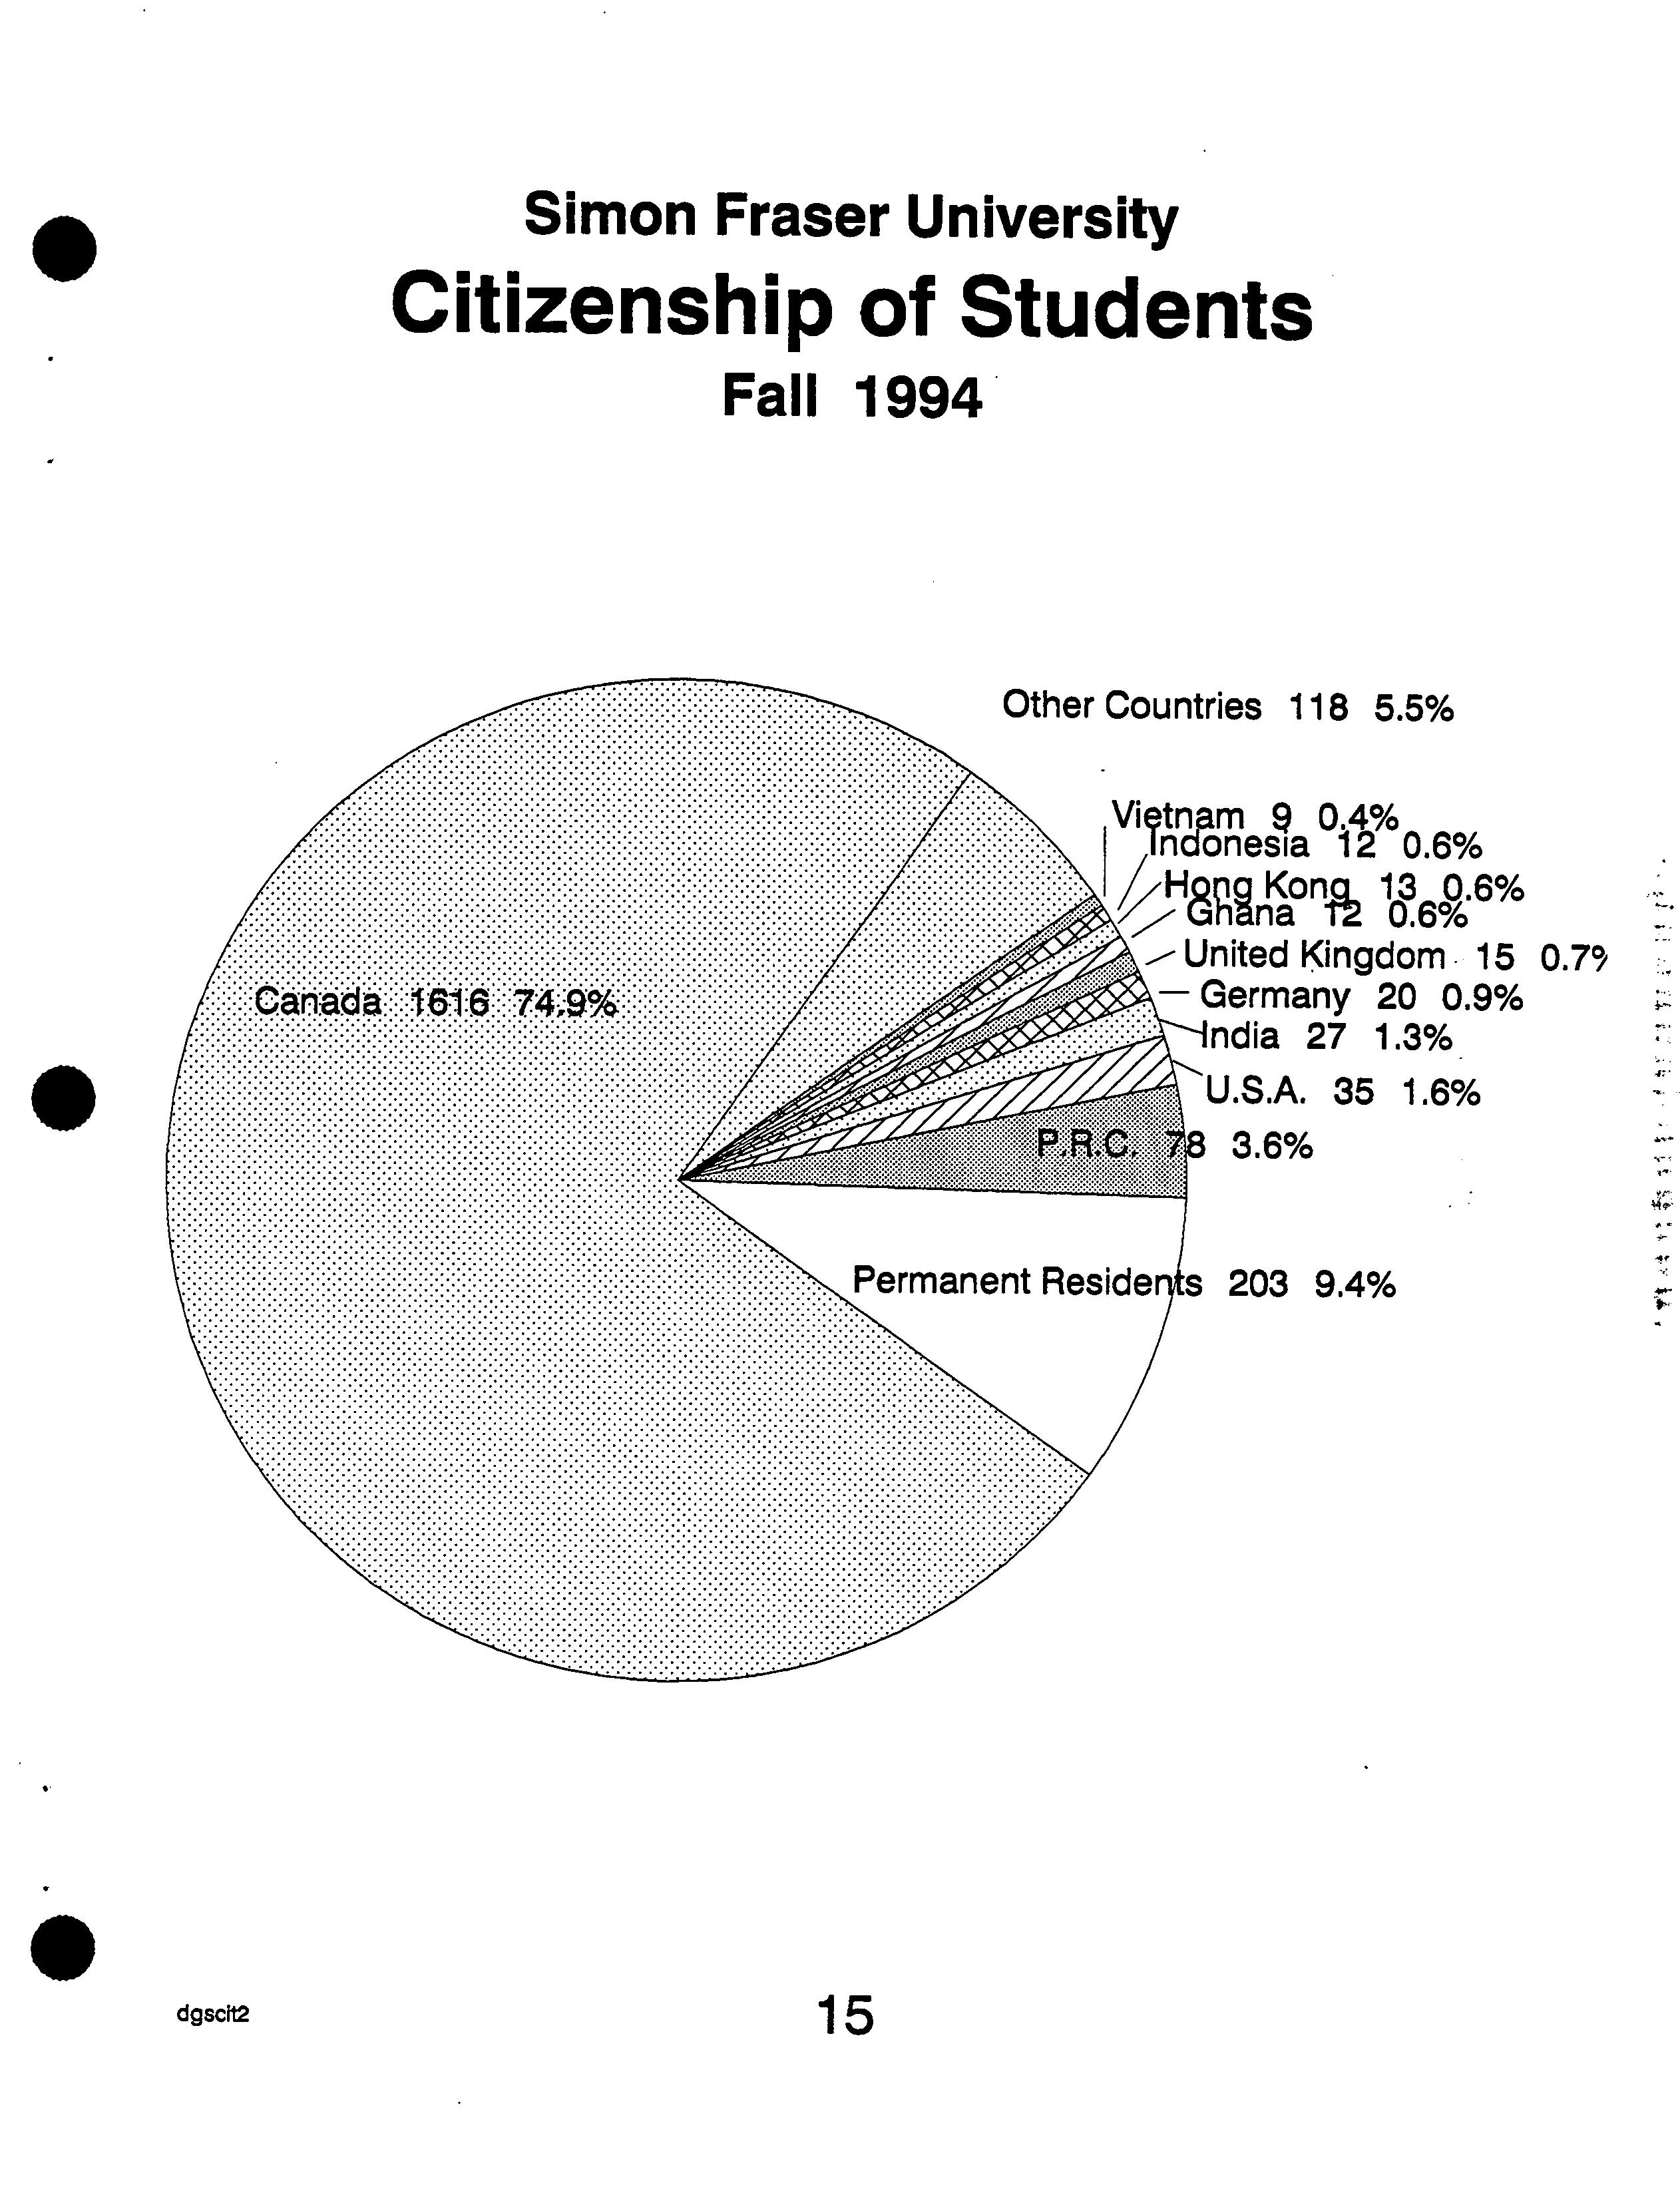
203 9.4%
Reside
Simon Fraser University
Citizenship of Students
Fall 1994
Otlier Coti ritries 118 5.5%
dgscit2 ?
15
Simon Fraser University
Citizenship of Visa Students
Fall 1994
Other Countries 75 22.8%
%1
?
5 5 1.5%
/ ?
/ ?
Singapore 5 1.5%
/tb
/ ?
?
(4
Taiwan 5 1.5%
/ ?
- ?
Sri Lanka 6 1.8%
?
(XX
/
.:.:.:.:.:.:.:.:.:.:.:.:.:.:.:.:.:.:.:.:.....:.:.....
NewZealand
Vietnam 9 27%
7 21%
Indonesia 12 3.6%
Hong Kong 13 4.0%
Ghana 12 36%
U.S.AN35 10.6%
?
/ United Kingdom 15 4.6%
Germany 20 6.1%
India 27 8.2%
a
dgscit ?
16
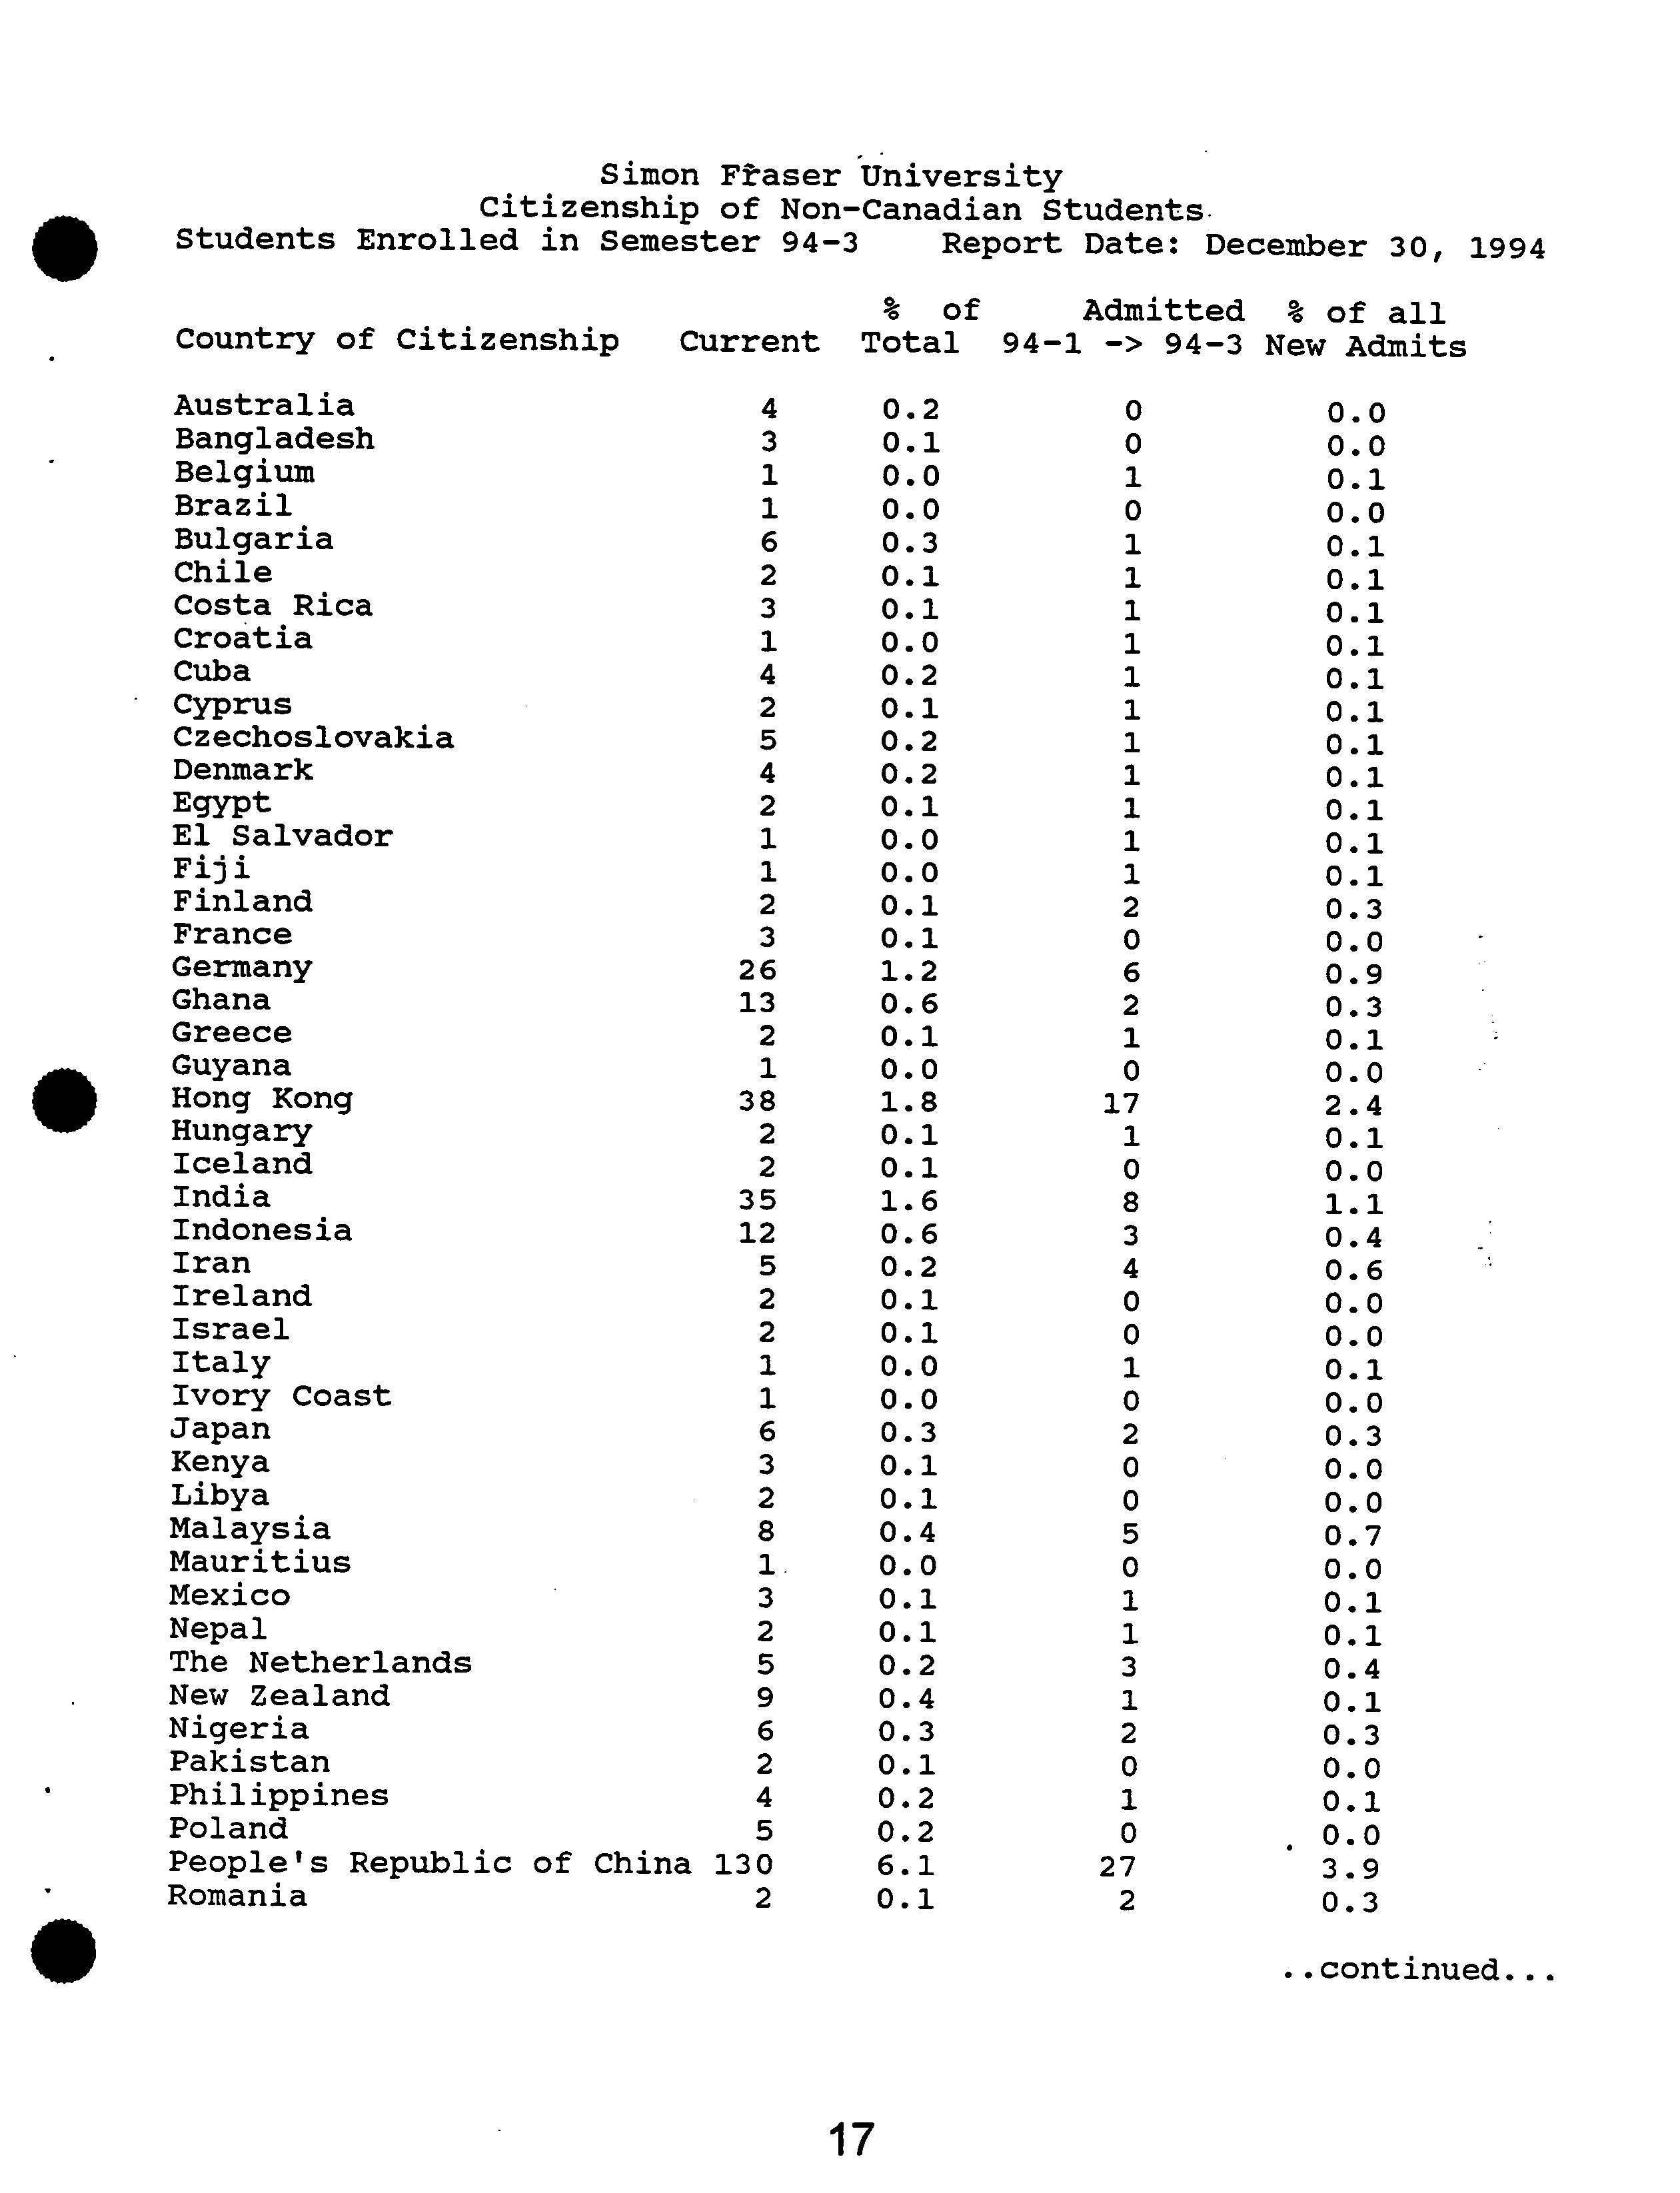
Simon Fraser University
Citizenship of Non-Canadian Students.
Students Enrolled in Semester 94-3
?
Report Date: December 30, 1994
S
.
a
% ?
of
Admitted
% of all
Country of Citizenship ?
Current
Total
94-1 -> 94-3
New Admits
Australia
4
0.2
0
0.0
Bangladesh
3
0.1
0
0.0
Belgium
1
0.0
1
0.1
Brazil
1
0.0
0
0.0
Bulgaria
6
0.3
1
0.1
Chile
2
0.1
1
0.1
Costa Rica
3
0.1
1
0.1
Croatia
1
0.0
1
0.1
Cuba
4
0.2
1
0.1
Cyprus
2
0.1
1
0.1
Czechoslovakia
5
0.2
1
0.1
Denmark
4
0.2
1
0.1
Egypt
2
0.1
1
0.1
El Salvador
1
0.0
1
0.1
Fiji
1
0.0
1
0.1
Finland
2
0.1
2
0.3
France
3
0.1
0
0.0
Germany
26
1.2
6
0.9
Ghana
13
0.6
2
0.3
Greece
2
0.1
1
0.1
Guyana
1
0.0
0
0.0
Hong Kong
38
1.8
17
2.4
Hungary
2
0.1
1
0.1
Iceland
2
0.1
0
0.0
India
35
1.6
8
1.1
Indonesia
12
0.6
3
0.4
Iran
5
0.2
4
0.6
Ireland
2
0.1
0
0.0
Israel
2
0.1
0
0.0
Italy
1
0.0
1
0.1
Ivory Coast
1
0.0
0
0.0
Japan
6
0.3
2
0.3
Kenya
3
0.1
0
0.0
Libya
2
0.1
0
0.0
Malaysia
8
0.4
5
0.7
Mauritius
1.
0.0
0
0.0
Mexico
3
0.1
1
0.1
Nepal
2
0.1
1
0.1
The Netherlands
5
0.2
3
0.4
New Zealand
9
0.4
1
0.1
Nigeria
6
0.3
2
0.3
Pakistan
2
0.1
0
0.0
Philippines
4
0.2
1
0.1
Poland
5
0.2
0
0.0
People's Republic of China
130
6.1
27
3.9
Romania
2
0.1
2
0.3
.continued...
17
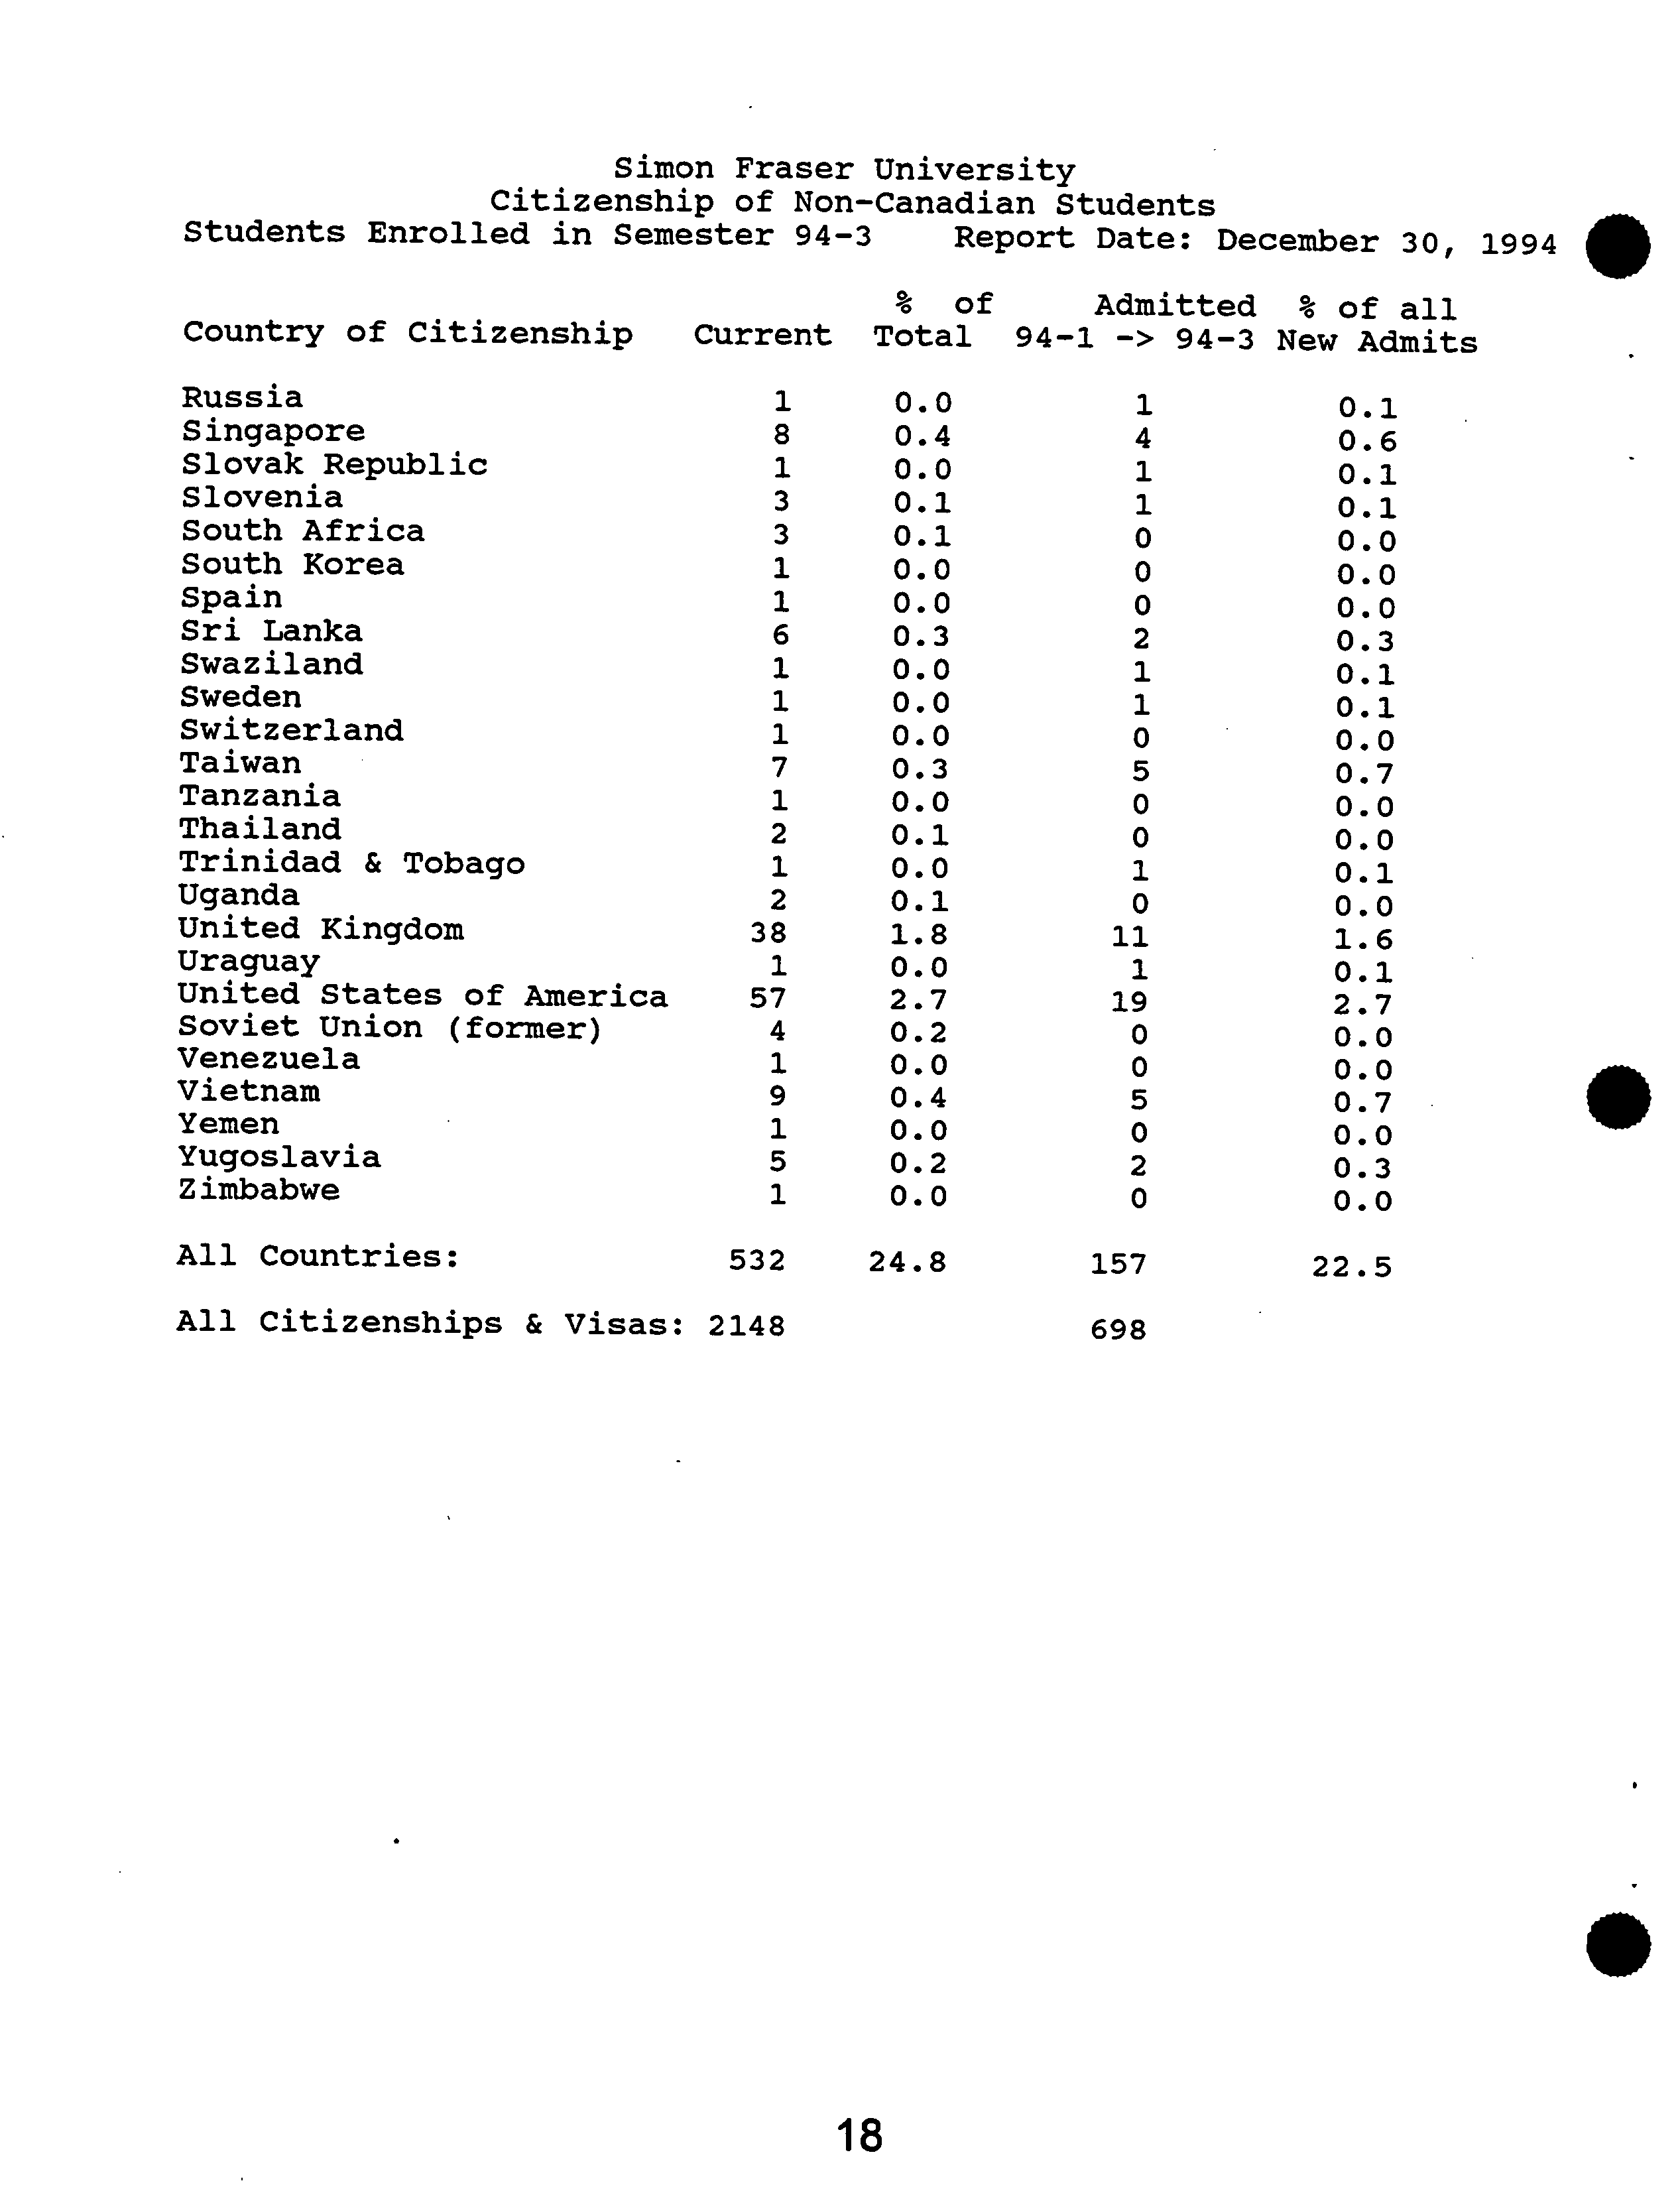
Simon
Fraser
University
Citizenship
of Non-Canadian Students
Students Enrolled in Semester 94-3
?
Report
Date: December 30, 1994
%
?
of
Admitted
% of all
Country of Citizenship
?
Current
Total ?
94-1 -> 94-3
New Admits
VietnamVenezuelaUnited
UraguayUnited
YugoslaviaYemenUgandaSoviet
TanzaniaTaiwanThailandTrinidad
ZimbabweSwitzerlandSwedenSri
SwazilandSpainRussiaSouth
South
Slovak
SingaporeSloveniaLankaAfricaKoreaUnion
KingdomStates
Republic&
Tobago(former)of
America
57
38
5
94
i1
21
2
1
7111i6i
i
3
i8
1
3
1
2.70.20.00.20.00.40.00.00.11.80.00.00.10.00.0
0.3
0.00.00.10.0
0.30.00.10.40.0
19
11
2
5
0
00010
501
00
2
1
100401i1
2.7
0.0
0.0
0.3
0.7
0.0
0.0
1.6
0.1
0.0
0.0
0.1
0.0
0.7
0.0
0.1
0.1
0.3
0.0
0.0
0.0
0.1
0.1
0.6
0.1
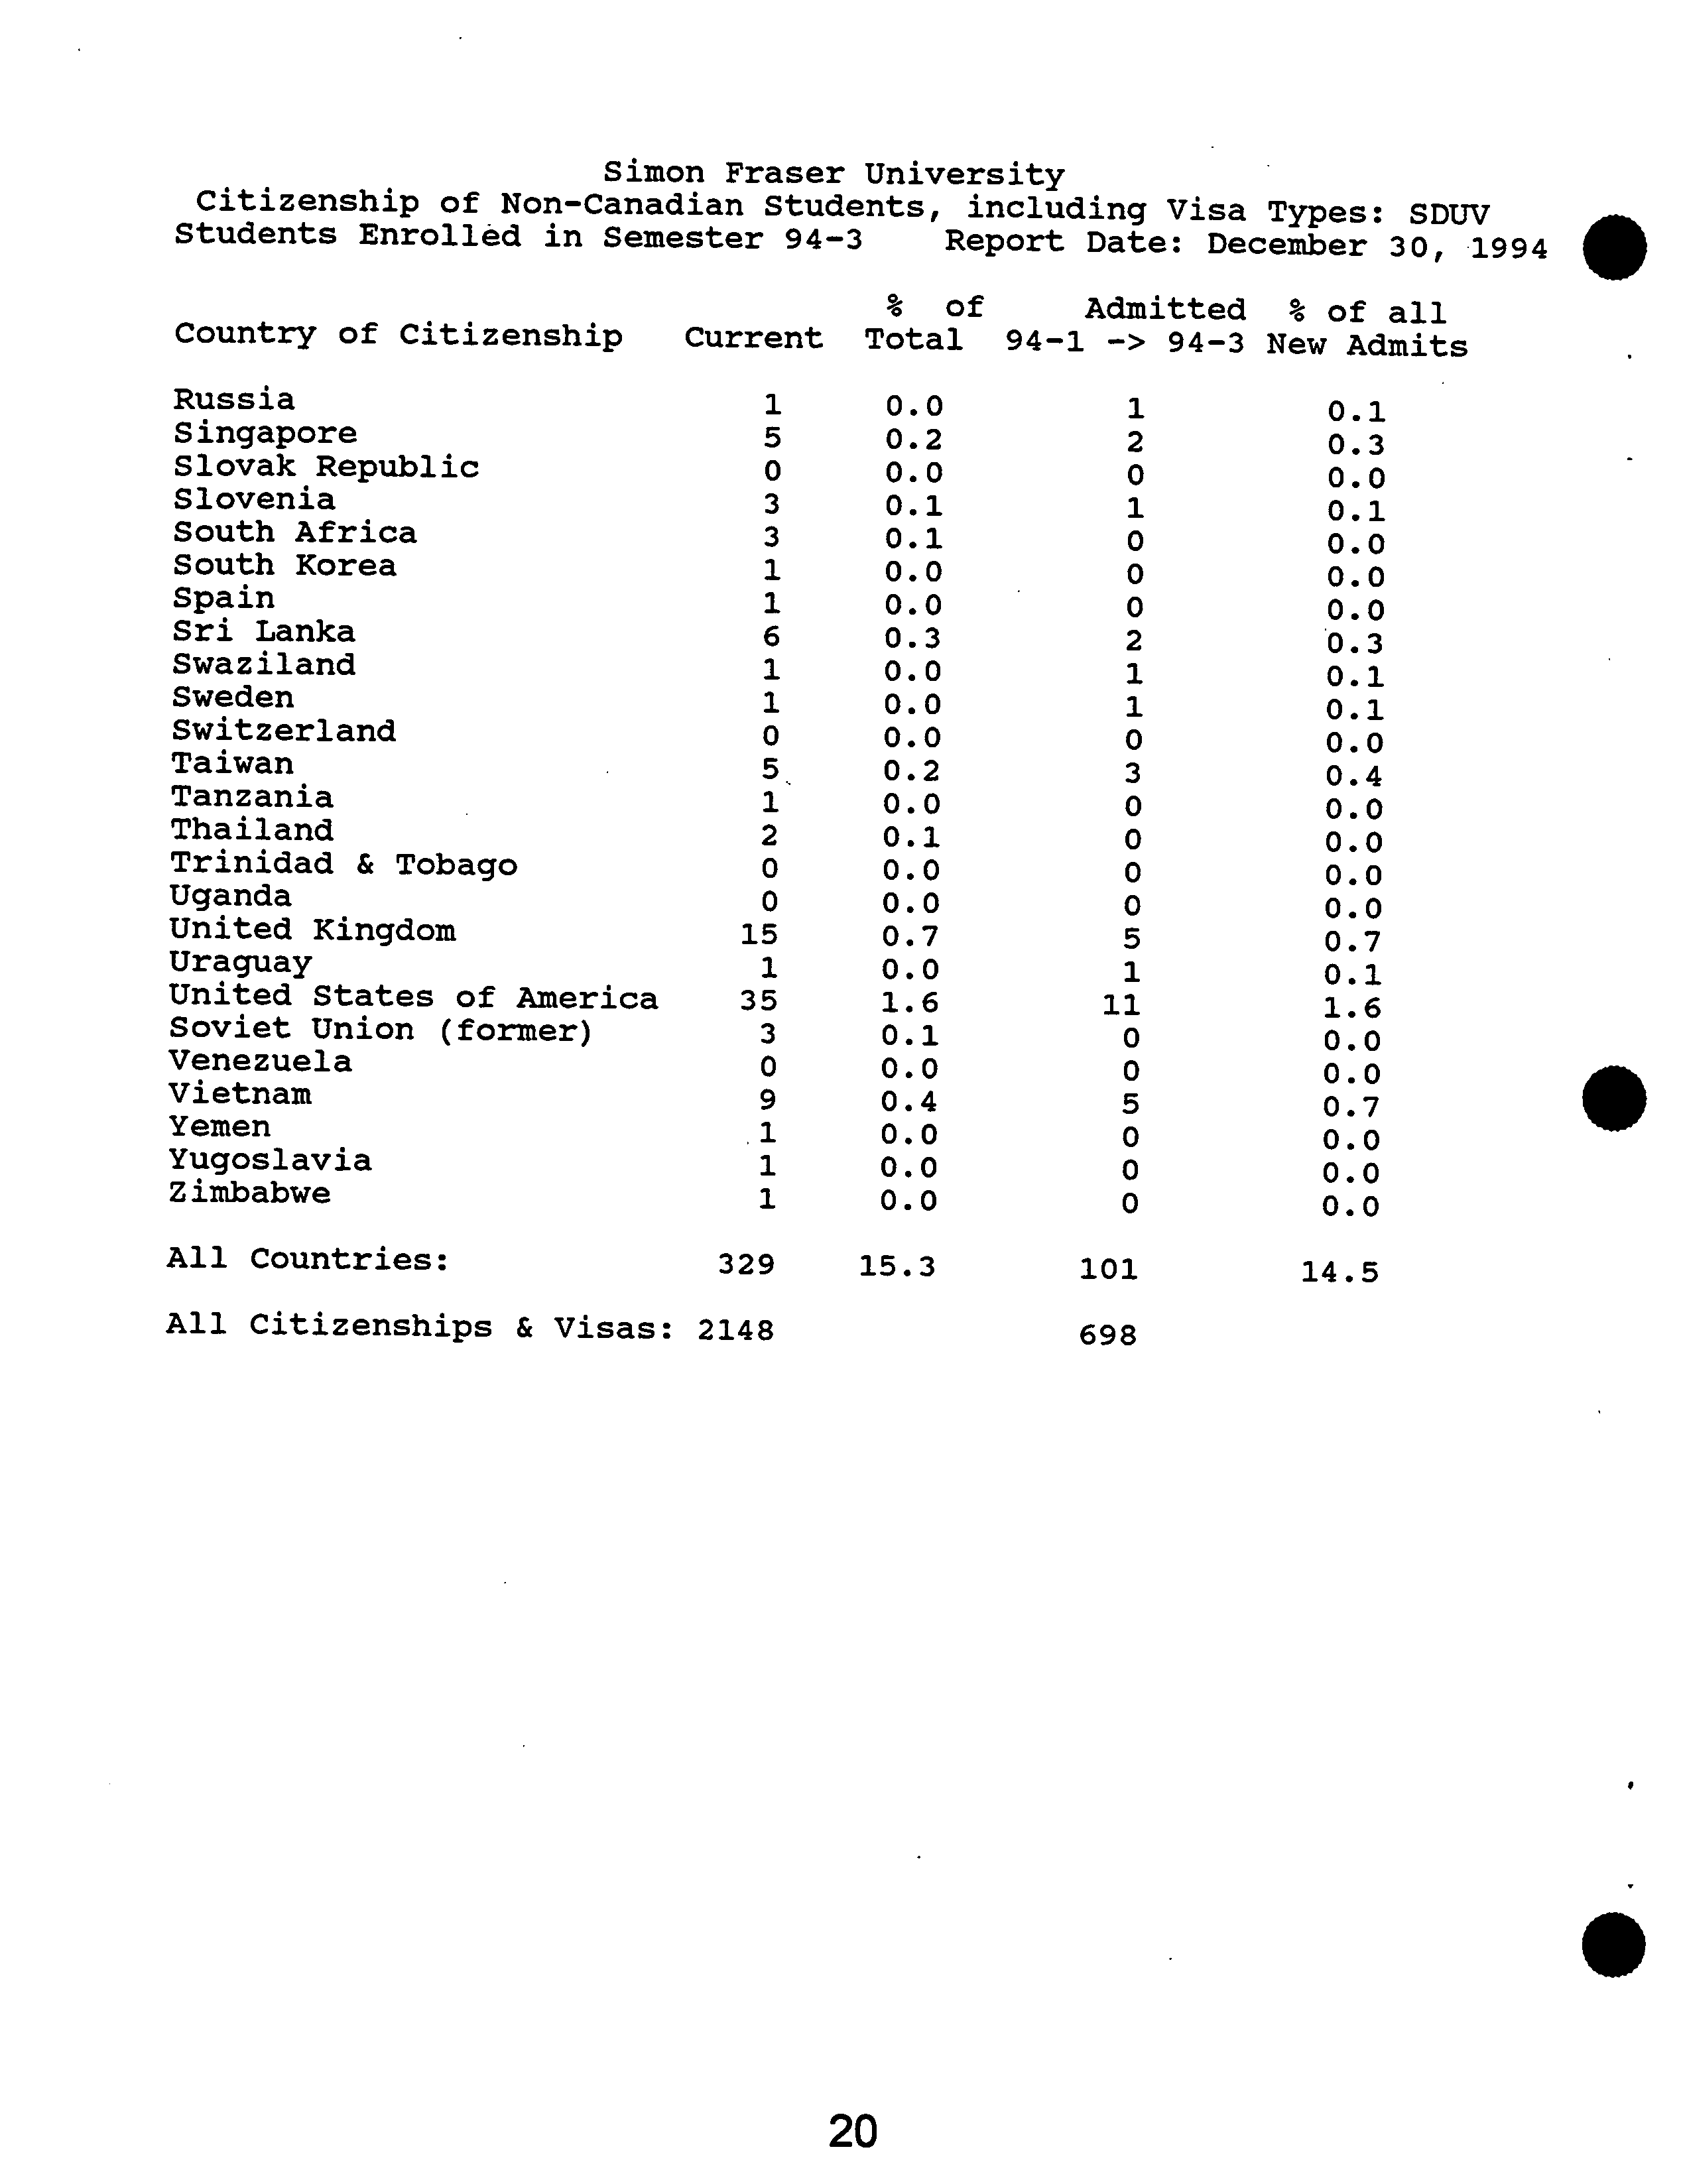
All Countries:
532
24.8
157
22.5
All Citizenships & Visas: 2148
698
18
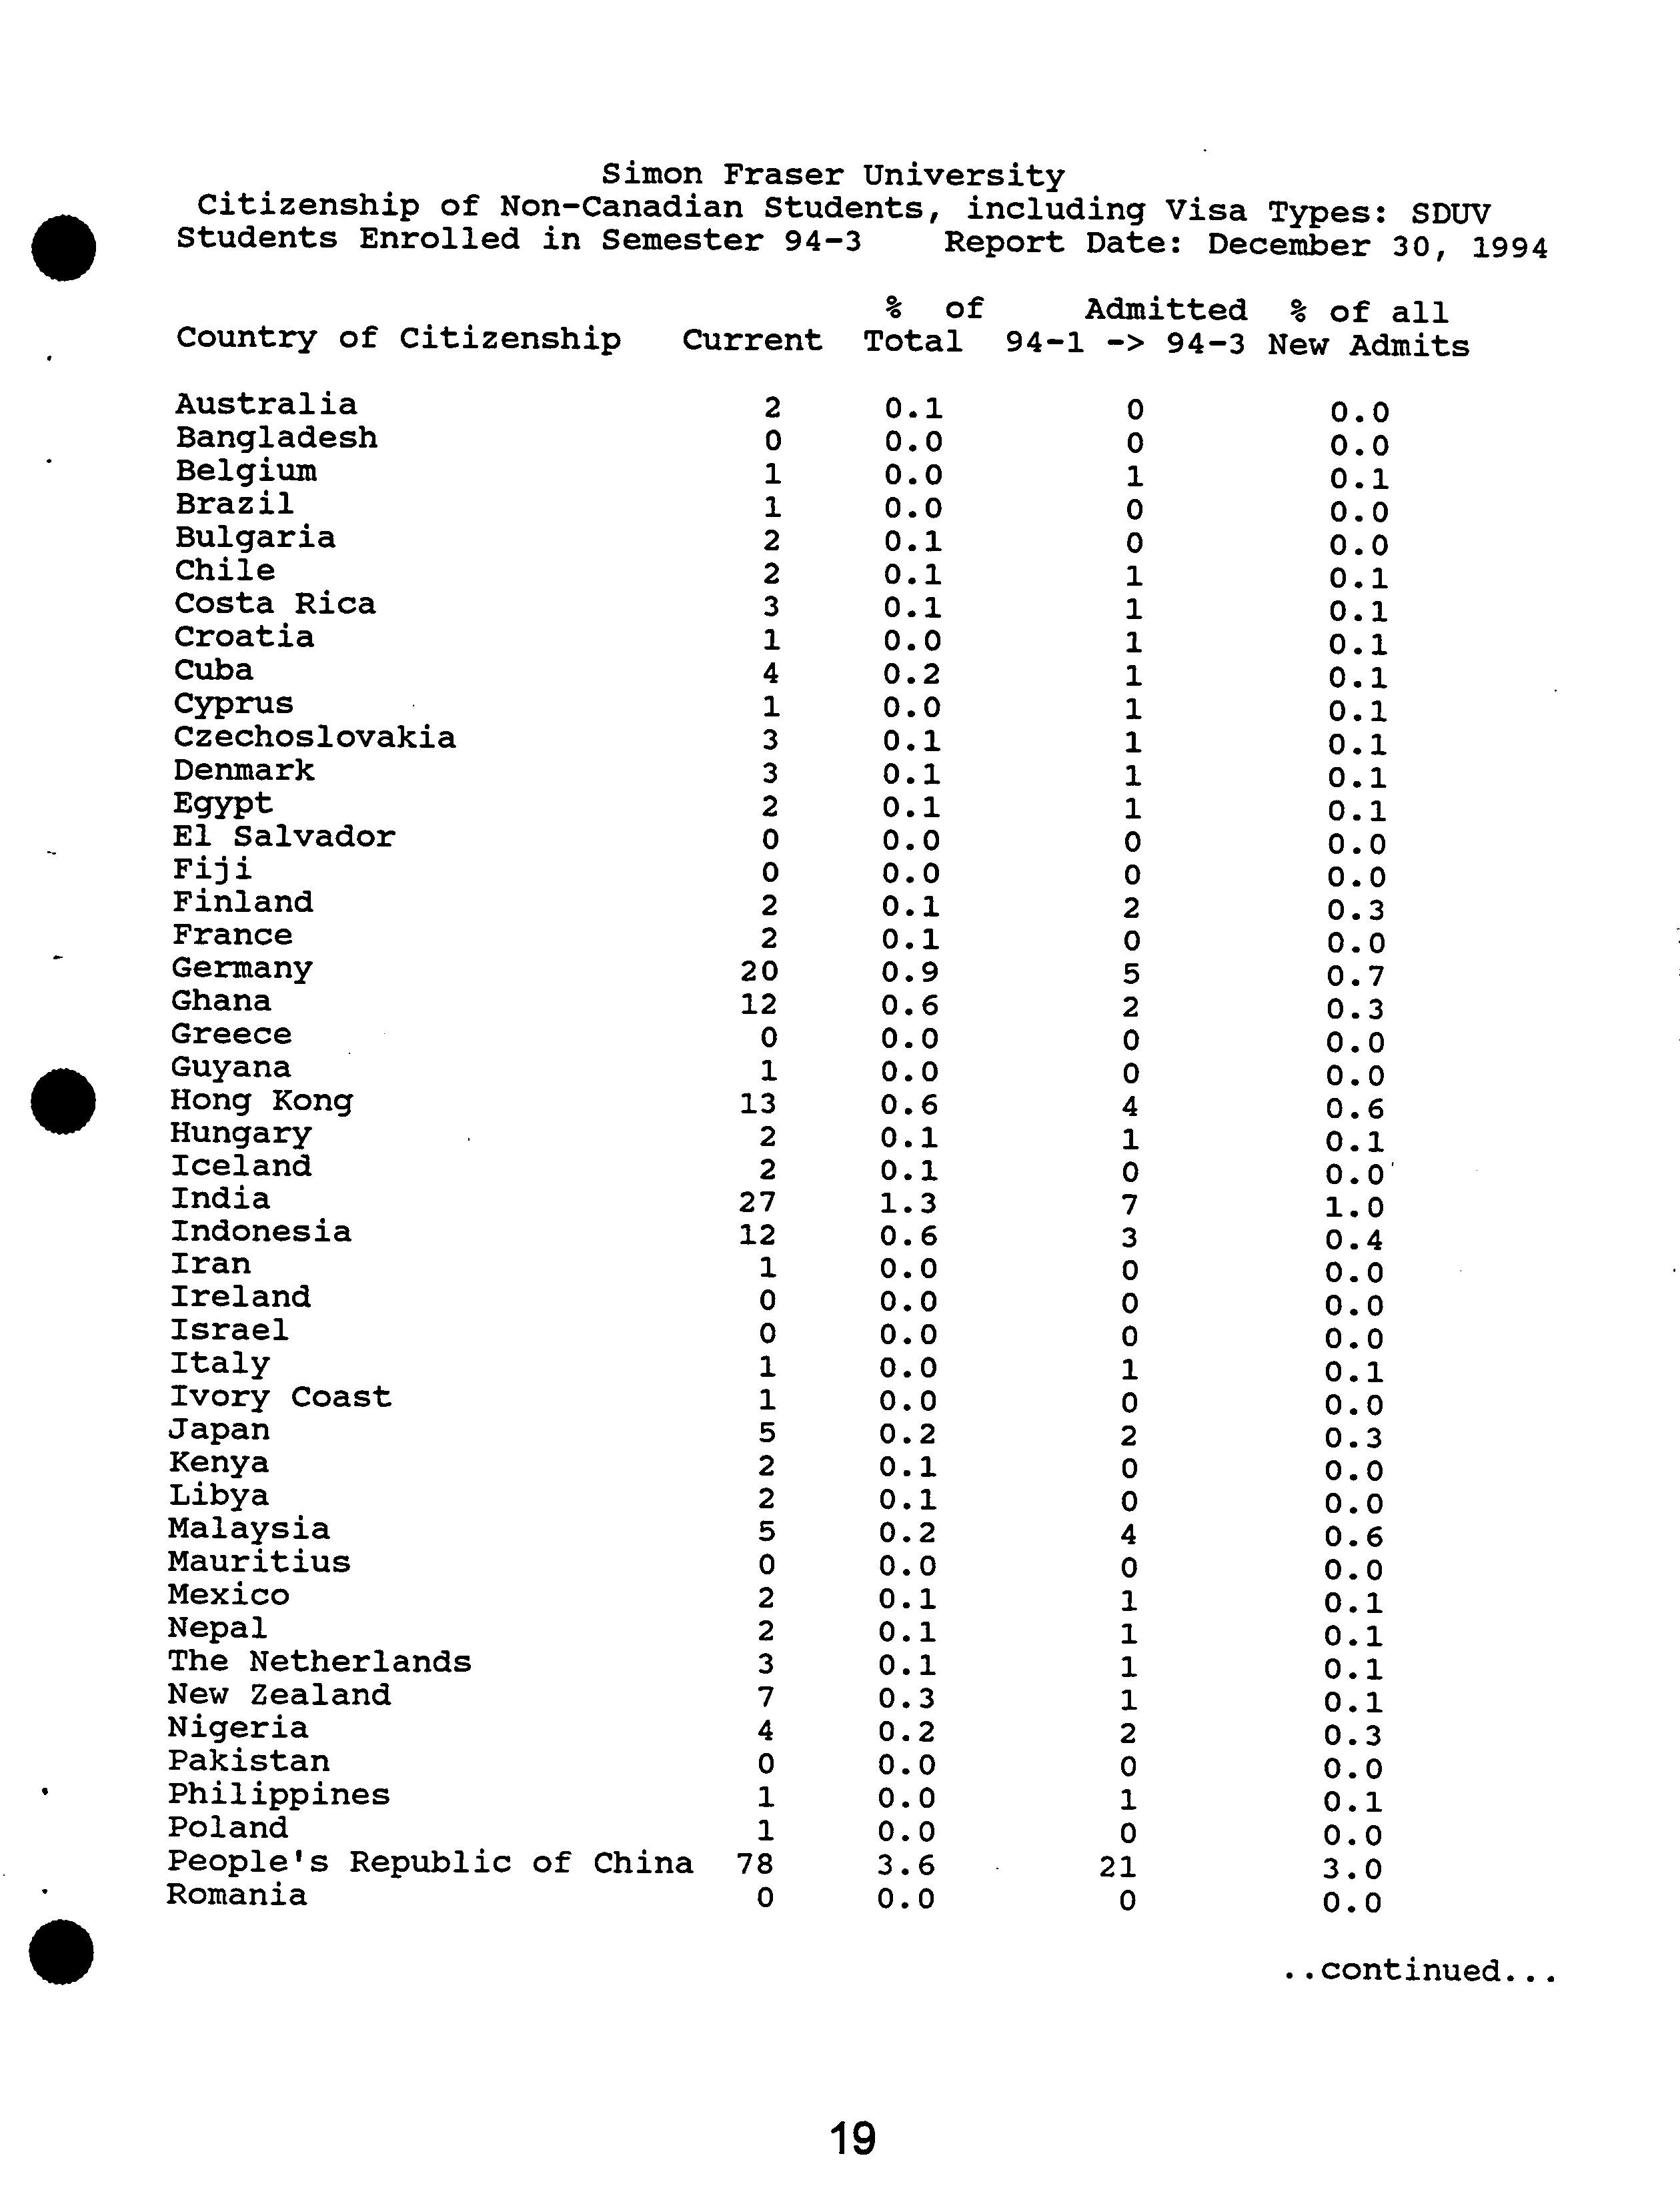
Simon Fraser
University
Students
Citizenship
Enrolledof
Non-Canadian
in Semester
Students,
94-3
Reportincluding
Date:
Visa
December
Types:
30,
SDTJV
1994
%
?
of
Admitted
% of all
Country of Citizenship ?
Current
Total ?
94-1
-> 94-3
New Admits
GreeceGuyanaGhanaGermanyEgyptFranceEl
Finland
Fiji
DenmarkCyprusCzechoslovakiaAustraliaCosta
CroatiaCubaChileBulgariaBrazilBelgiumBangladeshSalvadorRica
12
20
1
2
o22004
3
32
1
1
23
11
2
0
0.00.90.60.00.10.10.00.10.10.00.10.20.00.10.10.00.00.10.00.00.1
25020000
1
1
11111001010
0.0
0.0
0.7
0.3
0.3
0.0
0.0
0.0
0.1
0.1
0.1
0.1
0.1
0.1
0.1
0.1
0.0
0.1
0.0
0.0
0.0
•
RomaniaNew
NepalMexicoNigeriaMalaysiaPeople's
MauritiusPhilippinesPolandThe
JapanPakistanKenyaLibyaHungaryHong
IsraelIvory
IrelandItalyIndonesiaIranIndiaIcelandNetherlandsZealandKongCoastRepublic
of China ?
78271213
07
4
1212
3
0
2
2
5
0
5o11
220i
3.60.00.00.00.00.10.30.10.20.00.10.10.20.00.00.10.20.60.01.30.00.00.10.60.1
21
20012041171001
1
0
3
40o
00
10
0.0
3.0
0.0
0.0
0.1
0.1
0.1
0.1
0.0
0.3
0.1
0.0
0.0
0.3
0.6
0.1
0.0
0.0
0.0
0.0
0.4
0.0
0.1
1.0
0.6
..continued...
19
Simon Fraser
University
Citizenship of Non-Canadian Students, including Visa
Types: SDtJV
Students Enrolled in Semester 94-3
?
Report
Date: December 30, 1994
%
?
of
Admitted
% of all
Country of Citizenship
Current
Total ?
94-1 -> 94-3
New Admits
VenezuelaVietnamYugoslaviaUnited
YemenUnited
ZimbabweUraguayUgandaSoviet
TanzaniaTrinidad
ThailandTaiwanSwitzerlandSwedenSwazilandRussiaSpainSri
SloveniaSouth
South
Slovak
SingaporeLankaKoreaAfricaUnion
States
KingdomRepublic&
Tobago(former)of
America
3515
.1
11
9032
1
0
5
o10
1
16
1
3
5i
o
3
1
0.00.00.40.00.00.10.01.60.70.00.00.10.00.00.20.30.00.00.00.00.10.20.10.00.0
11
05
00050010
3
0001
2
1001
0
2
01
0.0
0.7
0.0
0.0
0.0
0.0
1.6
0.1
0.0
0.7
0.0
0.0
0.0
0.0
0.1
0.4
0.1
0.0
0.0
0.3
0.1
0.0
0..0
03
0.1
All Countries:
329
15.3
101
14.5
All Citizenships & Visas:
2148
698
a
20
• ?
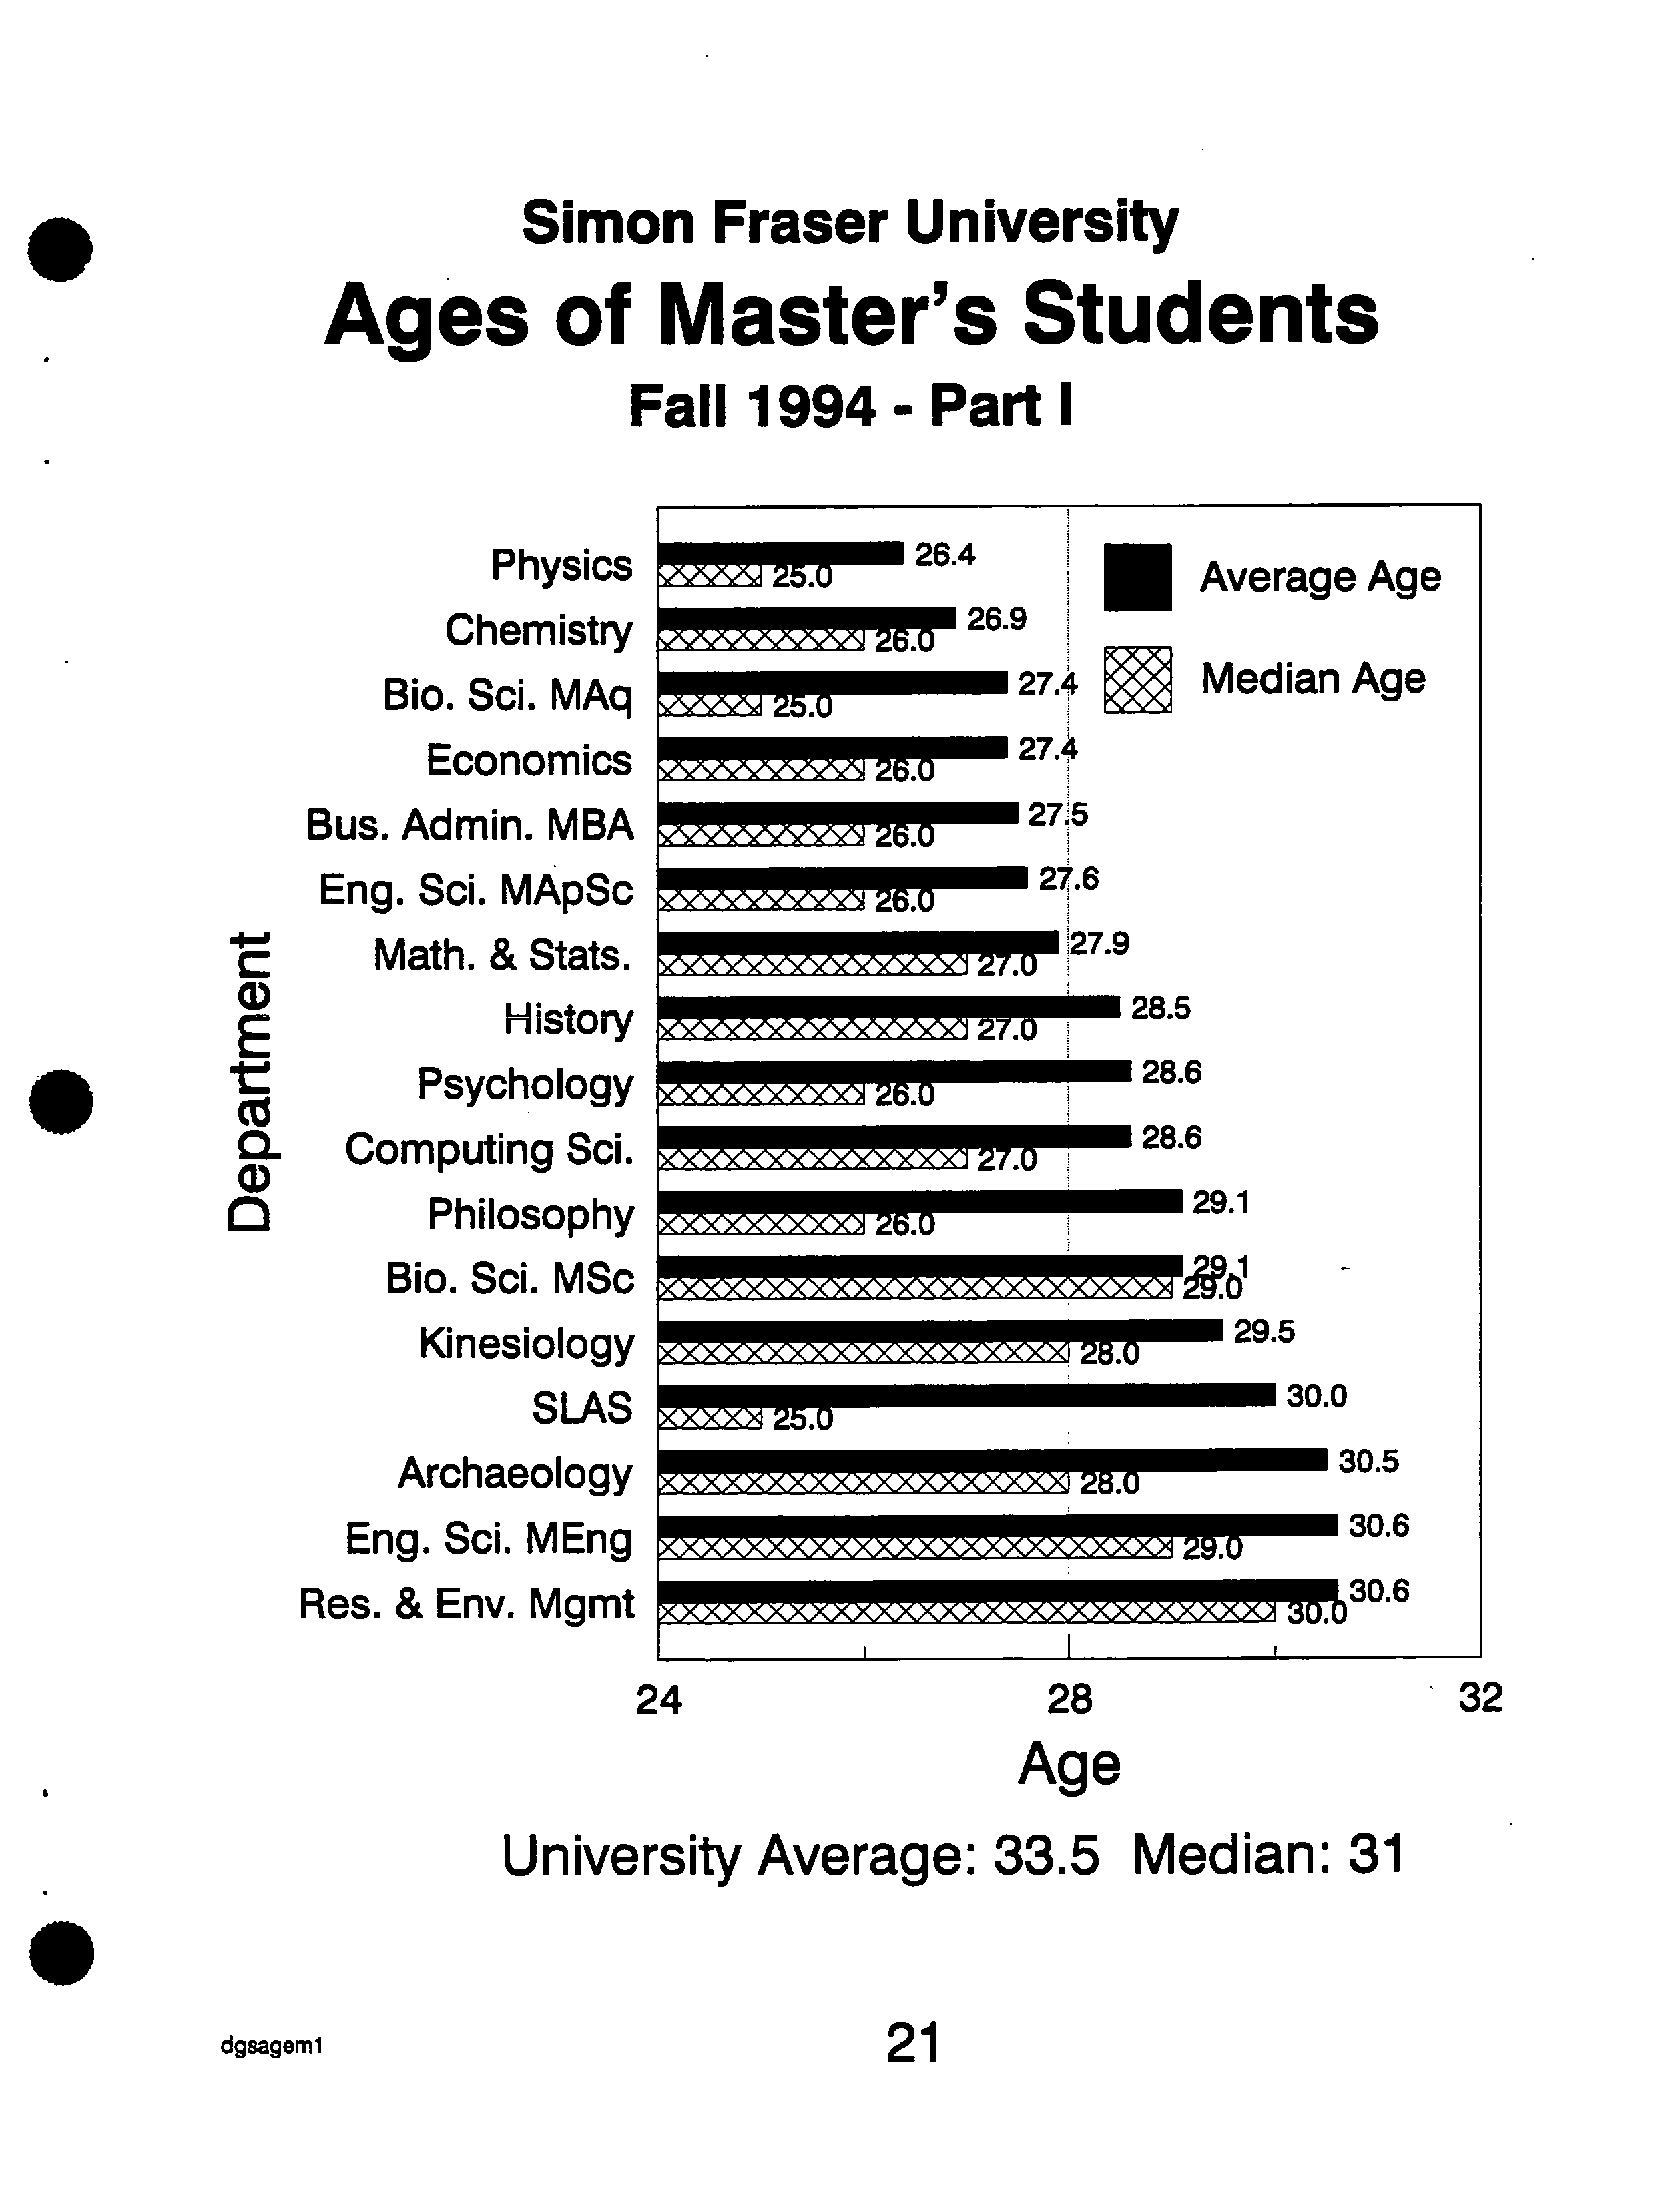
Simon Fraser University
•
?
Ages
of Master's Students
Fall 1994- Part I
26.4
Average Age
1026.9
27.4 ?
Median Age
rm
274
275
27.6
Pi
Physics
Chemistry
Bio. Sd. MAq
Economics
Bus. Admin. MBA
Eng. Sci. MApSc
Math. & Stats.
History
Psychology
CO
CL
Computing Sci.
0
Philosophy
Bio. Sd. MSc
Kinesiology
SLAS
Archaeology
Eng. Sci. MEng
Res. &
Env.
Mgmt
28.5
28.6
28.6
— 29.1
'I
S
S
•I I€+i• : s
I.
• I
S.
24 ?
28
?
32
Age
University Average: 33.5 Median: 31
.
dgsageml
?
21
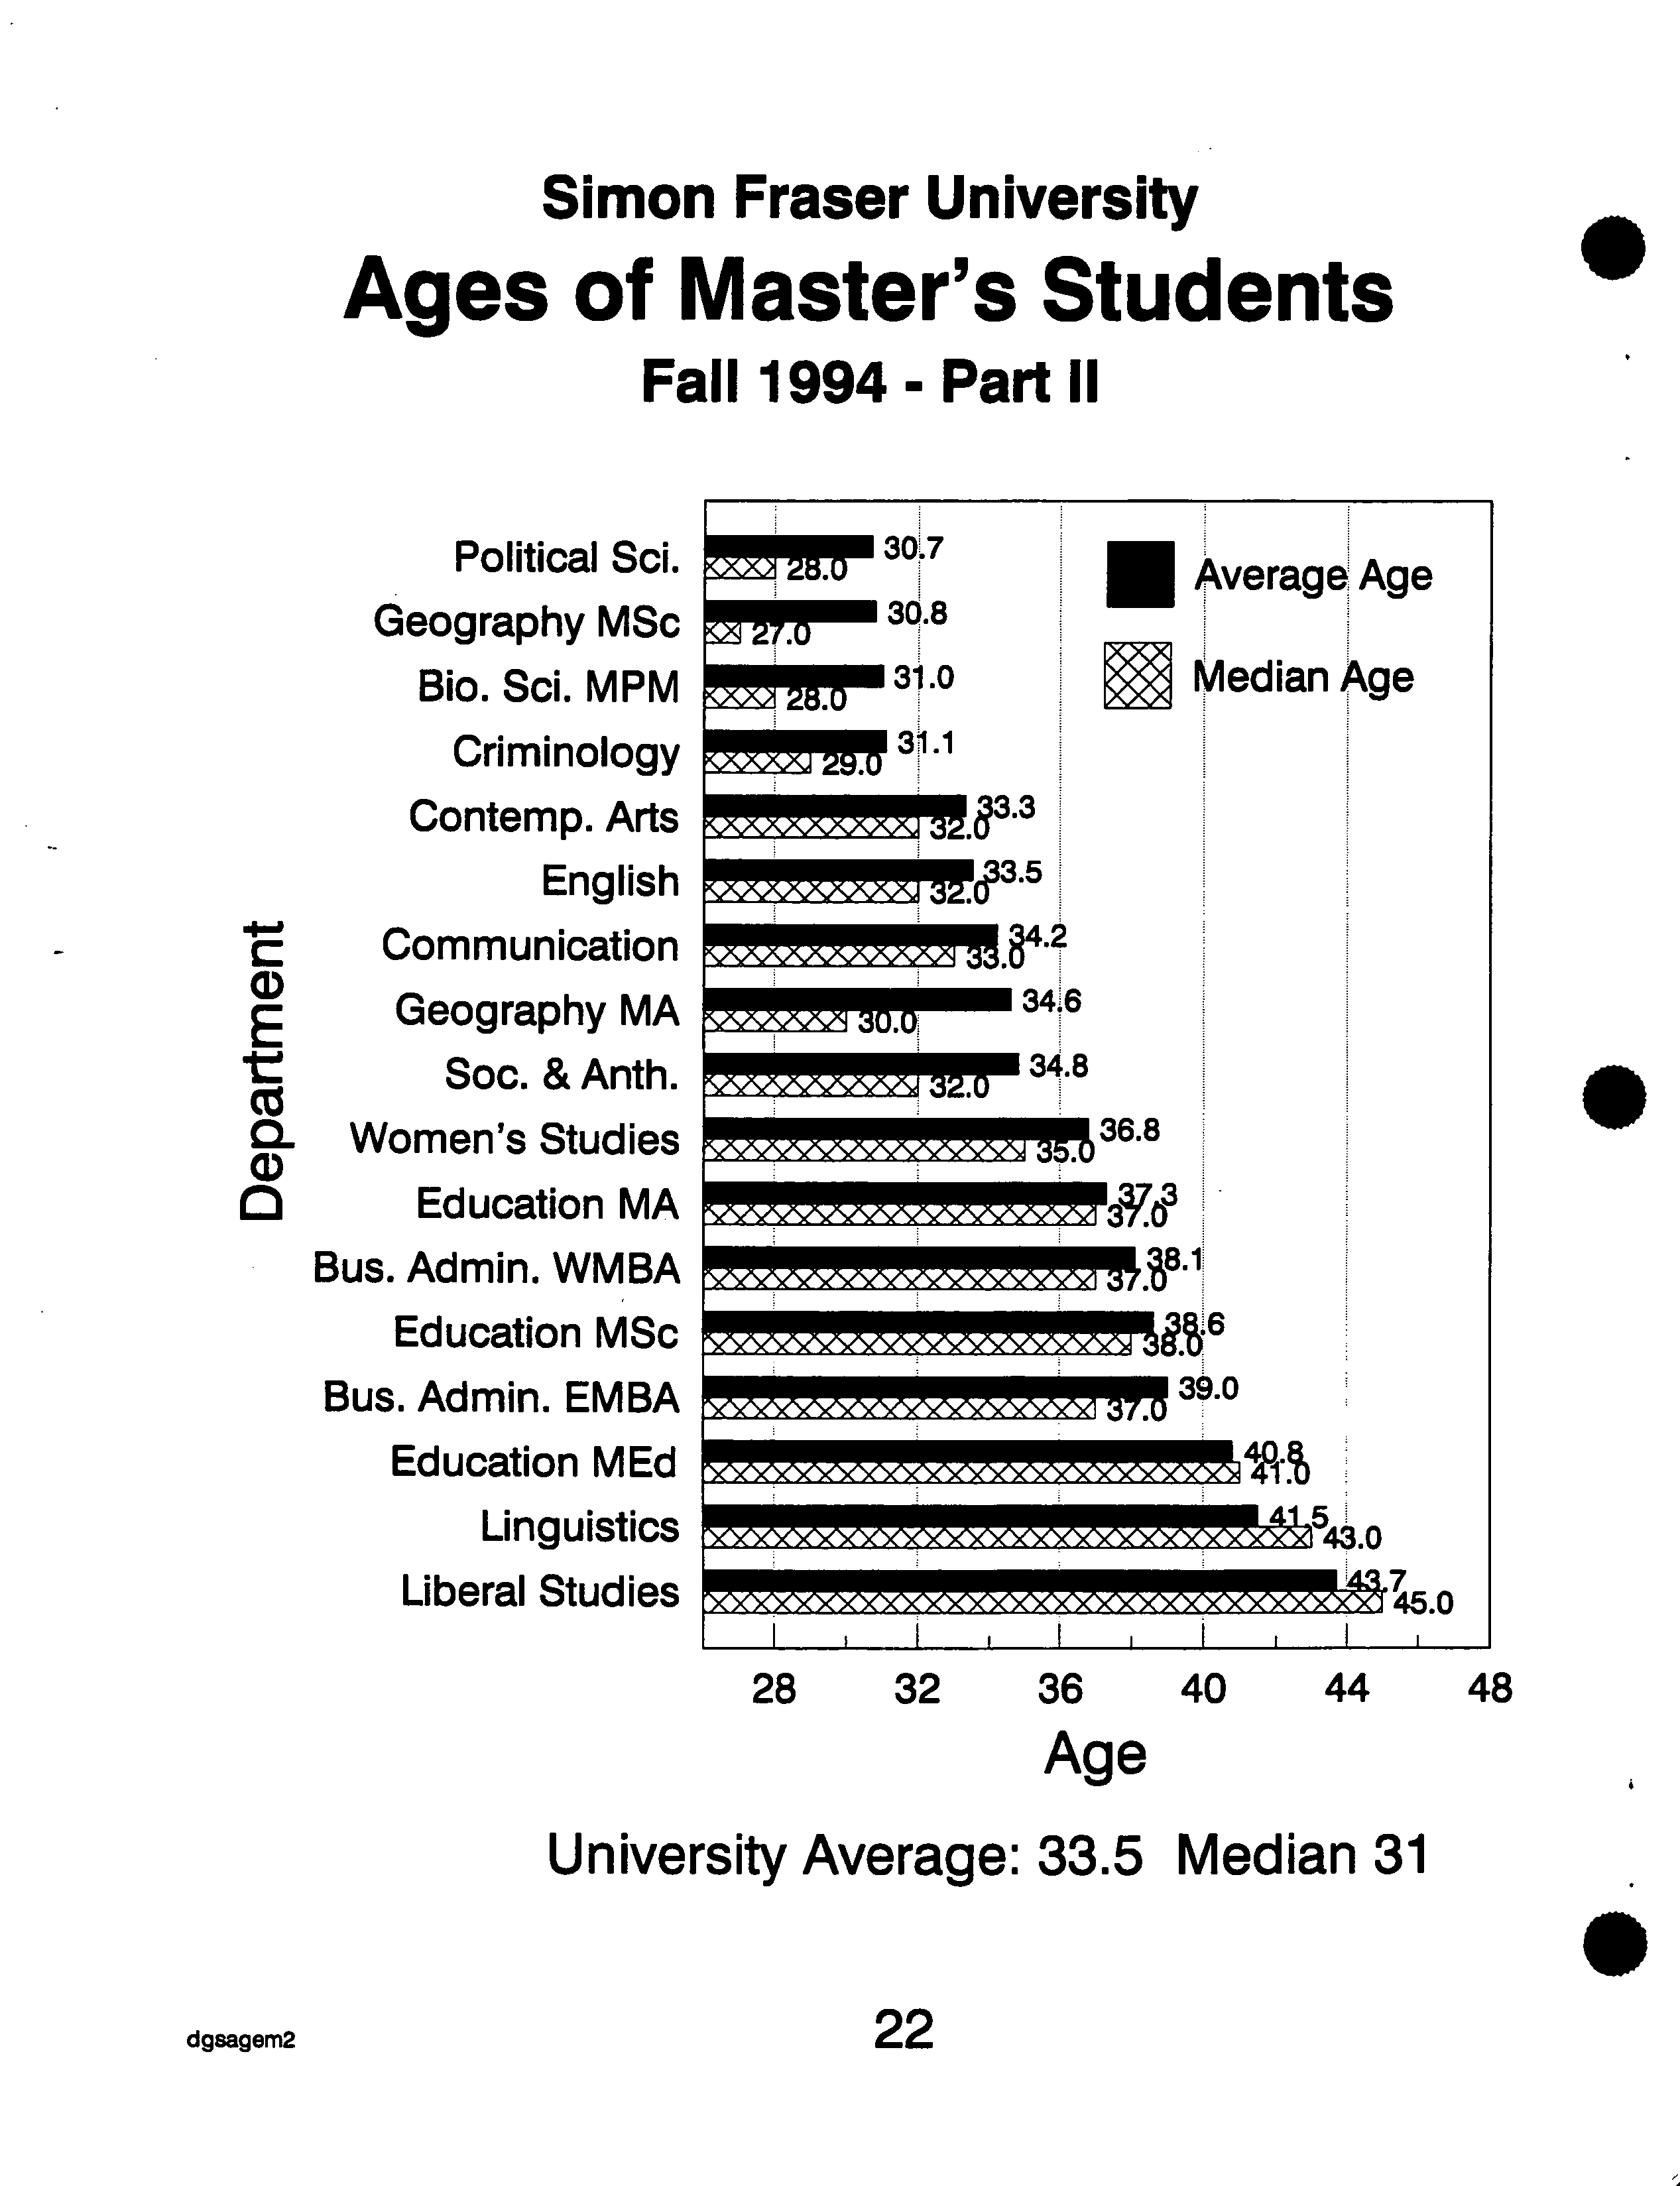
Simon Fraser University
Ages of Master's Students
Fall 1994- Part II
Political Sci.
Geography MSc
Bio. Sci. MPM
Criminology
Contemp. Arts
English
Communication
Geography MA
Soc. & Anth.
cz
Women's Studies
CD
0 ?
Education MA
Bus. Admin. WMBA
Education MSc
Bus. Admin. EMBA
Education MEd
Linguistics
Liberal Studies
28 ?
32 ?
36 ?
40 ?
44
?
48
Age
University Average: 33.5 Median 31
.
dgsagem2 ?
22
L
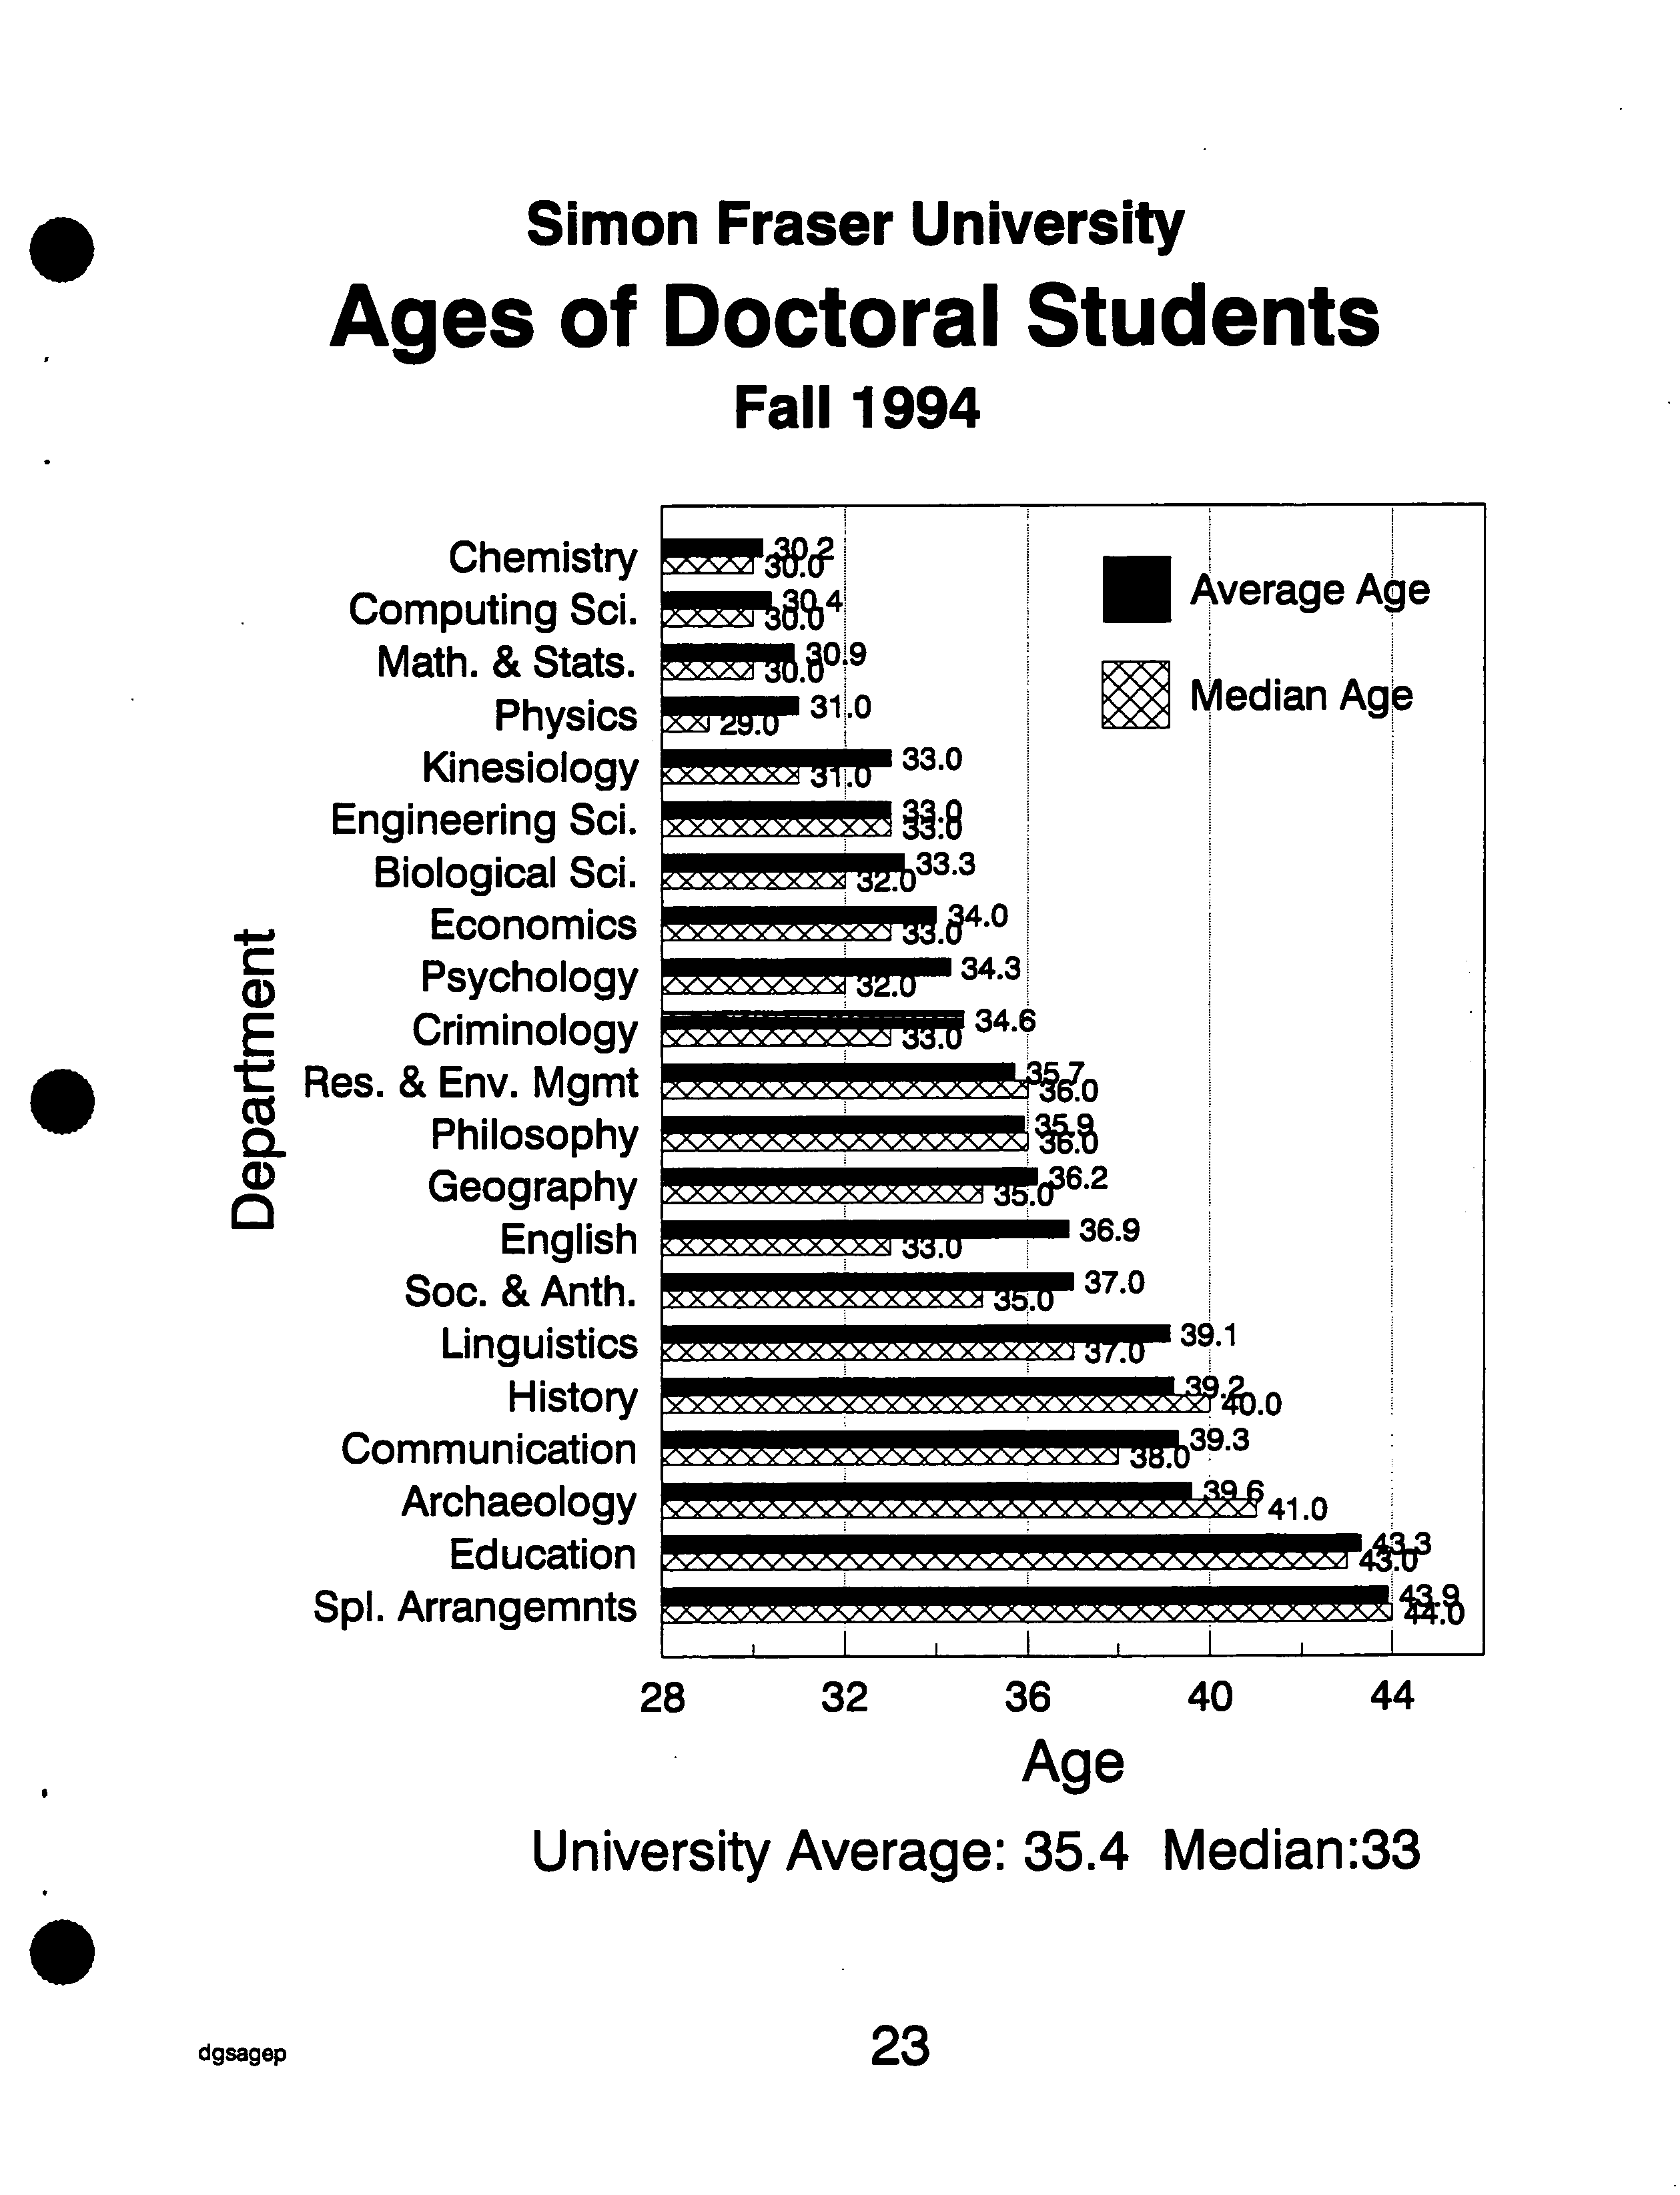
Simon
Fraser
University
Ages of Doctoral Students
Fall 1994
S
Chemistry
Computing Sd.
Math. & Stats.
Physics
Kinesiology
Engineering Sci.
Biological Sci.
Economics
Psychology
E
Criminology
Res. & Env. Mgmt
CL
Philosophy
Geography
English
Soc. & Anth.
Linguistics
History
Communication
Archaeology
Education
Spi. Arrangemnts
PcT,J1
—
!ICjIAI
rcr,IL!
JIk.
?
Median
Age
!Y4IS
-
cTc
wwIcI -
I'
IczW
W4Wa
1s
wwwwM
7.
.
I
I
28 ?
32 ?
36 ?
40 ?
44
Ou
?
Age
University Average: 35.4 Med ian:33
^7
-
dgsagep ?
23
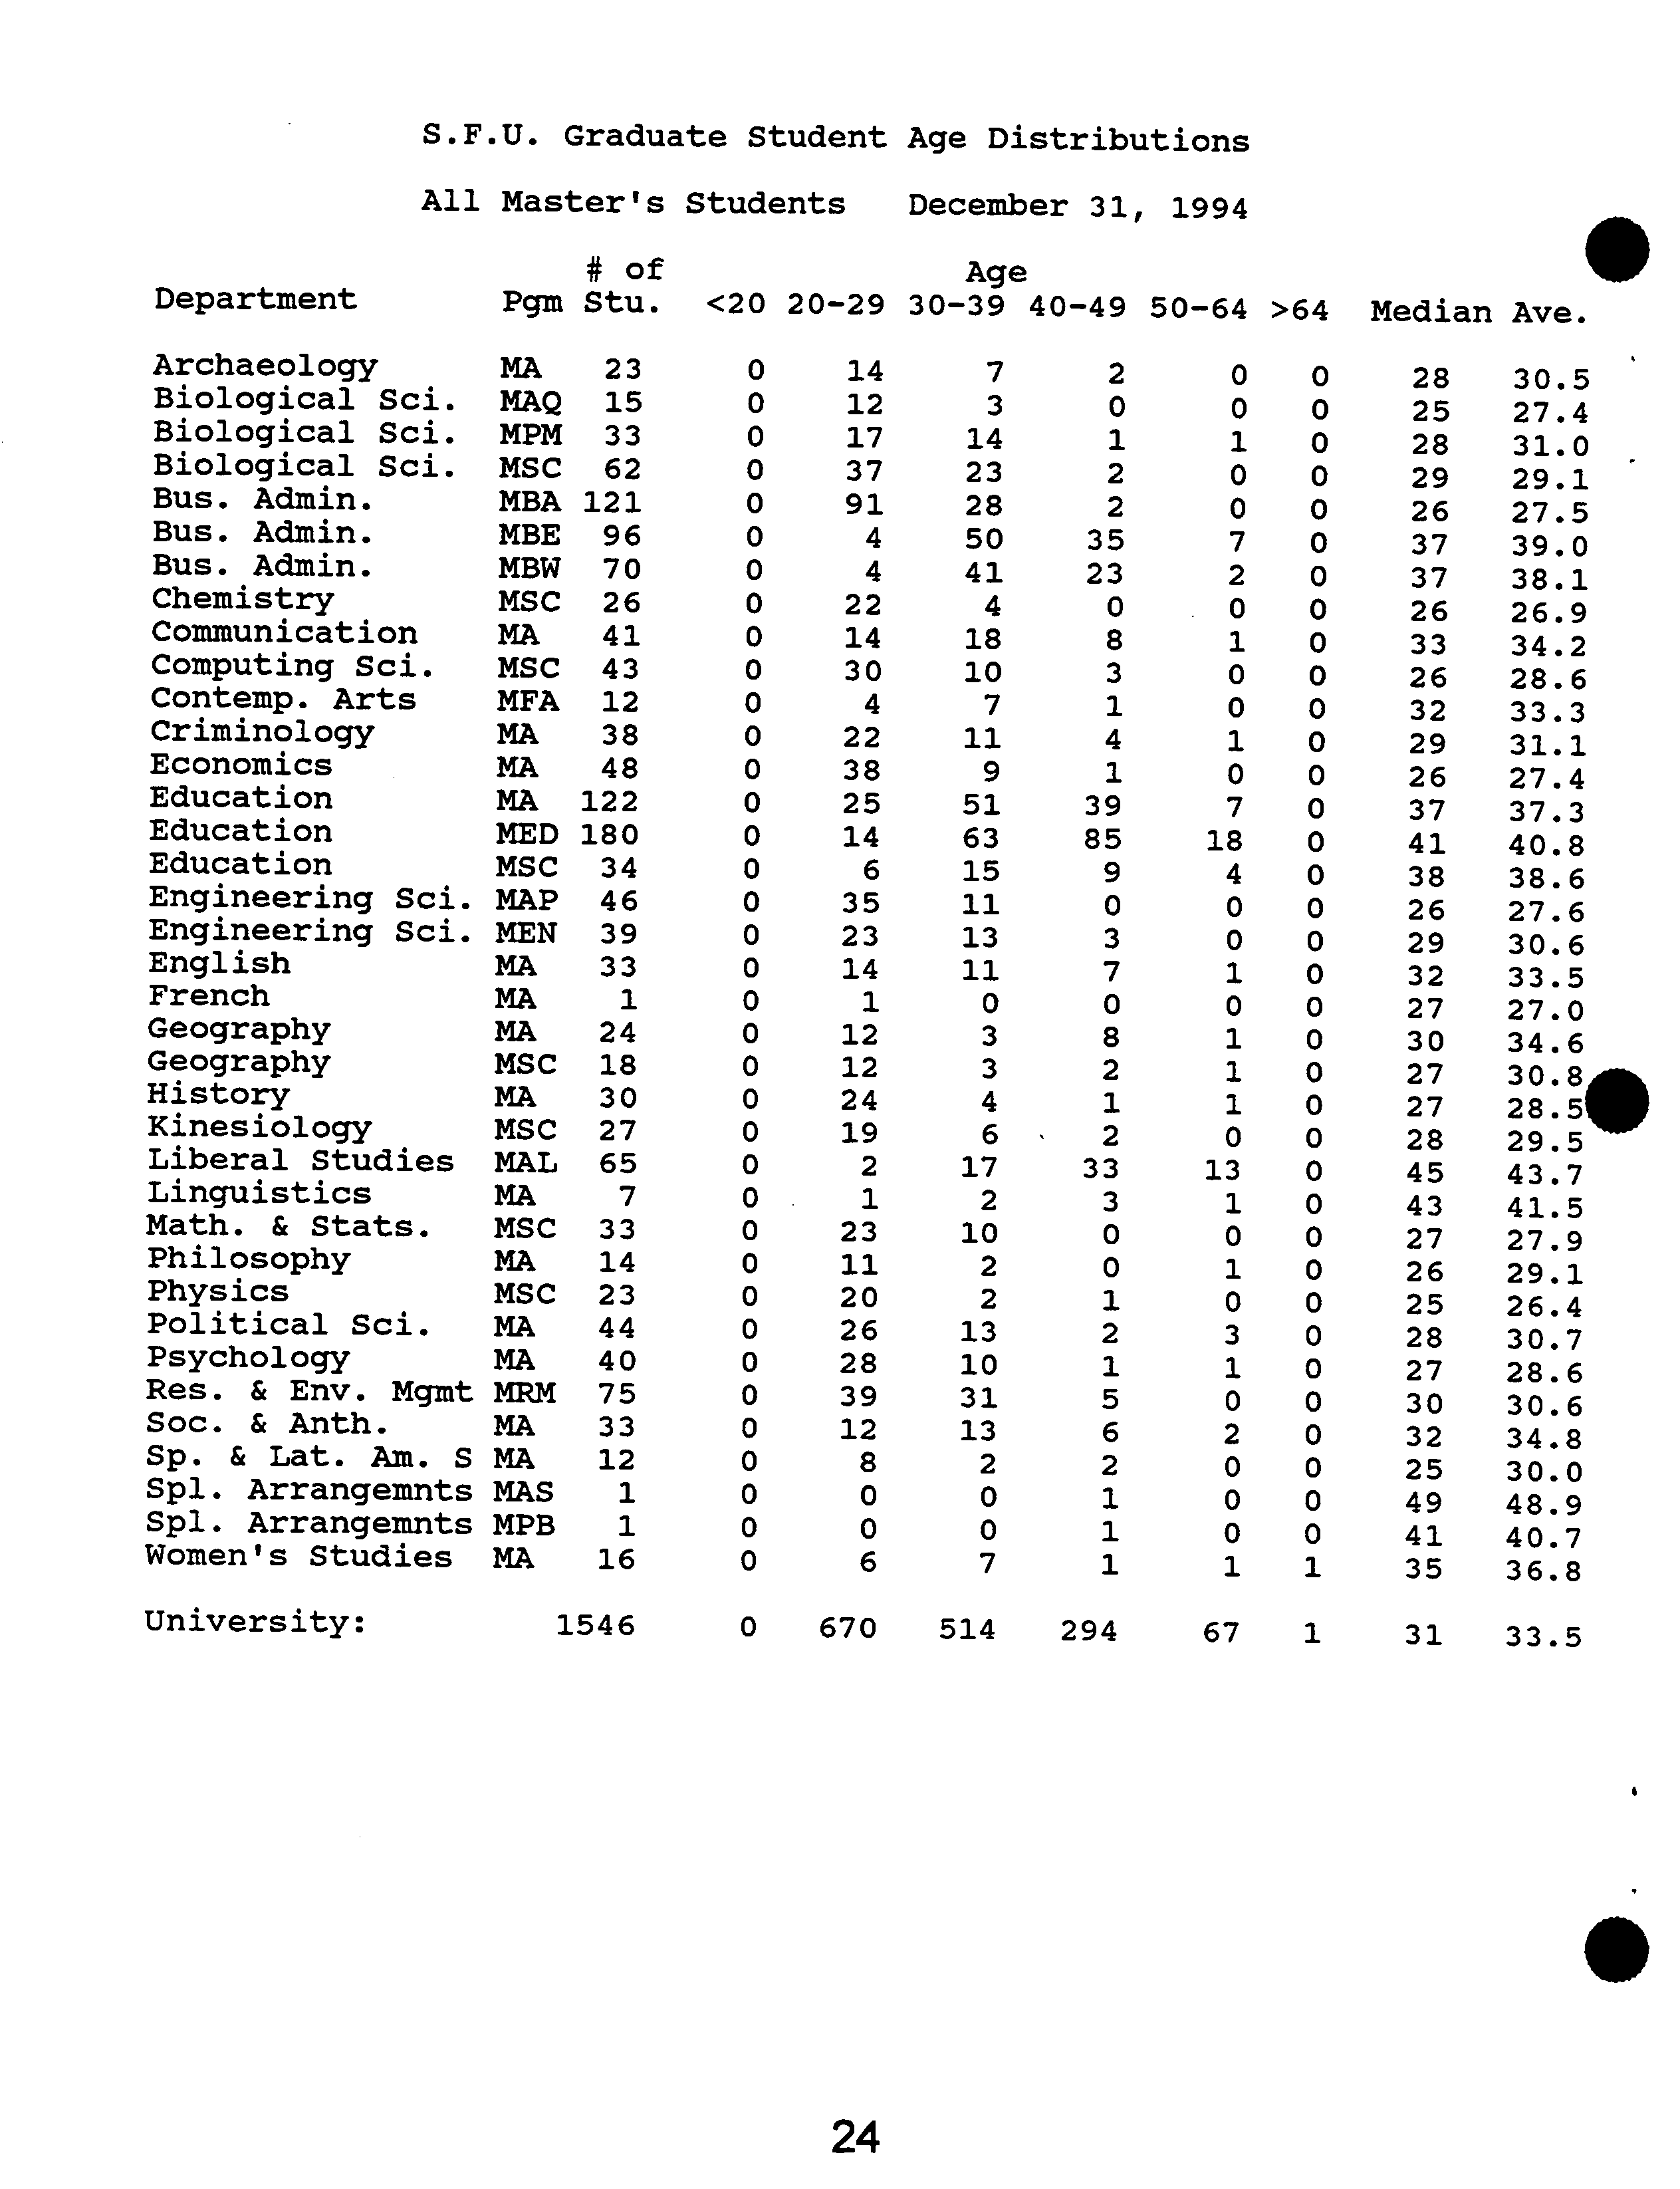
S.F.U. Graduate Student Age Distributions
All
Master's
Students
December 31,
1994
#of
Age
0
Department
Pgm
Stu.
<20
20-29
30-39
40-49
50-64
>64
Median
Ave.
Women's
Res.
Math.
Spi.
Spl.
Soc.
Sp.
HistoryPolitical
PsychologyPhysicsLinguisticsPhilosophyGeographyKinesiologyGeographyEngineering
Engineering
EnglishLiberal
EducationEducationFrenchEconomicsEducationCriminologyContemp.
CommunicationComputing
ChemistryArchaeologyBus.
Bus.
Biological
Bus.
Biological
Biological
&
&
&
ArrangemntsArrangemnts
Admin.Admin.Admin.&
Lat.
Env.
Anth.Stats.
StudiesStudiesArts
Sci.Sci.Am.
Sci.Sci.Sci.
Mgint
Sci.Sci.S
MAMPB
MASMSC
MRHMAMAMAMSCMAMAMAMALMSCMAMAMSCMENMAMAMSCMAPMEDMAMAMAMFAMSCMAMBWMSCMSC
MBE
MBAMPMMAQMA
12218012140
4423167512
33
2724
14
30
33
65
18
46
333934
484341
1238
269670
62332315
17
1
1
000000000000000
0
0000
000000
0
000000
0
0
0
0
28202623
1239
1124
19231212
35
14
2522143830
2214
91
37171214
86
00
2
11
6444
1313
311010
17
15
13
11
51
63
1111411028
18
50
2314
7
2020224
3
6
3
09747
3
33
85
392335
1
2
2
51
21
1
62108017
3
09
3
04181
3
02
22
1
0
13
18
0
2
1100
3
00
0
1
1
0
1104110700
01
20
1
0701000
0
01
000000
0
0
00000
0
0000
00000000
0
0
0
00000
4125
493530272527262843
32
2727284527293026
41
3238
3726
26
29
32
26
33
37262937282528
48.9
40.7
26.4
36.8
34.8
29.1
30.0
28.6
28.5
43.7
41.5
29.5
27.9
30.6
30.7
30.8
34.6
27.0
40.8
30.6
33.5
27.6
27.4
37.3
38.6
28.6
31.1
33.3
34.2
26.9
38.1
27.5
39.0
29.1
27.4
31.0
30.5
University:
1546
0
670
514
294
67
1
31
33.5
S
24
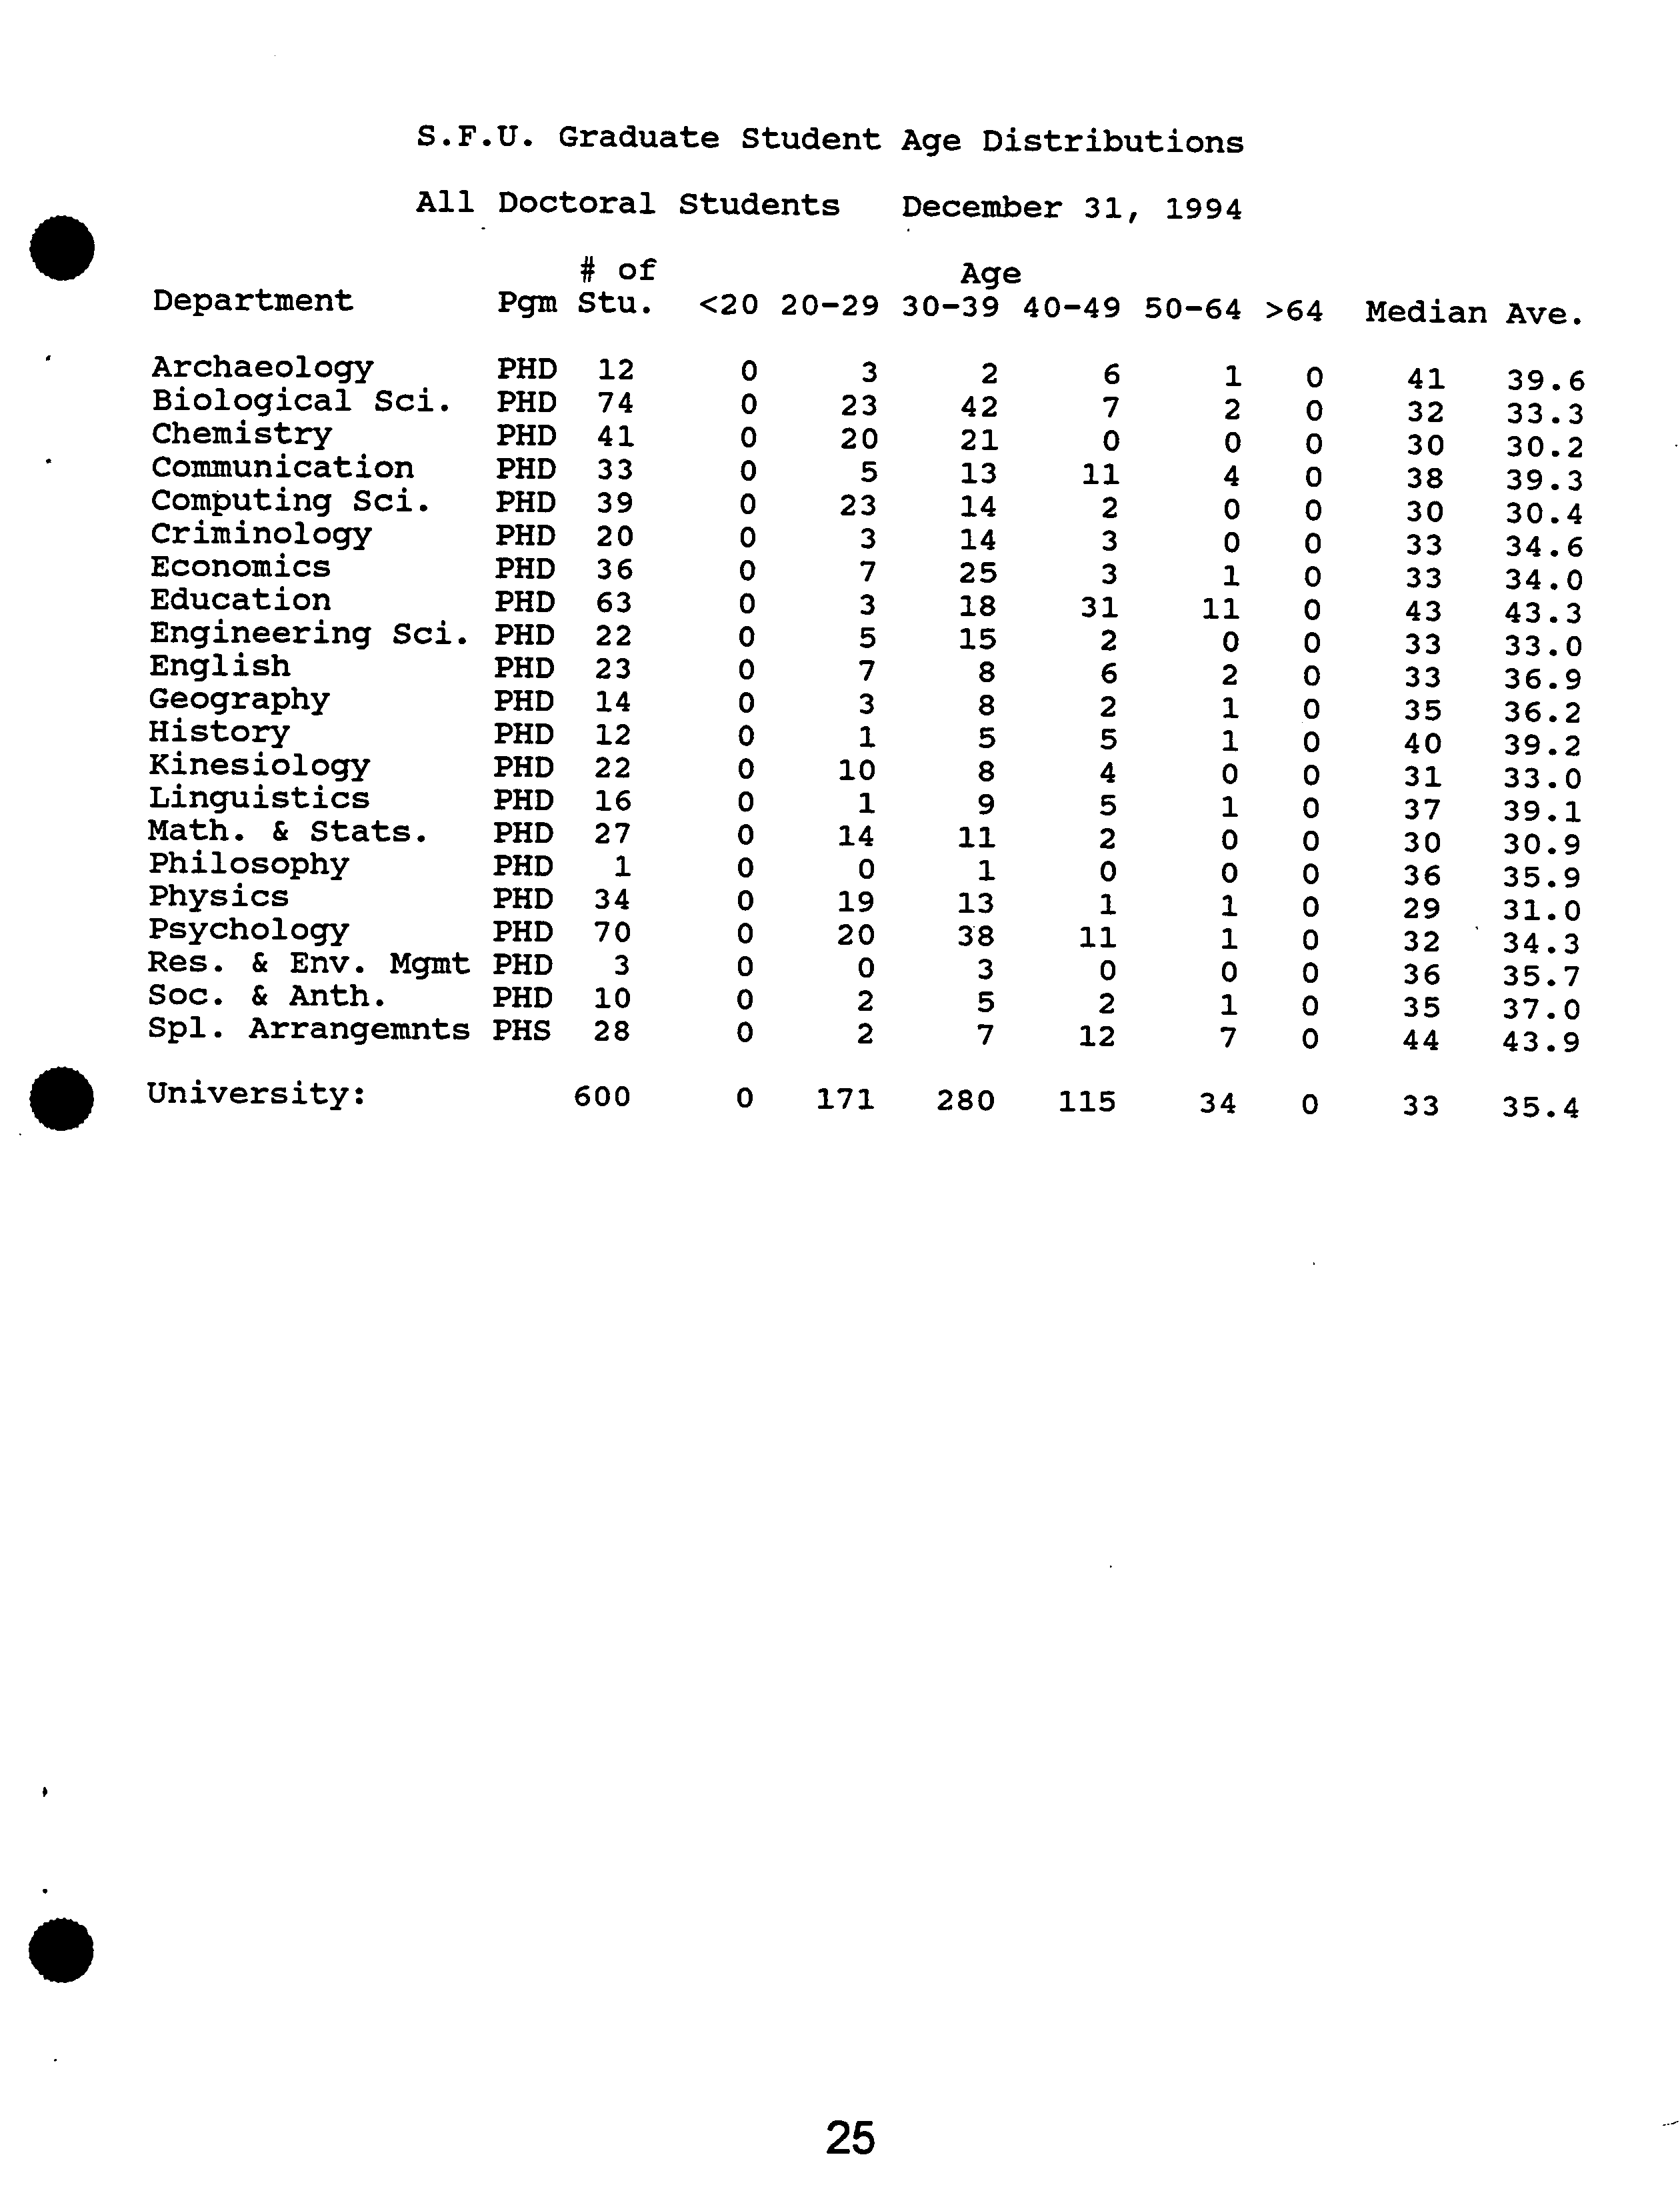
S.F.U. Graduate Student Age Distributions
All
Doctoral
Students
December 31,
1994
#of
Age
Department
Pgm
Stu.
<20
20-29
30-39
40-49
50-64
>64
Median
Ave.
ArchaeologyChemistry
Biological Sci.
PHDPHDPHD
41
7412
00
0
20
23
3
42
21
2
0
7
6
0
2
1
000
41
30
32
30.2
33.3
39.6
•
Res.
Math.
Philosophy
Soc.
Kinesiology
Spi.
PsychologyHistoryPhysicsEnglishLinguisticsGeographyEngineering
EducationEconomicsCriminologyComputing
Communication
Arrangeinnts
&
&Anth.
&
Env.
Stats.Sci.Sci.Mgmt
PHDPHDPHDPHDPHD
PHS
PHDPHDPHDPHDPHDPHDPHDPHDPHDPHDPHDPHD
2870222734102316
142212
20
63
3639
33
1
3
0000
00
0
0
00
0
0
00
0
00
0
20
19141023
22
071
0
3
715
33
5
11
1338
1525
18131414
7588
51
3
98
12
113111
2
5
2
40
5
0
1
22
6
32
3
11
7
11010
0
11
02
0114
0
0
0000000
0
0
0
000
0
0
0
00
443529
32
40
303636353731
33334333
30
3338
43.9
35.7
31.0
34.3
35.9
37.0
33.0
30.9
39.1
39.2
43.3
36.9
36.2
33.0
34.0
34.6
30.4
39.3
University:
600
0
171
280
115
34
0
33
35.4
.
25
Bio. Sci. MAq
?
Bus. Admin. WMBA
?
Eng. Sci. MApSc?
Economics
?
Bus. Admin. MBA
?
Contemp. Arts?
Math. & Stats.
?
Philosophy ?
Geography MSc
?
Computing Sd.
?
Psychology ?
Physics
?
Chemistry?
Bus. Admin. EMBA
Kinesiology?
Bio. Sci. MPM
?
Women's Studies
History
E
Cz
C)
0
.
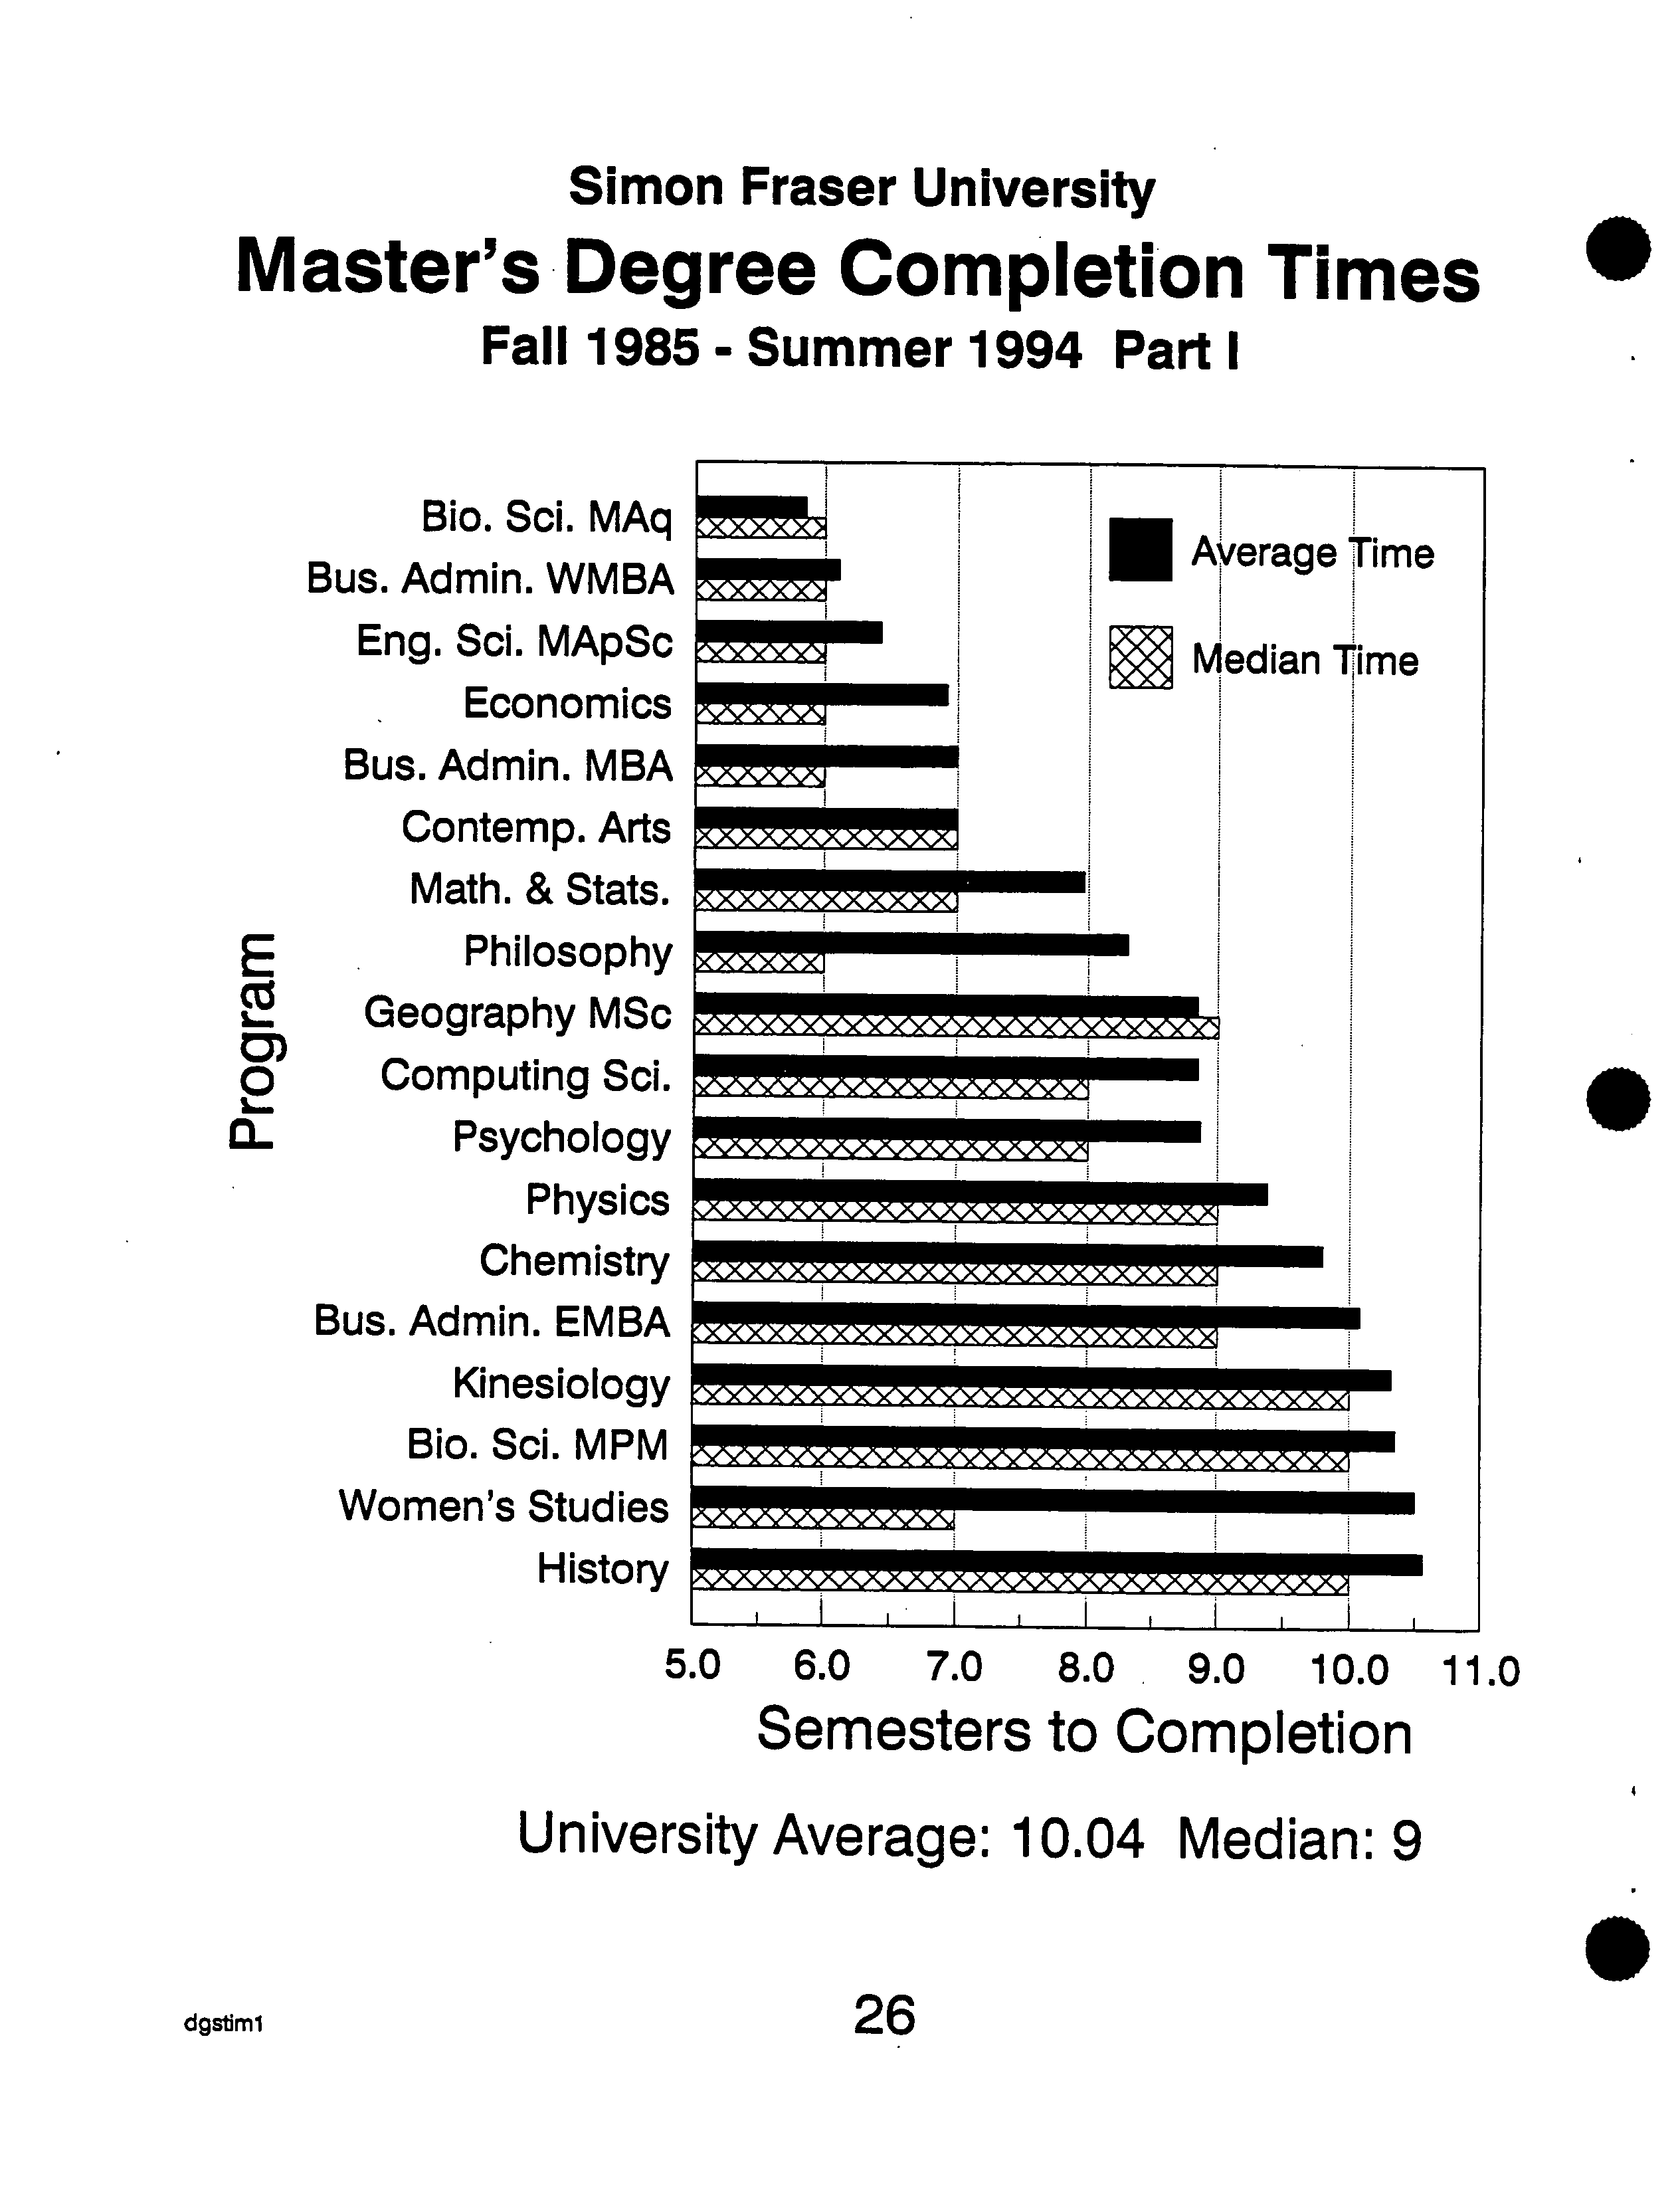
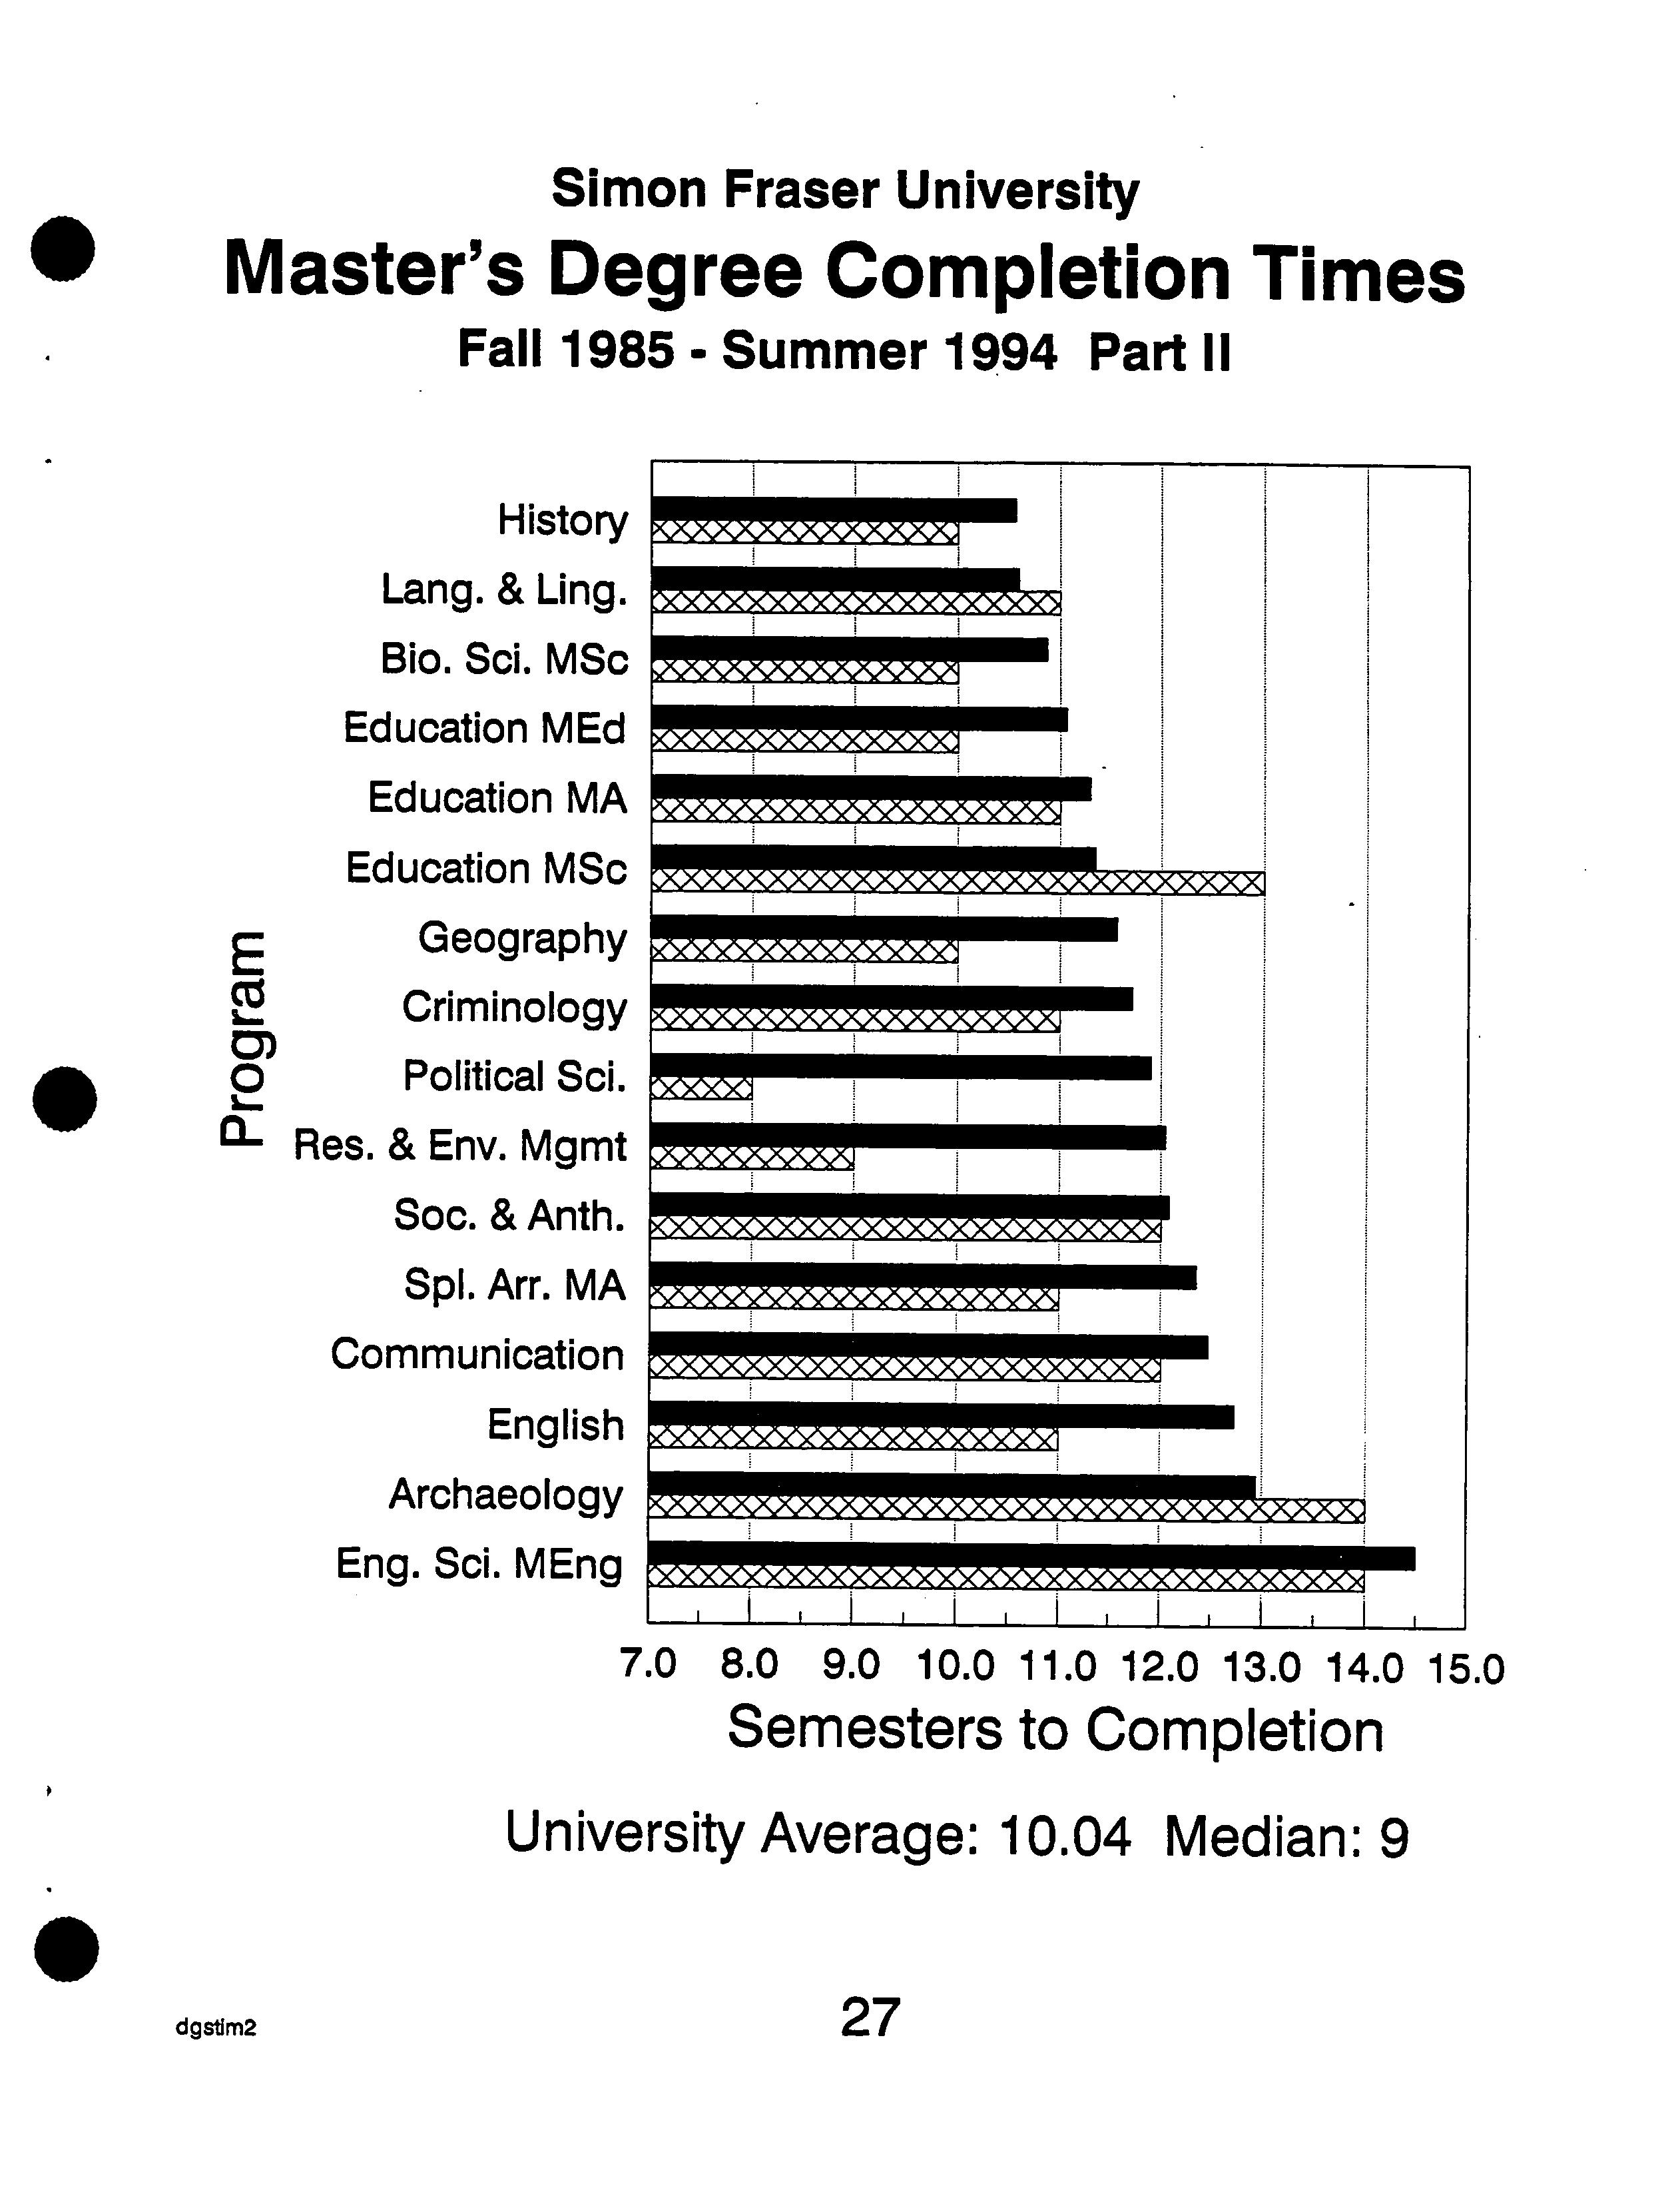
Simon Fraser University
Master's
?
Completion
Fall 1985 - Summer 1994 Part I
Times
.
5.0 ?
6.0 ?
7.0 ?
8.0 ?
9.0 ?
10.0 11.0
Semesters to Completion
University Average: 10.04 Median: 9
a
dgstiml ?
26
9
Math. & Stats.
Physics
Education
Computing Sd.
Kinesiology
Biological Sd.
SpI. Arrangemnts
Chemistry
Communication
English
Psychology
Economics
Lang. & Ling.
Criminology
History
Geography
Archaeology
Soc. & Anth.
E
cz
I.-
0
0
S
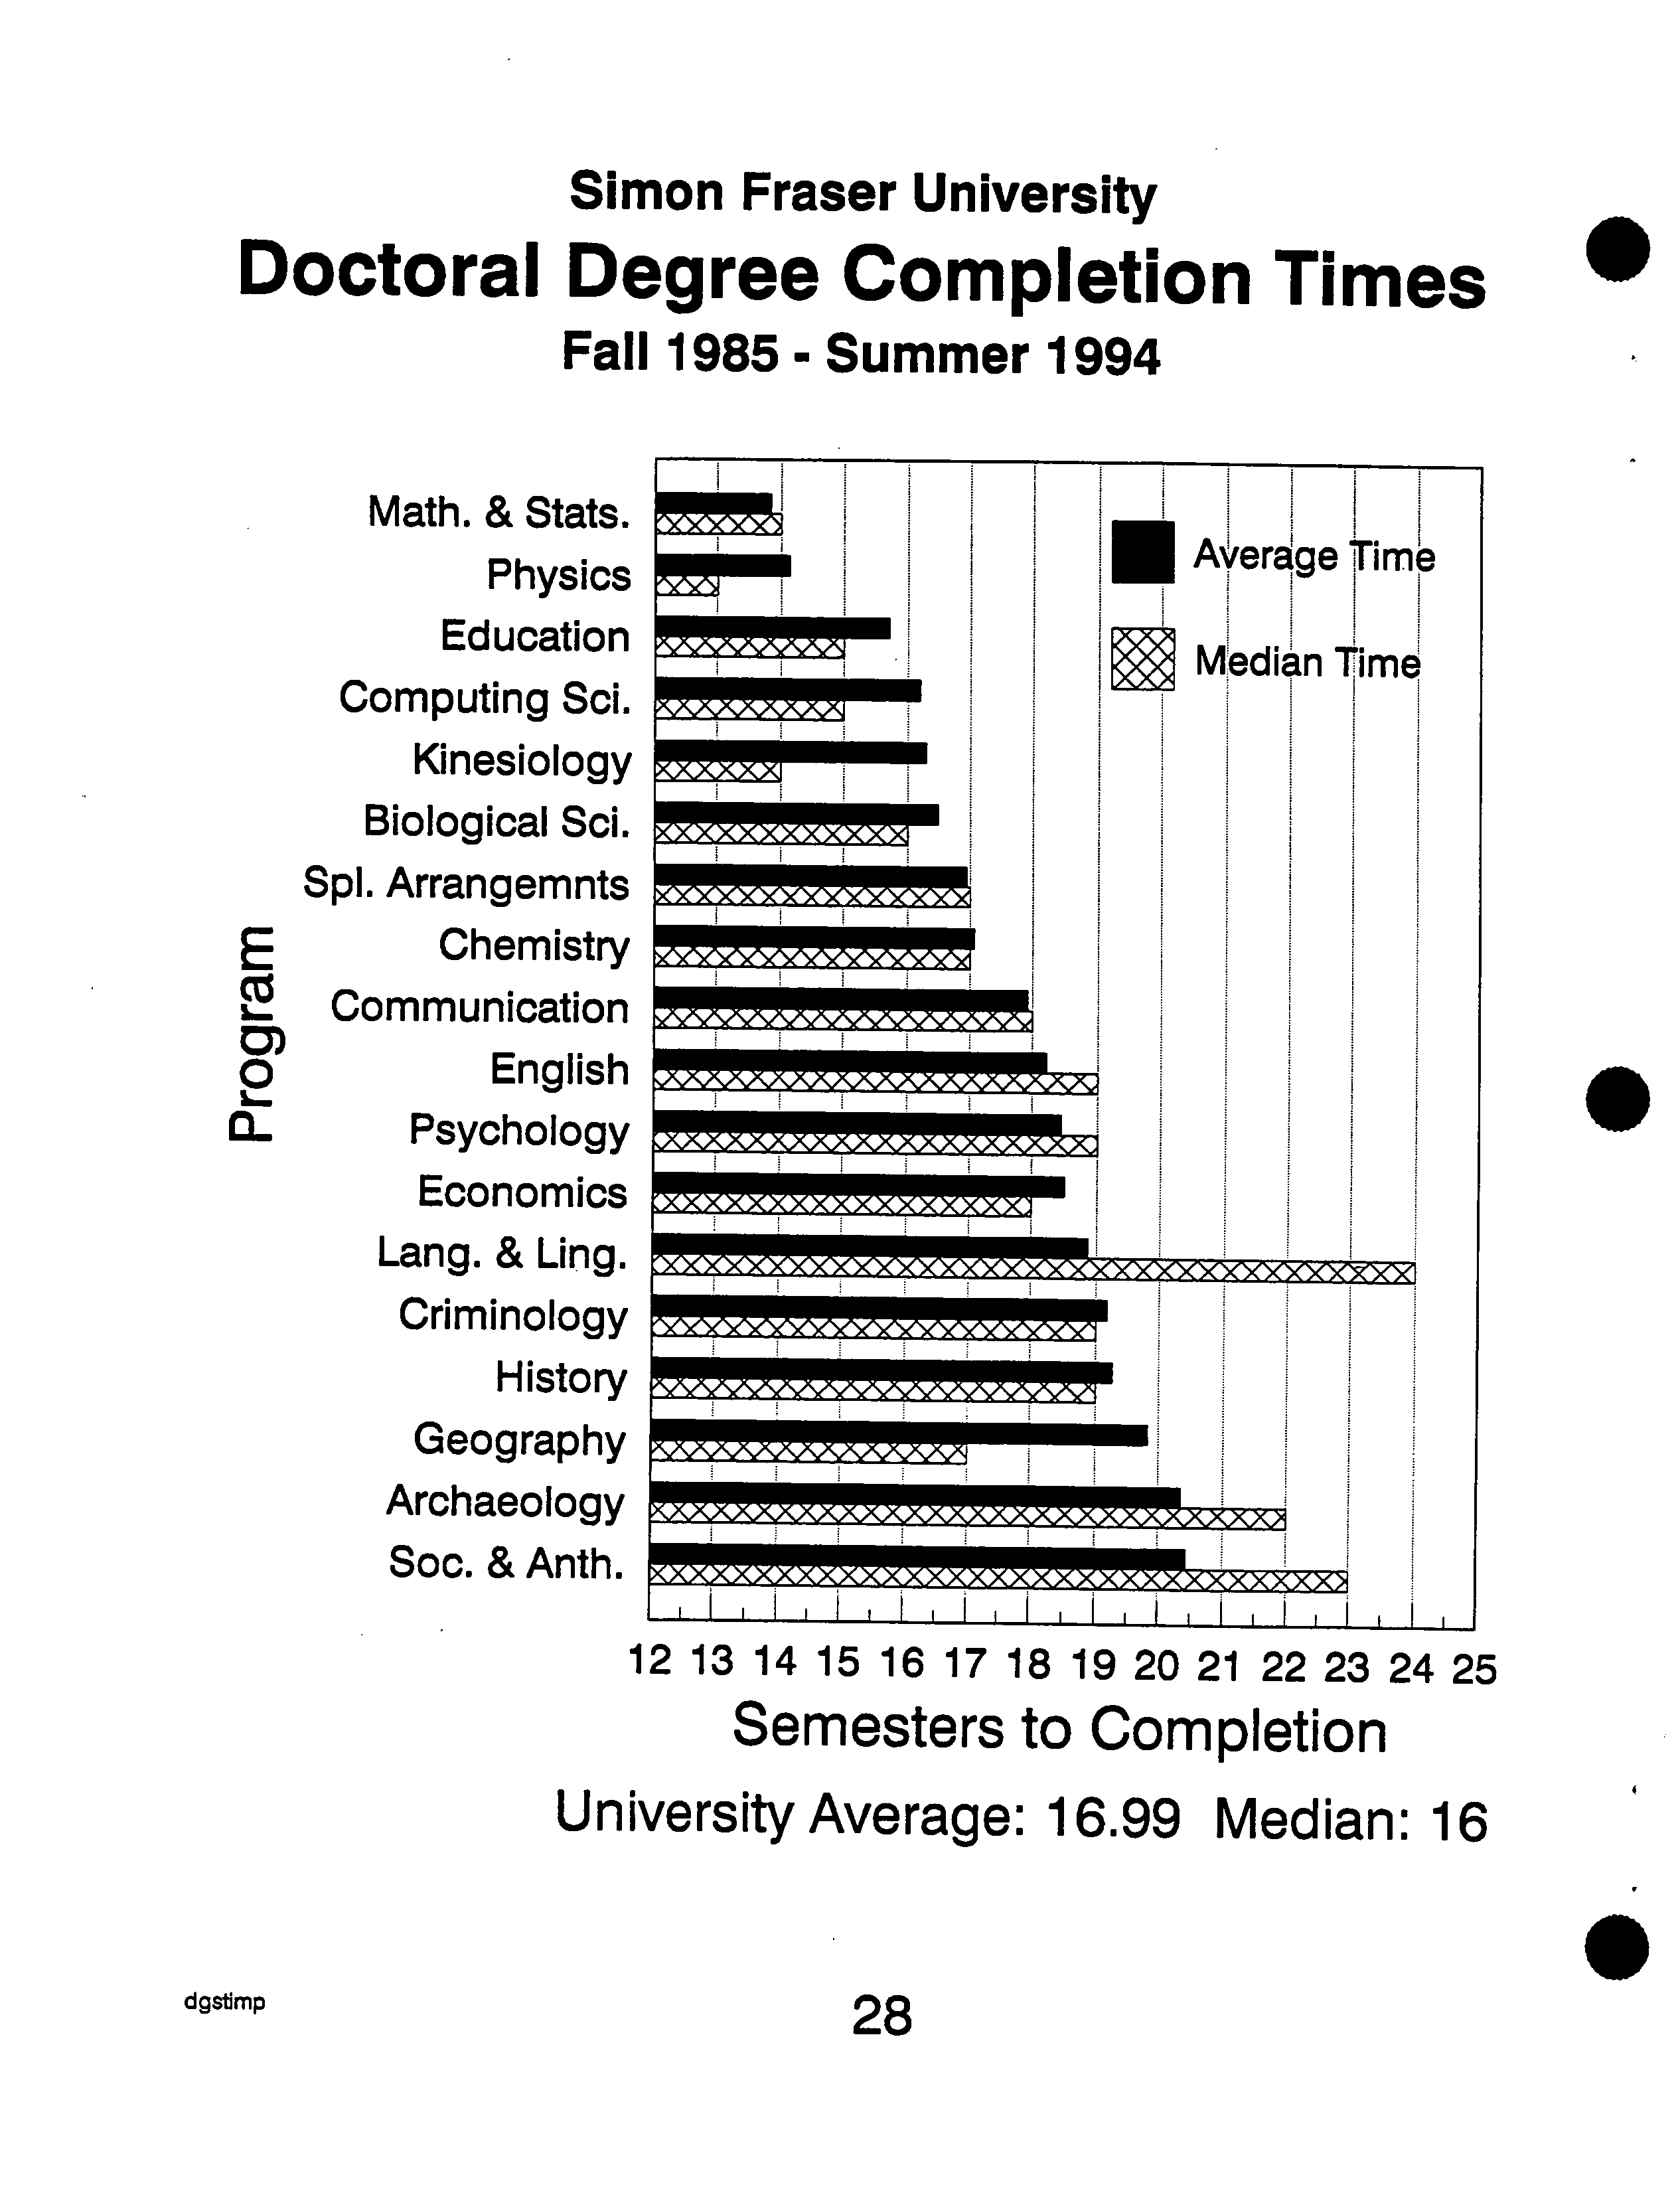
Simon Fraser University
Doctoral Degree Completion
Fall 1985- Summer 1994
Times
.
12 13 14 15 16 17 18 19 20 21 22 23 24 25
Semesters to Completion
University Average: 16.99 Median: 16
a
dgstimp ?
28
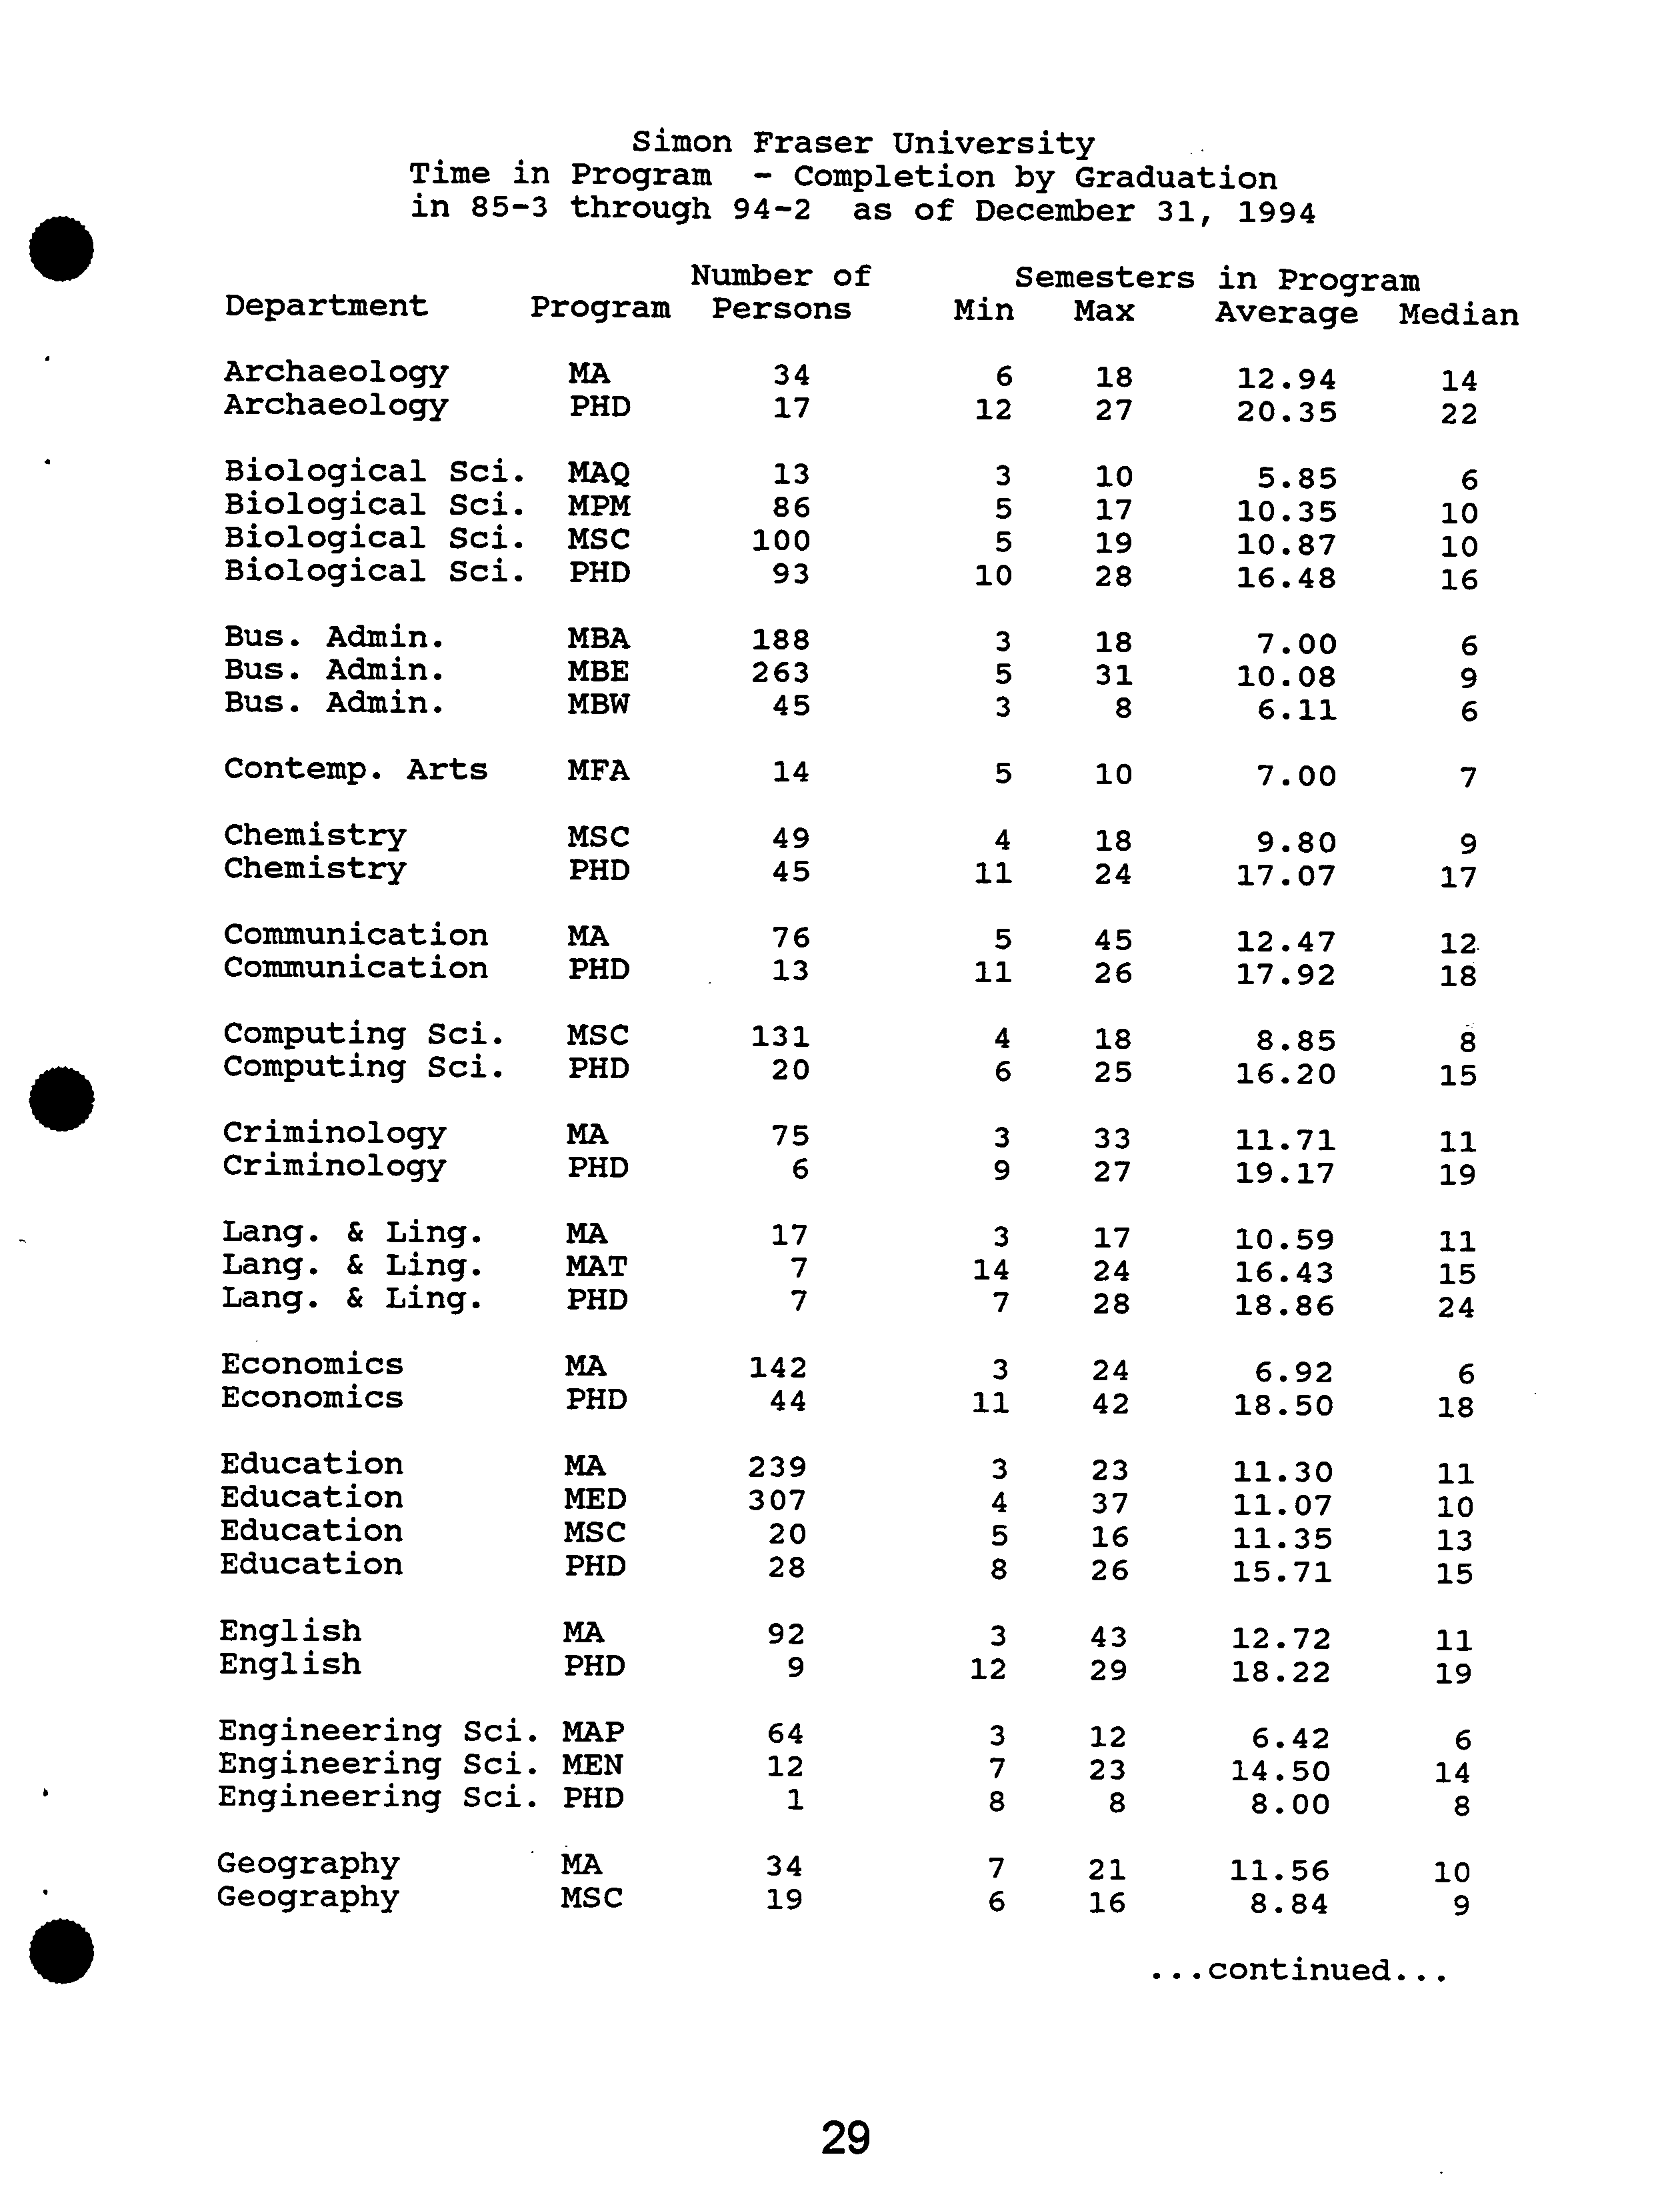
Simon
Fraser
University
Time in
Program
- Completion by
Graduation
in 85-3
through
94-2
?
as of December 31, ?
1994
Number of
Semesters in Program
Department ?
Program ?
Persons
Min
Max
Average
Median
ArchaeologyArchaeology
MA
PHD
3417
12
6
2718
20.3512.94
22
14
Biological
Biological
Biological
Biological
Sci.Sci.Sci.Sci.
MAQMSCMPMPHD
100
8693
13
10
55
3
28191710
10.8716.4810.355.85
16
10
10
6
Bus.
Bus.
Bus. Admin.Admin.Admin.
MBW
MBE
MBA
26318845
5
33
18
31
8
10.087.006.11
9
6
6
Contemp. Arts
MFA
14
5
10
7.00
7
ChemistryChemistry
MSCPHD
4945
11
4
24
18
17.079.80
17
9
CommunicationCommunication
MA
PHD
76
13
11
5
2645
12.4717.92
12.
18
Computing Sci.
MSC
131
4
18
8.85
8
.
Computing Sci.
PHD
20
6
25
16.20
15
CriminologyCriminology
MA
PHD
75
6
9
3
27
33
11.7119.17
11
19
Lang.
Lang.
Lang.
&
&
&
Ling.Ling.Ling.
MATMAPHD
17
77
14
7
3
242817
18.8610.5916.43
24
11
15
EconomicsEconomics
MA
PHD
142
44
11
3
2442
18.506.92
18
6
EducationEducationEducationEducation
MSCMAMEDPHD
239307
2820
8
4
5
3
26
371623
15.7111.3511.0711.30
15
10
13
11
EnglishEnglish
MA
PHD
92
9
12
3
2943
12.7218.22
11
19
Engineering
Engineering
Engineering
Sci.Sci.Sci.
MENMAPPHD
1264
1
8
7
3
23
12
8
14.508.00
6.42
14
8
6
GeographyGeography
MSCMA
3419
76
21
16
11.568.84
10
9
continued...
29
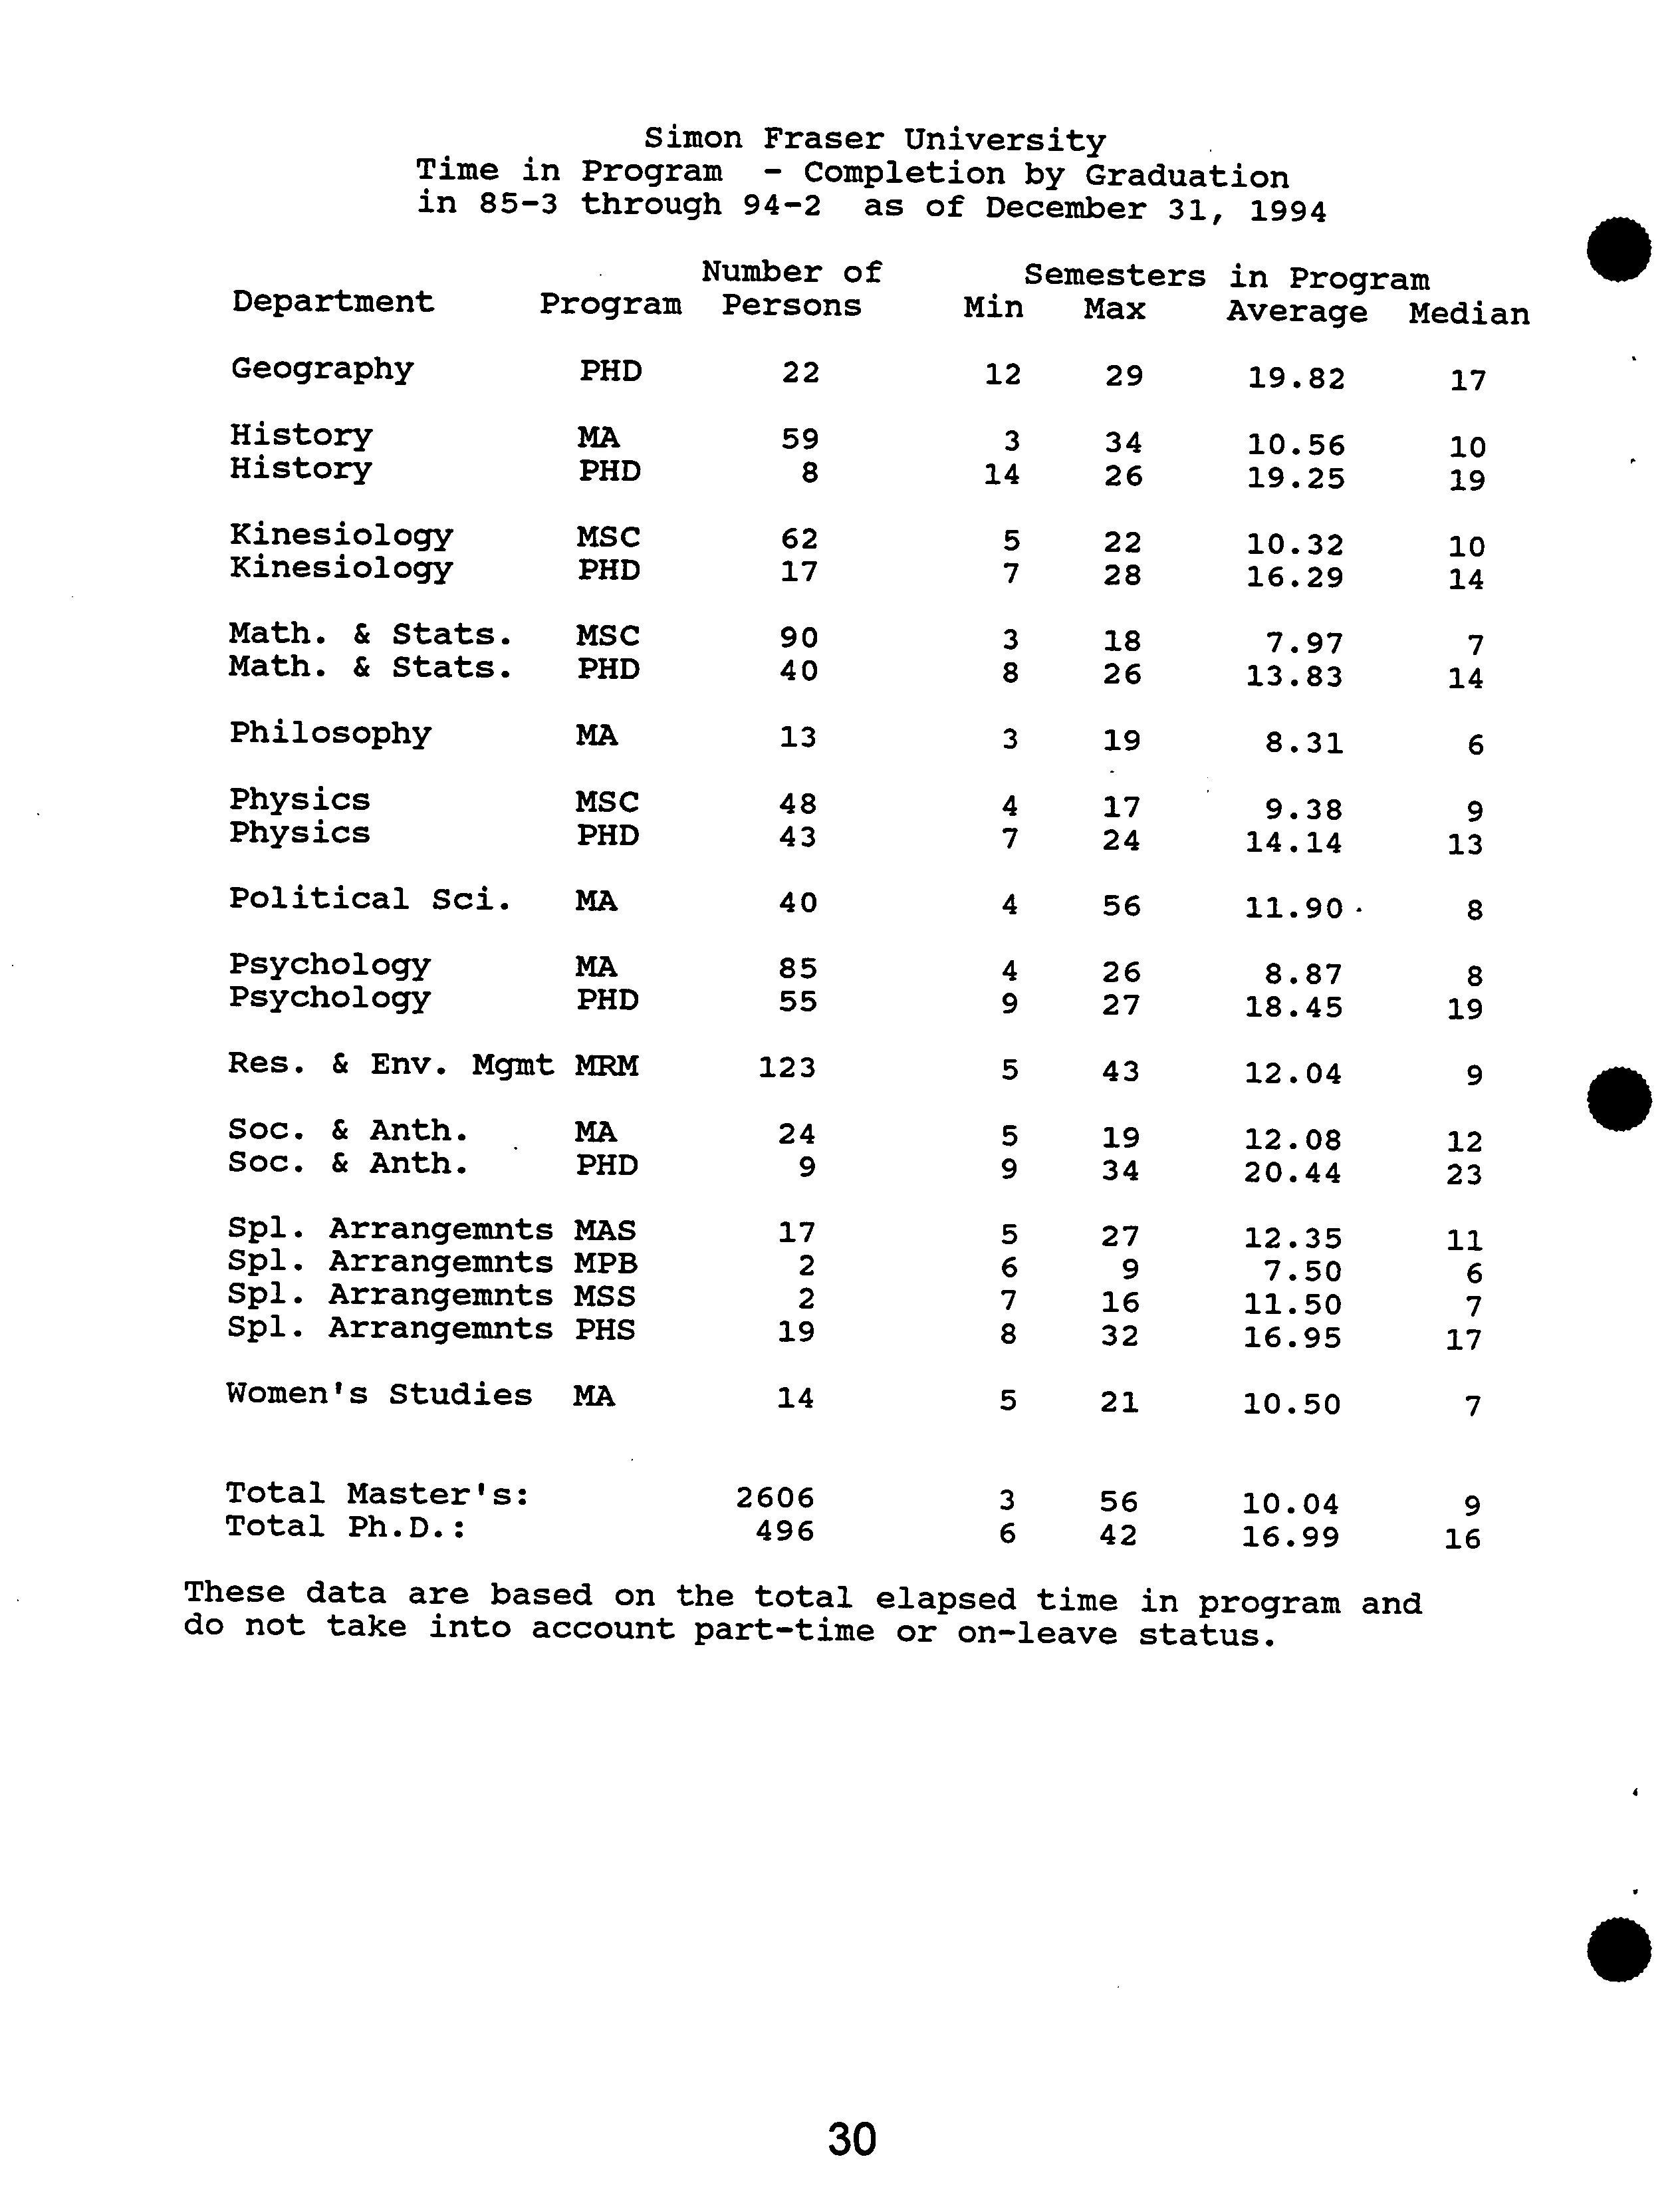
Simon
Fraser
University
Time in
Program
- Completion by
Graduation
in 85-3
through
94-2
?
as of December 31,
1994
Number of
Semesters
in Program
Department
?
Program ?
Persons
min
Max
Average ?
Median
Geography
PHD
22
12
29
19.82
17
HistoryHistory
MA
PHD
59
8
14
3
26
34
19.2510.56
10
19
KinesiologyKinesiology
MSCPHD
1762
7
5
28
22
16.2910.32
10
14
Math.
Math. &
&
Stats.Stats.
MSCPHD
4090
8
3
26
18
13.837.97
14
7
Philosophy
MA
13
3
19
8.31
6
PhysicsPhysics
MSCPHD
4843
7
4
2417
14.149.38
13
9
Political Sci.
MA
40
4
56
11.90-
8
PsychologyPsychology
MA
PHD
8555
94
2627
18.458.87
19
8
Res. & Env. Mgmt
MRM
123
5
43
12.04
9
Soc.
Soc.
&
& Anth.Anth.
MA
PHD
24
9
9
5
3419
20.4412.08
23
12
Spi.
Spl.
Spi.
Spl.
ArrangemntsArrangemntsArrangemntsArrangemnts
MSSMAS
MPB
PHS
1917
22
78
56
273216
9
16.9511.5012.357.50
17
11
7
6
Women's Studies
MA
14
5
21
10.50
7
Total
Total
Ph.D.:Master's:
??
2606496
??
6
3 ??
4256
??
16.9910.04 ??
16
9
These data are based on the total elapsed time in program and
do not take into account part-time or on-leave status.
30
Geography MA
Soc. & Anth.
Women's Studies
Bio. Sd. MPM
Chemistry
Archaeology
History
Kinesiology
Political Sd.
Psychology
Communication
It
Eng. Sci. MEng
cz
Math. & Stats.
CL
CD
Physics
Res. & Env. Mgmt
Computing Sci.
Criminology
Economics
English
Blo. Sd. MSc
Bus. Admin. MBA
Bus. Admin. EMBA
Education MA
Education MEd
4
4
4
10
10
11
112
E112
112
1112
112
13
111113
14
14
1
1
35
40
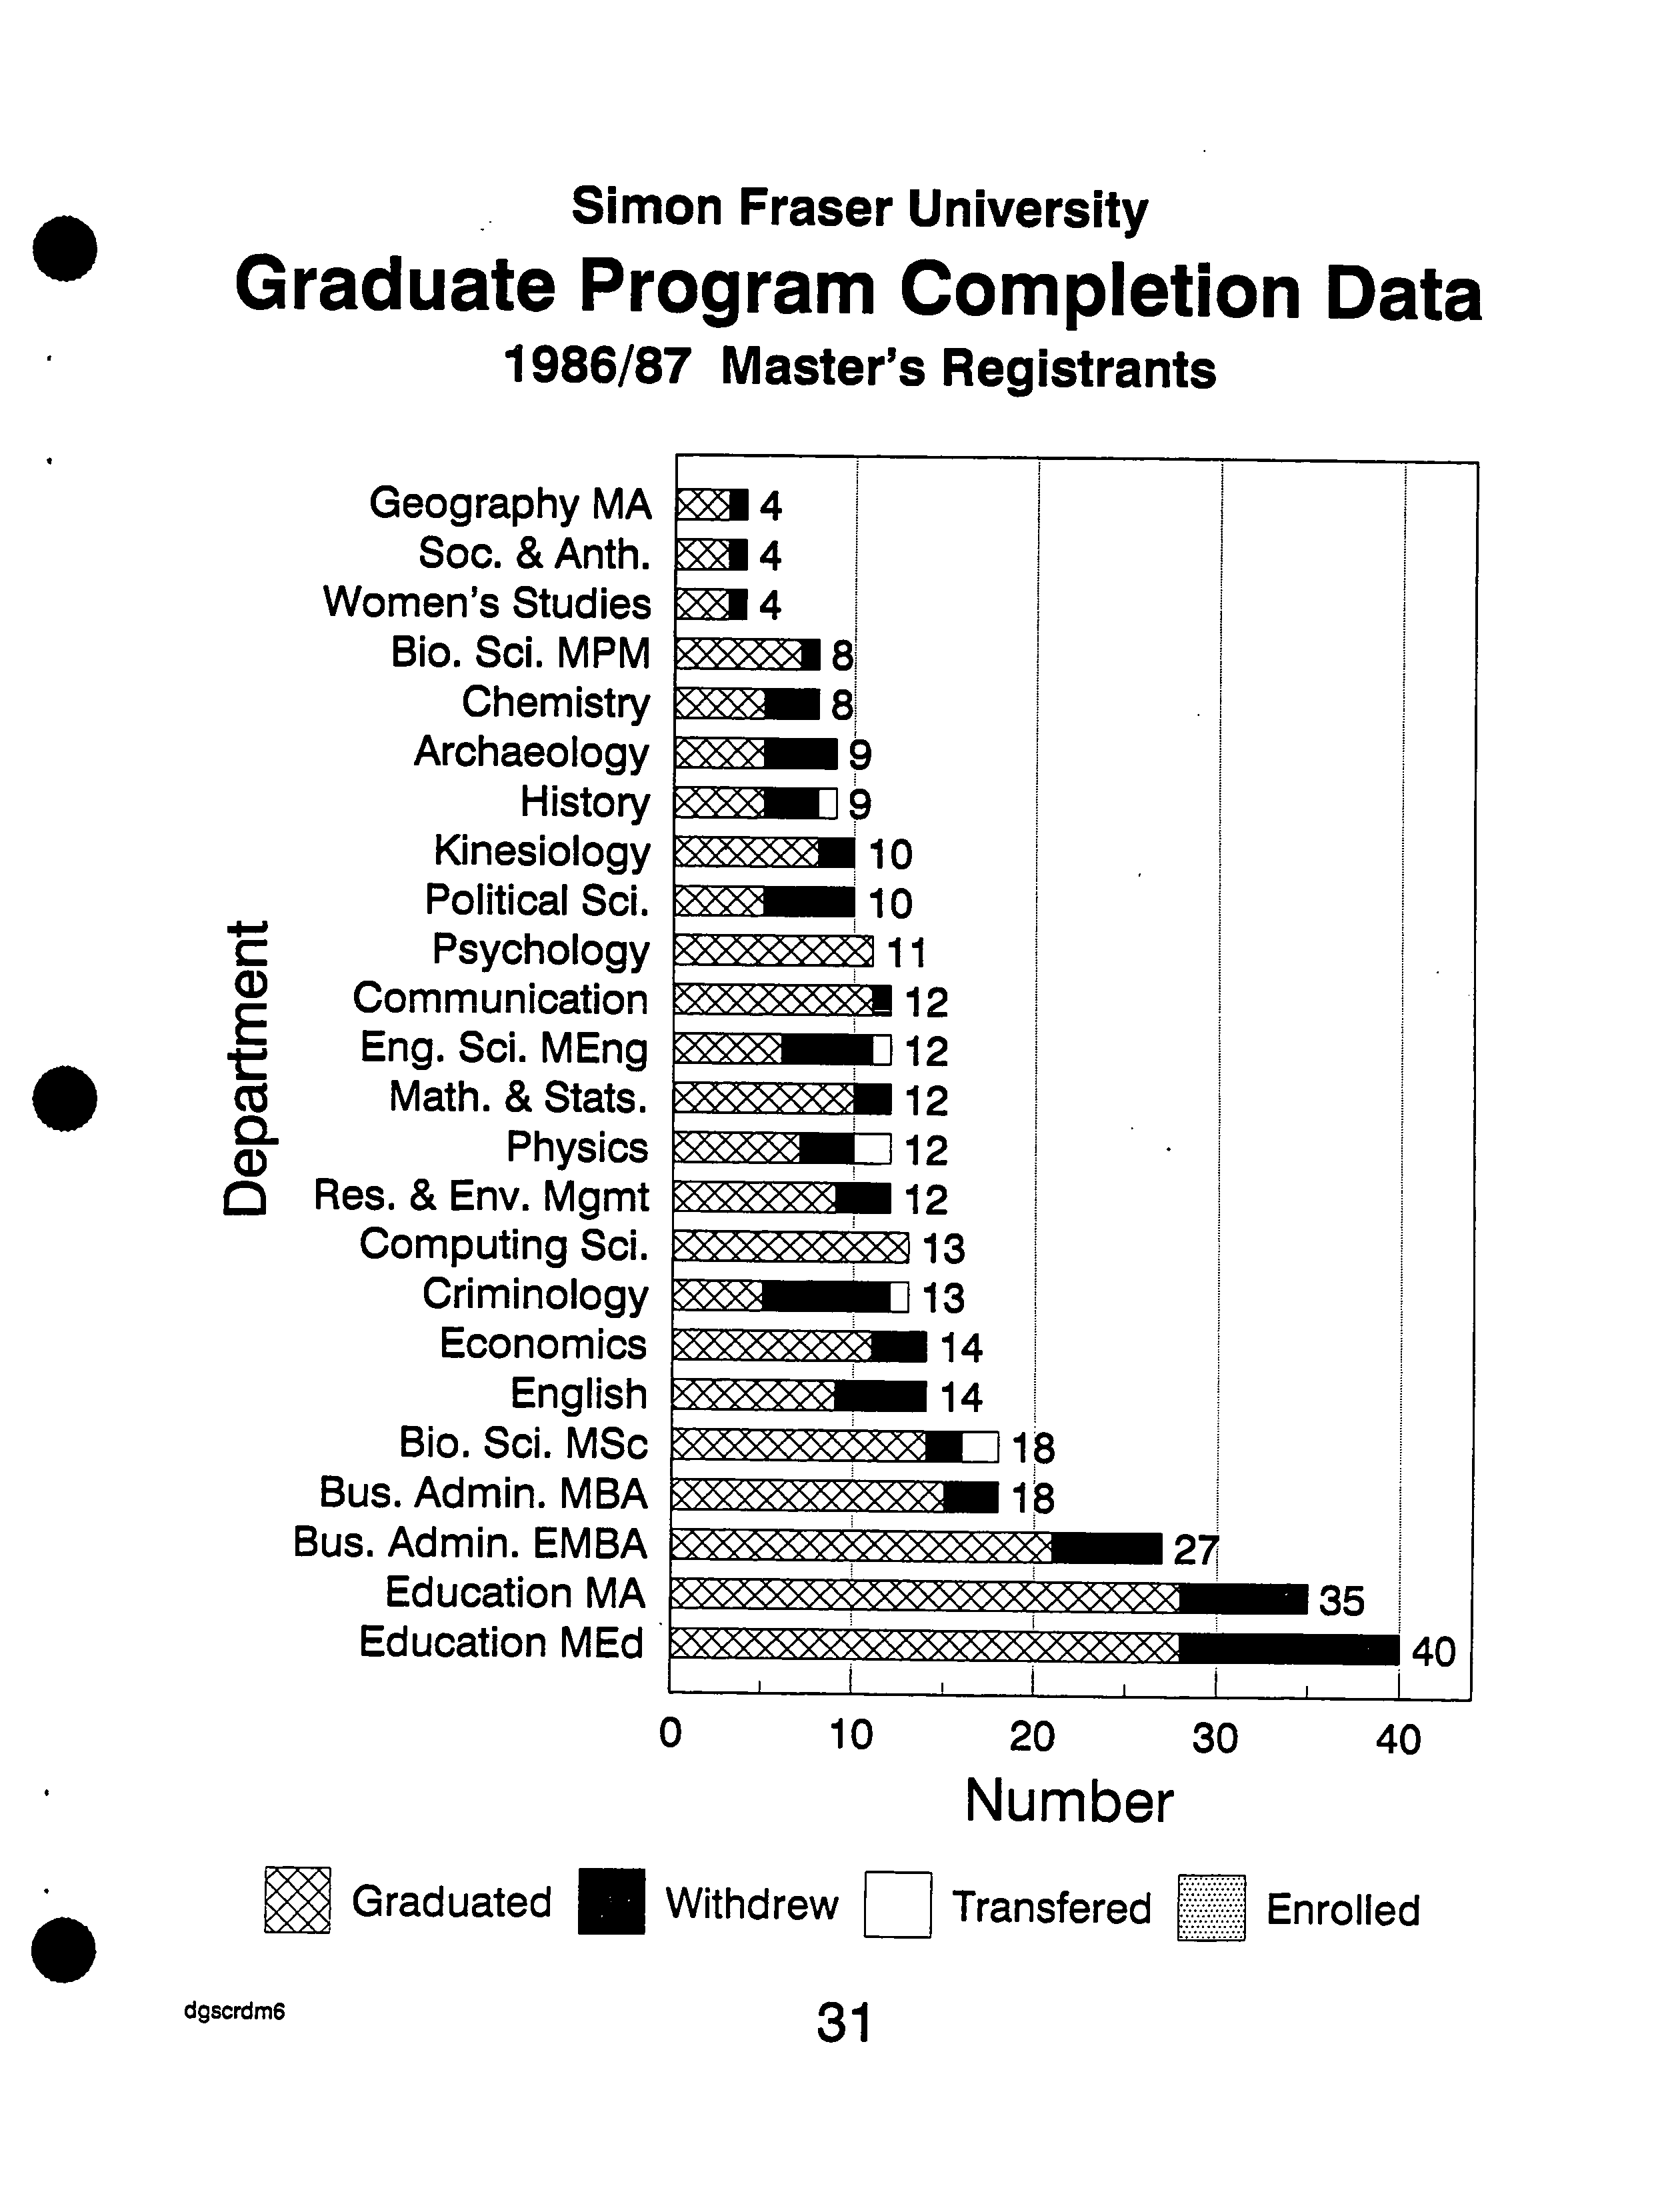
Simon Fraser University
Graduate Program Completion Data
1986/87 Master's Registrants
0 ?
10 ?
20 ?
30 ?
40
Number
Graduated ___ Withdrew
1:1
Transfered
?
Enrolled
dgscrdm6
?
31
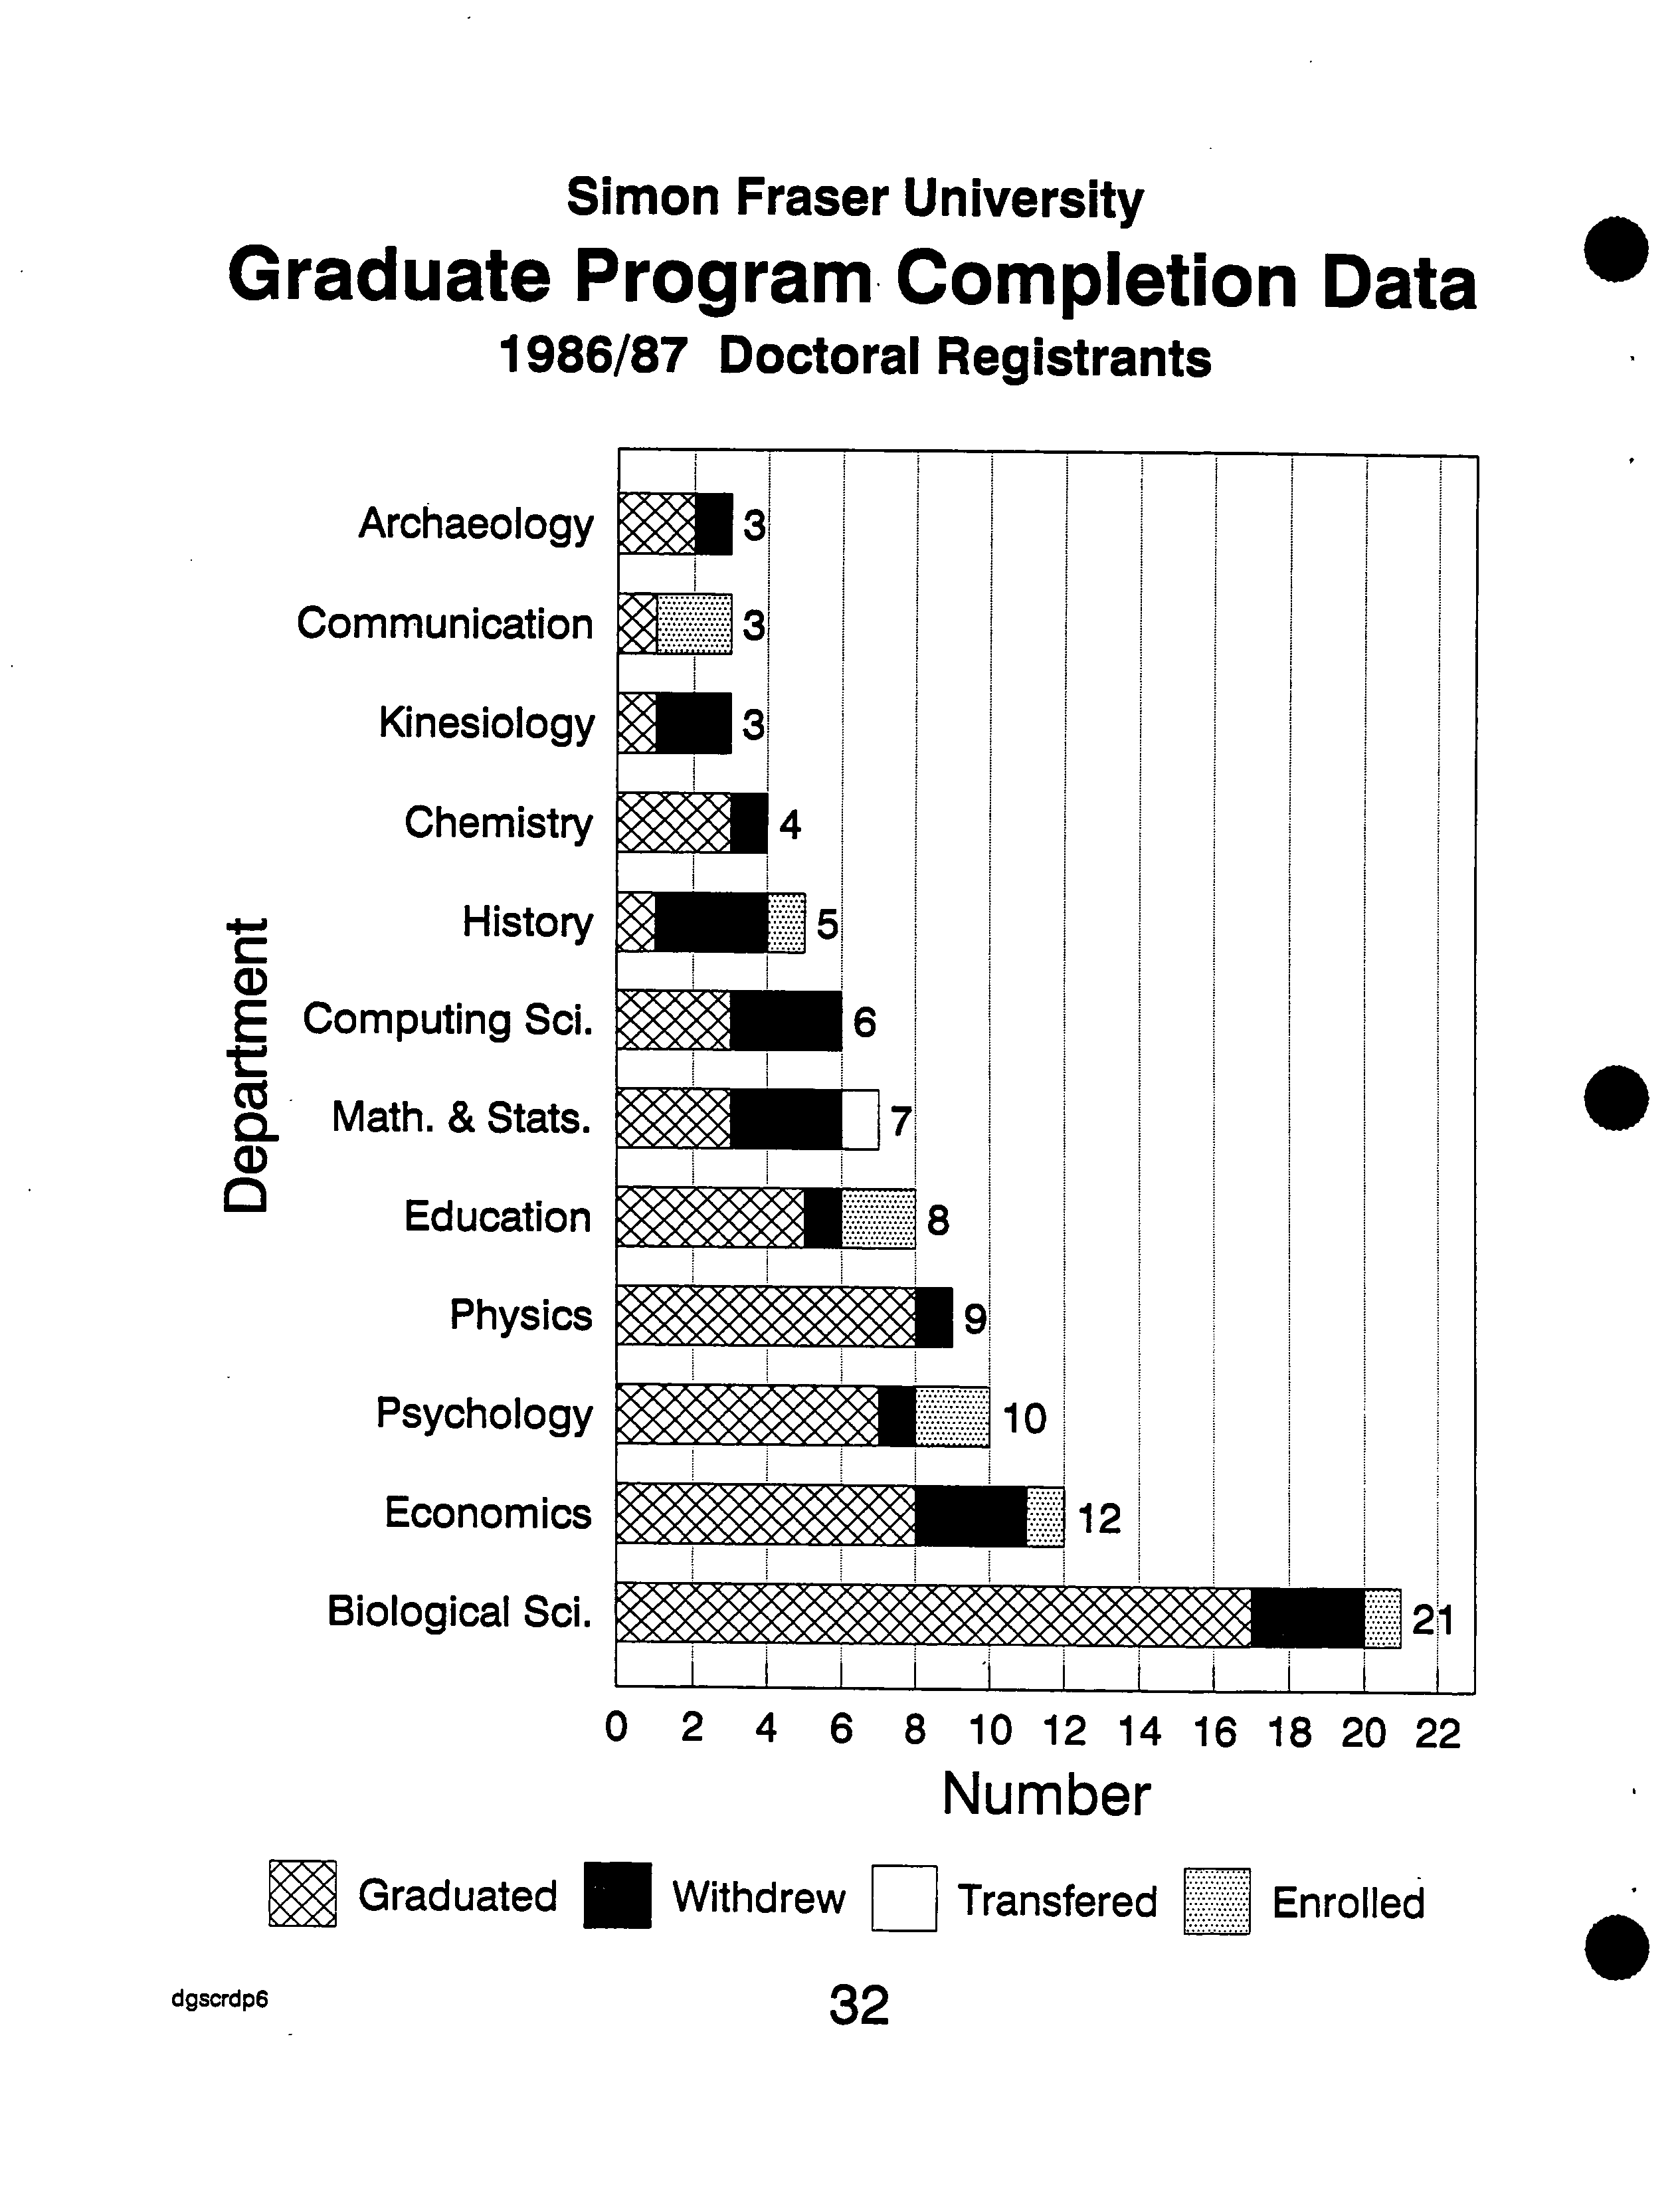
Simon Fraser University
Graduate Program Completion Data
1986/87 Doctoral Registrants
.
Archaeology
Communication
Kinesiology
Chemistry
-
History
a)
E
Computing Sd.
t
Cz
CL
Math. & Stats.
a)
Education
Physics
Psychology
Economics
Biological Sci.
4
.
8
10
12
0 2 4 6 8 10 12 14 16 18 20 22
Number
Graduated ___ Withdrew
1:1
Transfered
?
Enrolled
?
.
dgscrdp6 ?
32
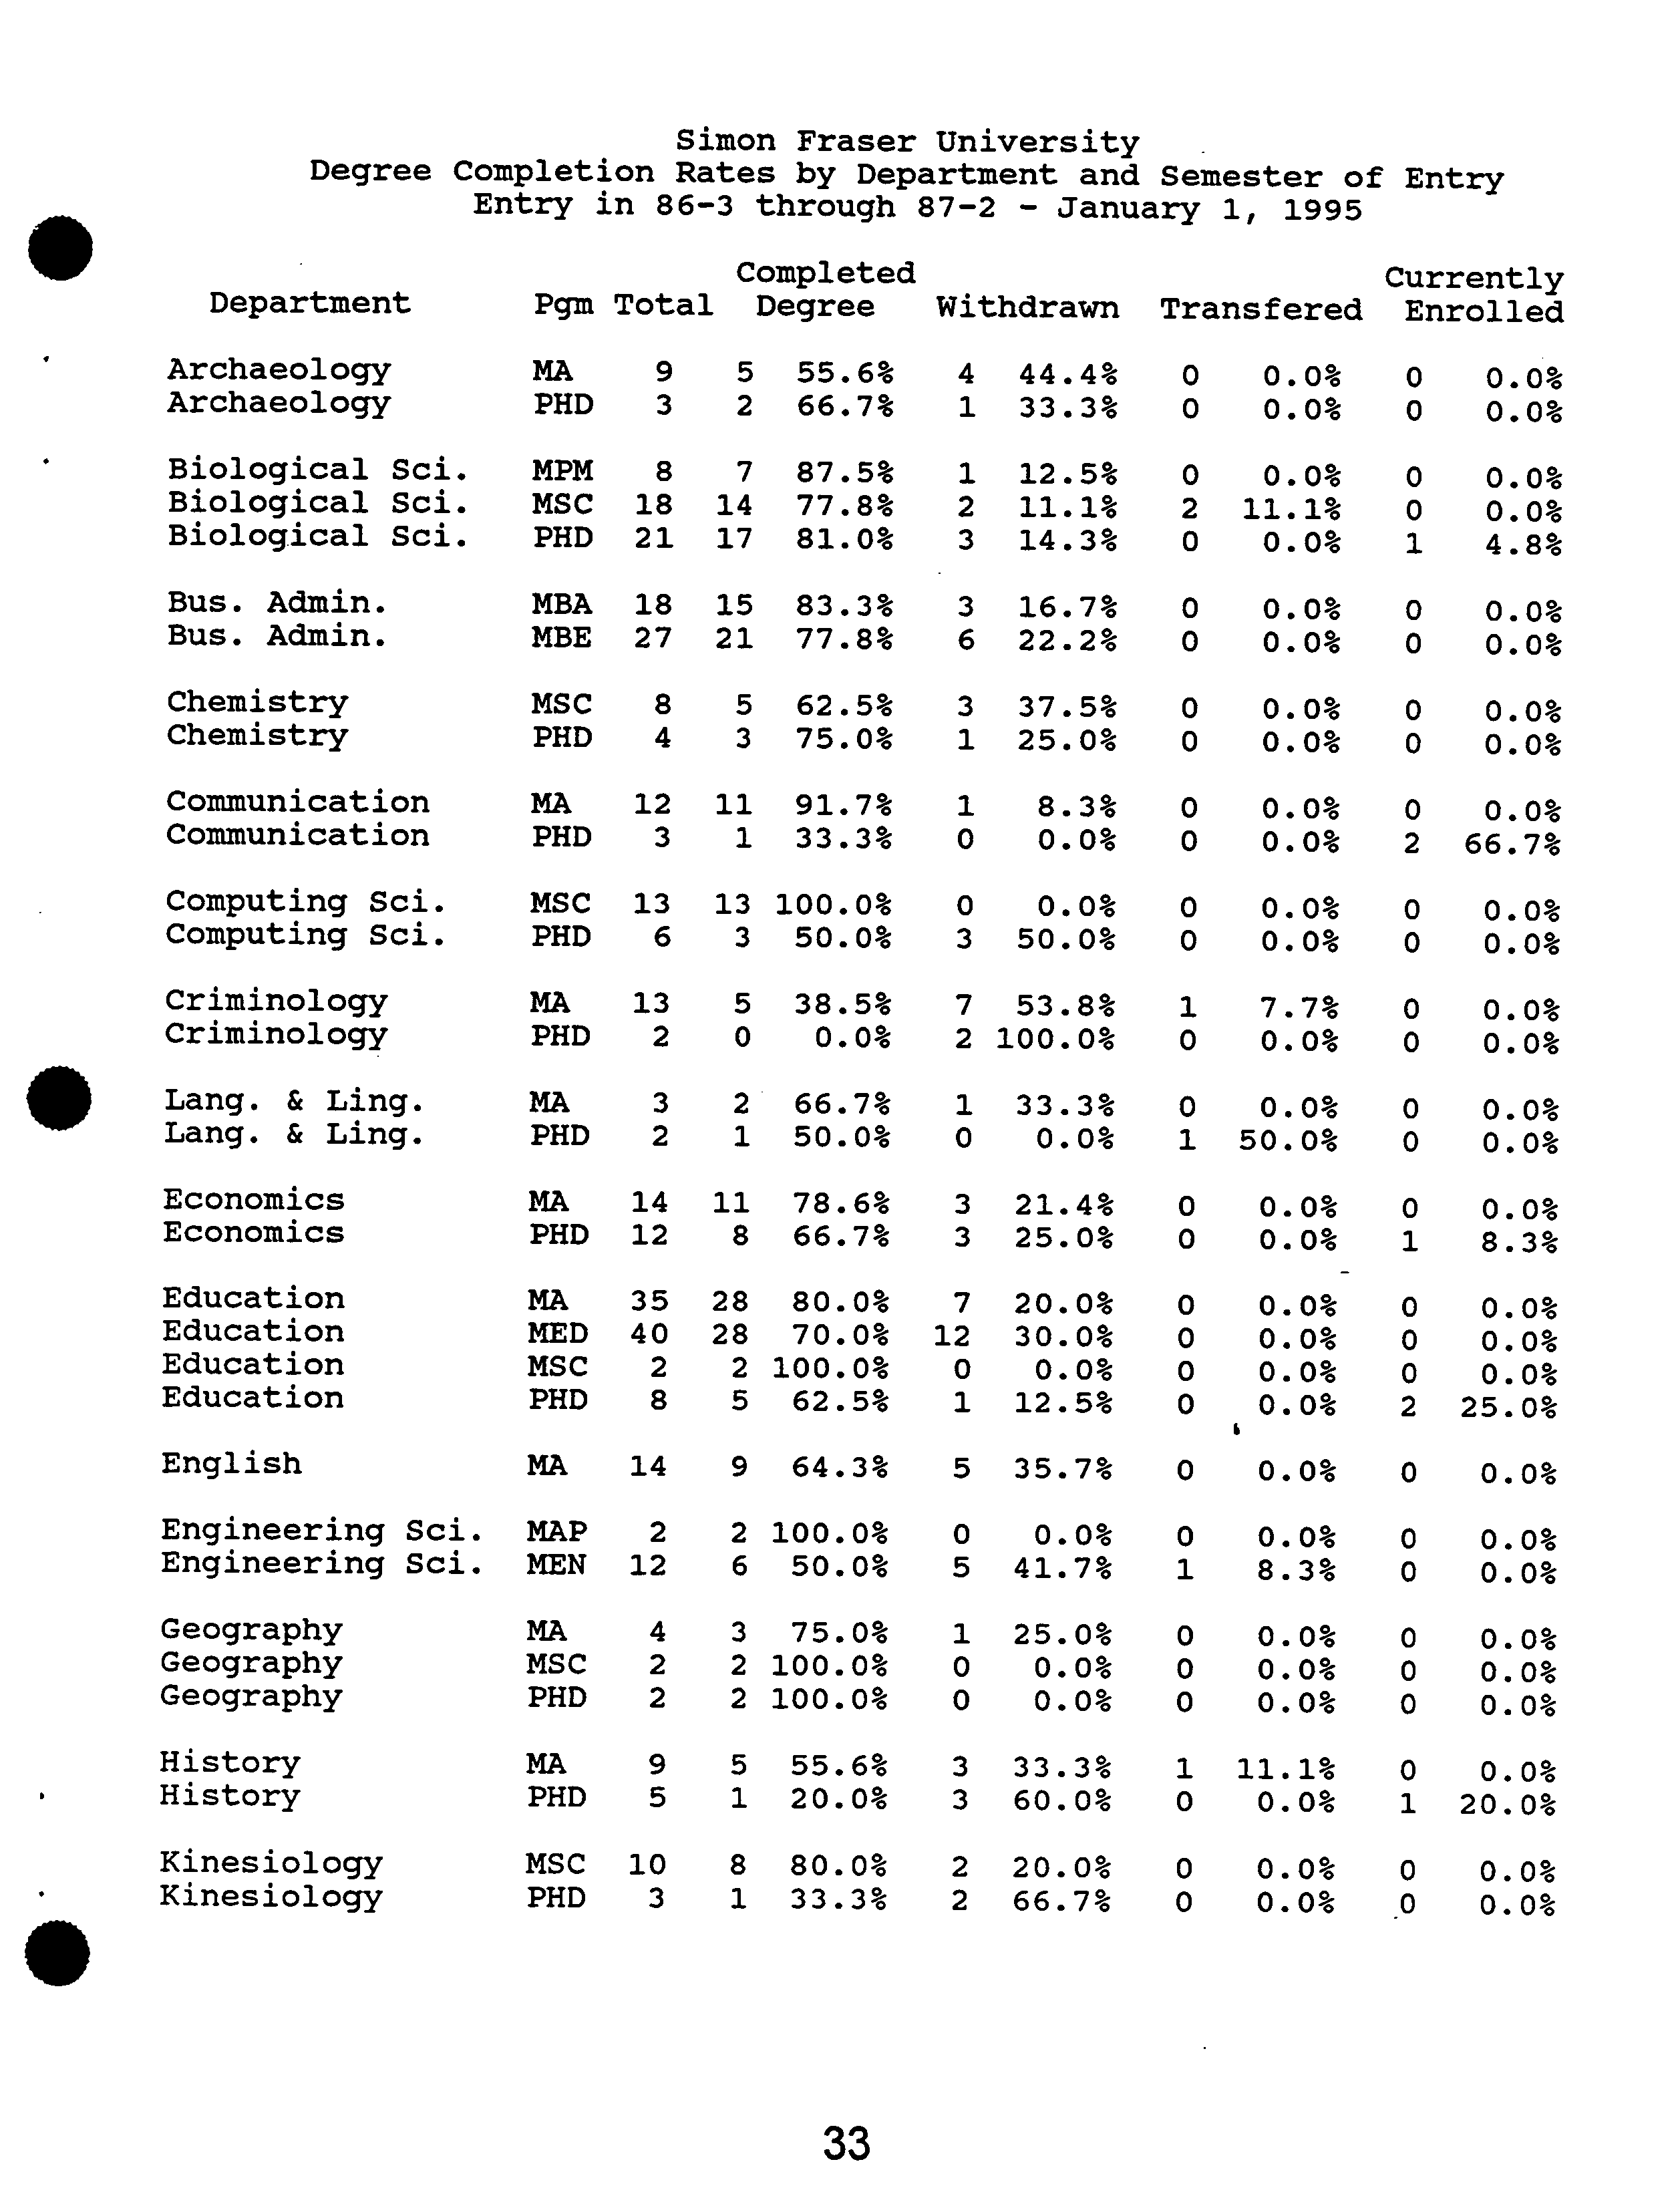
Simon Fraser
University
Degree Completion
Rates
by Department and
Semester of
Entry
Entry
in 86-3
through
87-2
- January
1,
?
1995
Completed
Currently
Department
Pgm
Total
Degree
Withdrawn
Trans fered
Enrolled
ArchaeologyArchaeology
MAPHD
9
3
5
2
55.6%66.7%
41
44.4%33.3%
00
0.0%0.0%
0
0
0.0%
0.0%
•
Biological
Biological
Biological
Sci.Sci.Sci.
MPMMSC
PHD
21
18
8
1714
7
81.0%77.8%87.5%
2
1
3
14.3%11.1%12.5%
20
0
11.1%0.0%0.0%
0
1
0
4.8%
0.0%
0.0%
Bus.
Bus.
Admin.Admin.
MBEMBA
2718
21
15
77.8%83.3%
3
6
22.2%16.7%
00
0.0%0.0%
0
0
0.0%
0.0%
ChemistryChemistry
MSCPHD
84
5
3
75.0%62.5%
3
1
25.0%37.5%
0
0
0.0%0.0%
00
0.0%
0.0%
CommunicationCommunication
MA
PHD
12
3
11
1
91.7%33.3%
10
8.3%0.0%
00
0.0%0.0%
2
0
66.7%
0.0%
Computing
Computing
Sci.Sci.
MSCPHD
13
6
13
3
100.0%50.0%
0
3
50.0%0.0%
00
0.0%0.0%
00
0.0%
0.0%
CriminologyCriminology
MA
PHD
13
2
5
0
38.5%0.0%
7
2
100.0%53.8%
0
1
7.7%0.0%
00
0.0%
0.0%
Lang.
Lang.
&
&
Ling.Ling.
MA
PHD
2
3
2
1
50.0%66.7%
0
1
33.3%0.0%
0
1
50.0%0.0%
00
0.0%
0.0%
EconomicsEconomics
MA
PHD
1412
11
8
78.6%66.7%
33
21.4%25.0%
00
0.0%0.0%
1
0
8.3%
0.0%
EducationEducationEducationEducation
MSCMAMED
PHD
4035
2
8
2828
5
2
100.0%70.0%80.0%62.5%
12
710
20.0%12.5%30.0%0.0%
0000
0.0%0.0%0.0%0.0%
2
000
25.0%
0.0%
0.0%
0.0%
English
MA
14
9
64.3%
5
35.7%
0
0.0%
0
0.0%
Engineering
Engineering
Sci.Sci.
MAPMEN
12
2
2
6
100.0%50.0%
50
41.7%0.0%
0
1
0.0%8.3%
00
0.0%
0.0%
GeographyGeographyGeography
MSCMAPHD
2
24
22
3
100.0%100.0%75.0%
001
25.0%0.0%0.0%
0
00
0.0%0.0%0.0%
0
00
0.0%
0.0%
0.0%
History
MA
9
5
55.6%
3
33.3%
1
11.1%
0
0.0%
• History
PHD
5
1
20.0%
3
60.0%
0
0.0%
1
20.0%
KinesiologyKinesiology
MSCPHD
10
3
81
80.0%33.3%
2
2
20.0%66.7%
0
0
0.0%0.0%
00
0.0%
0.0%
S
33
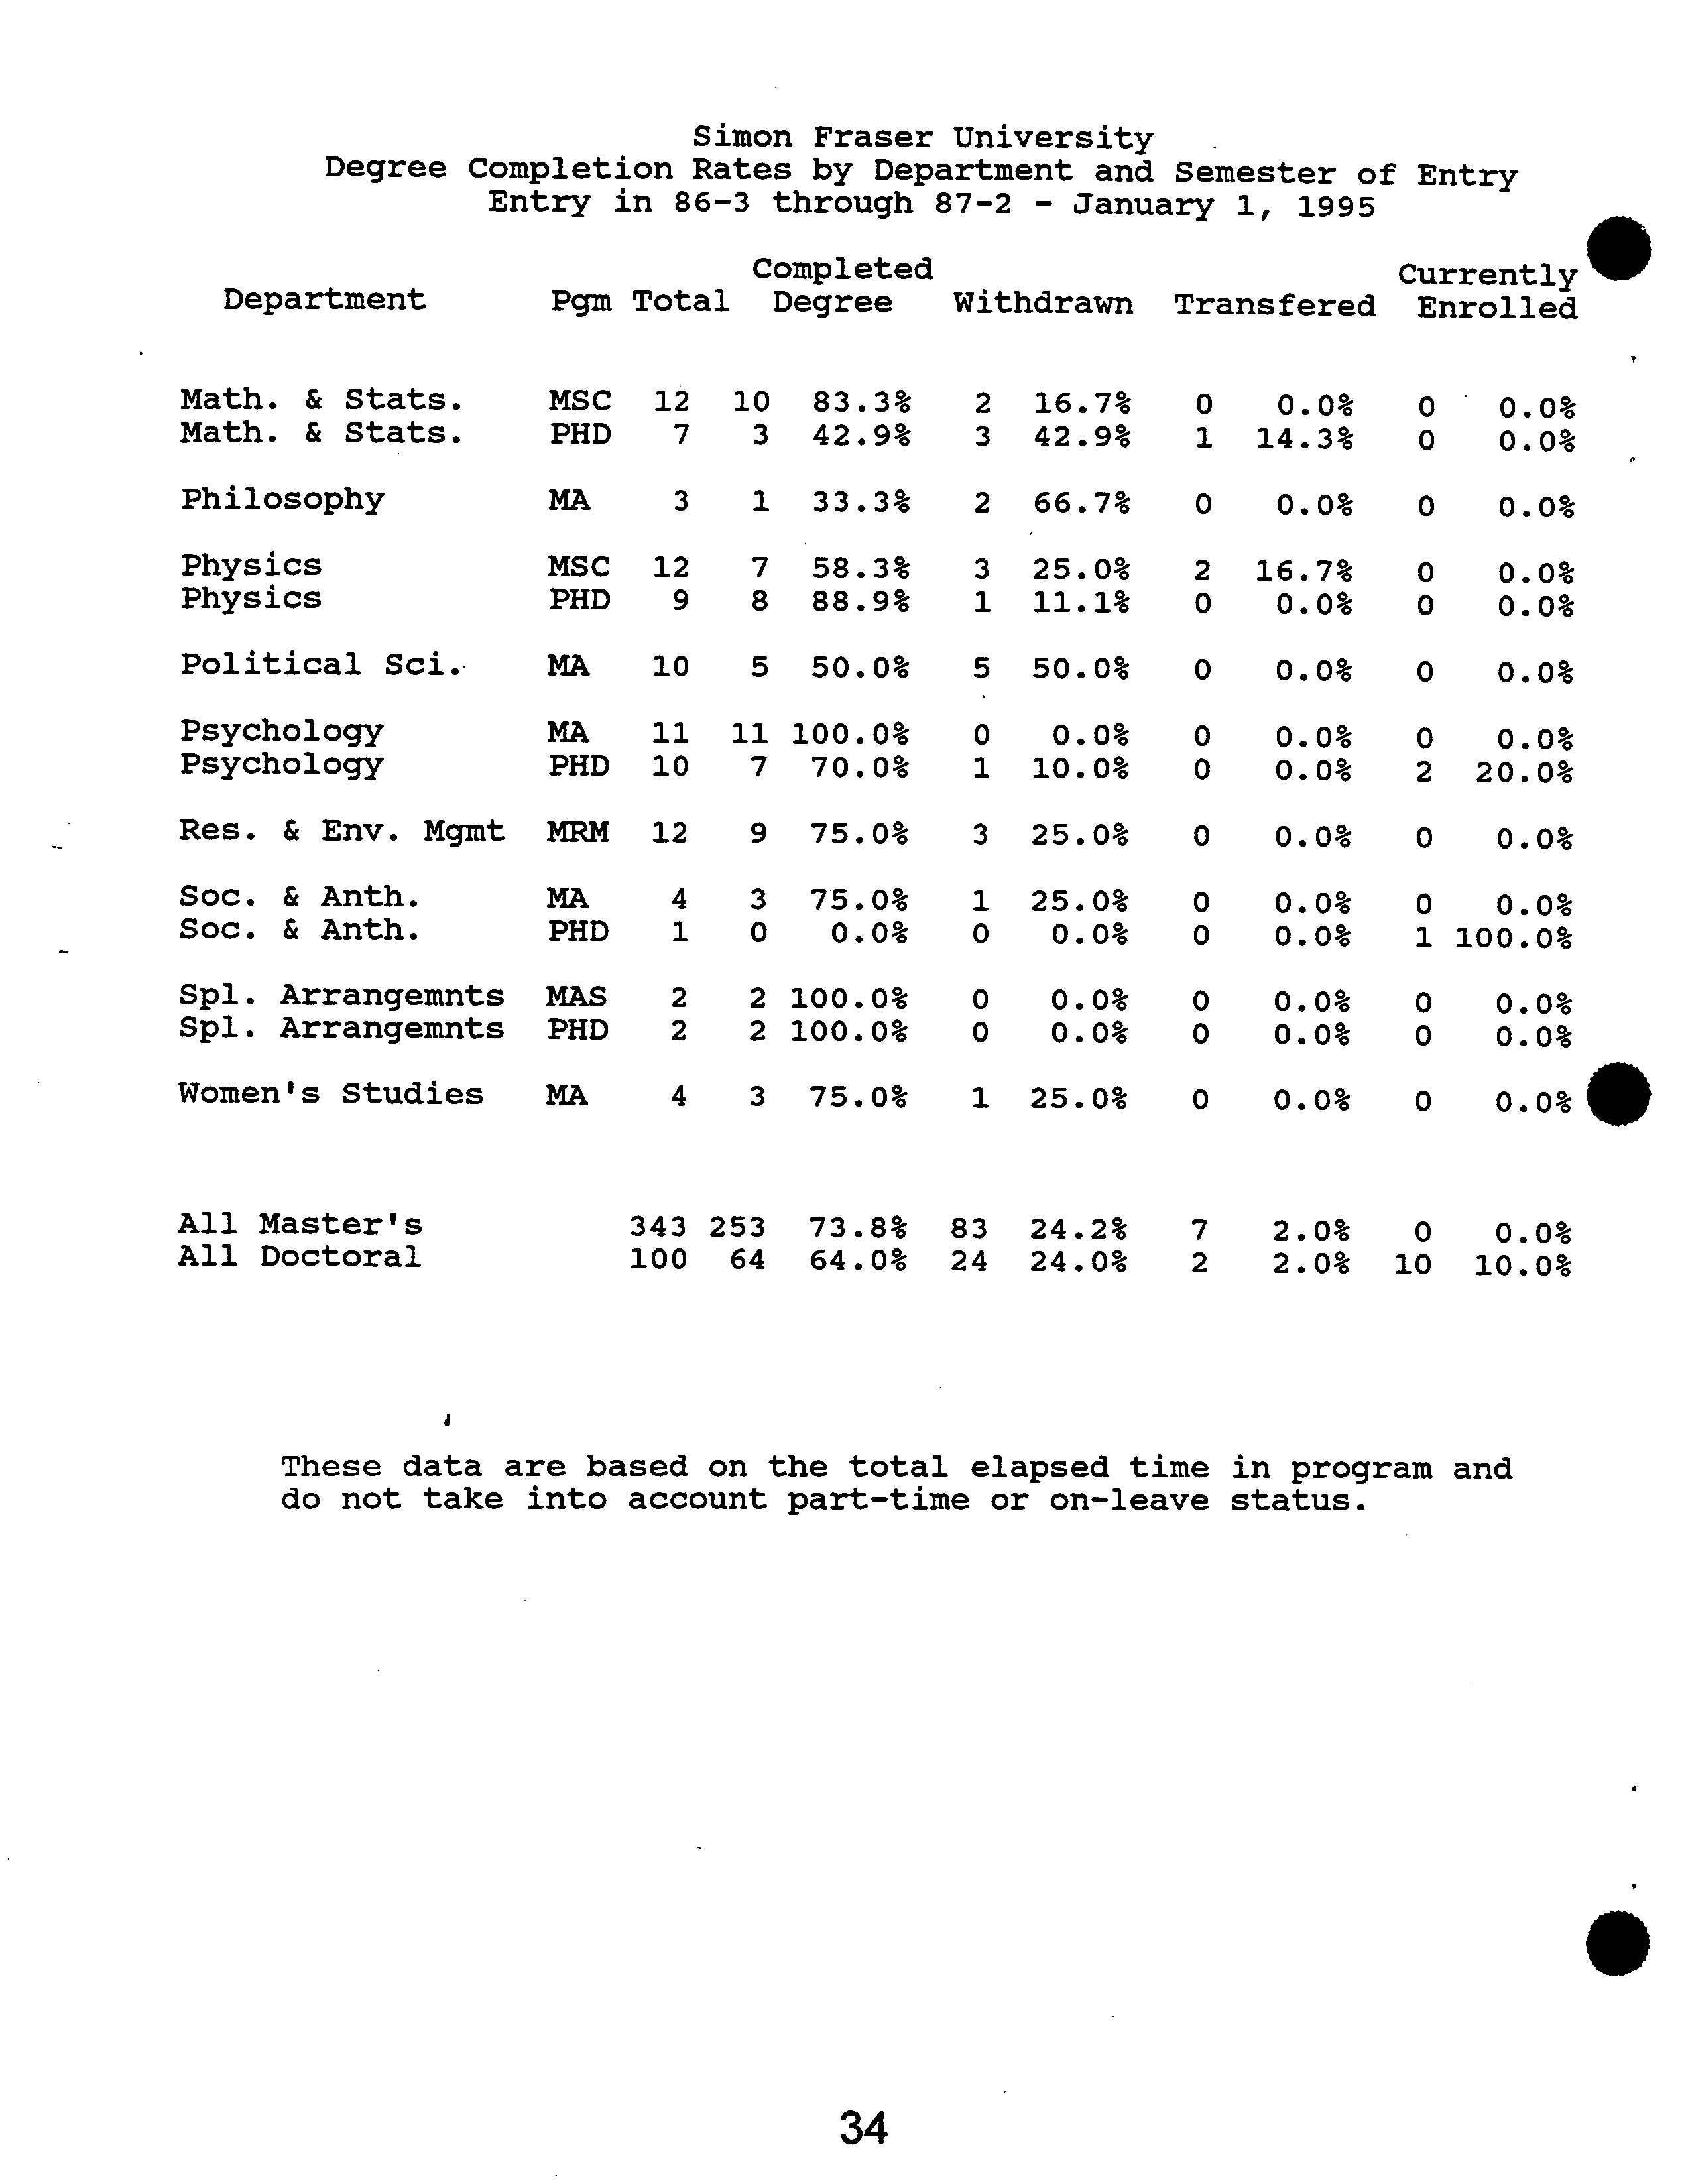
Simon Fraser University
Degree Completion Rates by Department and Semester of Entry
?
Entry in 86-3 through 87-2 - January 1, 1995
Completed ?
Currently
Department ?
Pgm Total Degree Withdrawn Transfered Enrolled
Math.
Math. &
&
Stats.Stats.
MSC
PHD
12
7
10
3
42.9%83.3%
32
42.9%16.7%
10
14.3%0.0%
0
0
0.0%
0.0%
Philosophy
MA
3
1
33.3%
2
66.7%
0
0.0%
0
0.0%
PhysicsPhysics
MSCPHD
12
9
78
88.9%58.3%
3
1
25.0%11.1%
0
2
16.7%0.0%
00
0.0%
0.0%
Political Sci.
MA
10
5
50.0%
5
50.0%
0
0.0%
0
0.0%
PsychologyPsychology
MA
PHD
1110
11
7
100.0%70.0% 01
10.0%0.0%
00
0.0%0.0%
2
0
20.0%
0.0%
Res. & Env. Mgmt
MRN
12
9
75.0%
3
25.0%
0
0.0%
0
0.0%
Soc.
Soc.
&
& Anth.Anth.
MA
PHD
41
3
0
75.0%0.0%
0
1
25.0%0.0%
00
0.0%0.0%
1
0
100.0%
0.0%
Spi.
Spl.
ArrangemntsArrangemnts
MASPHD
22
2
2
100.0%100.0%
00
0.0%0.0%
00
0.0%0.0%
00
0.0%
0.0%
Women's Studies
MA
4
3
75.0%
1
25.0%
0
0.0%
0
0.0%
All
All
DoctoralMaster's
343100
253
64
73.8%64.0% 8324
24.2%24.0%
2
7
2.0%2.0%
10
0
10.0%
0.0%
These data are based
on the total
elapsed
time
in program
and
do not take into account
part-time or
on-leave
status.
Spl. Arr. MA
?
Archaeology?
Political Sd.?
Women's Studies
?
English
?
Physics ?
Eng. Sci. MApSc?
Geography MA?
Communication?
Bio. Sd. MPM
?
Eng. Sd. MEng
E
?
?
History ?
Math. & Stats.
Cz
CL
Computing Sd.
Kinesiology
Psychology
Chemistry
Criminology
Economics
Res. & Env. Mgmt
Bio. Sd. MSc
Bus. Admin. MBA
Bus. Admin. EMBA
Education MA
Education MEd
Simon Fraser University
O
Graduate Program Completion Data
• ?
1987/88 Master's Registrants
0 ?
10 ?
20 ?
30 ?
40 ?
50
Number
0
?
Graduated ___ Withdrew
[J
Transfered
?
Enrolled
dgscrdm8
?
35
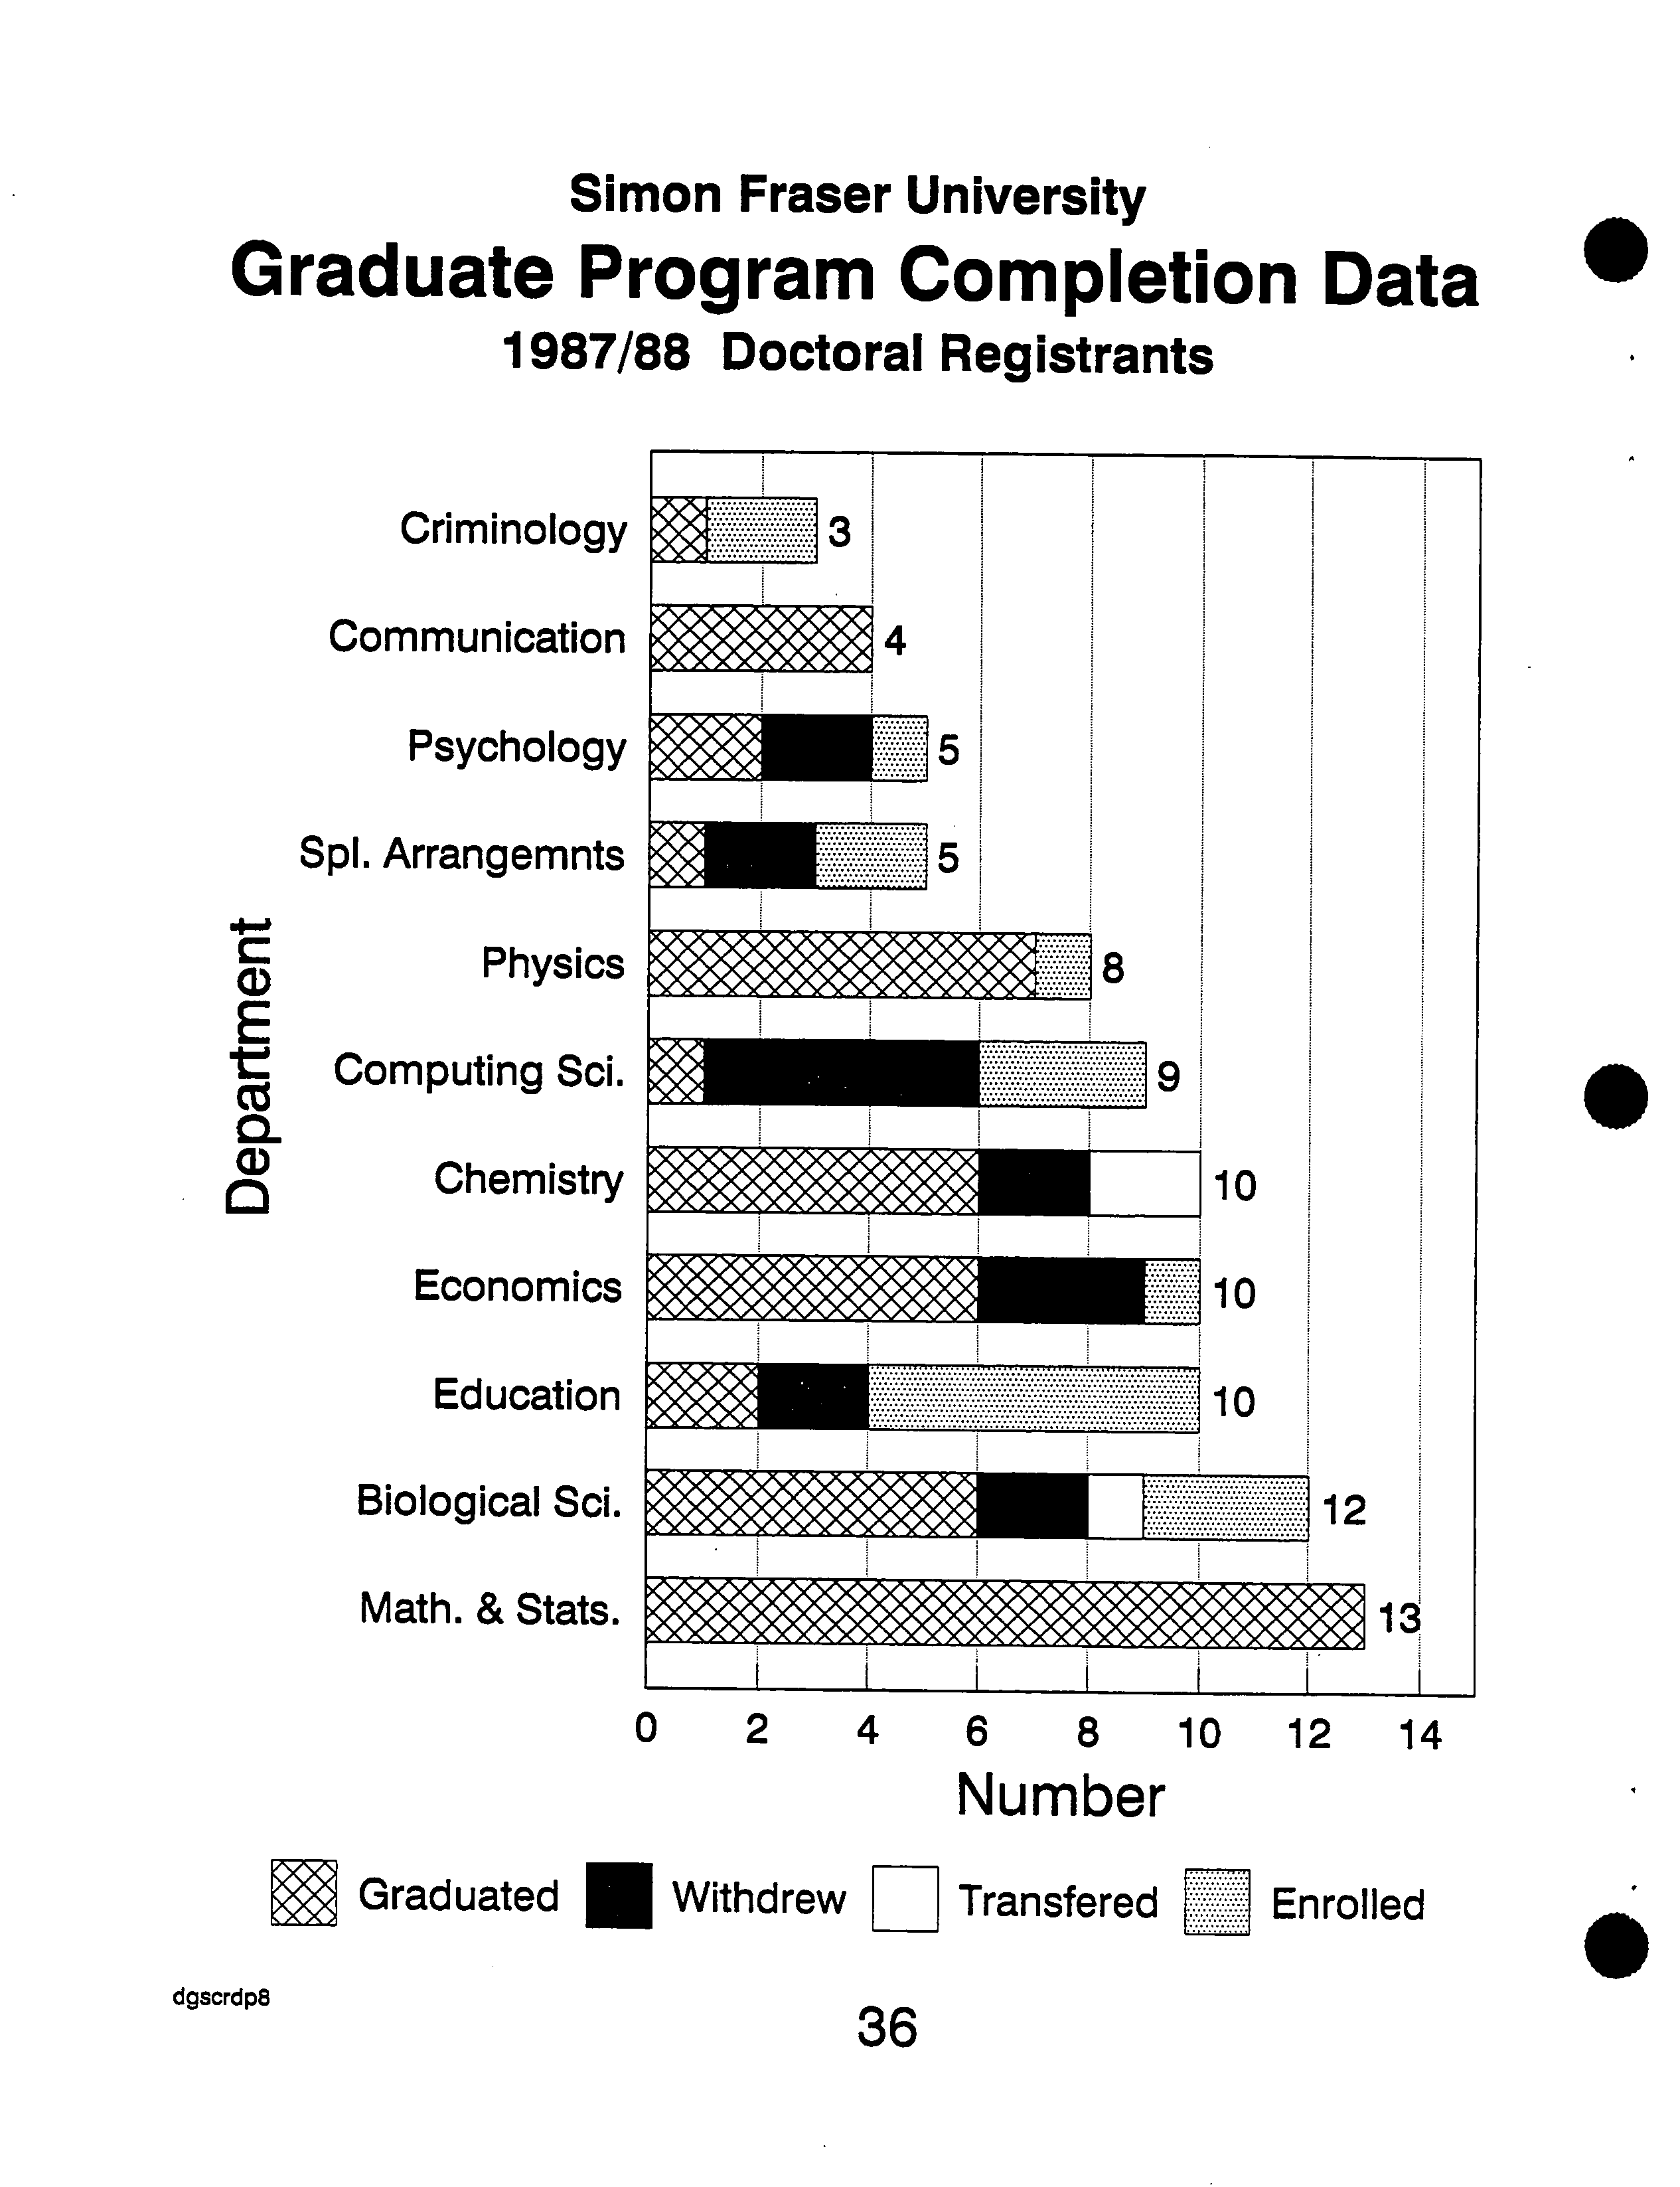
Simon Fraser University
Graduate Program Completion Data
1987/88 Doctoral Registrants
0
?
2 ?
4
?
6 ?
8 ?
10 12 14
Number
Graduated
E
Withdrew
1:1
Transfered ?
Enrolled
dgscrdp8
Criminology
Communication
Psychology
Spi. Arrangemnts
CD
Physics
E
Computing Sci.
Cz
Cl
Chemistry
Economics
Education
Biological Sci.
Math. & Stats.
.
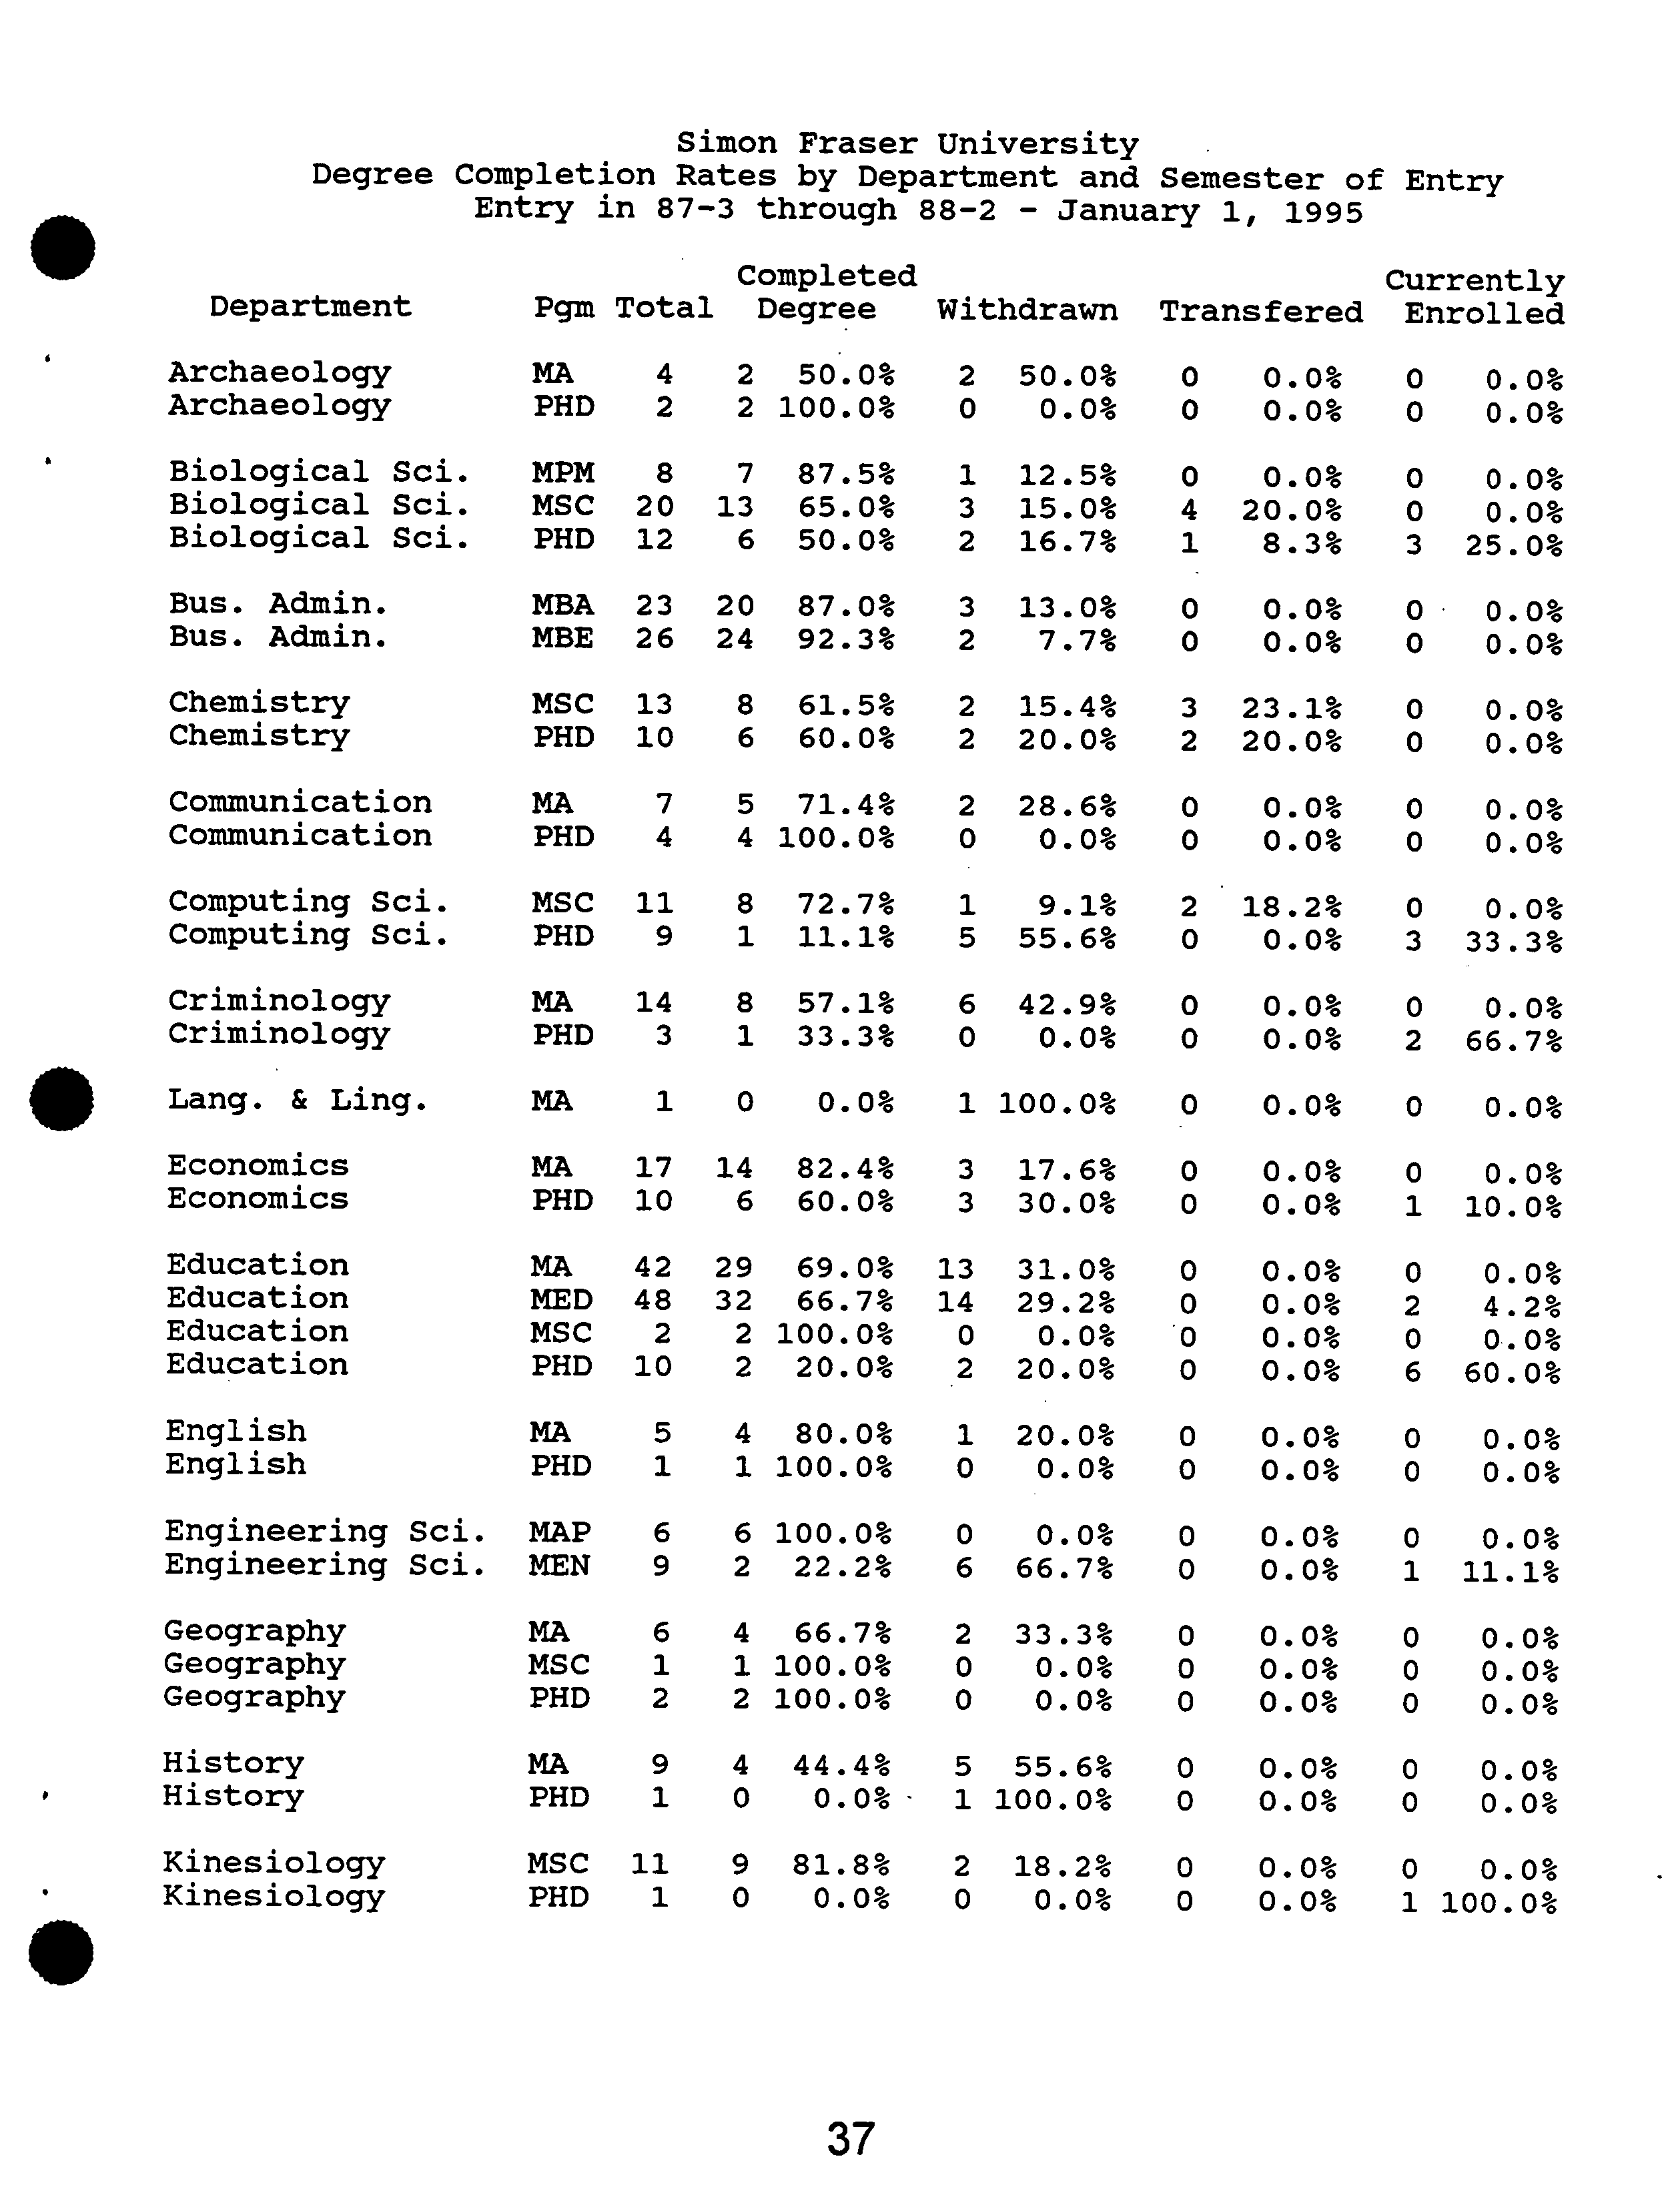
Simon Fraser
University
Degree Completion
Rates
by Department and
Semester of
Entry
•
Entry in 87-3
through 88-2
- January
1, ?
1995
Completed
Currently
Department
Pgm
Total
Degree
Withdrawn
Transfered
Enrolled
ArchaeologyArchaeology
MA
PHD
42
22
100.0%50.0%
2
0
50.0%0.0%
0
0
0.0%0.0%
00
0.0%
0.0%
Biological
Biological
Biological
Sci.Sci.Sci.
MPMMSC
PHD
20
12
8
13
7
6
87.5%50.0%65.0%
2
3
1
15.0%16.7%12.5%
40
1
20.0%8.3%0.0%
00
3
25.0%
0.0%
0.0%
Bus.
Bus.
Admin.Admin.
MBAMBE
26
23
2420
87.0%92.3%
2
3
13.0%7.7%
00
0.0%0.0%
00
0.0%
0.0%
ChemistryChemistry
MSCPHD
10
13
86
61.5%60.0%
22
20.0%15.4%
2
3
20.0%23.1%
00
0.0%
0.0%
CommunicationCommunication
MA
PHD
74
5
4
100.0%71.4%
2
0
28.6%0.0%
00
0.0%0.0%
0
0
0.0%
0.0%
Computing
Computing
Sci.Sci.
MSCPHD
11
9
8
1
72.7%11.1%
51
55.6%9.1%
2
0
18.2%0.0%
3
0
33.3%
0.0%
CriminologyCriminology
MA
PHD
14
3
81
33.3%57.1%
60
42.9%0.0%
00
0.0%0.0%
20
66.7%
0.0%
Lang. & Ling.
MA
1
0
0.0%
1
100.0%
0
0.0%
0
0.0%
EconomicsEconomics
MAPHD
1710
14
6
82.4%60.0%
33
17.6%30.0%
00
0.0%0.0%
1
0
10.0%
0.0%
EducationEducationEducationEducation
MEDMSCMA
PHD
481042
2
29
32
22
100.0%20.0%69.0%66.7%
1314
20
20.0%29.2%31.0%0.0%
0
000
0.0%0.0%0.0%0.0%
20
0
6
60.0%
0.0%
4.2%
0.0%
EnglishEnglish
MA
PHD
5
1
41
100.0%80.0%
01
20.0%0.0%
0
0
0.0%0.0%
00
0.0%
0.0%
Engineering
Engineering Sci.
Sd.
MAPMEN
96
2
6
100.0%22.2%
6
0
66.7%0.0%
00
0.0%0.0%
10
11.1%
0.0%
GeographyGeographyGeography
MAMSC
PHD 261
421
100.0%100.0%66.7%
00
2
33.3%0.0%0.0%
0
0
0
0.0%0.0%0.0%
00
0
0.0%
0.0%
0.0%
History
MA
9
4
44.4%
5
55.6%
0
0.0%
0
0.0%
•
History
PHD
1
0
0.0%-
1
100.0%
0
0.0%
0
0.0%
KinesiologyKinesiology
MSCPHD
11
1
90
81.8%
0.0%
20
18.2%0.0%
00
0.0%0.0%
10
100.0%
0.0%
37
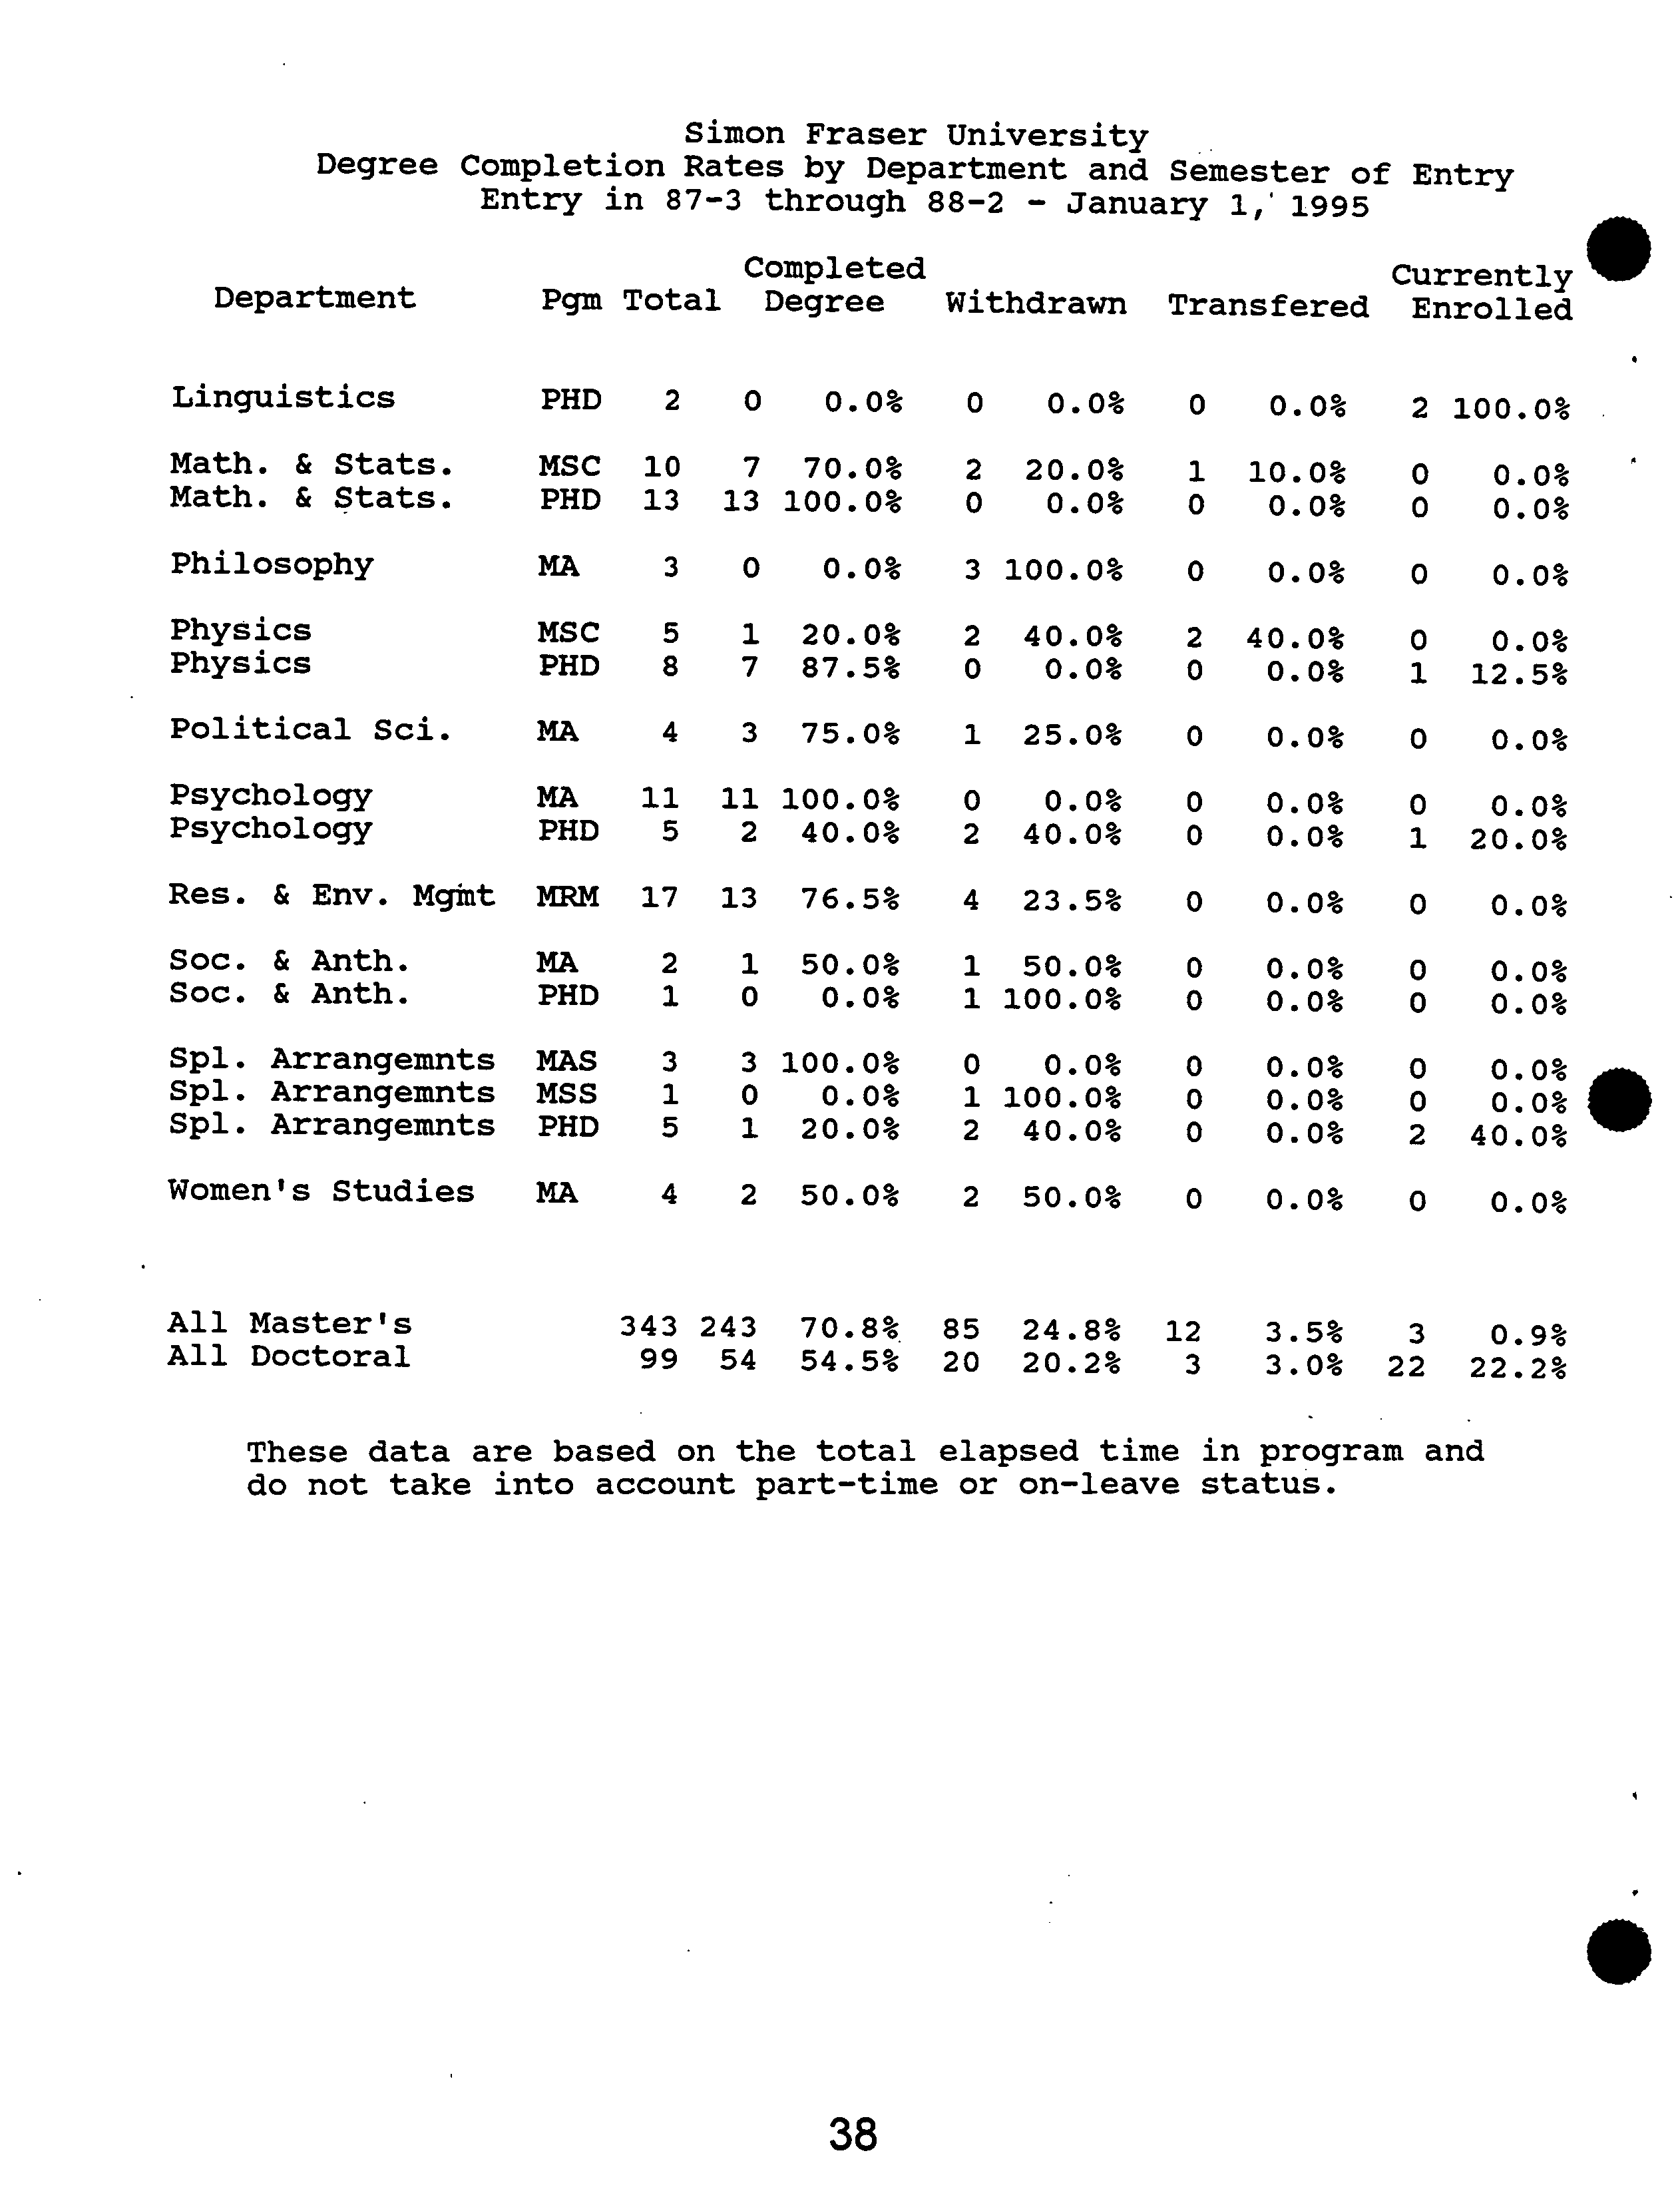
Simon Fraser University
Degree Completion Rates by Department and Semester of Entry
?
Entry in 87-3 through 88-2 - January 1,'1995
Completed ?
Currently
Department ?
Pgm Total Degree Withdrawn Transfered Enrolled
Linguistics
PHD
2
0
0.0%
0
0.0%
0
0.0%
2
100.0%
Math.
Math.
&
&
Stats.Stats.
MSC
PHD
1310
13
7
100.0%70.0%
2
0
20.0%0.0%
01
10.0%0.0%
0
0
0.0%
0.0%
Philosophy
MA
3
0
0.0%
3
100.0%
0
0.0%
0
0.0%
PhysicsPhysics
MSC
PHD
85
7
1
87.5%20.0%
20
40.0%0.0%
0
2
40.0%0.0%
0
1
12.5%
0.0%
Political Sci.
MA
4
3
75.0%
1
25.0%
0
0.0%
0
0.0%
PsychologyPsychology
MA
PHD
11
5
11
2
100.0%40.0%
2
0
40.0%
0.0%
00
0.0%0.0%
01
20.0%
0.0%
Res. & Env. Mgiiit
11PM
17
13
76.5%
4
23.5%
0
0.0%
0
0.0%
Soc.
Soc.
&
& Anth.Anth.
MA
PHD
21
1
0
50.0%0.0%
11
100.0%50.0%
0
0
0.0%0.0%
00
0.0%
0.0%
Spi.
Spi.
Spi.
ArrangemntsArrangemntsArrangemnts
HAS
MSSPHD
5
3
1
3
0
1
100.0%20.0%0.0%
2
10
100.0%40.0%0.0%
000
0.0%0.0%0.0%
0
20
40.0%
00%
0..0%
Women's Studies
MA
4
2
50.0%
2
50.0%
0
0.0%
0
0.0%
All
All DoctoralMaster's ??
343
99 54
243
54.5%
70.8%
20
85
20.2%
24.8%
?
12
3
??
3.0%
3.5% ?
22
3 ?
22.2%
0.9%
These data are based on the total elapsed time in program and
do not take into account part-time or on-leave status.
38
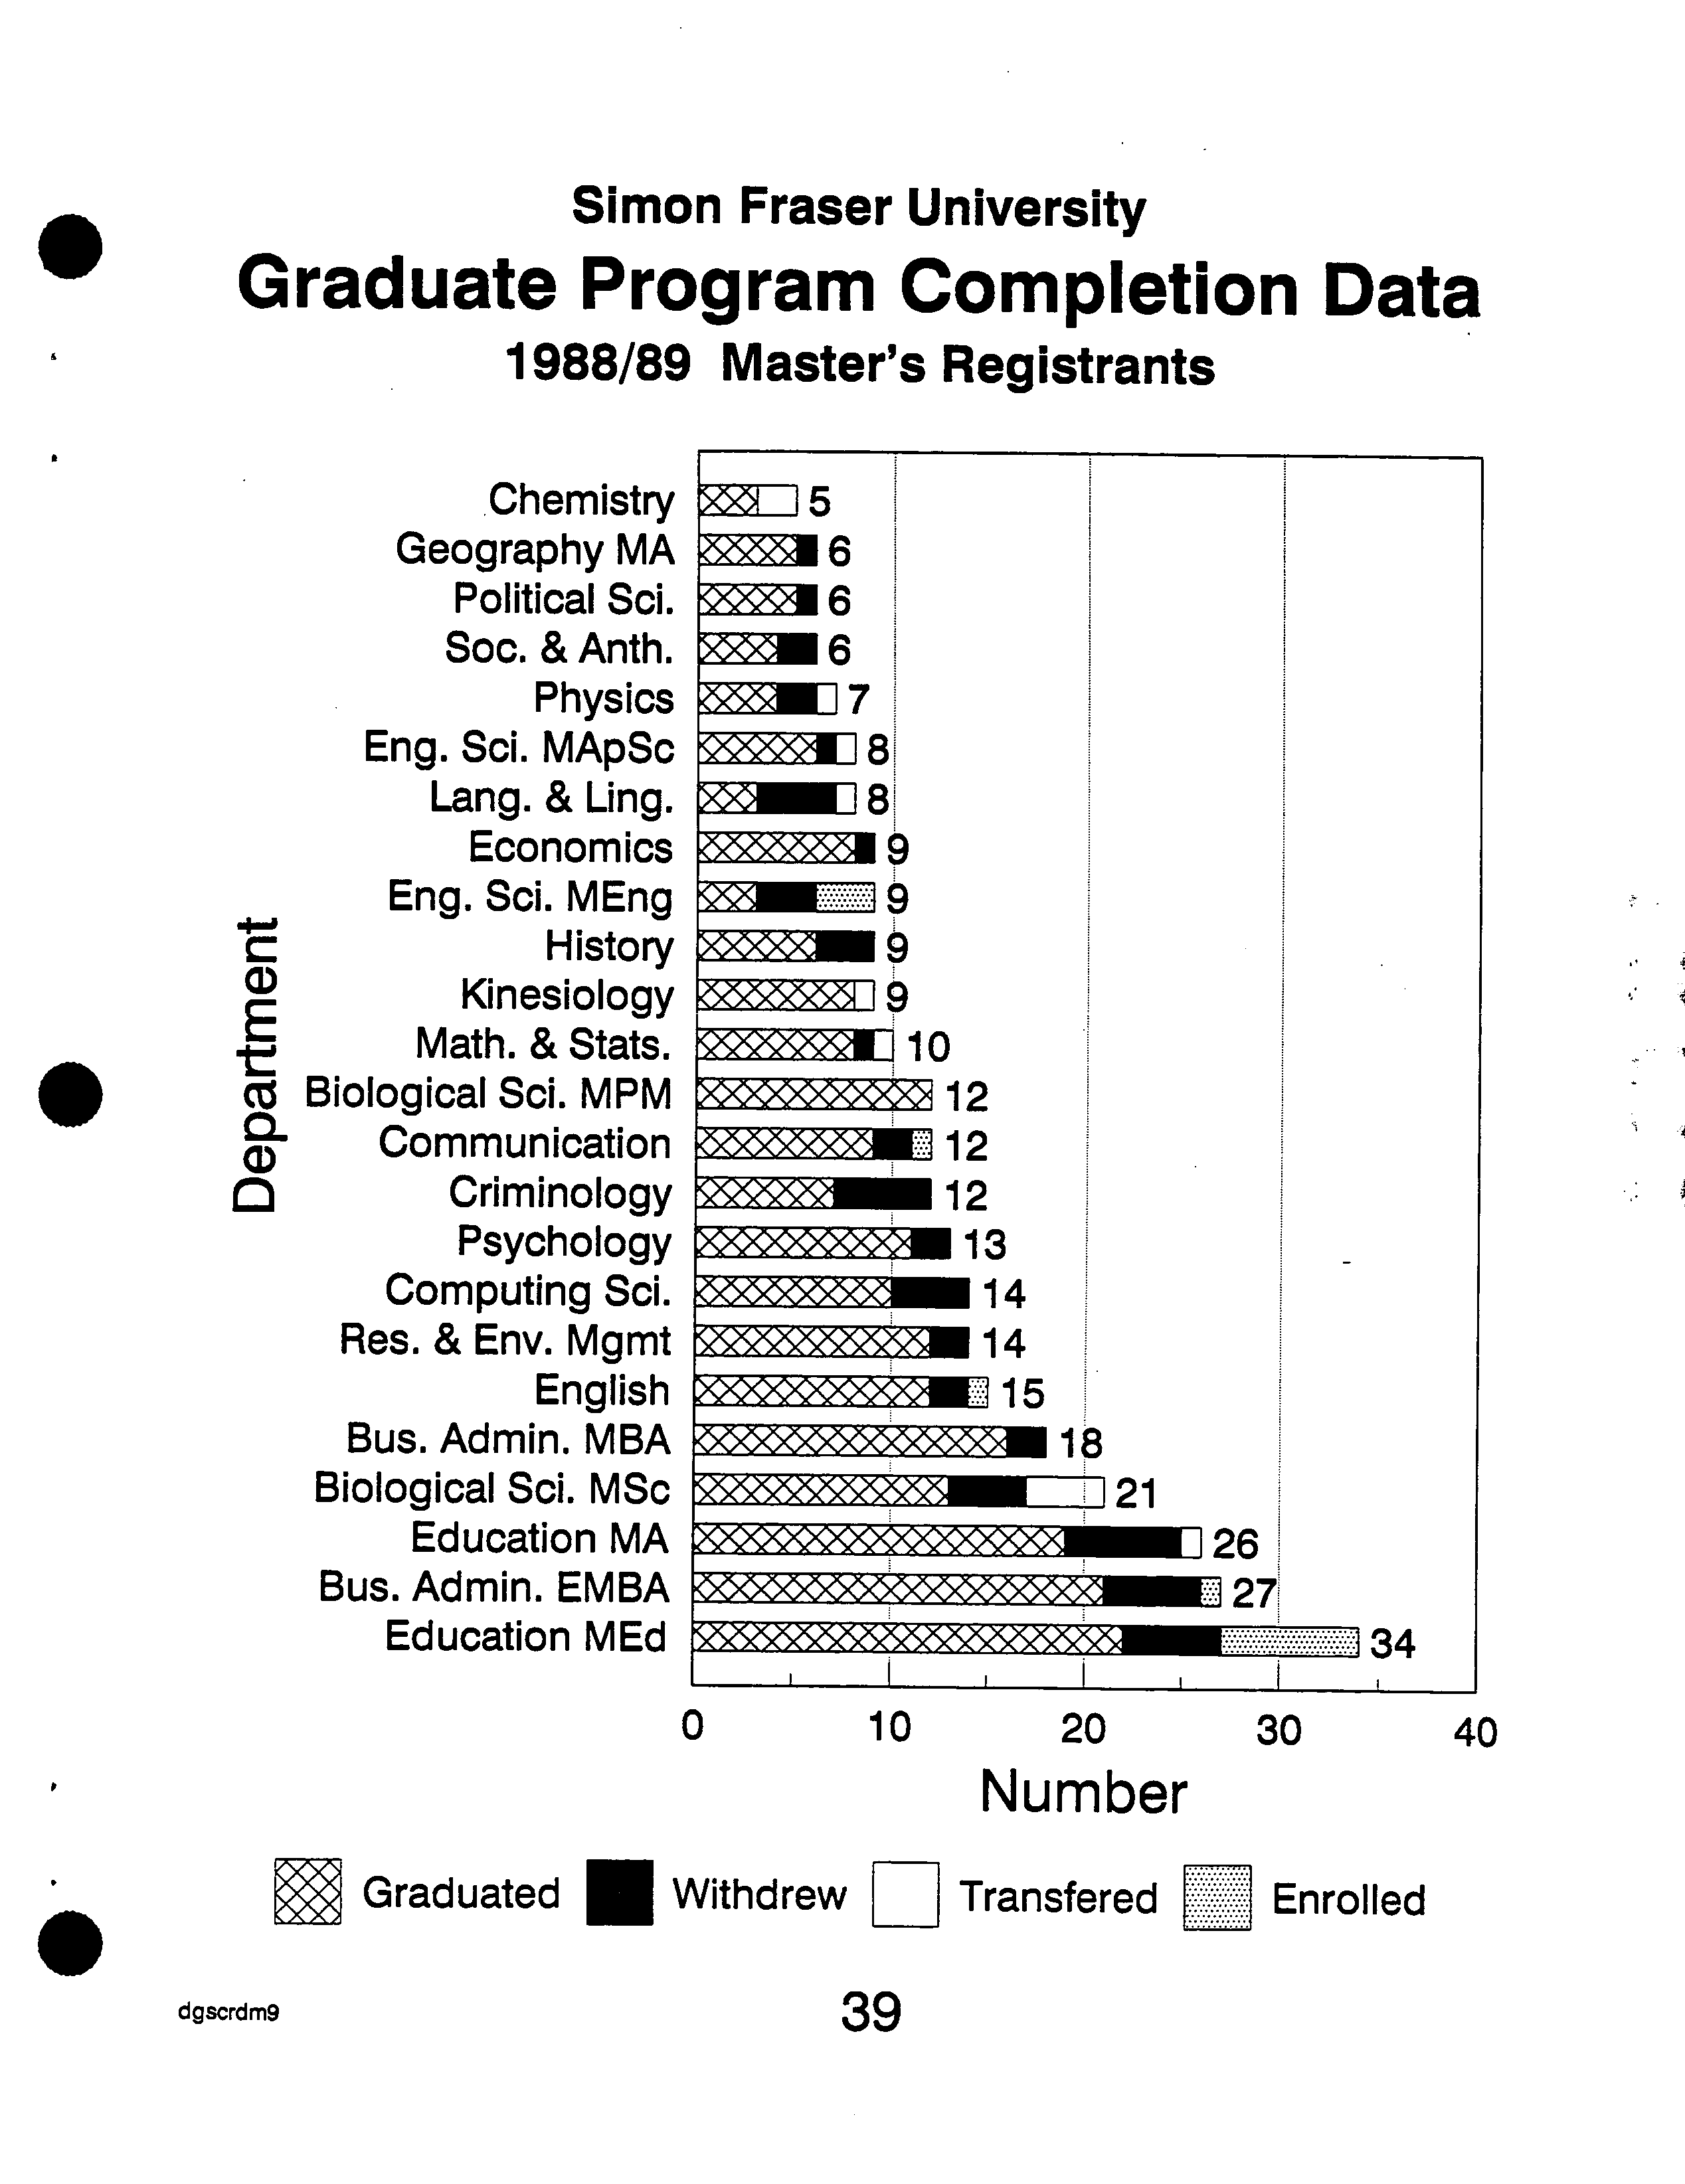
Simon Fraser University
Graduate Program Completion
1988/89 Master's Registrants
Data
Chemistry
Geography MA
Political Sci.
Soc. & Anth.
Physics
Eng. Sd. MApSc
Lang. & Ling.
Economics
Eng. Sci. MEng
History
Kinesiology
Math. & Stats.
ct
CL ?
Biological
Communication
Sci. MPM
Criminology
Psychology
Computing Sci.
Res. & Env. Mgmt
English
Bus. Admin. MBA
Biological Sci. MSc
Education MA
Bus. Admin. EMBA
Education MEd
0 ?
10 ?
20 ?
30
?
40
13
?
Number
Graduated 0Withdrew
F—I
Transfered
?
Enrolled
dgscrdm9
?
Wt
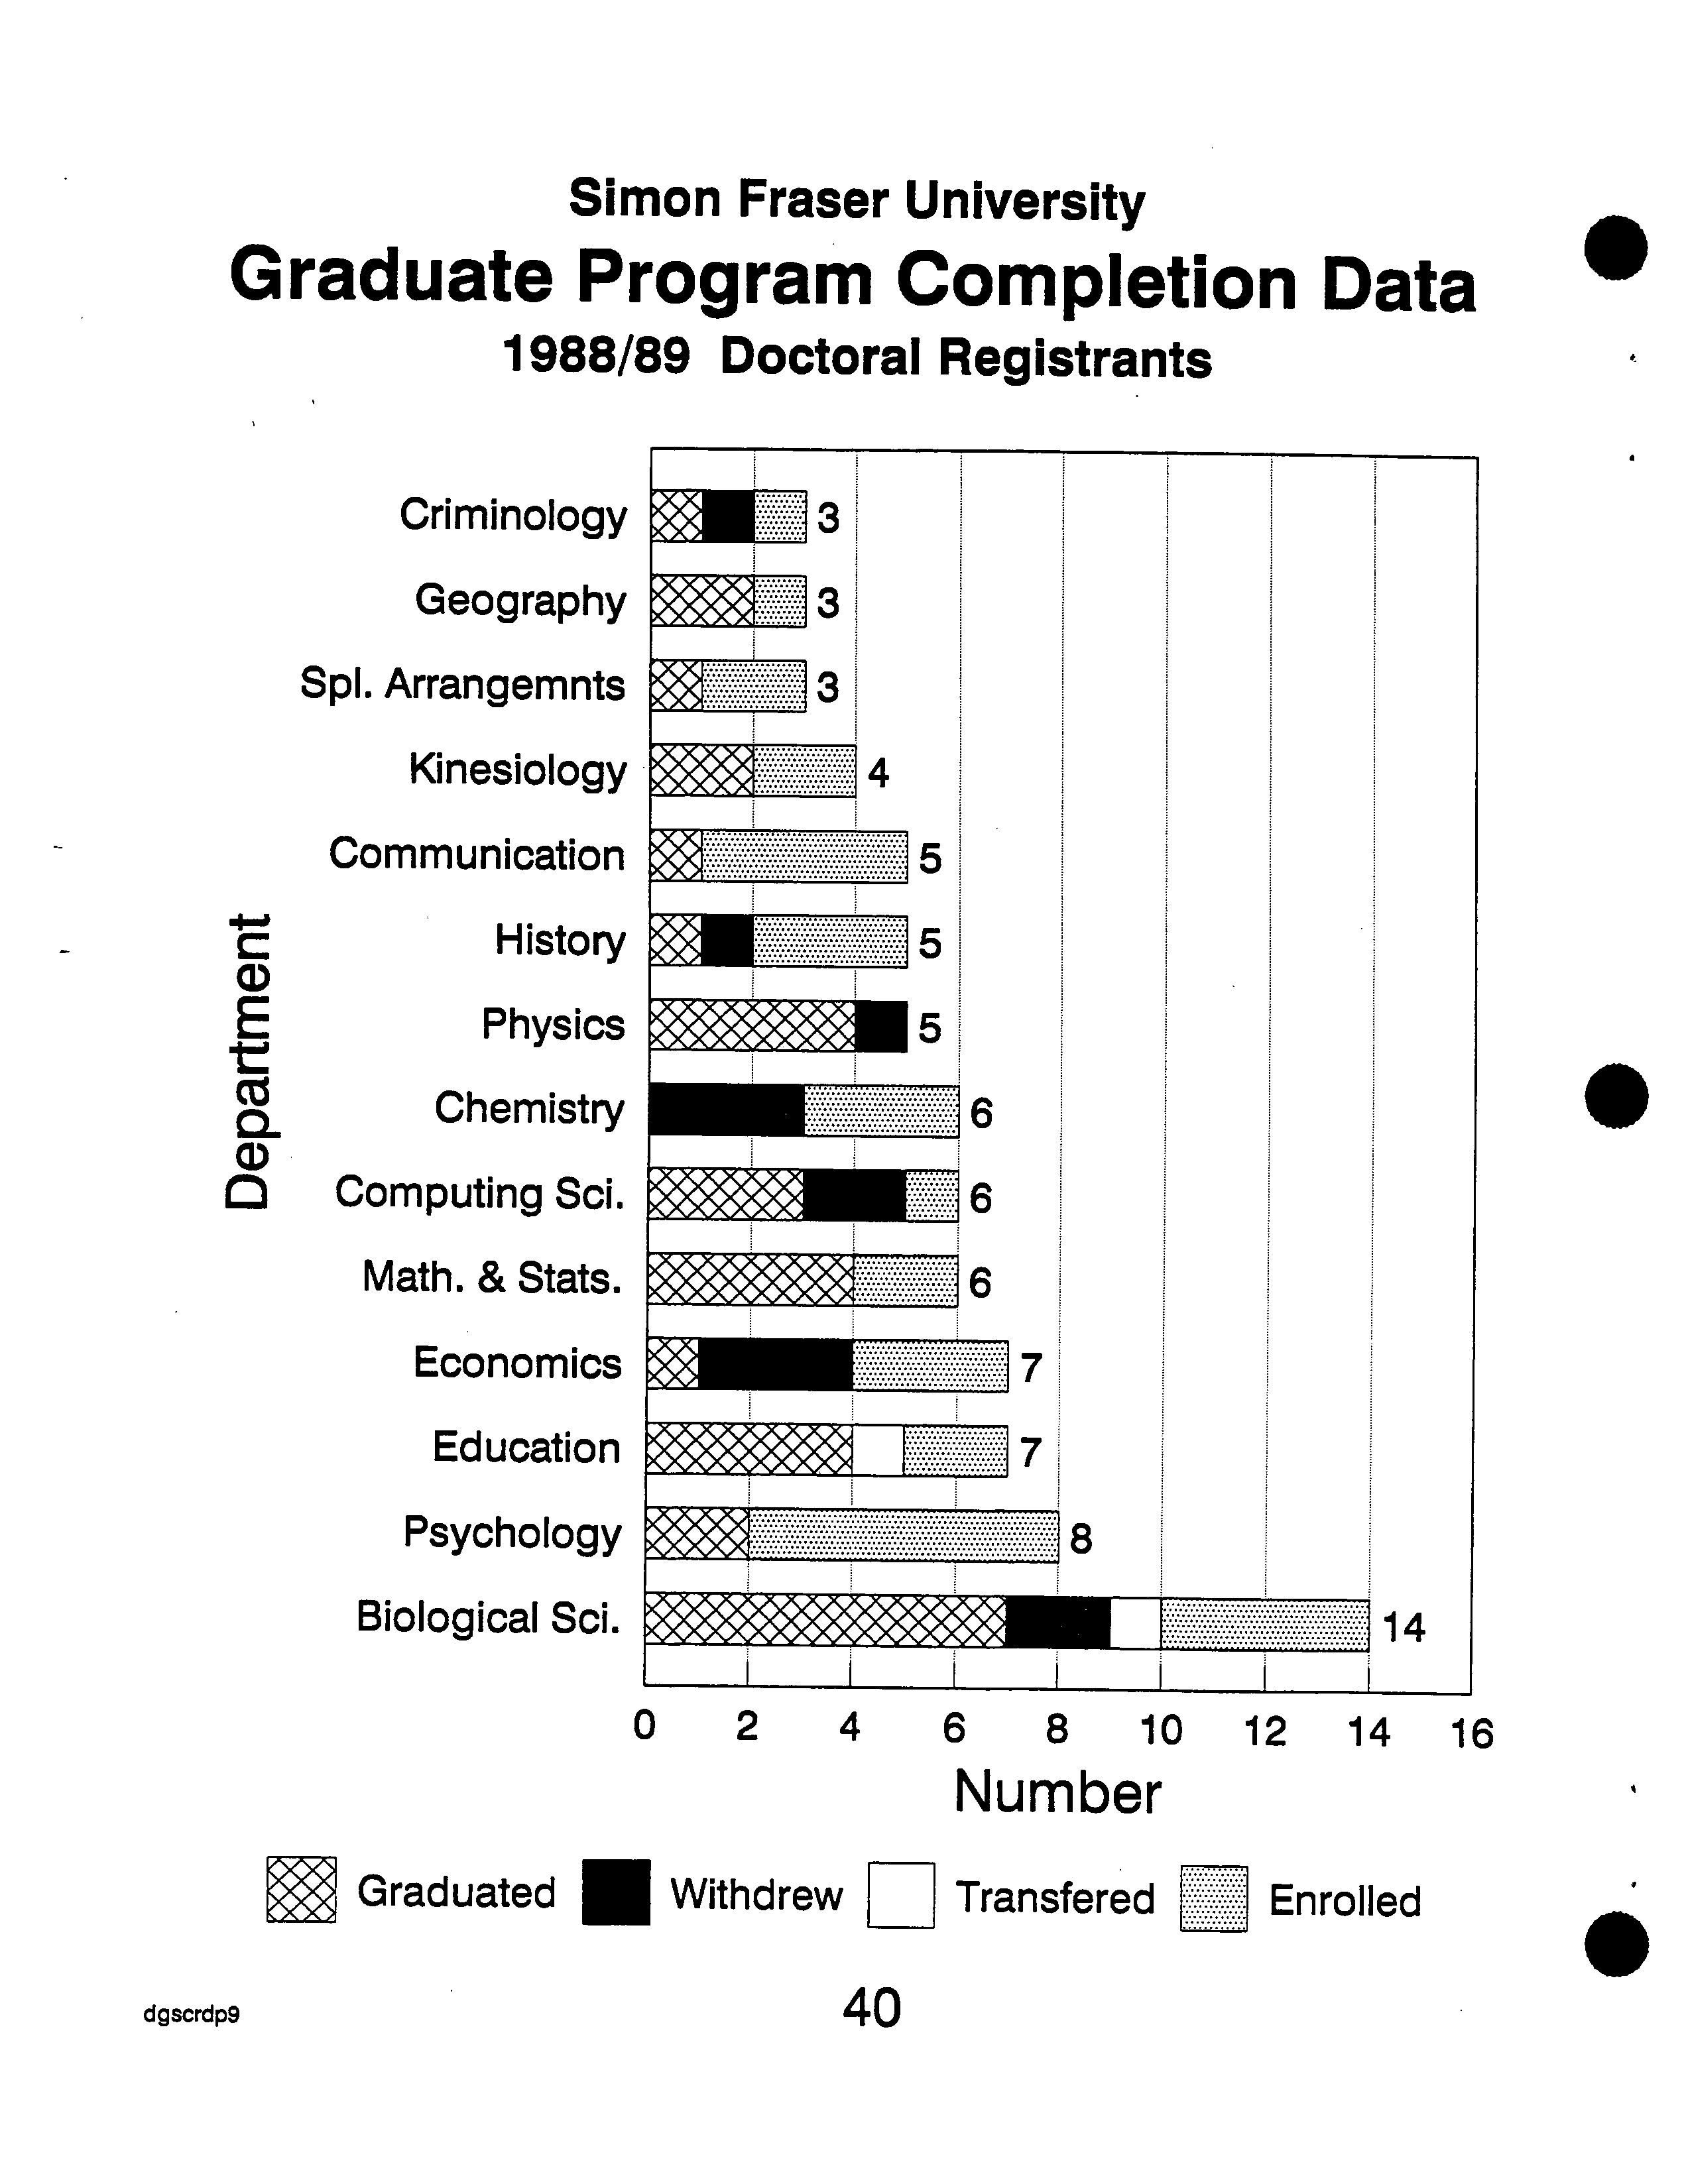
Criminology
Geography
Spi. Arrangemnts
Kinesiology
Communication
History
()
V-
Cz
CL
E
Chemistry
Physics
C)
0
Computing Sci.
Math. & Stats.
Economics
Education
Psychology
Biological Sci.
.
Simon Fraser University
Graduate Program Completion Data
1988/89 Doctoral Registrants
0
?
2 ?
4 ?
6
?
8 ?
10 12 14 16
Number
Graduated
0
Withdrew ?
Transfered ?
Enrolled
?
S
dgscrdp g ?
40
Simon Fraser
University
Degree Completion
Rates
by Department
and
Semester of
Entry
Entry
in 88-3
through
89-2
- January
1, ?
1995
Completed
Currently
Department
Pgm
Total
Degree
Withdrawn
Transfered
Enrolled
ArchaeologyArchaeology
MA
PHD
2
1
1
1
100.0%50.0%
1
0
50.0%0.0%
00
0.0%0.0%
0
0
0.0%
0.0%
Biological
Biological
Biological
Sci.Sci.Sci.
MPM
MSCPHD
21
1412
1312
7
100.0%50.0%61.9%
4
2
0
19.0%14.3%0.0%
4
01
19.0%7.1%0.0%
400
28.6%
0.0%
0.0%
BUS.
Bus. Admin.Admin.
MBA
MBE
2718
21
16
77.8%88.9%
2
5
18.5%11.1%
00
0.0%0.0%
10
3.7%
0.0%
ChemistryChemistry
MSCPHD
5
6
3
0
60.0%0.0%
0
3
50.0%
0.0%
2
0
40.0%
0.0%
3
0
50.0%
0.0%
CommunicationCommunication
MA
PHD
12
5
9
1
75.0%20.0%
2
0
16.7%0.0%
0
0
0.0%0.0%
41
80.0%
8.3%
Computing
Computing
Sci.Sci.
MSC
PHD
14
6
10
3
71.4%50.0%
42
33.3%28.6%
00
0.0%0.0%
01
16.7%
0.0%
CriminologyCriminology
MA
PHD
12
3
71
58.3%33.3%
51
41.7%33.3%
00
0.0%0.0%
1
0
33.3%
0.0%
W
Lang.
Lang.
&
&
Ling.Ling.
MA
PHD
28
1
3
50.0%37.5%
4
1
50.0%50.0%
0
1
12.5%0.0%
0
0
0.0%
0.0%
EconomicsEconomics
MA
PHD
97
81
88.9%14.3%
3
1
42.9%11.1%
0
0
0.0%0.0%
3
0
42.9%
0.0%
EducationEducationEducationEducation
MSCMED
MA
PHD
26
34
7
1
2219
4
0
57.1%73.1%64.7%0.0%
5
00
6
23.1%14.7%0.0%0.0%
00
11
14.3%0.0%0.0%3.8%
2
701
100.0%
28.6%
20.6%
0.0%
EnglishEnglish
MA
PHD
15
2
12
0
80.0%0.0%
20
13.3%0.0%
00
0.0%0.0%
2100.0%
1
6.7%
Engineering
Engineering
Sci.Sci.
MAPMEN 89
3
6
75.0%33.3%
1
3
33.3%12.5%
1
0
12.5%0.0%
3
0
33.3%
0.0%
GeographyGeographyGeography
MAMSC
PHD
23
6
22
5
100.0%83.3%66.7%
001
16.7%0.0%0.0%
0
0
0
0.0%0.0%0.0%
0
1
0
33.3%
0.0%
0.0%
HistoryHistory
MA
PHD
59
16
20.0%66.7%
1
3
20.0%33.3%
00 0.0%0.0%
3
0
60.0%
0.0%
KinesiologyKinesiology
MSCPHD
9
4
8
2
50.0%88.9%
0
0
0.0%0.0%
0
1
11.1%0.0%
20
50.0%
0.0%
41
Simon Fraser University
Degree Completion
Entry in 88-3
Rates
through
by Department
89-2 - January
and Semester
1, 1995
of Entry
?
Completed
?
Currently
Department ?
Pgm Total Degree Withdrawn Transfered Enrolled
Math.
Math. &
&Stats.
Stats.
MSC
PHD
10
6
48
80.0%66.7%
01
10.0%0.0%
01
10.0%0.0%
20
33.3%
0.0%
Philosophy
MA
1
1
100.0%
0
0.0%
0
0.0%
0
0.0%
PhysicsPhysics
MSCPHD
5
7
44
57.1%80.0%
2
1
20.0%28.6%
01
14.3%0.0%
00
0.0%
0.0%
Political Sci.
MA
6
5
83.3%
1
16.7%
0
0.0%
0
0.0%
PsychologyPsychology
MA
PHD
13
8
11
2
25.0%84.6%
20
15.4%0.0%
00
0.0%0.0%
6
0
75.0%
0.0%
Res. & Env. Mgmt
MRN
14
12
85.7%
2
14.3%
0
0.0%
0
0.0%
Soc.
Soc.
&
& Anth.Anth.
MA
PHD
1
6
4
0
66.7%0.0%
2
1
100.0%33.3%
0
0
0.0%0.0%.
0
0
0.0%
0.0%
Spl.
Spi.
ArrangemntsArrangemnts
MAS
PHD
33
1
3
100.0%33.3%
00
0.0%0.0%
00
0.0%0.0%
2
0
66.7%
0.0%
Women's Studies
MA
1
1
100.0%
0
0.0%
0
0.0%
0
0.0%
All
All
DoctoralMaster's
320
88
235
35
39.8%73.4%
5915
17.0%18.4%
12
2
2.3%3.8%
36
14
40.9%
4.4%
These data are based on the total elapsed time
in program
and
do not take
into account
part-time or on1leave
status.
a
42
Simon Fraser University
Master's Program Withdrawals
Fall 1985- Fall 1994 Part
I
£ ?
£
£
?
£
I
•
W.W.w.wqi.
ass asasas
as Sass
-
P
• asaassass
V V V V V V V V
asassasas.
V V V V
.•
5•5• w.5•5.
•A'
VSVsVaa
asrar
aTa YAY*.a
r V
V V V V V
•
a
555
V V V V V V V VV
V V V V V V
V V V V
ass__s
V V
V V V V V V
V
• £
55555 555555sss
V V V V V V V VV
V V V V V V
55
V
'V 'V
V
V V V V V
V
Contemp. Arts
Biological Sd. MPM
Bus. Admin.
Kinesiology
Psychology
Engineering Sd.
E
Bus. Admin. EMBA
Cz
?
Geography MSc
.
?
Bus. Admin. MBA
Computing Sd.
Education MSc
Biological Sci. MSc
Math. & Stats.
Res. & Env. Mgmt
Physics
Biological Sci. MAq
a
0 ?
10 ?
20
Fraction of Withdrawals (%)
University Average: 23%
dgswdrl
43
Simon Fraser University
Master's Program Withdrawals
Fall 1985- Fall 1994 Part II
?
Economics
?
22
?
Chemistry
?
23
?
Communication
?
124
?
Geography MA
?
24
Education MEd
Education MA
cz
?
English
?
30
0
?
Archaeology
?
31
Political Sci.
History
Soc. & Anth.
Criminology
Women's Studies
Philosophy
?
Eng. Sci. MEng
?
70
.
.
o
10 20 30 40 50 60 70 80
Fraction of Withdrawals (%)
University Average: 23%
dgswdr2 ?
44
Simon Fraser University
Doctoral Program Withdrawals
Fall 1985 - Fall 1994
W
.
Physics
Math. & Stats.
Chemistry
Biological Sci.
Psychology
Archaeology
Communication
E
Education
Cz
Geography
Kinesiology
Lang. & Ling.
SpI. Arrangemnts
English
Economics
Criminology
Computing Sd.
Soc. & Anth.
History
Engineering Sci.
14
19
20
21
21
IONE
44
50
52
53
82
a
o
10 20 30 40 50 60 70 80 90
Fraction of Withdrawals (%)
University Average: 31%
dgswdrp
45
24
24
15
52
0
39
50
22
46
29
26
16
29
12
70
82
30
44
101
17
160
48
14
127
12
182
85
340
415
25
41
77
44
11
132
16
19
83
23
13
64
20
96 ?
38
19
?
58
• .continued. .
a
26
41
41
33
43
39
12
38
20
48
36
122
180
34
63
46
39
22
33
23
1
24
18
14
30
12
49
45
76
13
131
20
14
75
6
142
44
239
307
20
28
64 ?
12 ?
1
92
9
0
34
19
22
59
8
15
6
1
0
0
3
0
0
2
4
1
1
1
4
1
3.
1
0
0
0
1
0
1
0
24
4
24
25
0
49
6
40
39
97 ?
107 ?
4 ?
12
9
31
9
39
7
11
3
9
36
11
N/A
45 ?
24
23
?
13
31
?
29
Simon Fraser University Completion Statistics
All
Students since Fall
1985
Report Dated:
January 1,
1995
Active
Total
W/D
Department
Pgm
Now
Degree
Trf
W/D
Completed
Rate
(%)
ArchaeologyArchaeology
PHD
MA
2312
3417
0
0
15
5
2249
23
31
Biological
Biological
Biological
Biological
Sci.Sci.Sci.Sci.
MSCMPMMAQPHD
7415
6233
100
93
86
13
26
3
1
1
2628
48
15412295
18
21
18
22
8
Bus.
Bus.
Bus. Admin.Admin.Admin.
MBWMBAMBE
1217096
26318845
000
40
32
5
22030350
10
13
15
Chemistry
MSC
Chemistry
PHD
Communication
MA
Communication
PHD
Computing Sci.
MSC
Computing Sci.
PHD
Contemp. Arts
MFA
Criminology
MA
Criminology
PHD
Economics
MA
Economics
PHD
Education
MA
Education
MED
Education
MSC
Education
PHD
Engineering Sci.
MAP
Engineering Sci.
MEN
Engineering Sci.
PHD
English
MA
English
PHD
French
MA
Geography
MA
Geography
MSC
Geography
PHD
History
MA
History
PHD
46
Simon Fraser University Completion Statistics
All Students since Fall
1985
•
Report Dated: January 1,
1995
Active
Total
W/D
Department
Pgm
Now
Degree
Trf
W/D
Completed
Rate (%)
Kinesiology
MSC
27
62
8
9
79
11
Kinesiology
PHD
22
17
0
9
26
35
Lang. & Ling.
MA
0
24
3
13
40
33
Lang. & Ling.
PHD
0
7
1
5
13
38
Liberal Studies
MAL
65
0
0
12
12
100
Linguistics
MA
7
0
0
0
0
N/A
Linguistics
PHD
16
0
0
0
0
N/A
Math. & Stats.
MSC
33
90
3
22
115
19
Math. & Stats.
PHD
27
40
2
10
52
19
Philosophy
MA
14
13
0
12
25
48
Philosophy
PHD
1
0
0
0
0
N/A
Physics
MSC
23
48
15
17
80
21
Physics
PHD
34
43
0
7
50
14
•
Political Sci.
MA
44
40
0
23
63
37-
Psychology
MA.
40
85
1
11
97
11
Psychology
PHD
70
55
0
15
70
21
Res. & Env. Mgiut
NRN
75
123
1
30
154
19
Res. & Env. Mgmt
PHD
3
0
0
0
0
N/A
Soc. & Anth.
MA
33
24
0
15
39
38
Soc. & Anth.
PHD
10
9
0
10
19
53
Sp. & Lat.
Am.
S MA
12
0
0
1
1
100
Spi. Arrangemnts
MAS
1
17
0
2
19
11
Spi. Arrangemnts
MSS
0
2
0
1
3
33
Spi. Arrangemnts
MPB
1
2
0
0
2
0
Spl. Arrangemnts
PHS
28
19
0
12
31
39
Women's Studies
MA
16
14
0
12
26
46
Totals ?
Masters
1546
2606
97
805
3508
23
Totals ?
Doctoral
600
496
19
234
749
31
Totals
All
2146
3102
116 ?
1039
4257
24
Active Now = headcount
enrolment
in
the most
recent
semester.
•
Degree = number of
degrees
completed.
Trf = number of
students
who
transferred
to
a different
•
degree program
without completing
the first.
W/D = number of
students
who
withdrew
without completing
a
degree
W/D Rate = ratio of W/D to
Total Completed.
47
25 16.3%
oral Entrance 5 3.3%
Entrance 10 6.5%
Simon Fraser University
?
0
Distribution of S.F.U. Awards
?
4
Fall 1994
?
Li
Master's GF 66 43.1%
Doctoral GF 47 30.7%
Total One-Semester Awards = 152 ?
Full Time Enrolments: Master's = 1,257 Ph.D. = 557
a
dgsawl
48
.
1'