S.95-13
is ?
SIMON FRASER UNIVERSITY
OFFICE OF THE VICE-PRESIDENT, ACADEMIC
?
MEMORANDUM
To: ?
Senate
From:
?
J.
M. Munro, Chair
Senate Committee on Academic Planning
Subject: ?
International Student Intake Targets for 1995/96
Date:
?
February 13, 1995
The Senate Committee on Enrollment Management and Planning and the Senate
Committee on Academic Planning have recommended the following motion for
consideration by Senate. Documentation is attached which provides more background
information.
Motion:
"That Senate approve and recommend approval to the Board of
Governors that the number of international students admitted
into undergraduate programs at
SFU
in 1995/96 not exceed 7%
of all admissions."
.4k.
^"
L
SCAP 95-3b
SIMON FRASER UNIVERSITY
I
?
MEMORANDUM
TO: Senate Committee on
?
FROM: Walter J
.
Wattamaniuk
Academic Planning
?
0 ?
Director, Analytical Studies
Secretary to SCEMP
RE: International Student Intake
?
DATE: February 3, 1995
Targets for 1995/96
Action taken by the Senate Committee on Enrollment Management and Planning at
its meeting of November 23, 1994 gives rise to the following motion for
consideration by SCAP. Documentation is attached which provides more
background information.
Motion 1.
""That SCAP approve and recommend approval to Senate that the
number of international students admitted into undergraduate programs
at SFU in 1995/96 not exceed 7% of all admissions"
. Attach.
.
1.
INTERNATIONAL UNDERGRADUATE STUDENT. REGISTRATIONS AT SFU
NEW
REGISTRANTS
ALL
REGISTRANTS
Sem/AcadYea
visa
All
Visa
All
Students
Students
visa
Students
Students
1987/88
87-2
68
712
9.6%
?
.
528
6,078
8.7%
87-3
156
3,365
4.6%
670
12,404
5.4%
88-1
84
1,065
7.9%
679
12,093
5.6%
Total
308
5,142
6.0%
1,877
30,575
6.1%
1988/89
88-2
76
711
10.7%
559
6,756
8.3%
88-3
122
2,866
4.3%
697
12,693
5.5%
89-1
69
1,053
6.6%
674
12,359
5.5%
Total
267
4,630
5.8%
1,930
31,808
6.1%
1989/90
89-2
73
805
9.1%
550
7,331
7.5%
89-3
138
3,679
3.8%
713
14,323
5.0%
90-1
85
1,302
6.5%
.
?
706
14,096
5.0%
Total
296
5,786
5.1%
. ?
1,969
35,750
5.5%
1990/91
90-2
94
748
12.6%
. ?
.
?
596 7,972
7.5%
90-3
157
2,985
5.3%
.
?
755 14,551
5.2%
91-1
140
1,472
9.5%
. ?
813 14,613
5.6%
Total
391
5,205
7.5%
2,164
37,136
5.8%
1991/92
91-2
126
1,008
12.5%
.
?
721
9,015
8.0%
91-3
122
2,794
4.4%
.
?
819
15,299
5.4%
92-1
106
. 788
13.5%
858
14,370
6.0%
Total
354
4,590
7.7%
. ?
2,398 38,684
6.2%
1992/93
92-2
89
770
11.6%
702
8,505
8.3%
92-3
115
2,935
3.9%
815
15,239
5.3%
93-1
.
43
458
9.4% ?
. .
.
?
744 14,148
5.3%
Total
247
4,163.
5.9%
2,261
37,892
6.0%
1993/94
93-2
68
919
74%
627
8,828
7.1%
933
98
2,663
3.7%
675
14,841
4.5%
94-1
77
1,436
5.4% ?
.
662
14,864
4.5%
Total
243
5,018
4.8% ?
.
1,964
38,533
5.1%
1994/95
.
?
.
94-2
76
1,181
6.4%
.
?
530
8,957
5.9%
94-3
126
3,241
39%
609
15,931
3.8%
95-1
64
1,387
4.6%
601
15,741
3.8%
Total
266
5,809
4.6%
1,740
40,629
4.3%
S
a.
I
SIMON FRASER UNIVERSITY
UNDERGRADUATE STUDENT VISAS BY BOA
B.C. College Transfer
B.C. Grade 12
Associate Degree from a B.C. College
B.C. University Transfer
B.C. Degree Holder
B.C. Tech Transfer
B.C. Visiting
Non B.C. University Transfer
Non B.C. College Transfer
Non B.C. Degree Holder
Non B.C. Visiting
Non B.C. Tech Transfer
Foreign Grade 12/13
Non B.C. Grade 12/13
U.S. Grade 12
?
93-3
?
94-3
?
New
?
New
?
34
?
36
?
13
?
15
1
1
2
?
10
?
3
?
1
?
2
?
3
?
9
?
23
?
42
1
?
7
?
7
?
2
?
4
?
1
?
2
International Bacc.
?
1 ?
Mature
Sen. App. Board
Special Entry
?
1
ABE Prov. Diploma
?
1 ?
Unknown
Total ?
98 ?
126
FIGURE 1
?
SIMON FRASER UNIVERSITY
?
UNDERGRADUATE INTERNATIONAL STUDENTS ON STUDENT VISAS -. BY COUNTRY OF ORIGIN
-
350
300
\Hong Kong
?
250 -
?
---
?
- -
?
1: ?
srna/\
100 -
-Malaysia'
I ?
-,
:..
• ?
X. - - - ?
-,.- ?
x
.
50
T ?
-United States
50
• ?
:
Germany
0
1985
?
1986
?
1987 ?
1988
?
1989
?
1990
?
1991 ?
1992 ?
1993
?
1994
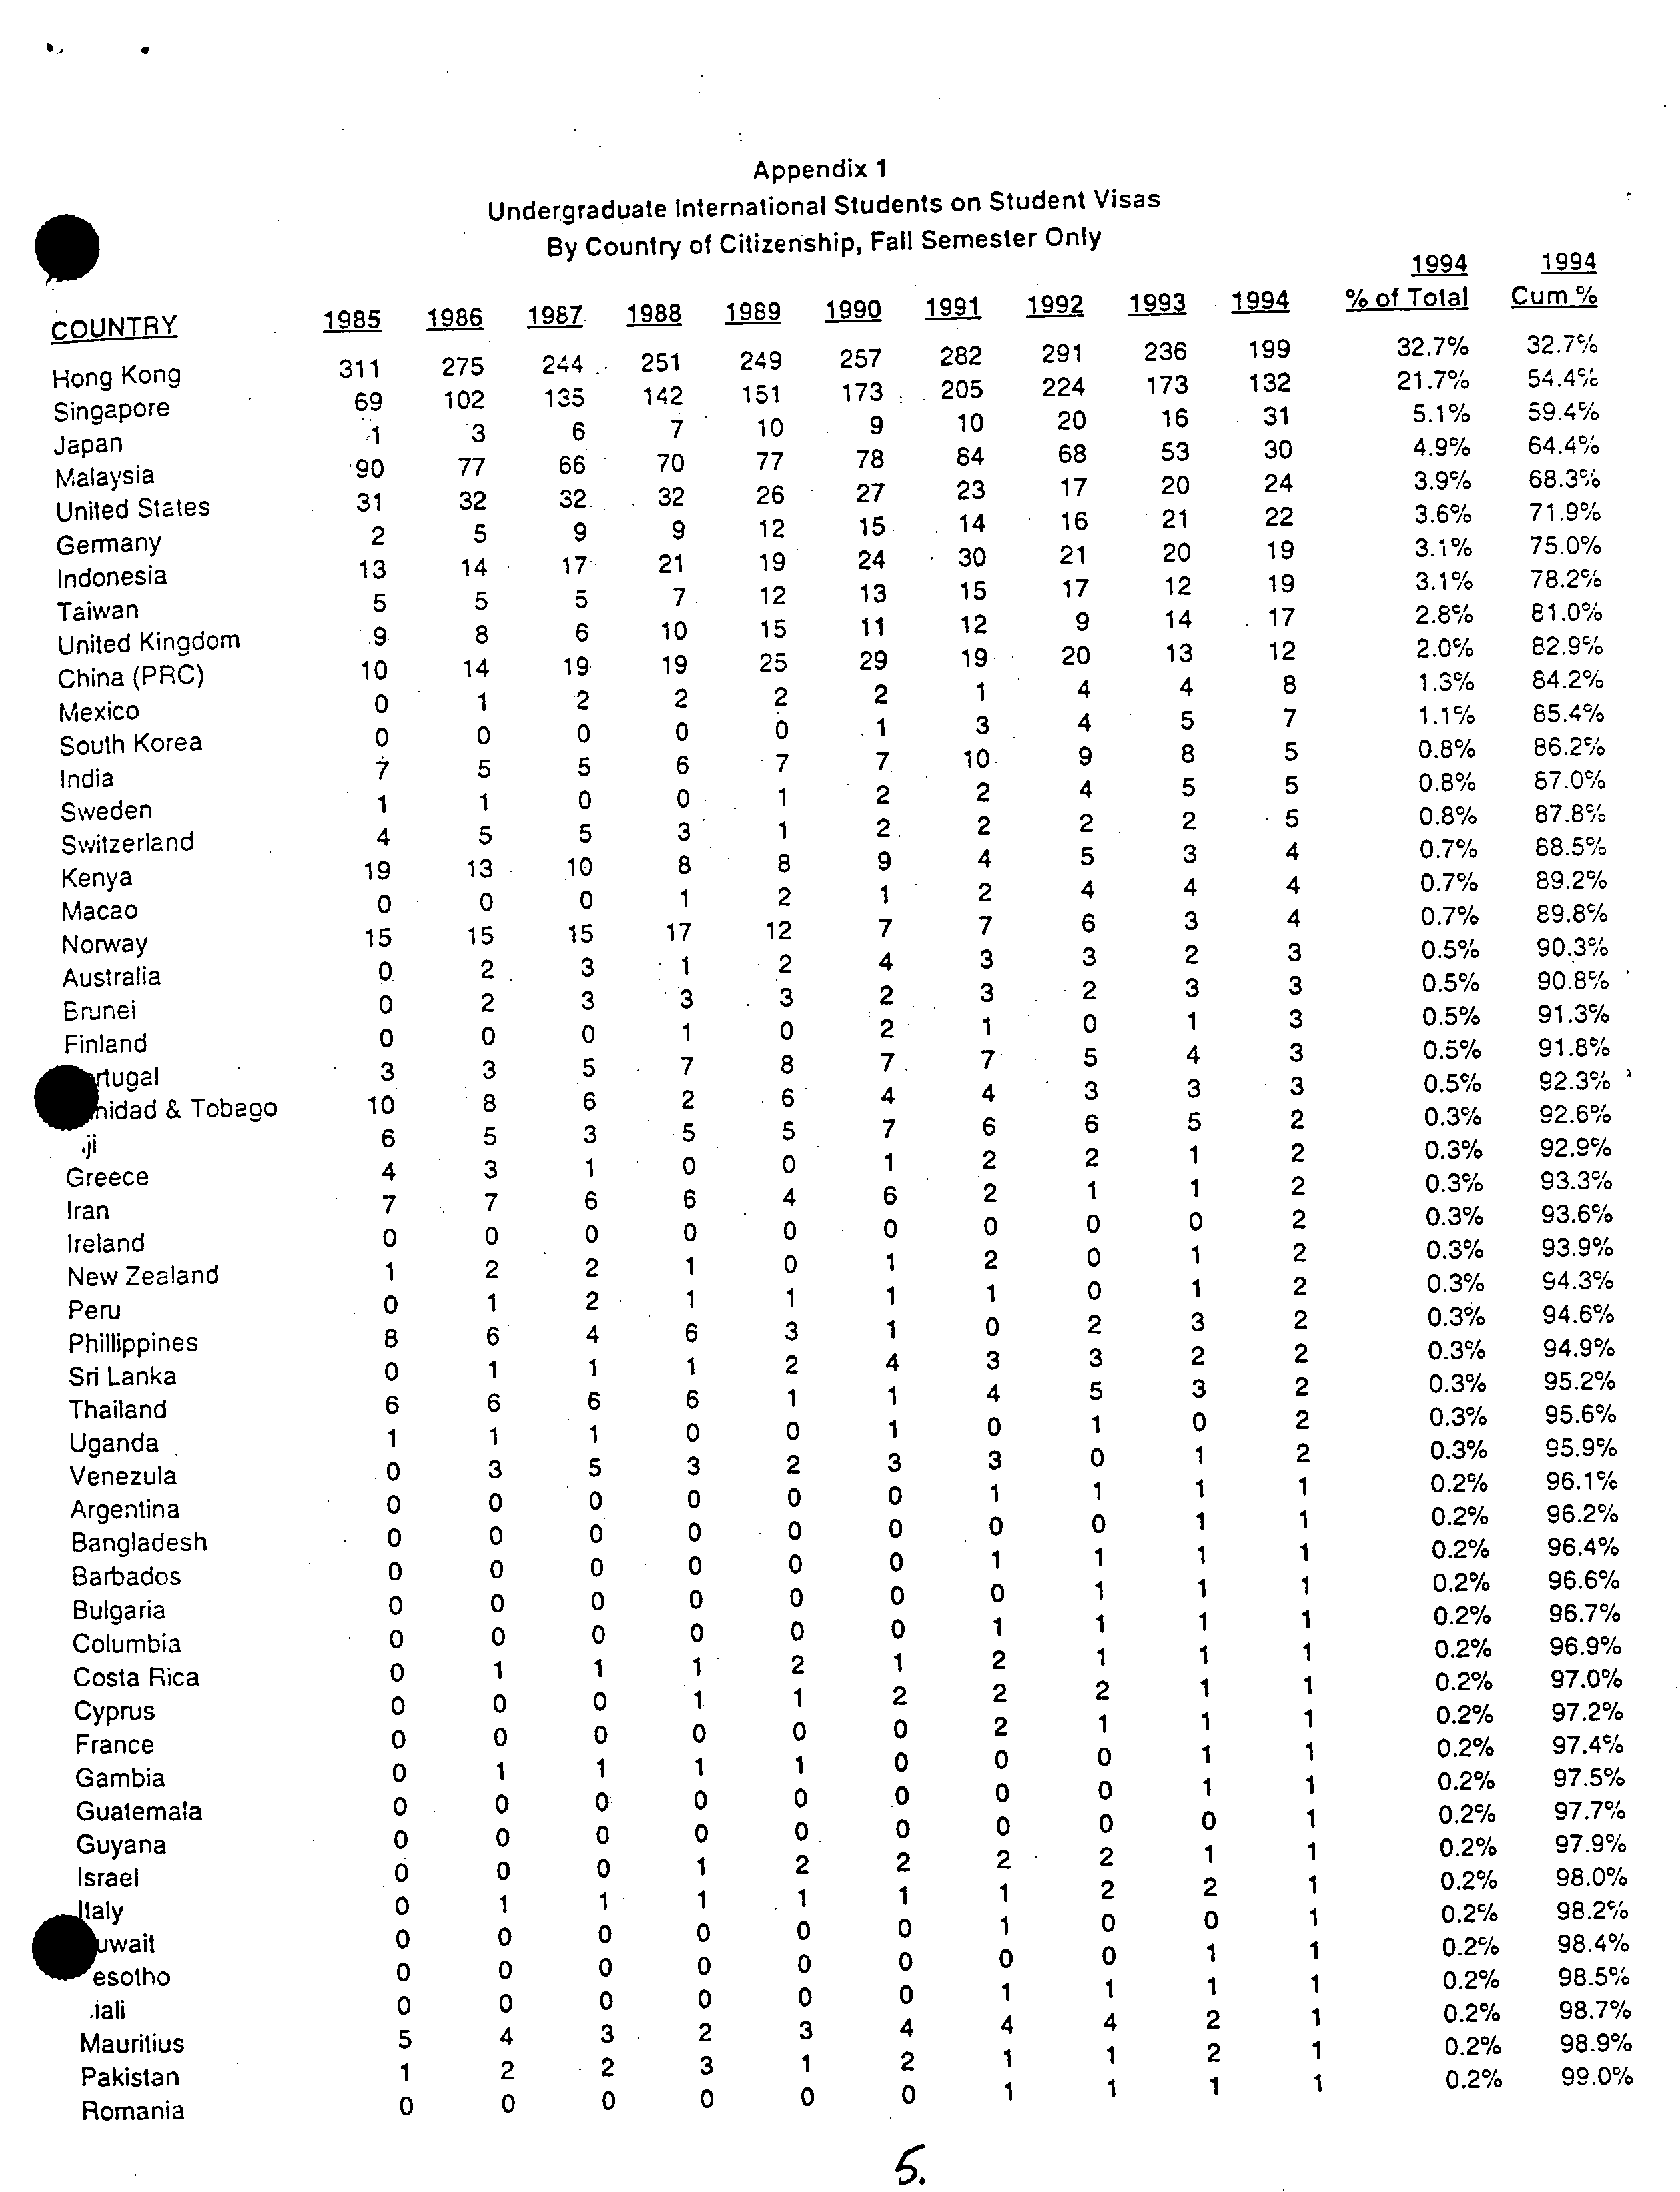
Appendix 1
Undergraduate
International
Students on Student Visas
By Country
of
Citizenship, Fall Semester Only
1994
1994
1985
1986
1987
1988
1989
1990
?
1991
1992
1993
1994
%of Total
Cum%
311
275
244
251
249
257
282
291
236
199
32.7%
32.7%
69
102
135
142
151
173
205
224
173
132
21.7%
54.45'.
I
3
6
7
10
9
10
20
16
31
5.1%
59.4%
90
77
66
70
77
78
64
68
53
30
4.9%
64.411/6
31
32
32
32
26
27
23
17
20
24
3.9%
68.3%
2
5
9
9
12
15
14
16
21
22
3.6%
71.9%
13
14
17
21
19
24
30
21
20
19
3.1%
75.0%
5
5
5
71
12
13
15
17
12
19
3.1%
78.256
9
8
6
10
15
11
12
9
14
17
2.8%
81.0%
10
14
19
19
25
29
19
20
13
12
2.0%
82.95'6
2
2
2
2
1
4
4
8
1.3%
64.2%
0
1
0
0
0
.1
3
4
5
7
1.1%
65.4%
0
0
5
6
7
7
10
9
8
5
0.8%
86.2%
7
5
0
0
1
2
2
4
5
5
0.8%
87.0%
1
4
1
5
5
3
1
2
2
2
2
5
0.8%
87.8%
19
13
10
8
8
9
4
5
3
4
0.7%
68.5%
0
0
1
2
1
2
4
4
4
0.7%
89.2%
0
15
15
15
17
12
7
7
6
3
4
0.7%
89.8%
0
2
3
1
2
4
3
3
2
3
0.50/10
90.30/10
2
3
3
3
2
3
2
3
3
0.5%
90.8%
0
0
1
0
2
1
0
1
3
0.5%
91.3%
0
0
5
7
8
7.
7
5
4
3
0.5%
91.8010
3
3
8
6
2
6
4
4
3
3
3
0.5%
92.30/0
10
6
5
3
5
5
7
6
6
5
2
0.3%
92.60/0
1
0
0
1
2
2
1
2
0.3%
92.9%
4
3
6
6
4
6
2
1
1
2
0.3%
93.3%
7
0
7
0
0
0
0
0
0
0
0
2
0.3%
93.6%
2
2
1
0
1
2
0
1
2
0.3%
93.9%
1
1
1
1
1
0
1
2
0.3%
94.3%
0
1
2
4
6
3
1
0
2
3
2
0.36/6
94.6%
8
6
1
1
2
4
3
3
2
2
0.3%
94.9%
0
1
6
6
6
1
1
4
5
3
2
0.3%
95.2%
6
1
0
0
1
0
1
0
2
0.3%
95.6%
1
1
3
5
3
2
3
3
0
1
2
0.3%
95.9%
0
0
0
0
0
0
0
1
1
1
1
0.2%
96.1%
0
0
0
0
0
0
0
0
1
1
0.2%
96.2%
0
0
0
0
0
1
1
1
1
0.2%
96.4%
0
0
0
0
0
0
0
1
1
1
0.2%
96.6%
0
0
0
0
0
1
1
1
1
0.2%
96.7%
0
0
2
1
2
1
1
1
0.2%
96.9%
0
1
1
1
1
2
2
2
1
1
0.2%
97.0%
0
0
0
1
0
2
1
1
1
0.2%
97.2%
0
0
0
0
0
0
0
0
1
1
0.2%
97.4%
0
1
1
1
1
0
0
0
0
1
1
0.2%
97.5%
0
0
0
0
0
0
0
0
1
0.2%
97.7%
0
0
0
0
0
2
2
1
1
0.2%
97.9%
o
0
0
1
2
2
1
2
2
1
0.2%
98.0%
0
1
1
1
1
1
1
0
0
1
0.2%
98.2%
0
0
0
0
0
0
0
0
1
1
0.2%
98.4%
0
0
0
0
0
0
1
1
1
1
0.2%
98.5%
0
0
0
0
0
0
4
4
4
2
1
0.2%
98.7%
5
4
3
2
3
1
1
2
1
0.2%
98.9%
1
2
2
3
1
2
1
1
1
1
0.2%
99.0%
0
0
0
0
0
0
0
coij.tLiE_
Hong Kong
Singapore
Japan
Malaysia
United States
Germany
Indonesia
Taiwan
United Kingdom
China (PRO)
Mexico
South Korea
India
Sweden
Switzerland
Kenya
Macao
Norway
Australia
Brunei
Finland
riugal
idad & Tobago
Greece
Iran
Ireland
New Zealand
Peru
Phillippines
Sri Lanka
Thailand
Uganda
Venezula
Argentina
Bangladesh
Barbados
Bulgaria
Columbia
Costa Rica
Cyprus
France
Gambia
Guatemala
Guyana
Israel
tall
wait
esotho
.iali
Mauritius
Pakistan
Romania