For Information
?
S.96-25
SIMON FRASER UNIVERSITY
.
Senate Graduate Studies Committee
1995 REPORT TO SENATE
The Dean of Graduate Studies is responsible for the general supervision of graduate work at the
University. This report outlines the position of graduate studies at Simon Fraser University, de-
scribes some changes made in 1995 and makes suggestions of future directions. It is clear that the
future will not merely be an extrapolation of the past. Reductions in Provincial funding for at least
the next two fiscal years will put serious pressure on all the University's programs and will
prompt critical examination of all we are doing.
In January 1994, the combination of the positions of Dean of Graduate Studies and Vice-
President, Research was formalized by the President and Board of Governors. This was in rec-
ognition of the commonality of many of the interests of the two positions and the need to reduce
administrative costs. In July 1994, I accepted a 26-month appointment as Vice-President, Re-
search, retaining responsibility for the Graduate Studies portfolio, as well. Dr. Phyllis M. Wrenn
of the Department of French accepted a
3
/4-time appointment as Associate Dean of Graduate
Studies for the same period. Dr. Wrenn has primary responsibility for matters related to individual
student and individual programs, and chairs the Senate Graduate Awards Adjudication Committee
and the Assessment Committee for New Graduate Programs. I am responsible for policy matters
and external relations, sit on Senate and chair the Senate Graduate Studies Committee.
The January 1995 edition of the S.F.U. Graduate Studies Fact Book describes, in quantitative
terms, the graduate student body in Fall 1994 and provides some retrospective data on completion
rates. It was the sixth edition, designed to complement information in the Simon Fraser University
Fact Book, produced by the Office of Analytical Studies. A copy for perusal is available from the
Secretary of Senate. The Fact Book has moved to biennial production due to budget shortfalls,
workload pressures and the fact that the cumulative data change rather slowly.
L Enrollments and Degrees
The first section of the Graduate Studies Fact Book shows the recent history of graduate enroll-
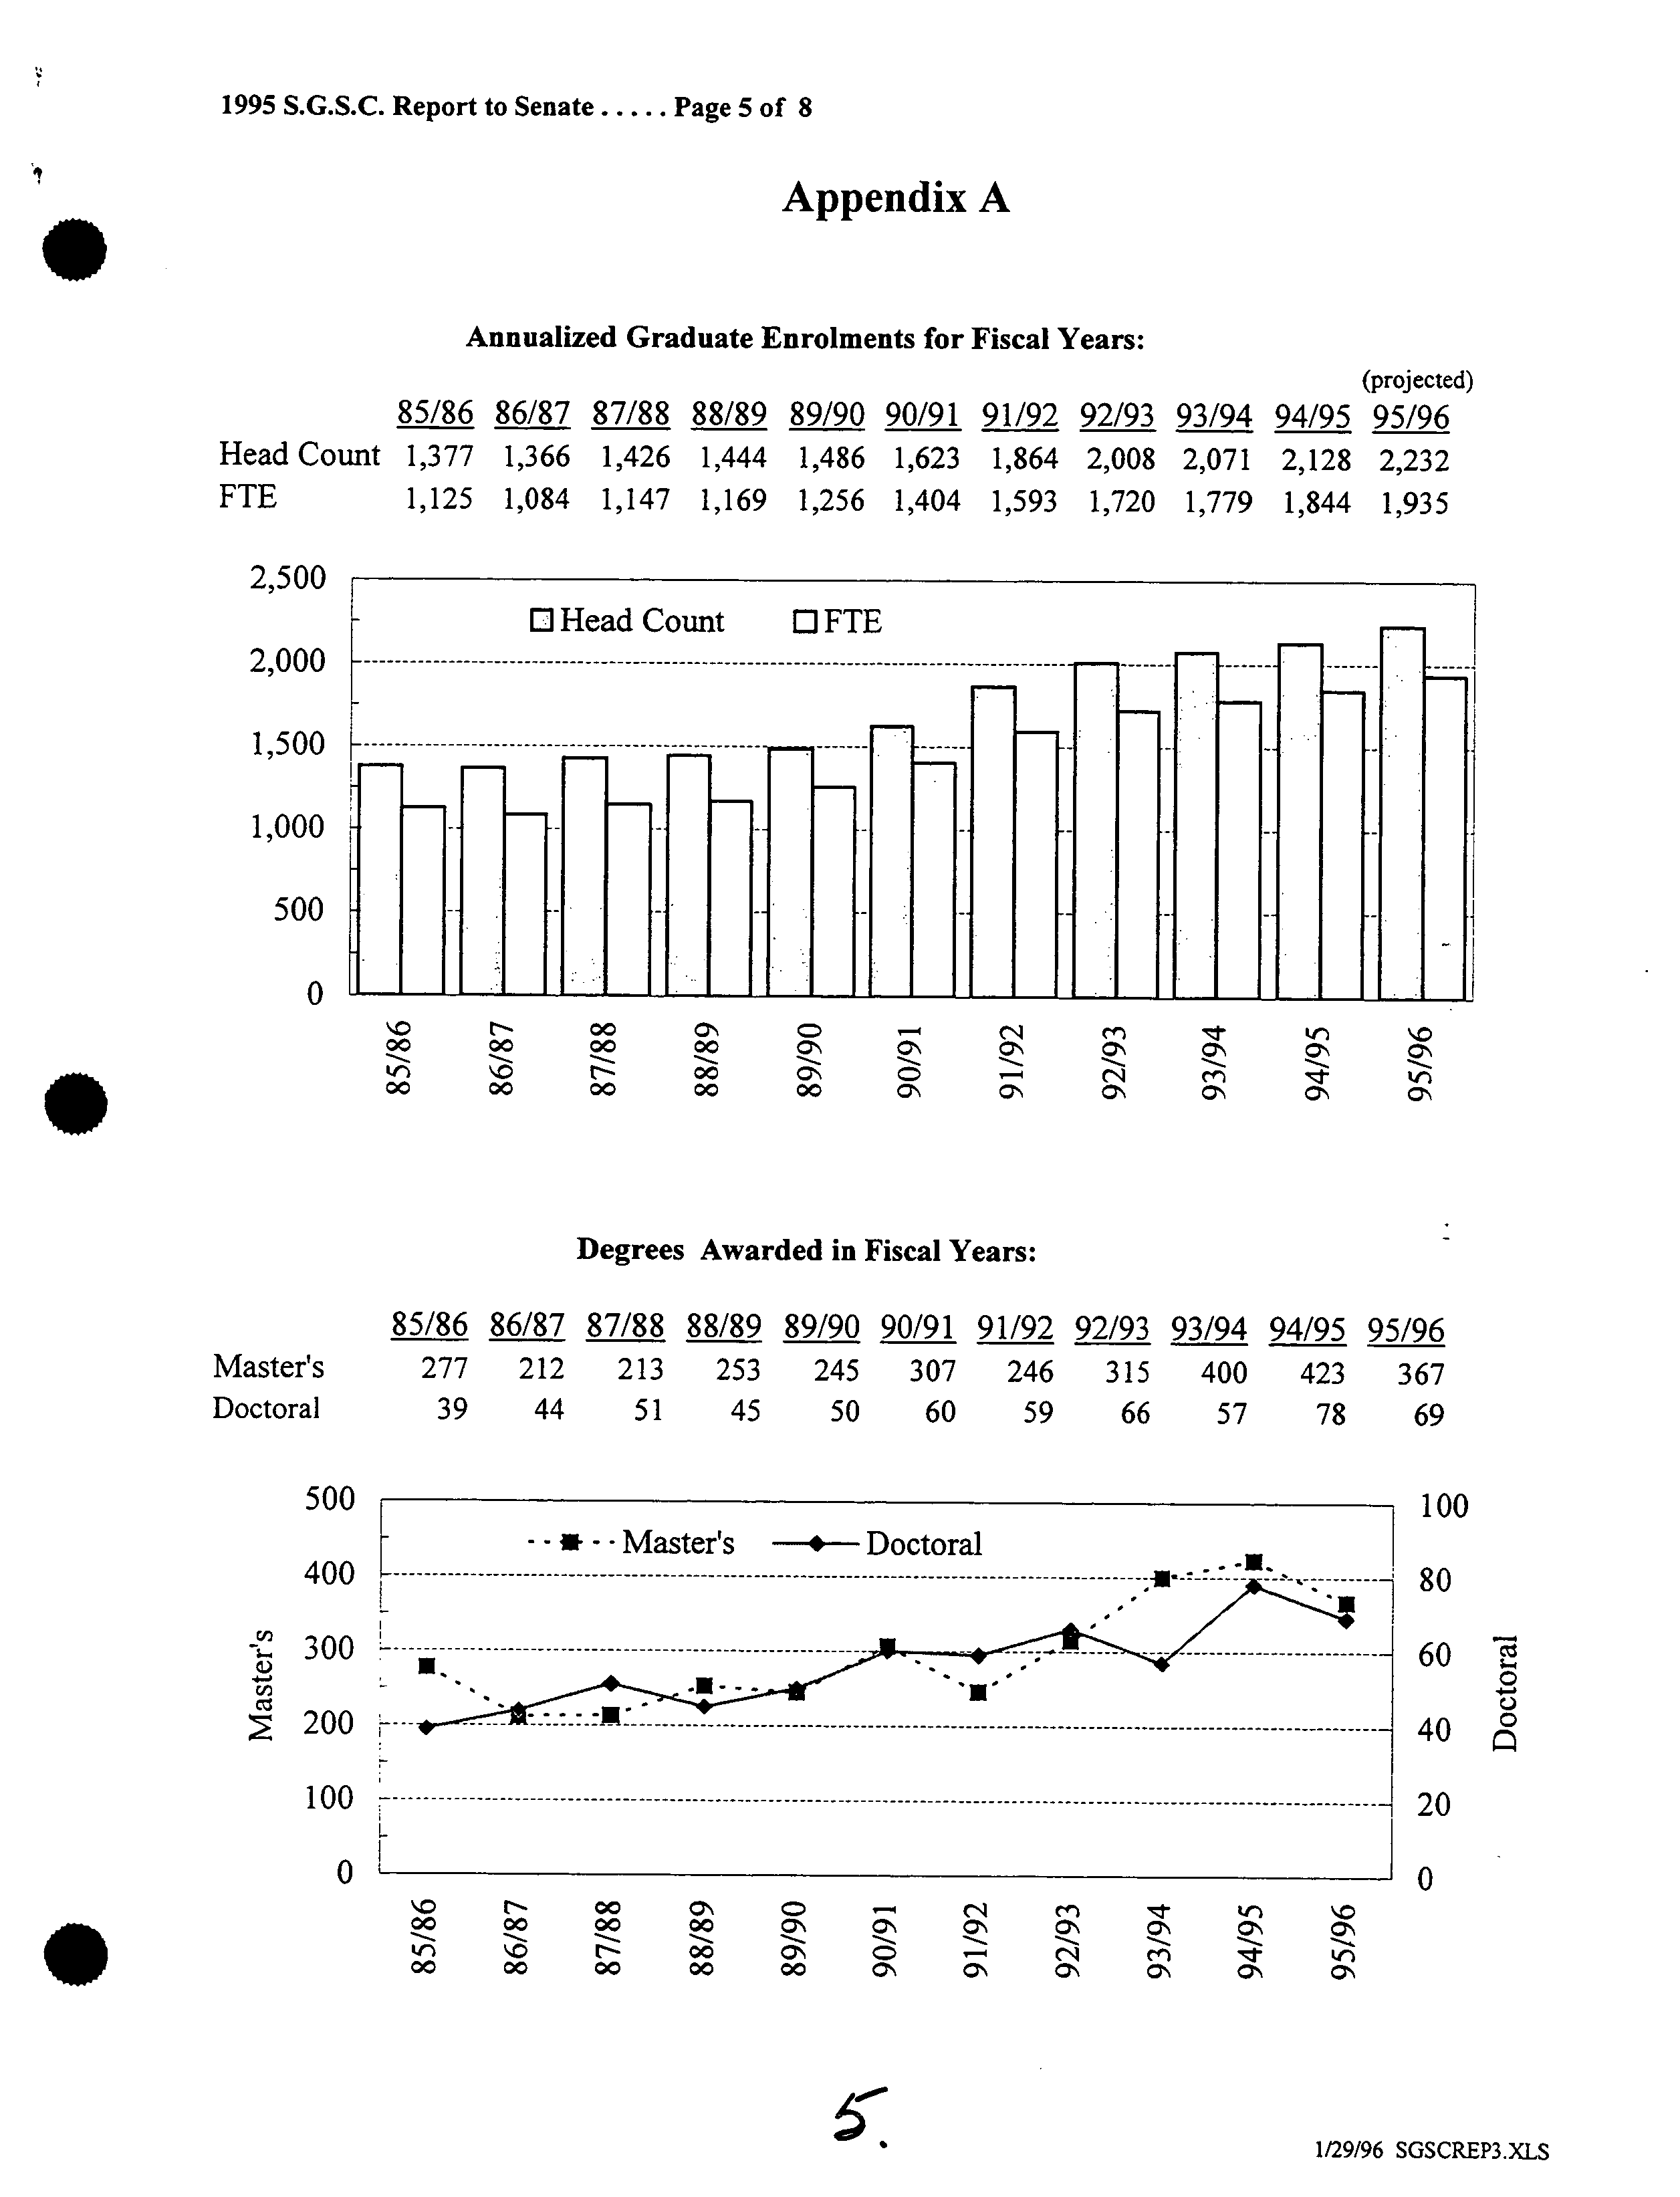
ments and degrees granted; an updated version is attached to this report as Appendix A. The FTh
enrollment figures should be treated with caution on two grounds. Prior to the Fall 1989, they
were determined through a reporting process which was subject to considerable variation between
departments. Starting in the Fall 1989, a new, rigorous definition of Part-Time status was
adopted; this was primarily responsible for the change in the (Head Count)IFTE ratio between
88/89 and 89/90. The official recognition of Part-Time status and the introduction of a reduced
. semester tuition fee for Part-Time students were major advances in improving the accessibility of
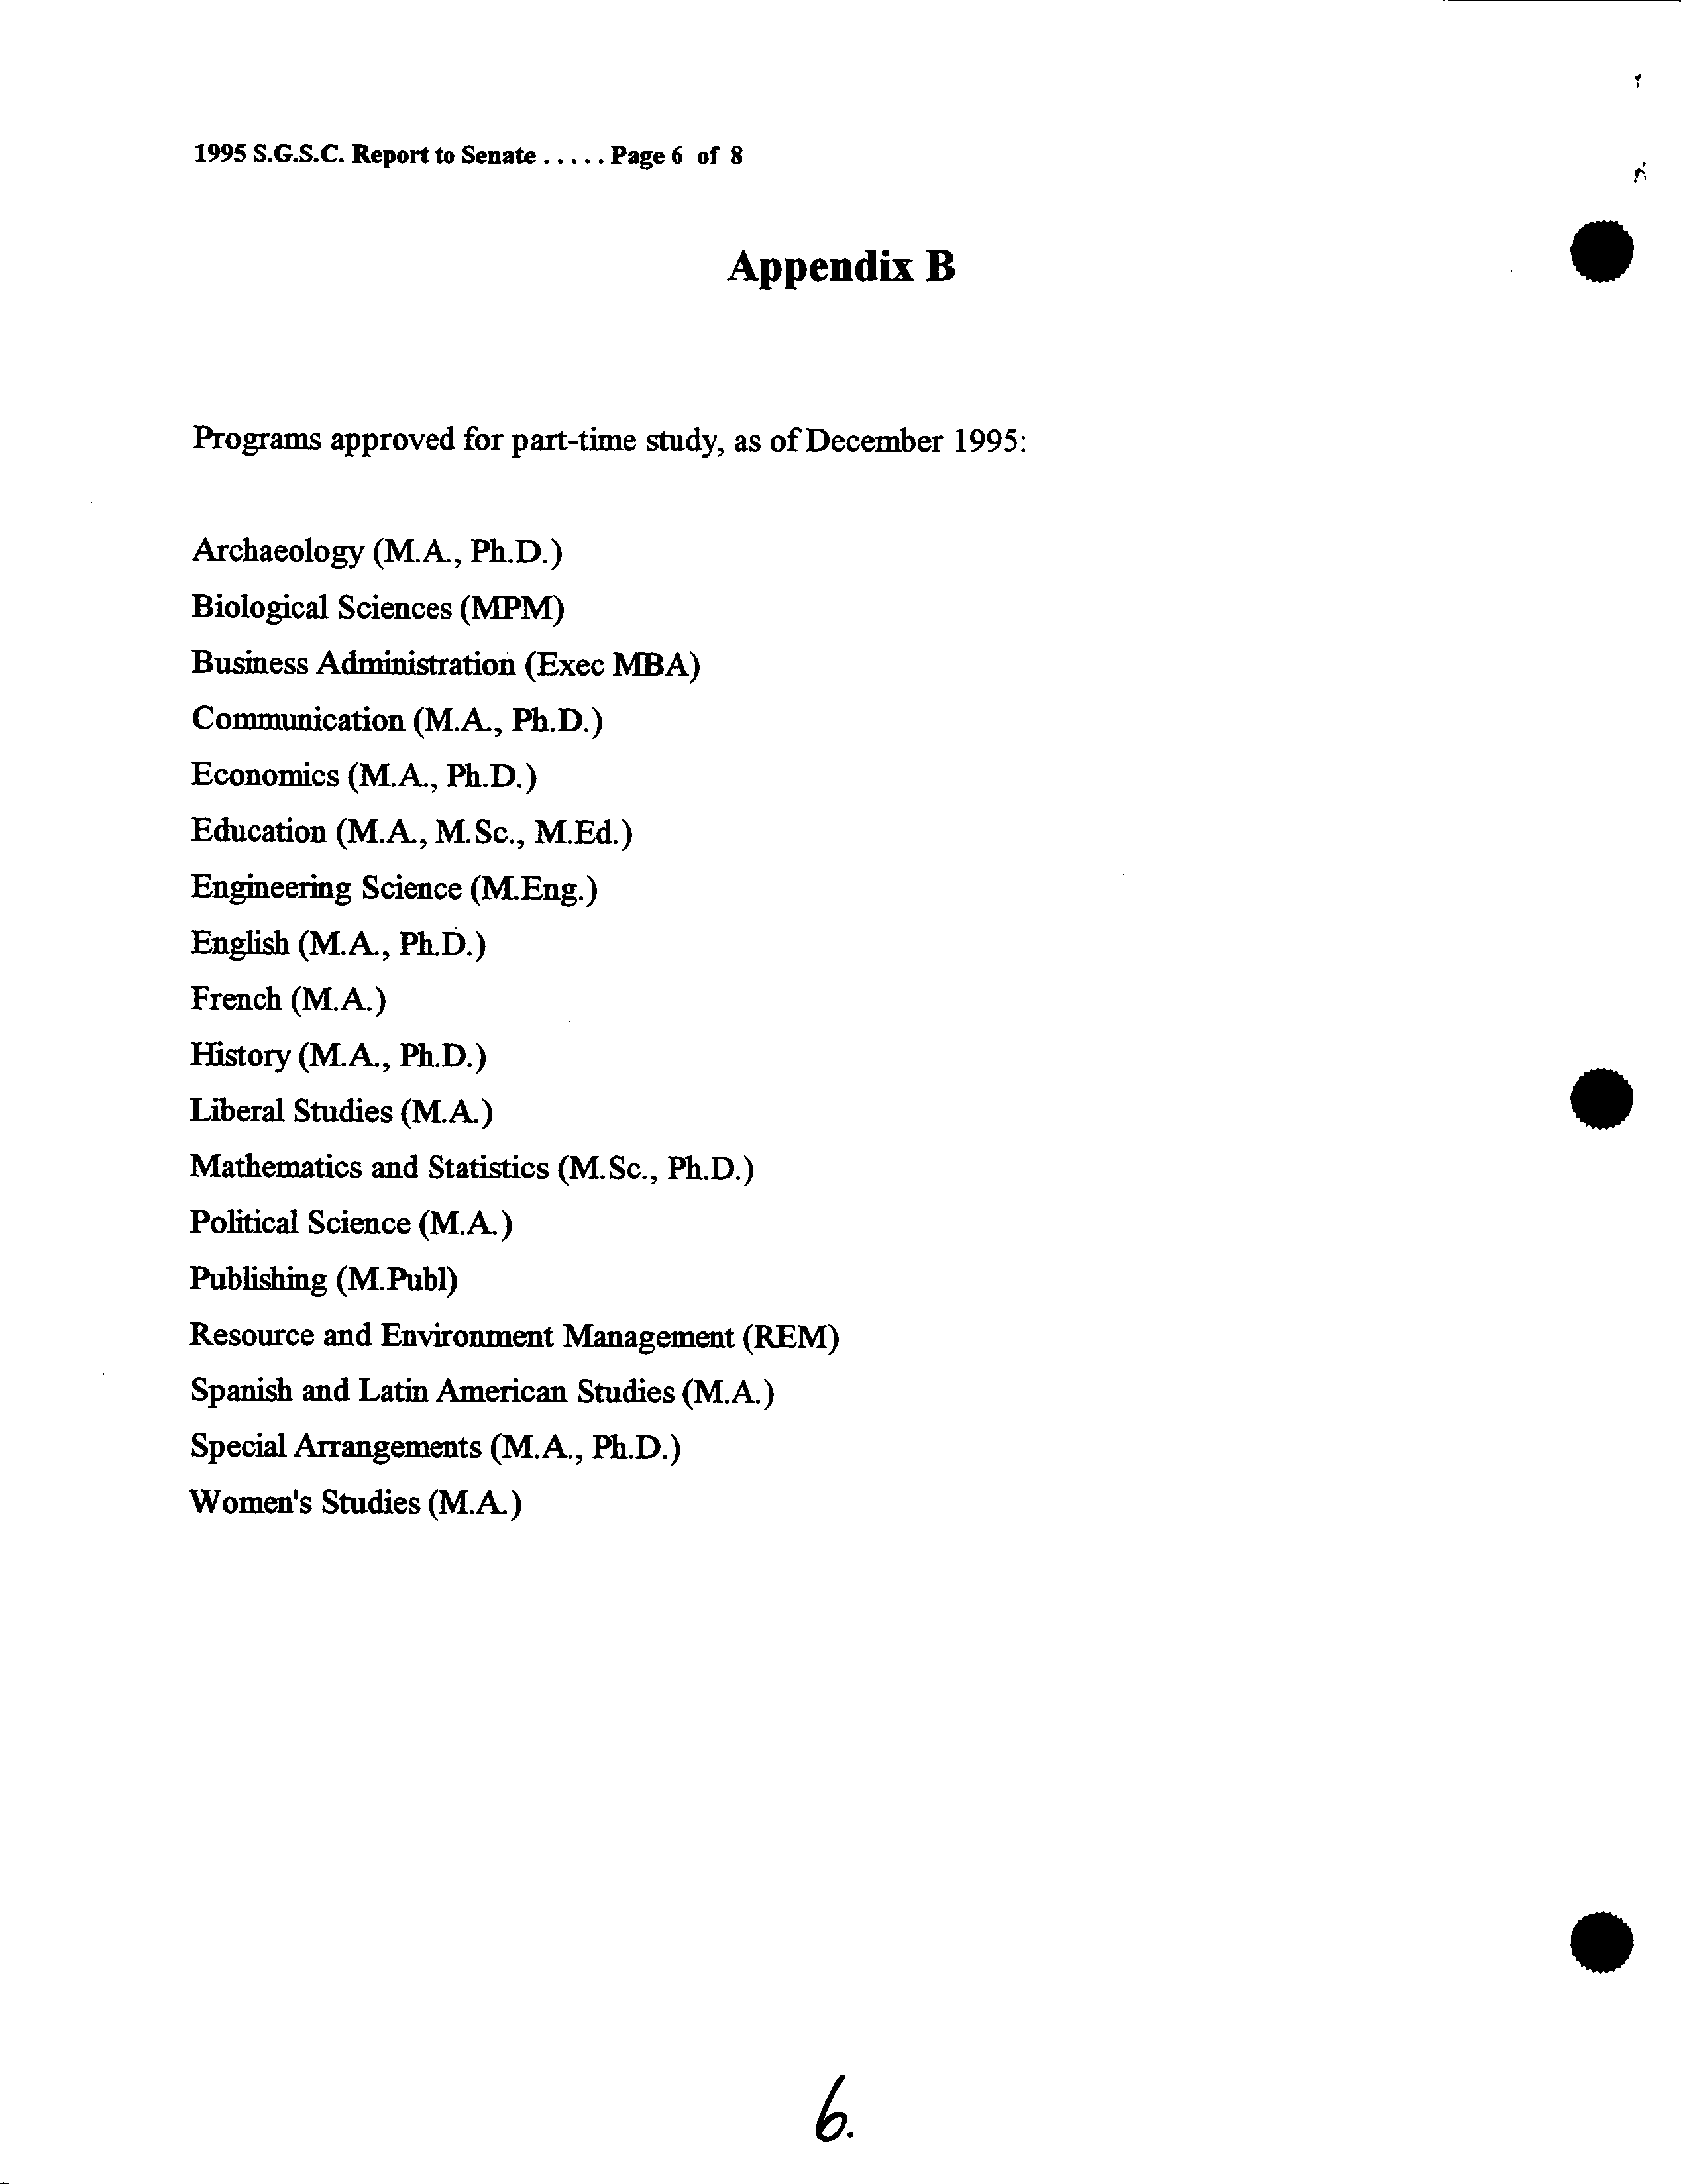
our graduate programs. Programs currently approved for Part-Time study are listed
in
Appendix
B.
27-Jaii-96 SEAT-96.D0C
1995 S.G.S.C. Report to
Senate ?
. Page 2 of 8
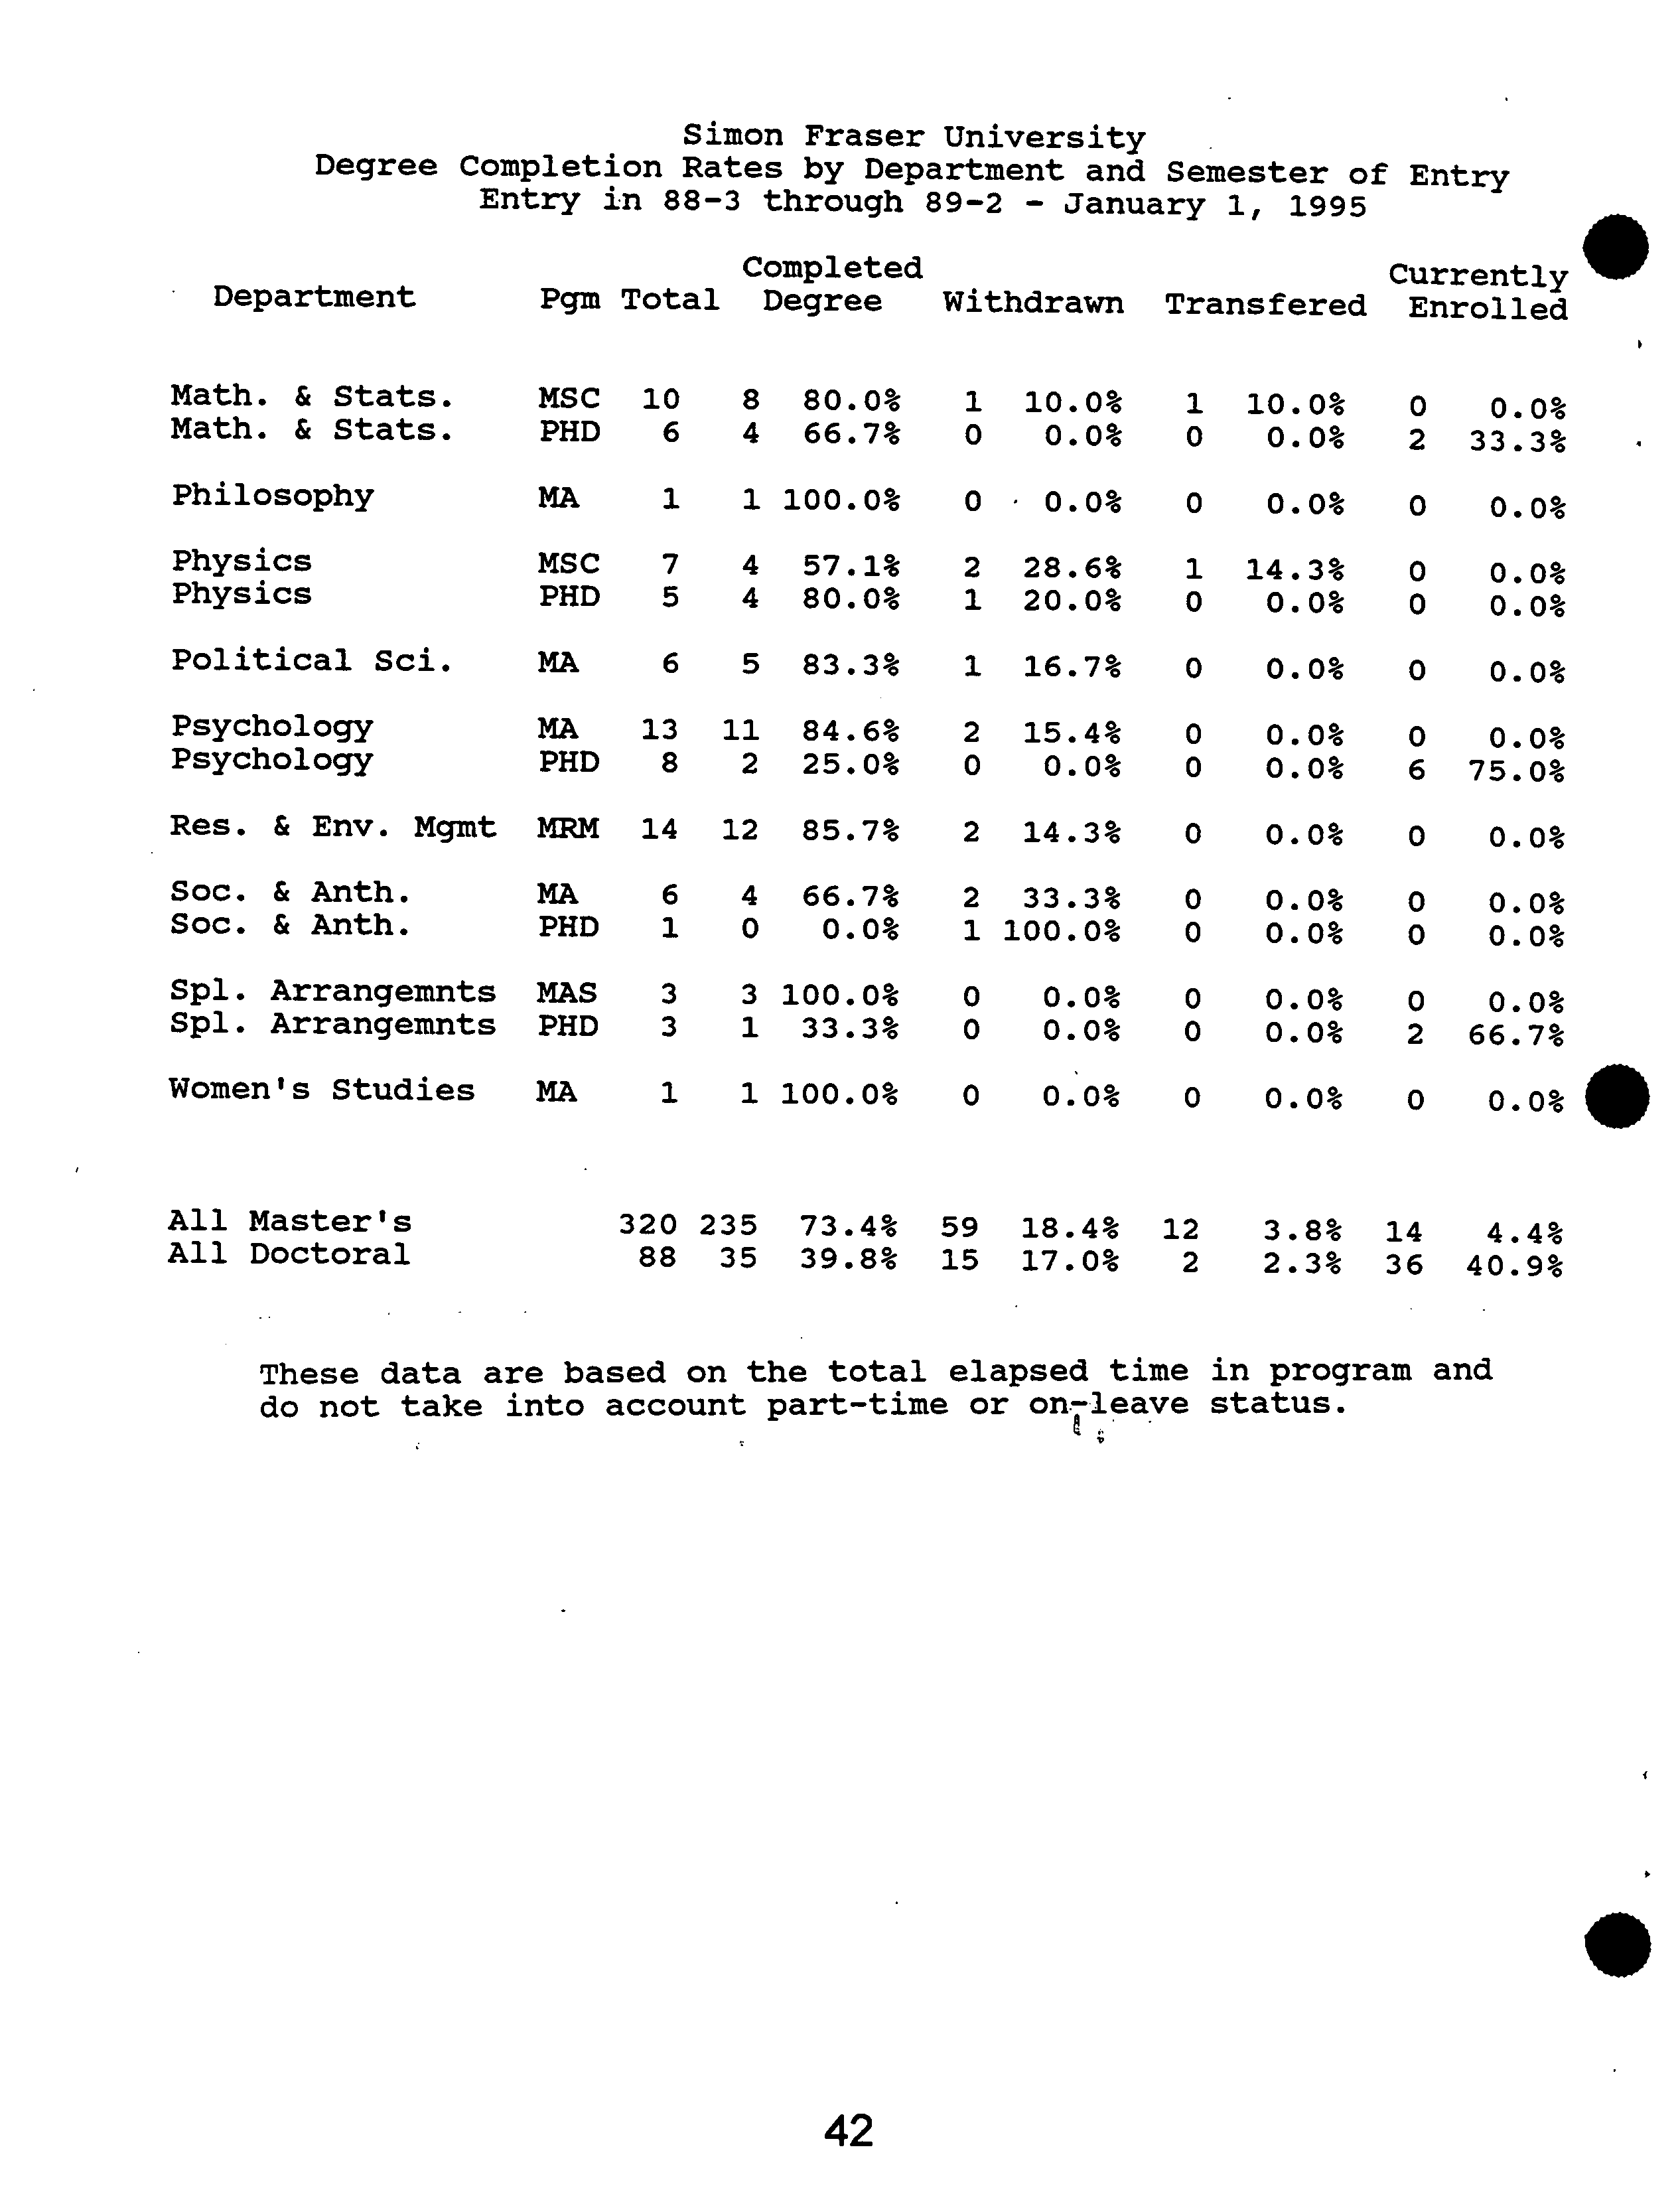
IL Degree Completion/Withdrawal
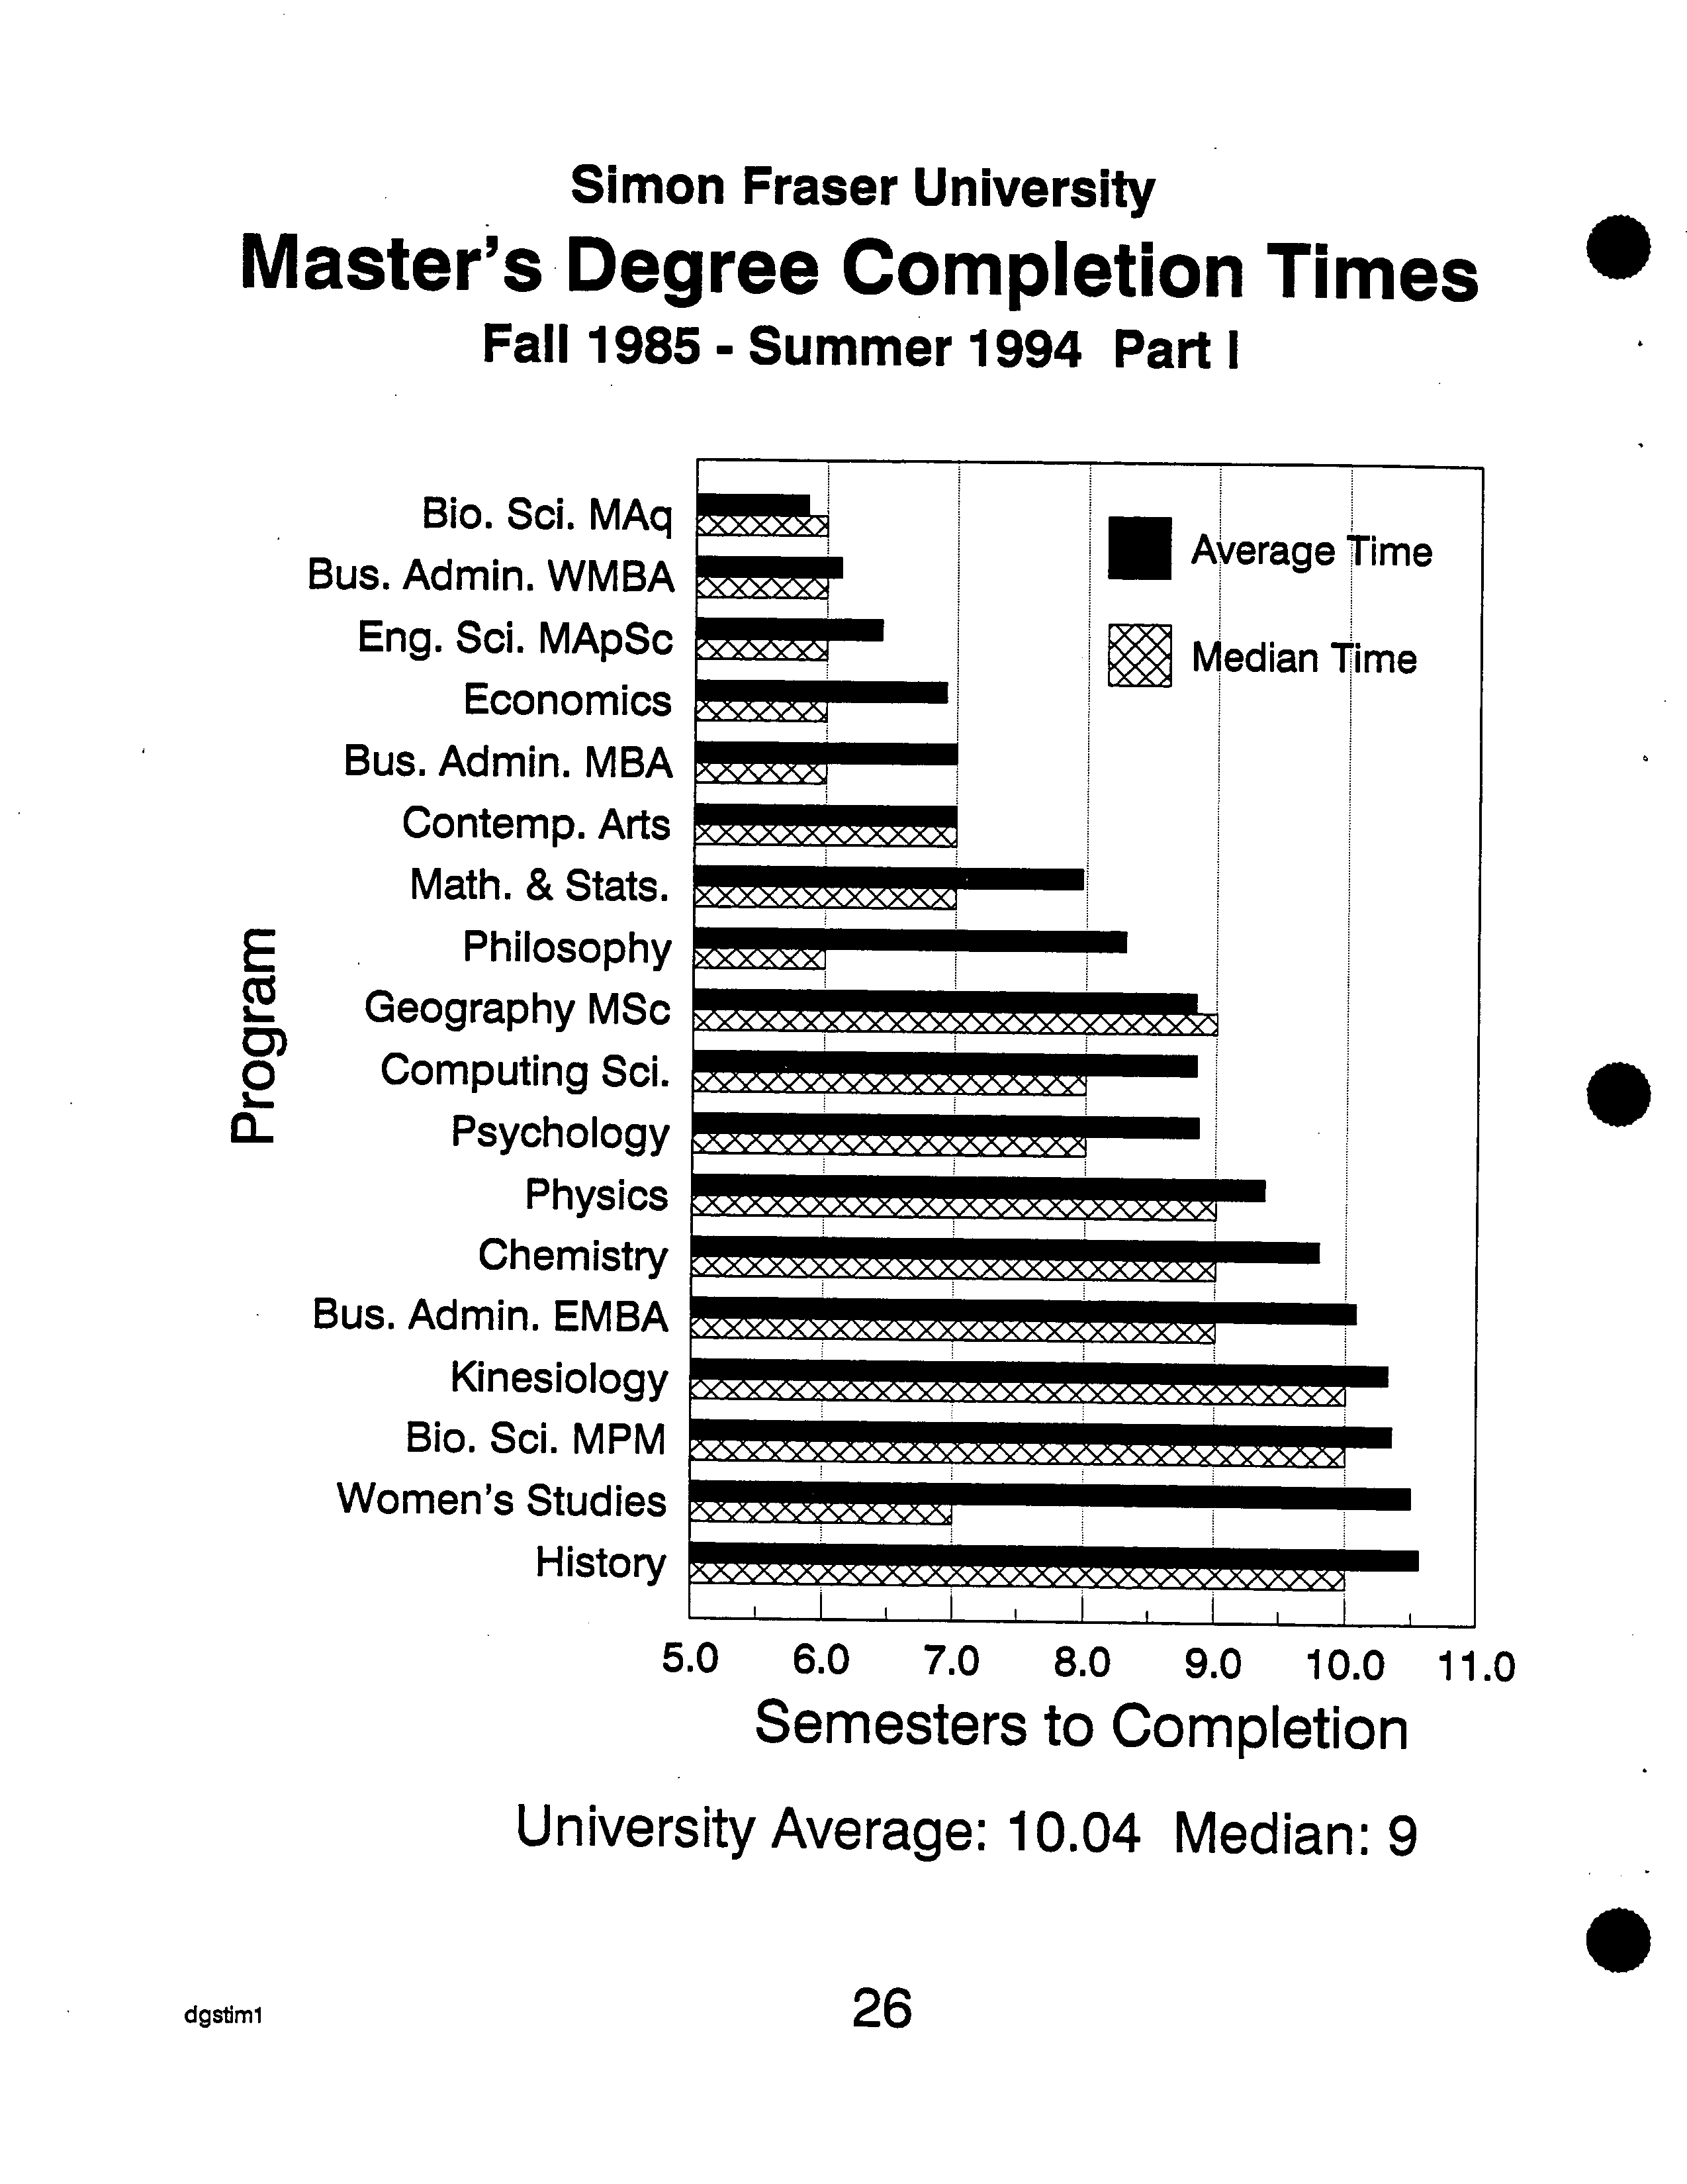
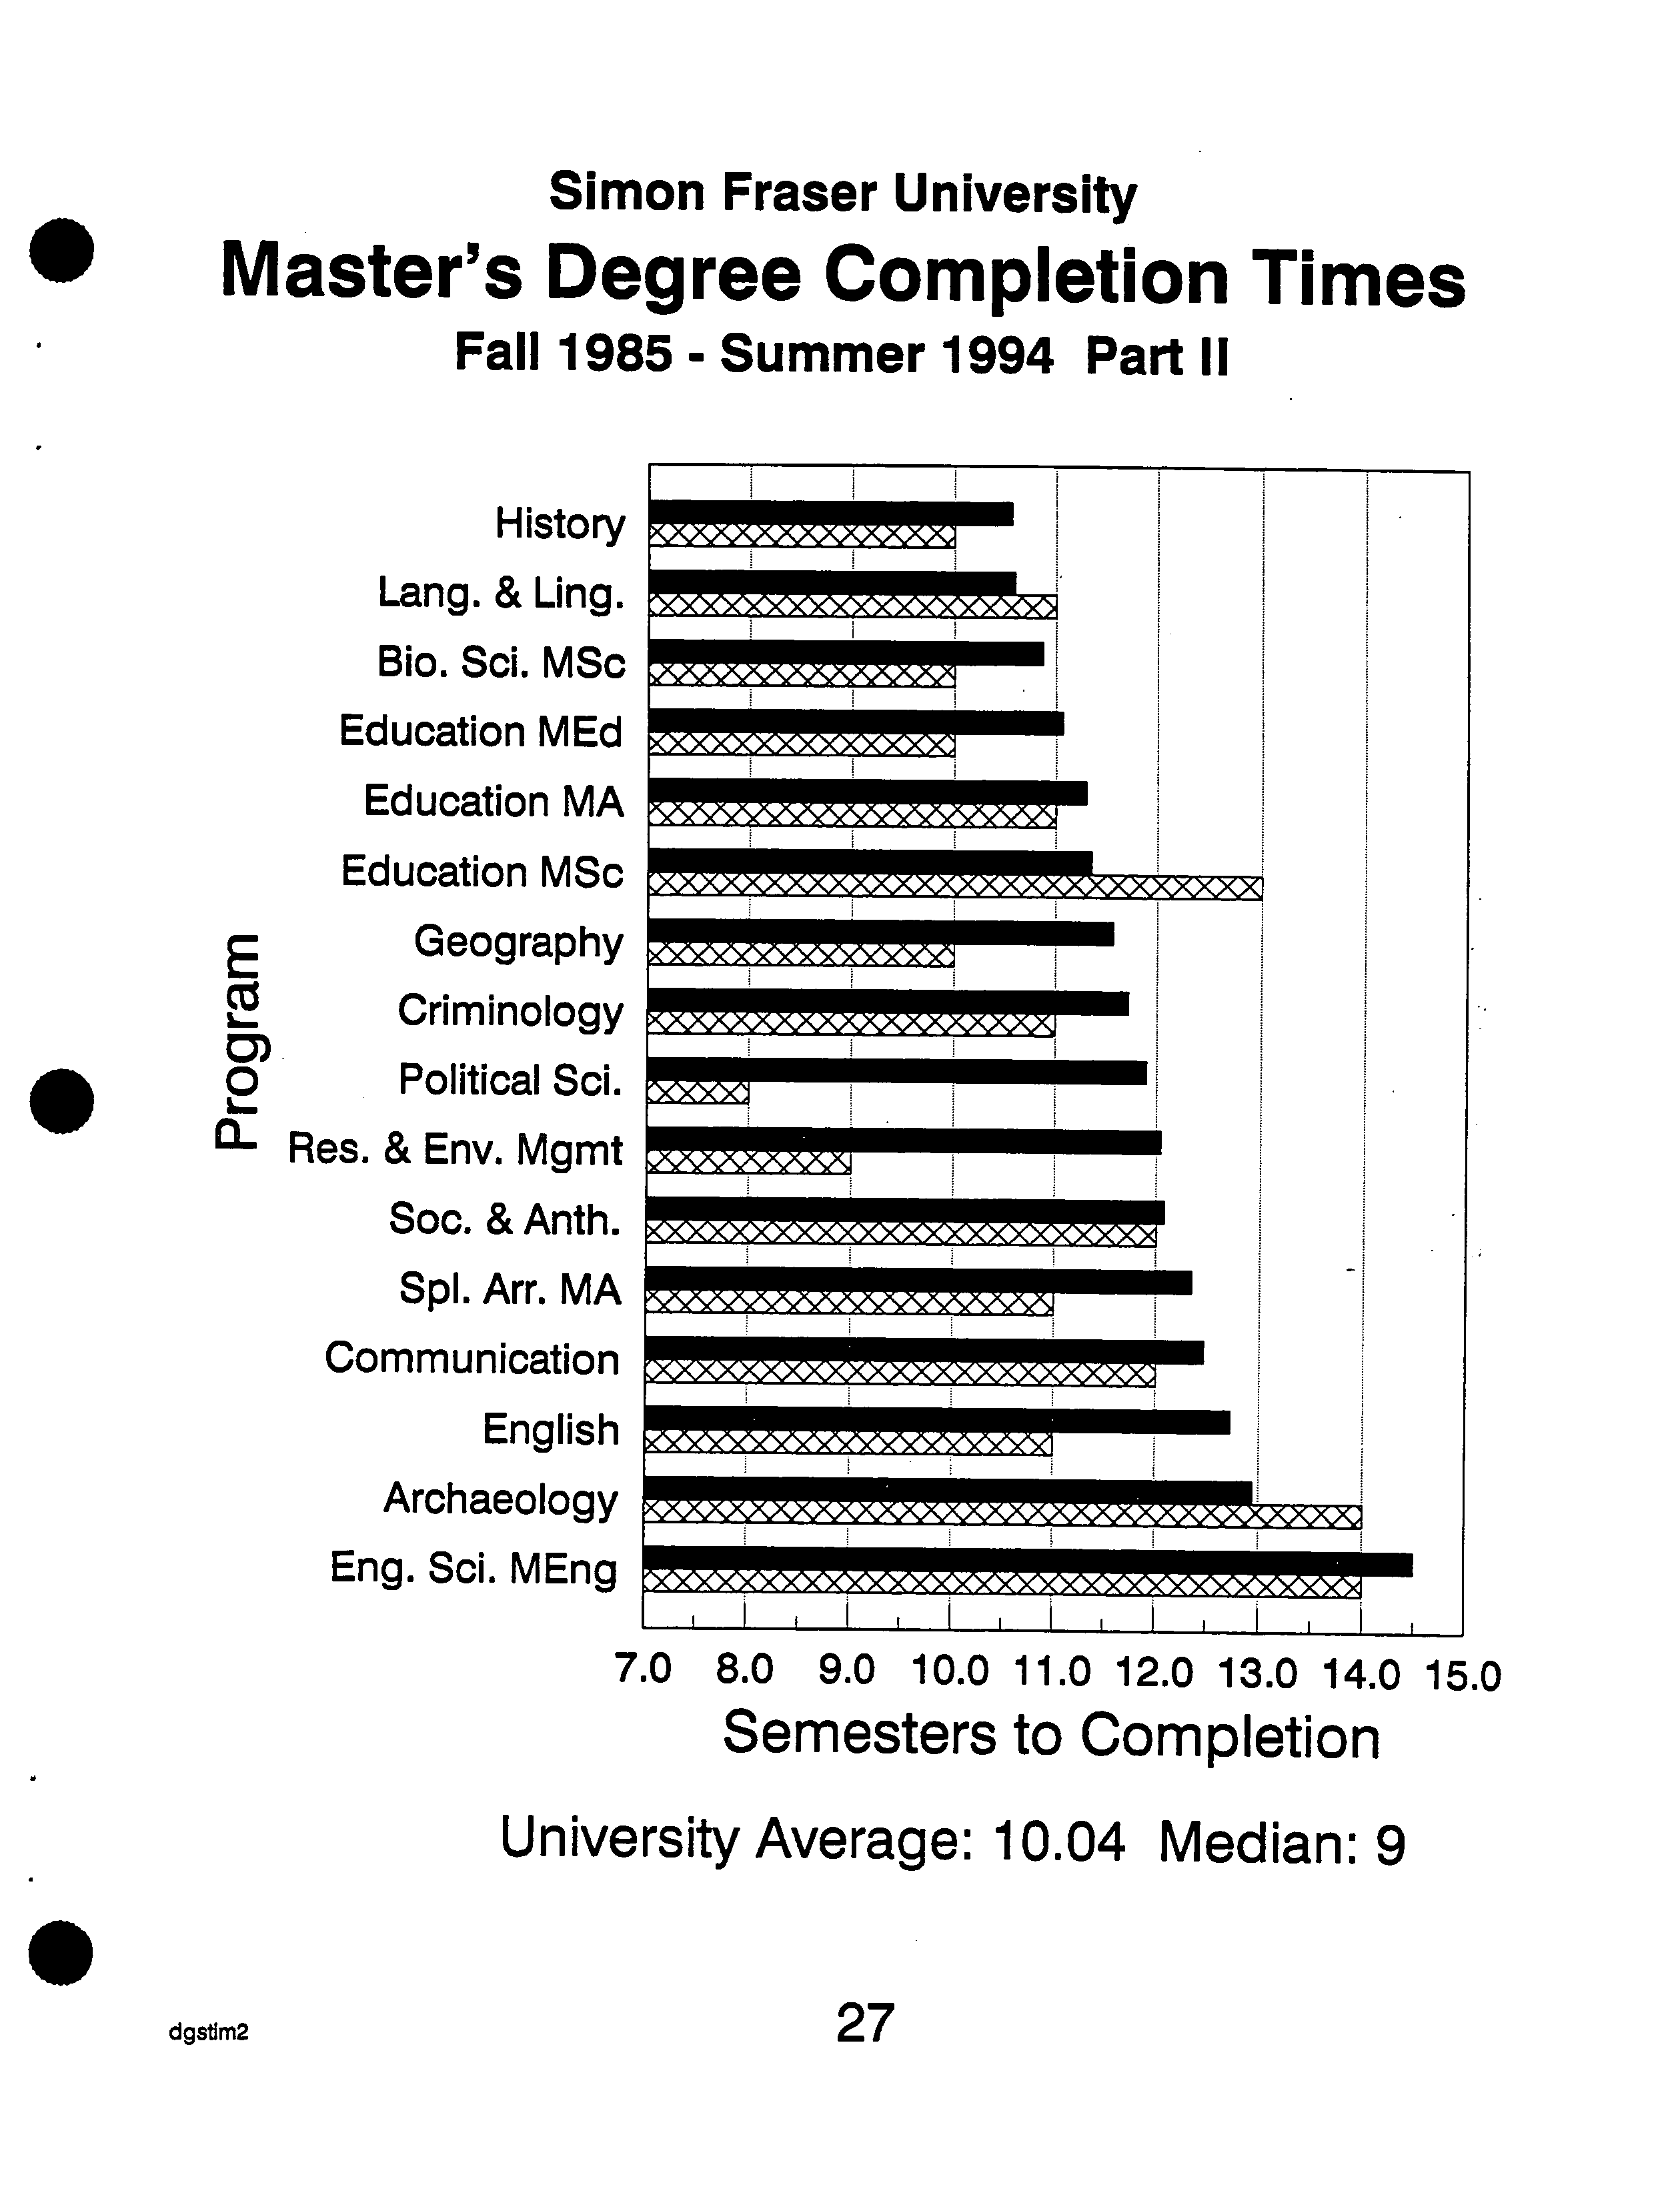
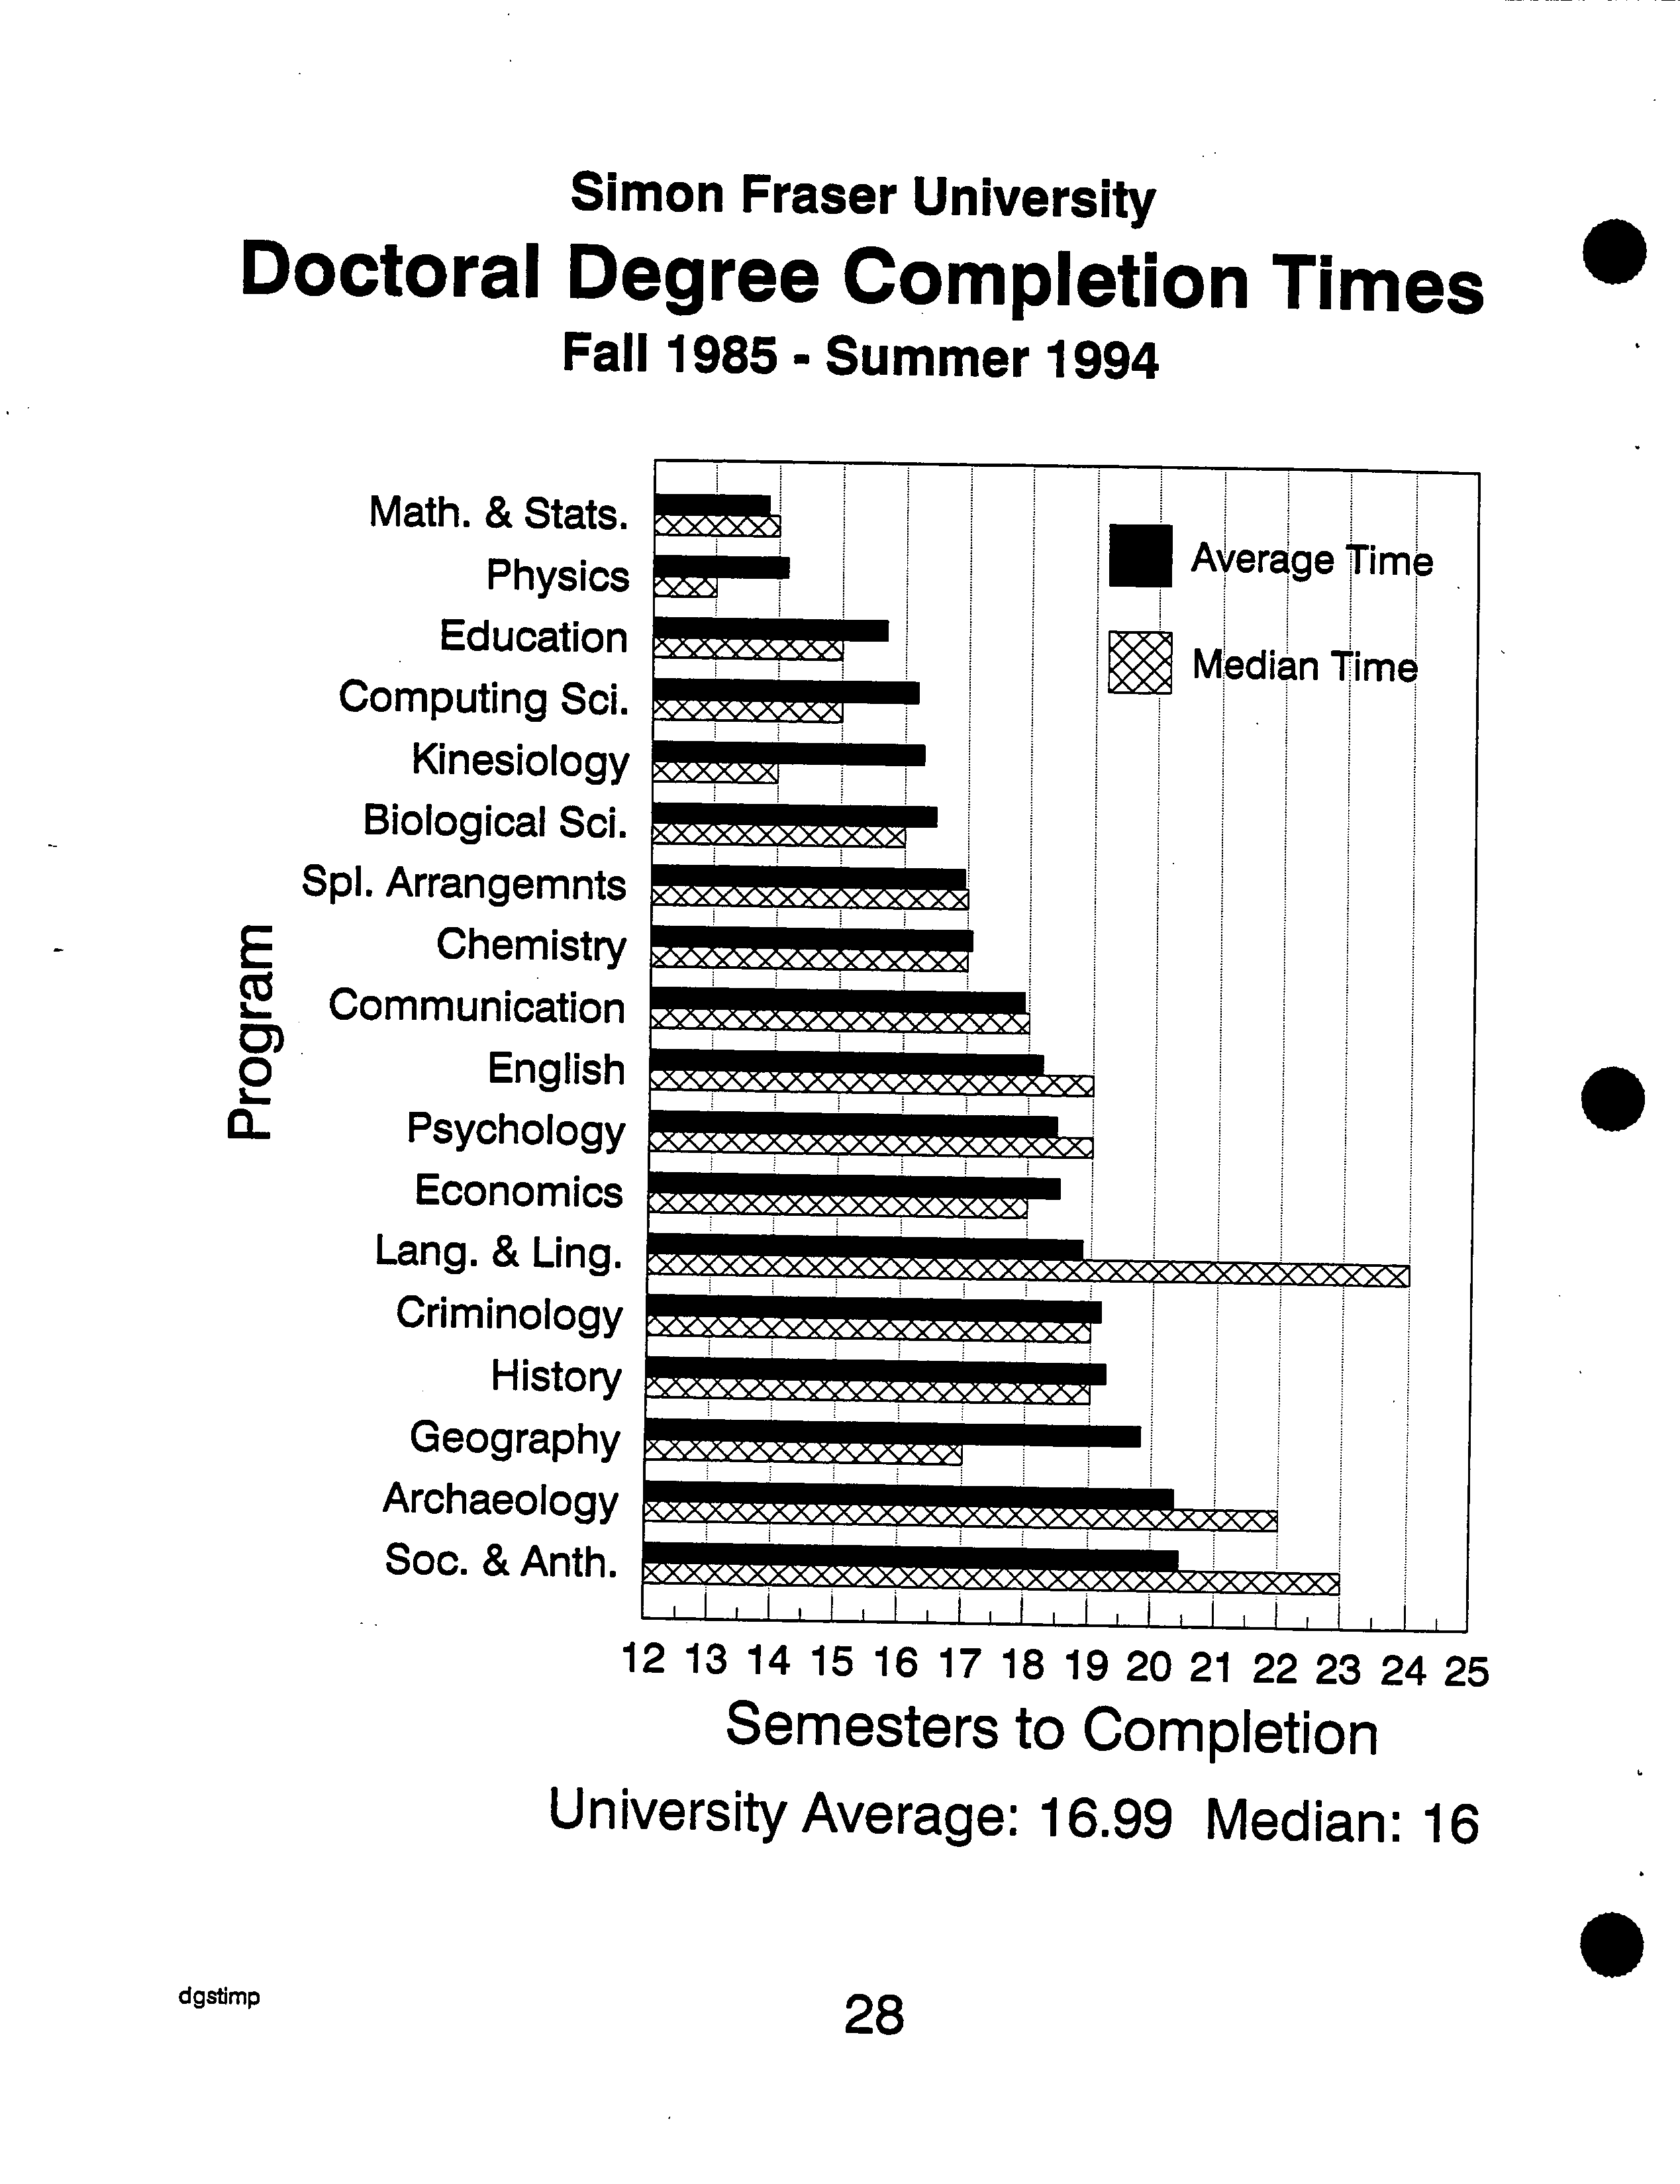
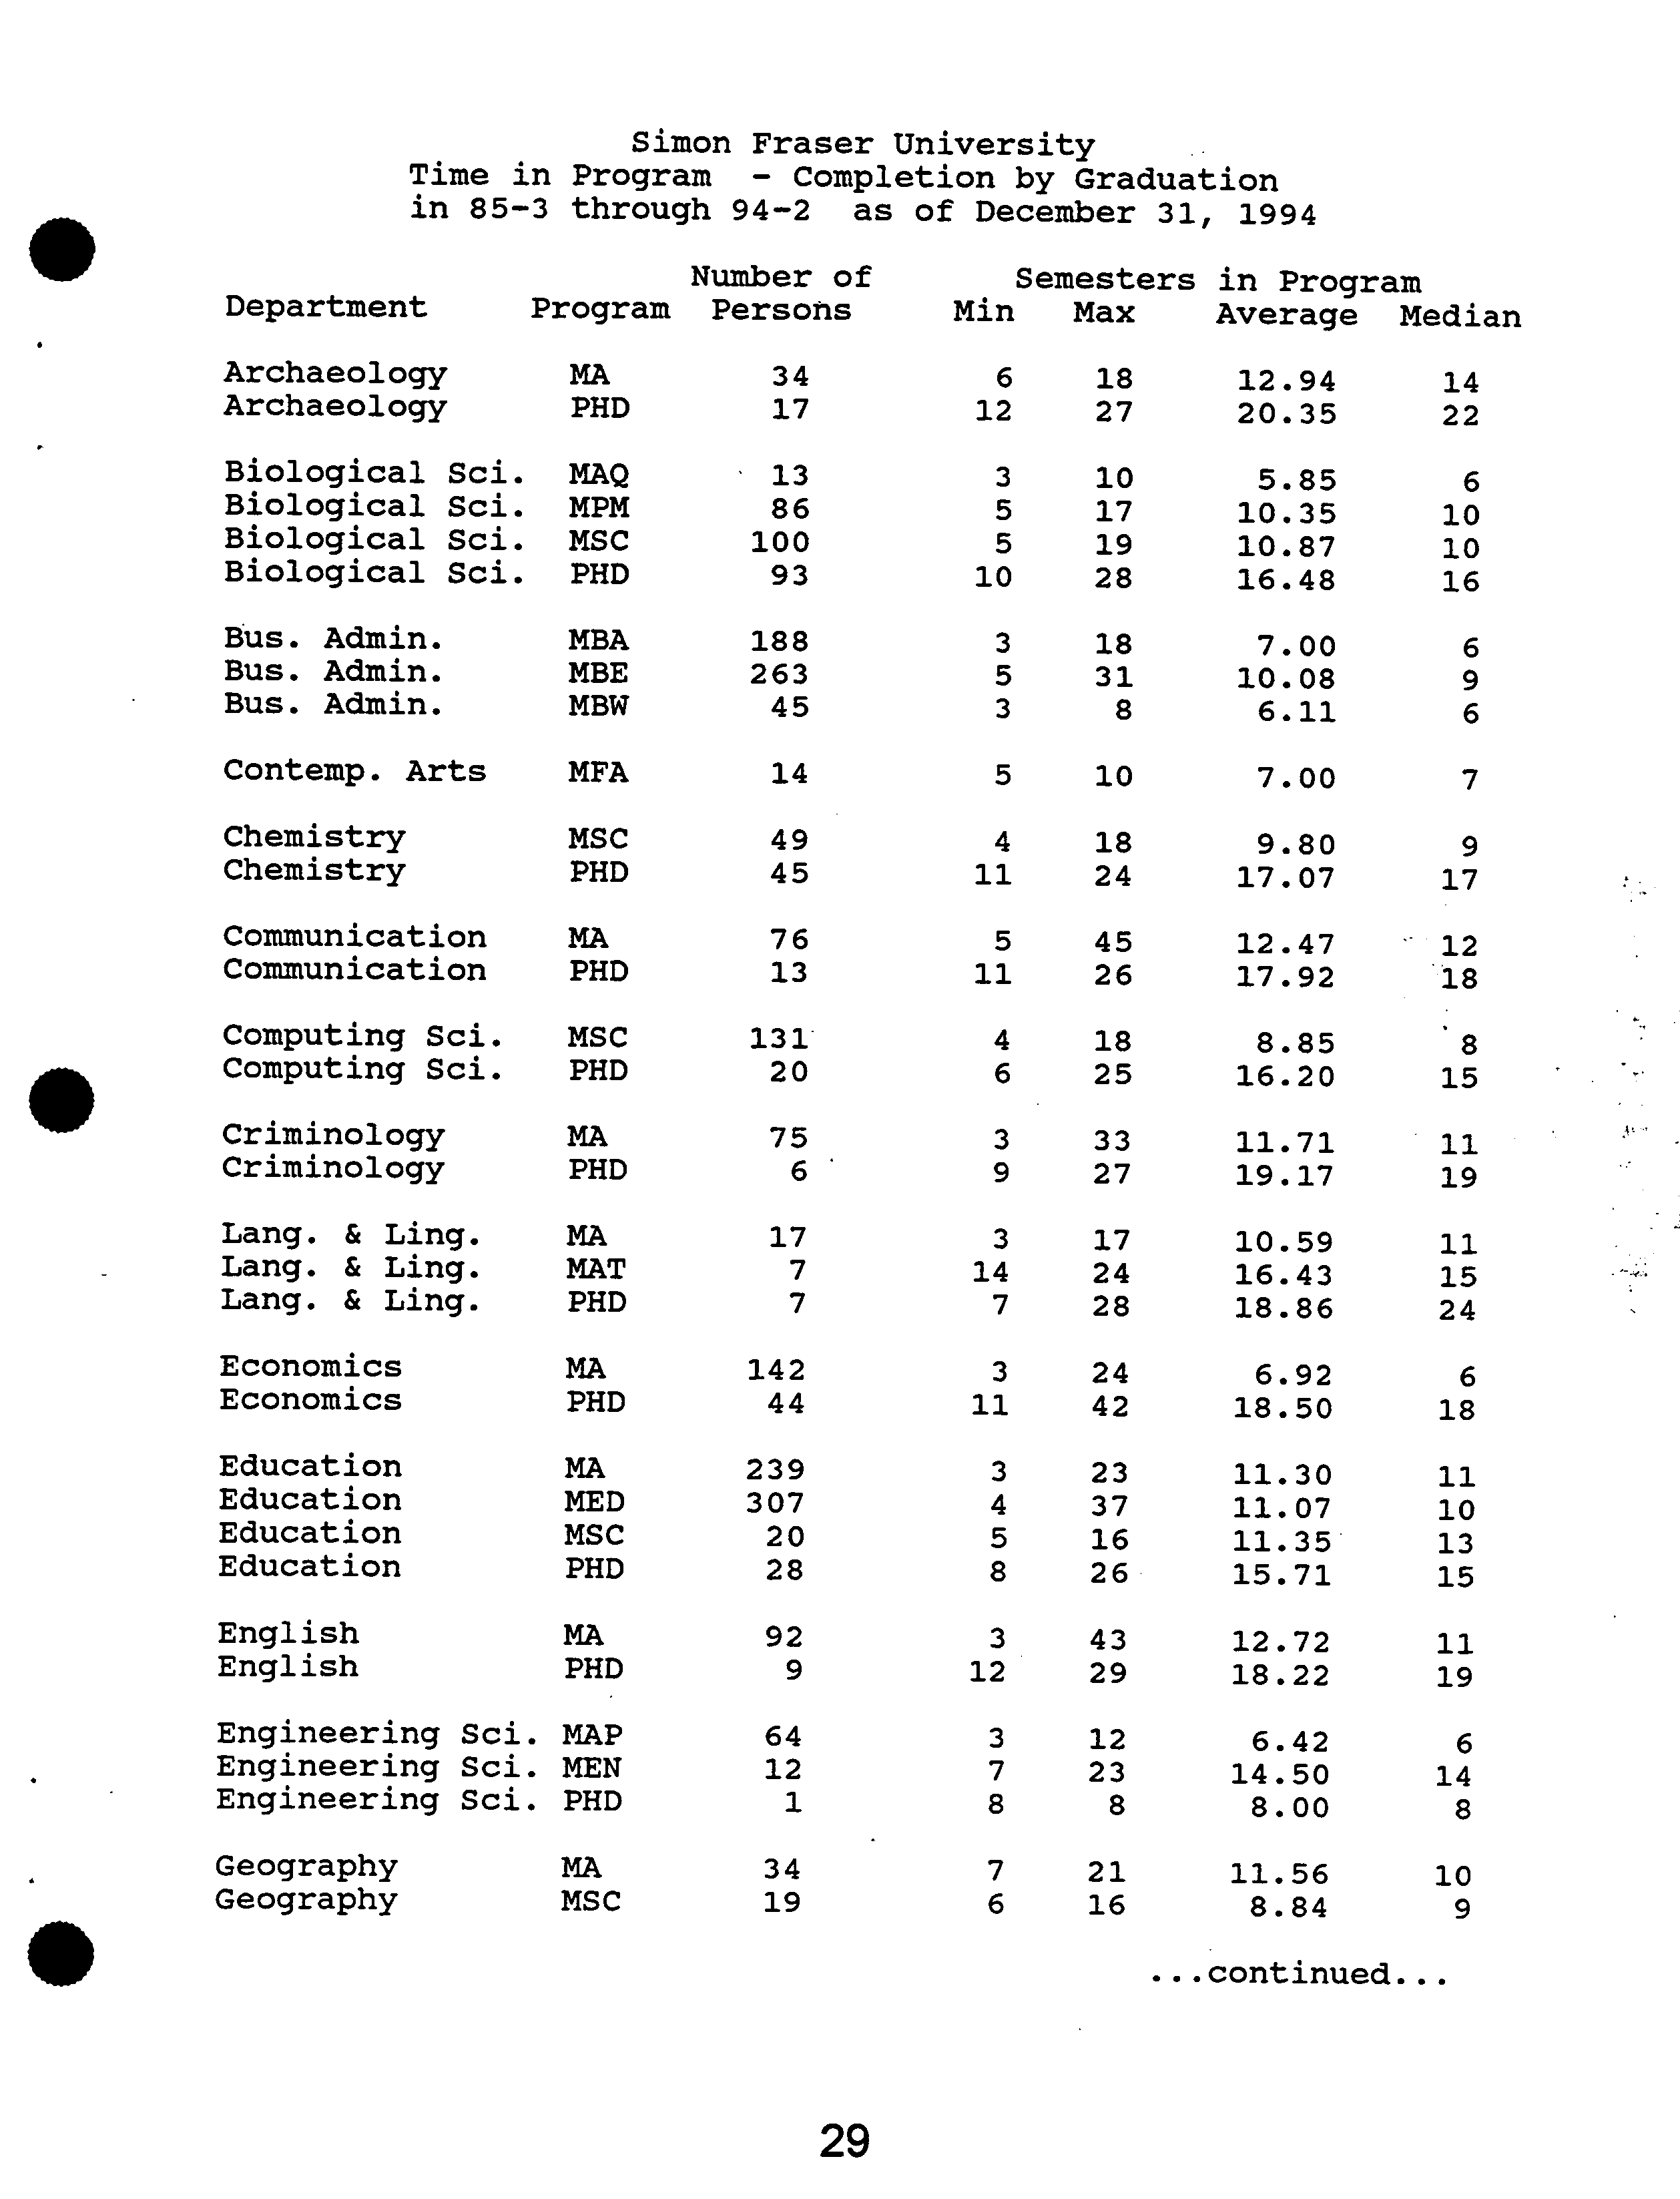
Degree completion times are presented in the Graduate Studies Fact Book. It should be noted that
these data do not take into account the possibility that a student may have been enrolled Part-
Time for
all
or part of the program and thus overstate completion times, especially for programs
with large numbers of Part-Time students.
Although a trend to longer completion times has been arrested, I remain concerned by what ap-
pear in many cases to be excessive times for degree completion. When resources are limited, it is
especially important that they be used effectively and efficiently. I am actively encouraging de-
partments to ensure both that their degree requirements are realistic and that their students make
satisfactory progress, as required by Senate regulations, toward meeting those requirements. To
this end, in early 1996,1 requested reports from
all
departments on the status of each of their stu-
dents, with respect to the currency of progress reports. I may be able to give a preliminary report
on the results at the time this report is considered by Senate.
I am also pressing for timely appointment of supervisory committees. In establishing the Graduate
Studies Database, I encountered many students who had been here for several years, yet appar-
ently had no supervisory committees. This situation has largely been remedied; regularly, remind-
ers about 'delinquent' students are sent to departments by my office; a minor flood of committee
recommendations typically follows.
The Graduate Studies Handbook, first published in 1991 and updated annually through 1995,
contains guidelines for supervisors and students that (if followed) should improve prospects for
expeditious degree completion. I have provided Graduate Program Chairs with samples of forms
used at SFU and elsewhere for reporting on student progress. The Handbook is now available on
SFU's WWW site at http://www.sfu.ca/vpresearchlgradhandbk/.
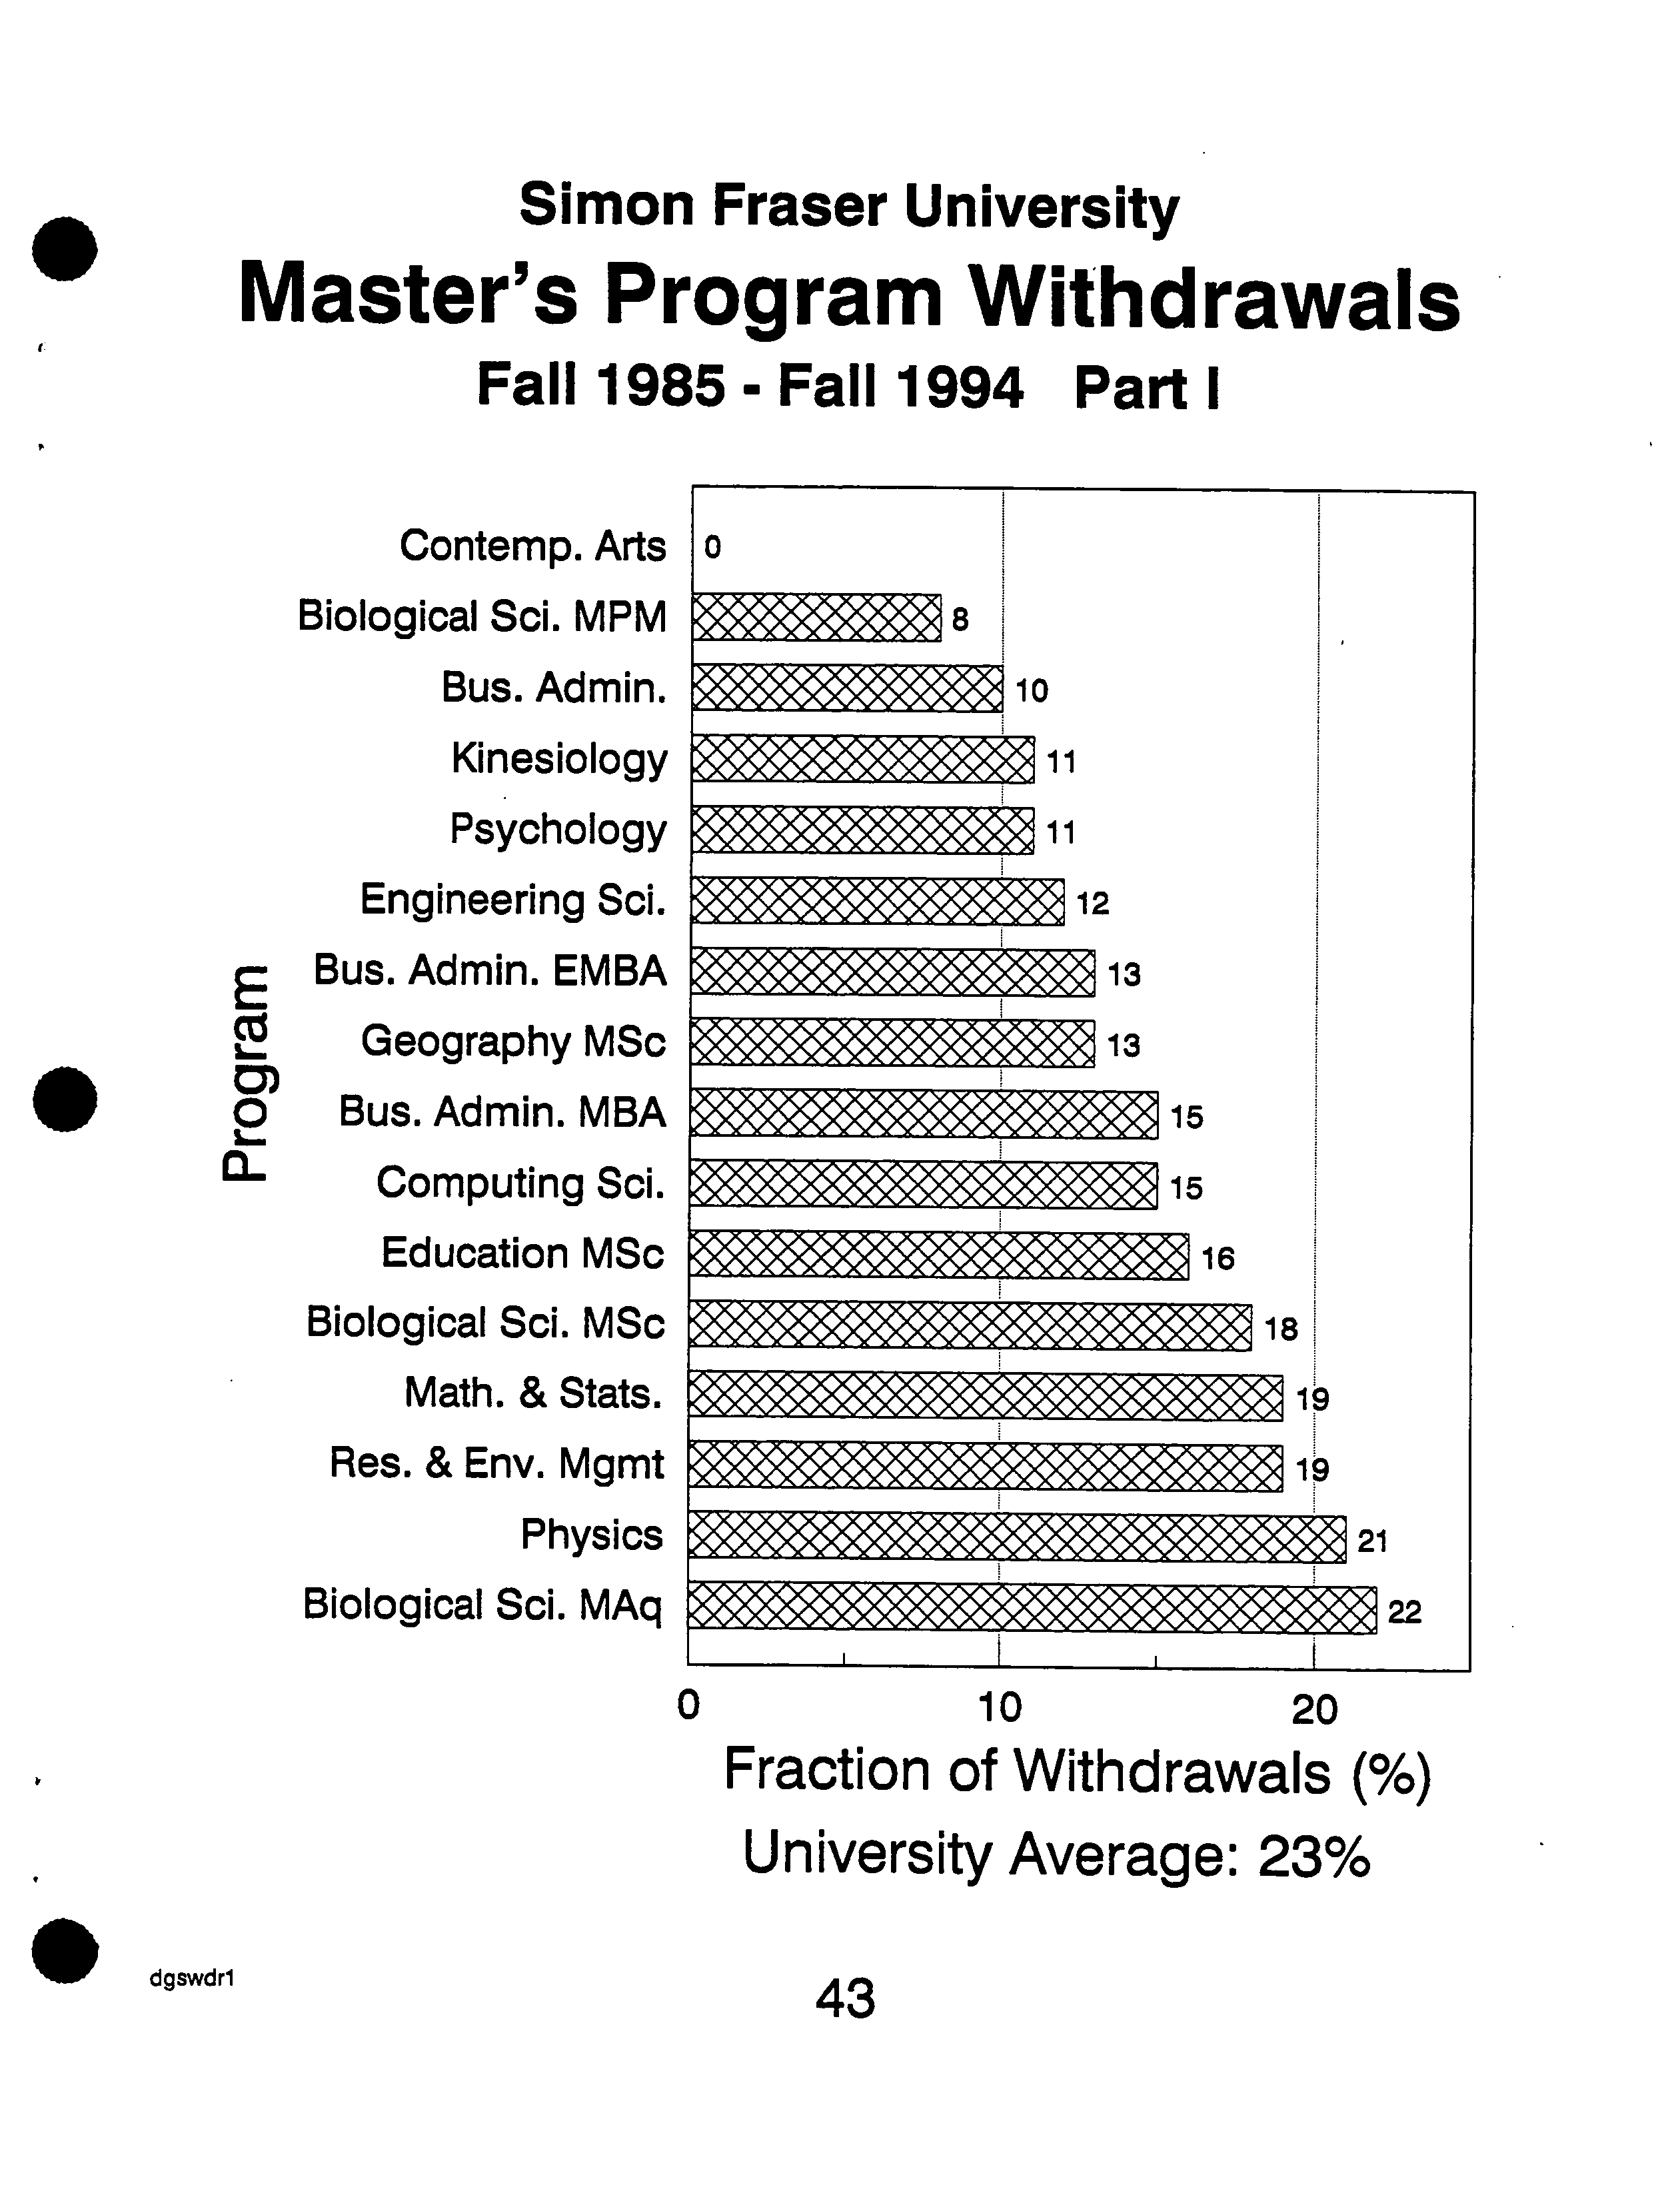
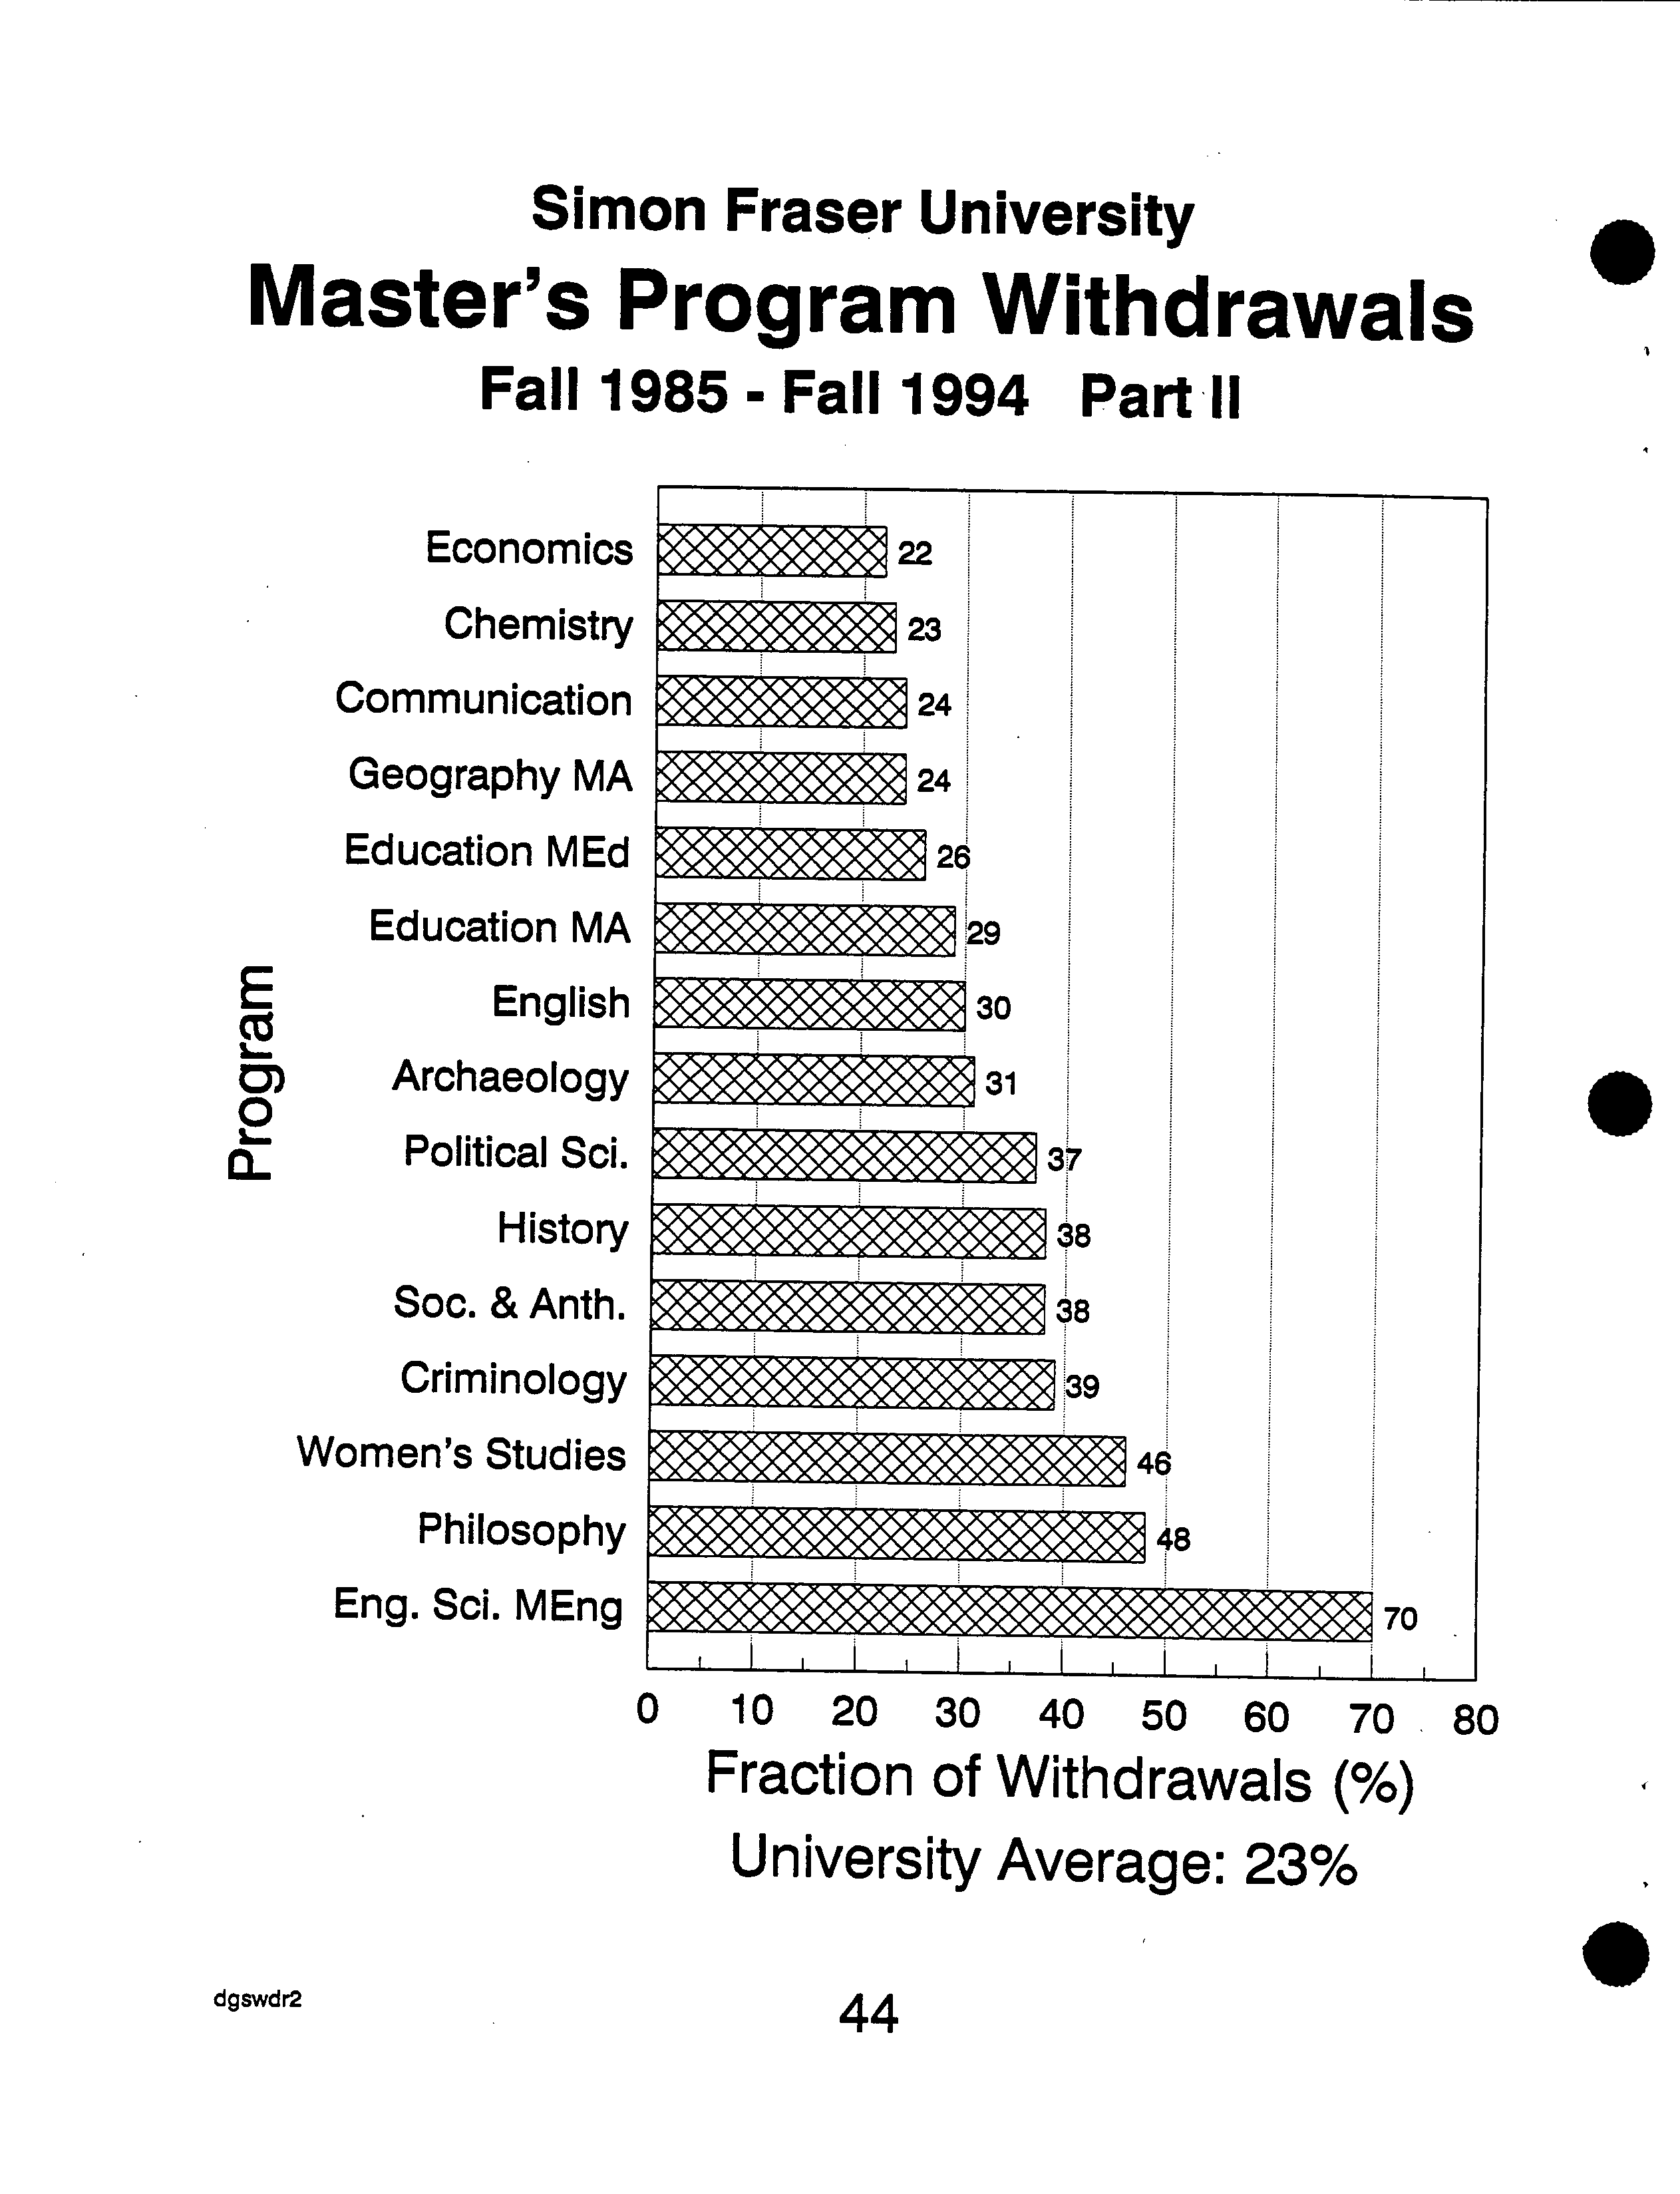
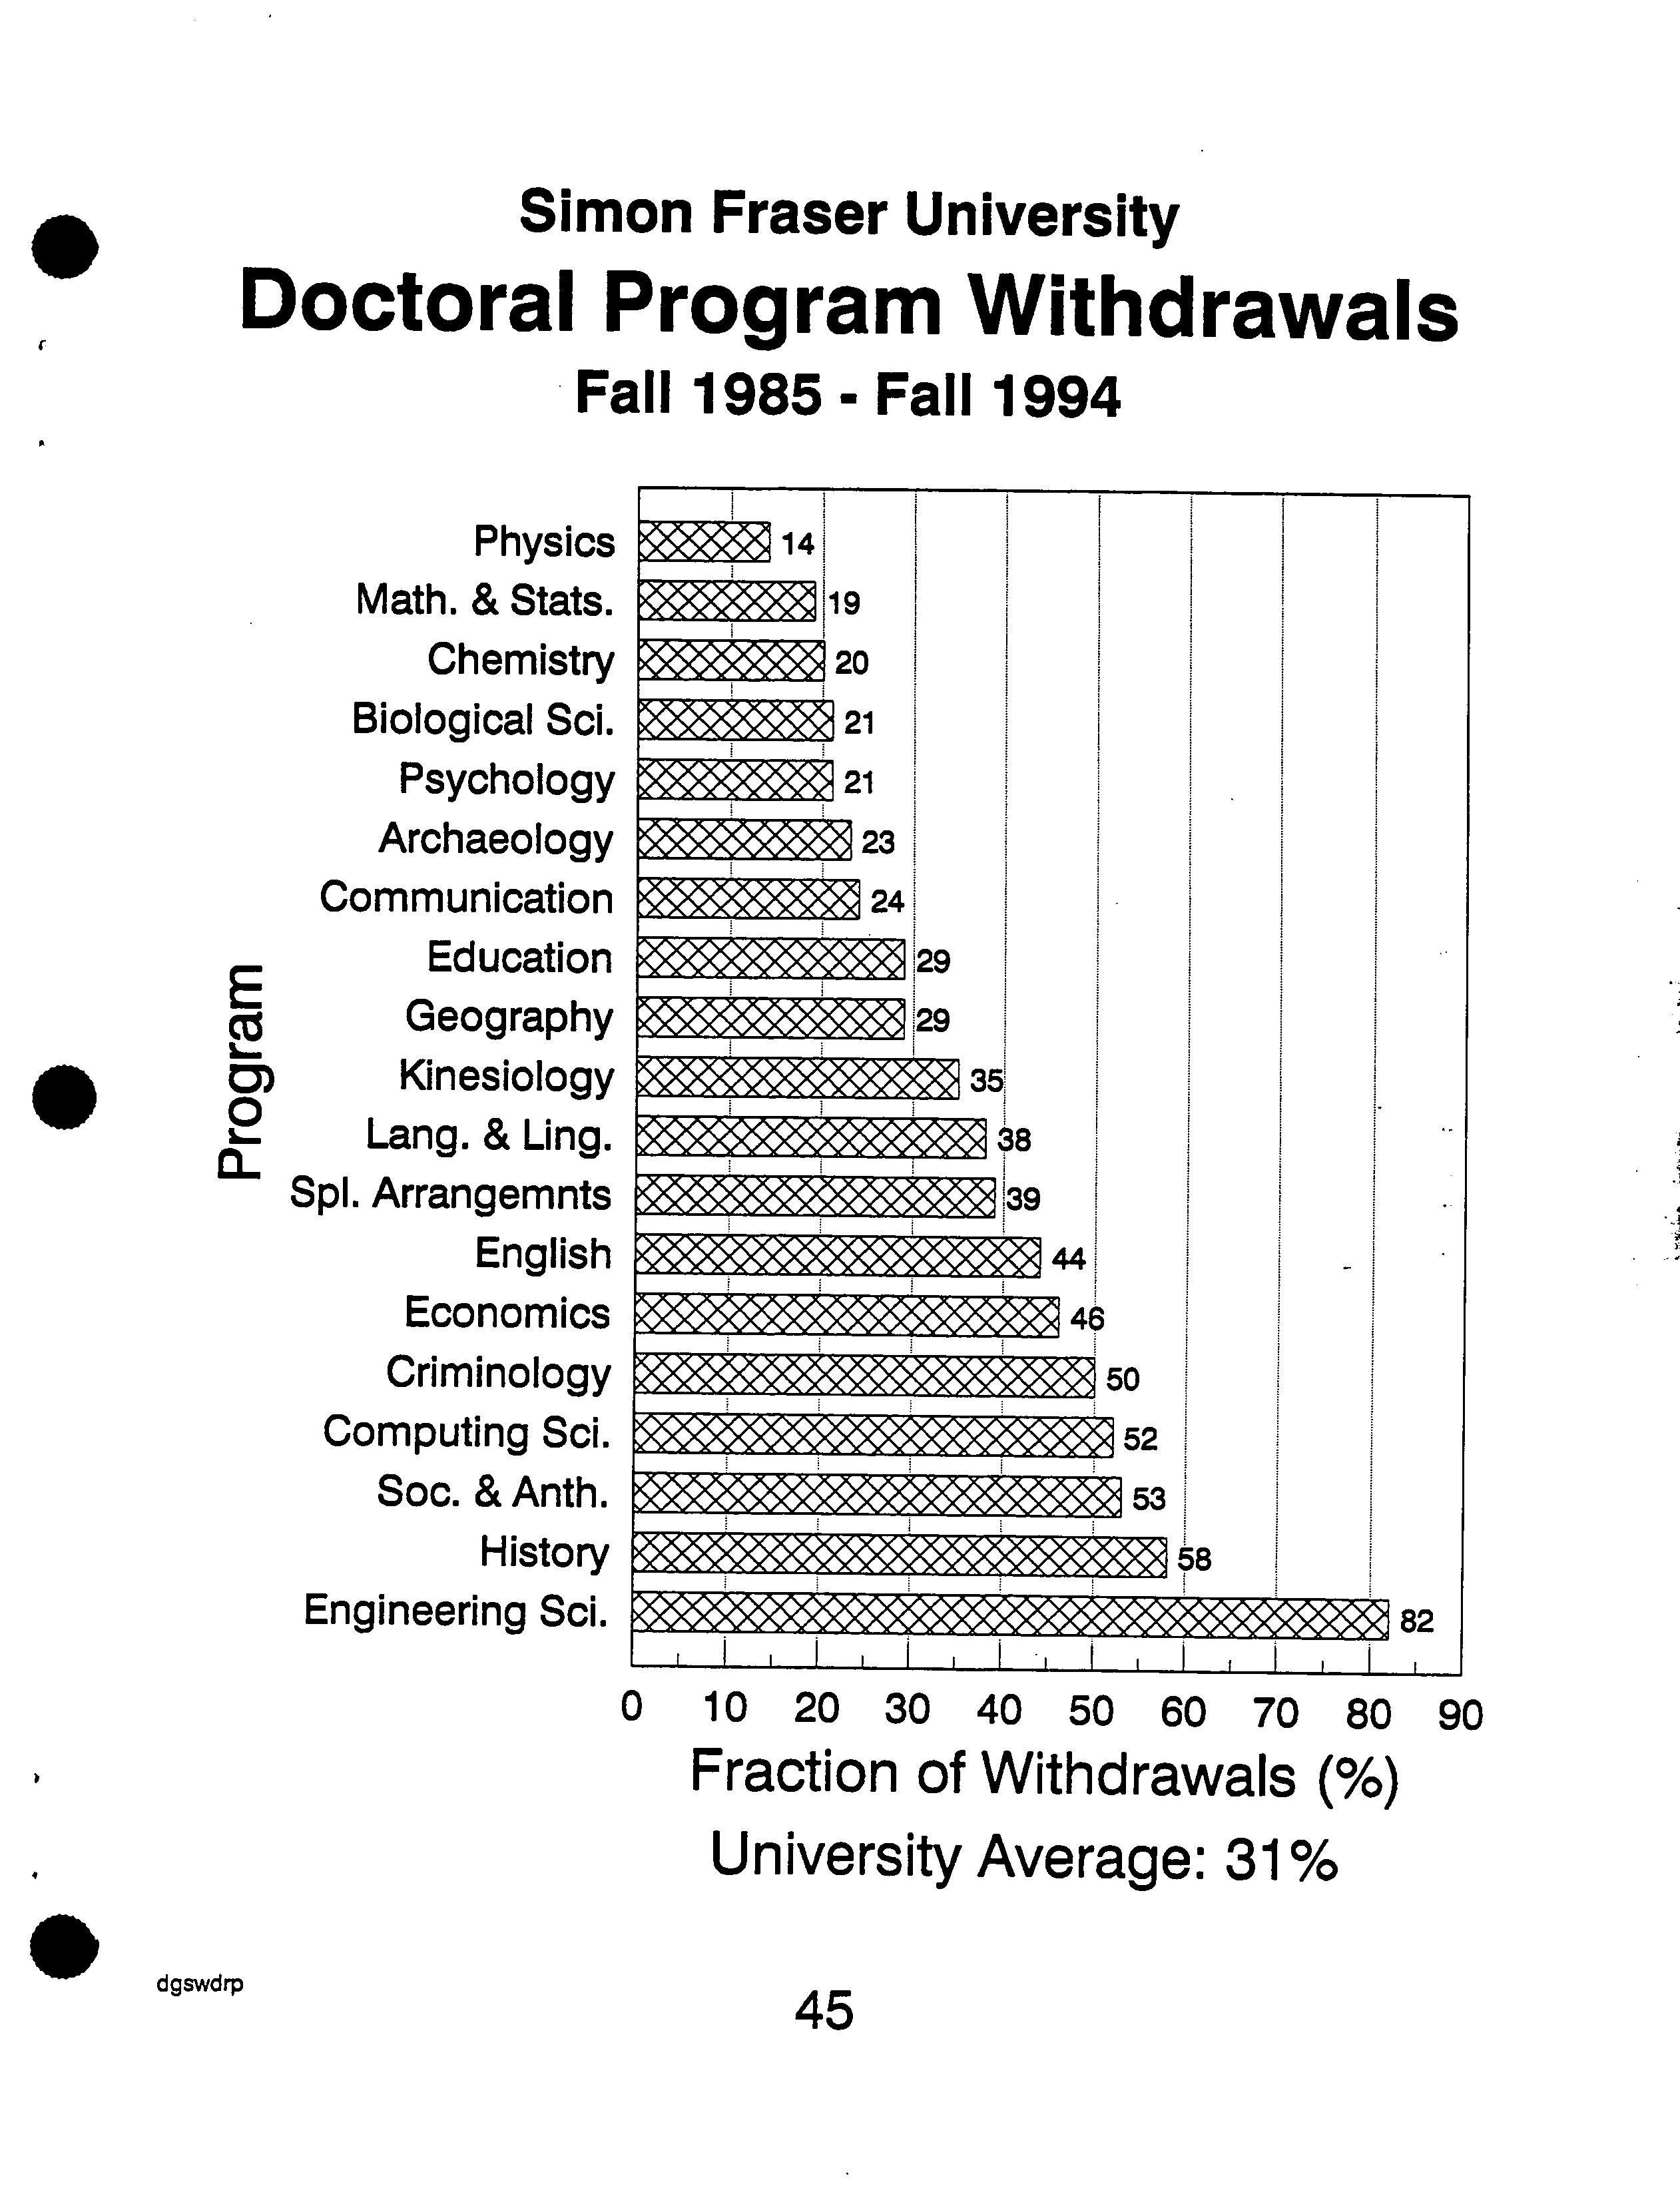
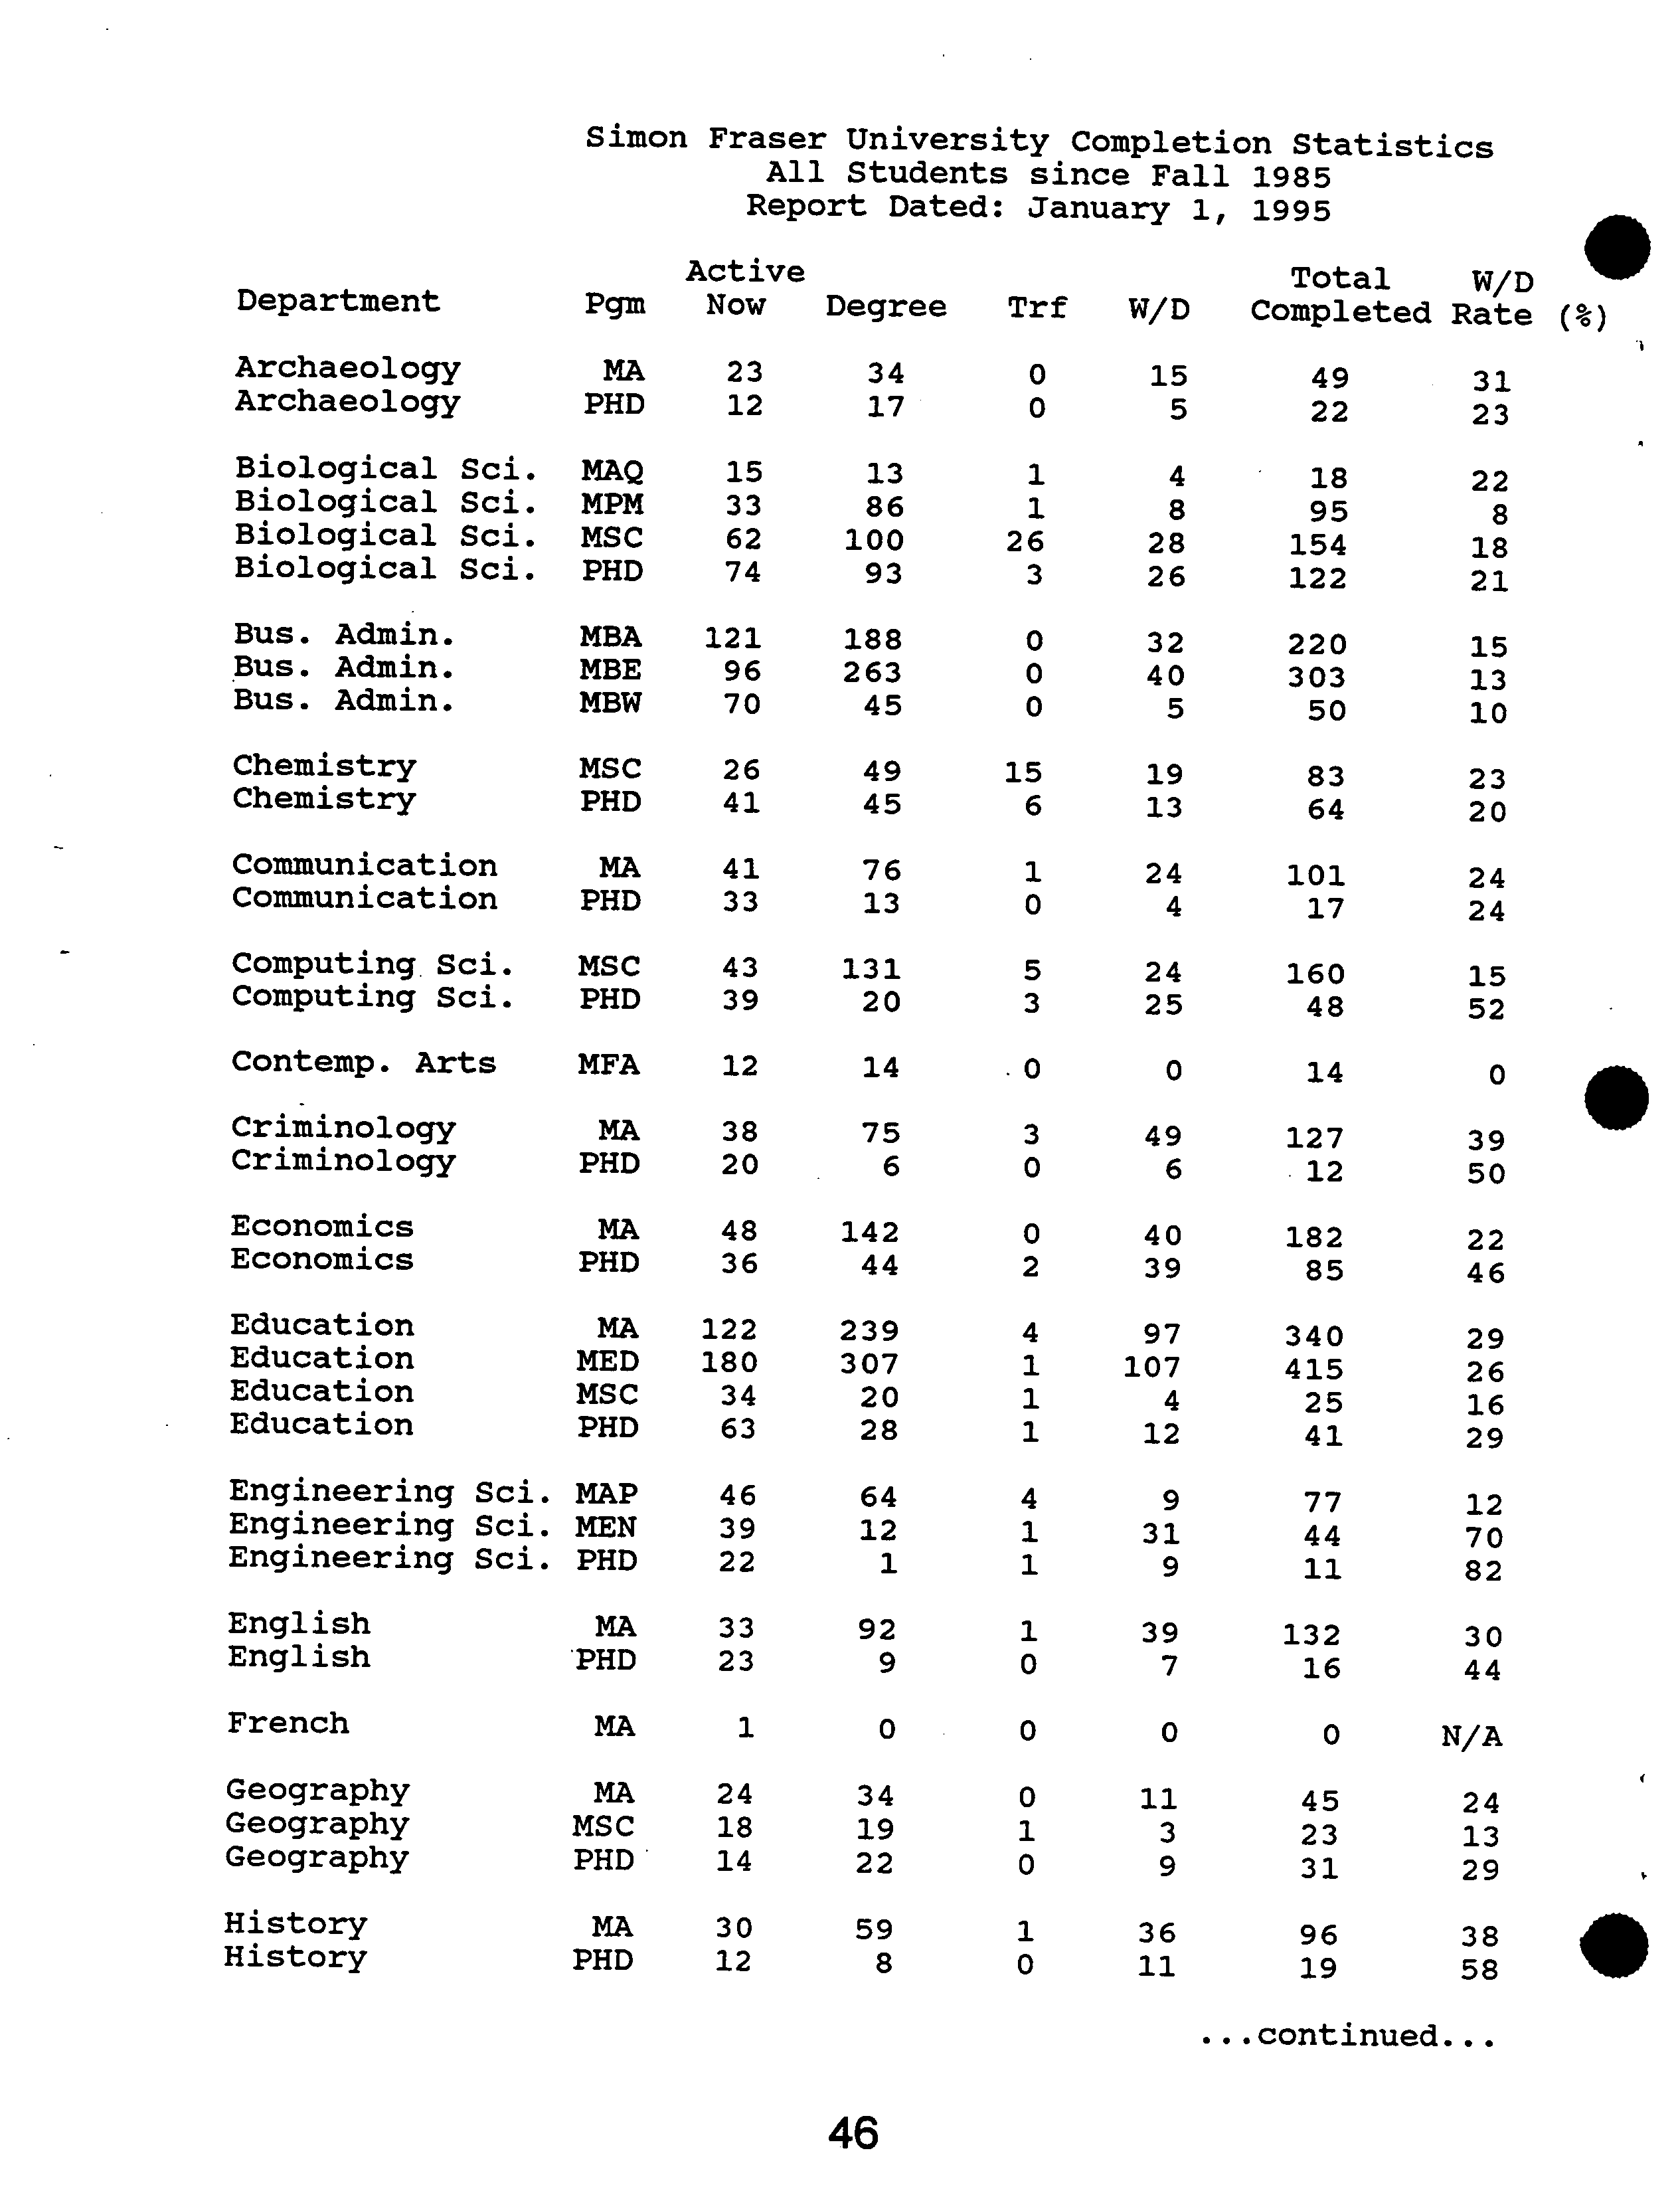
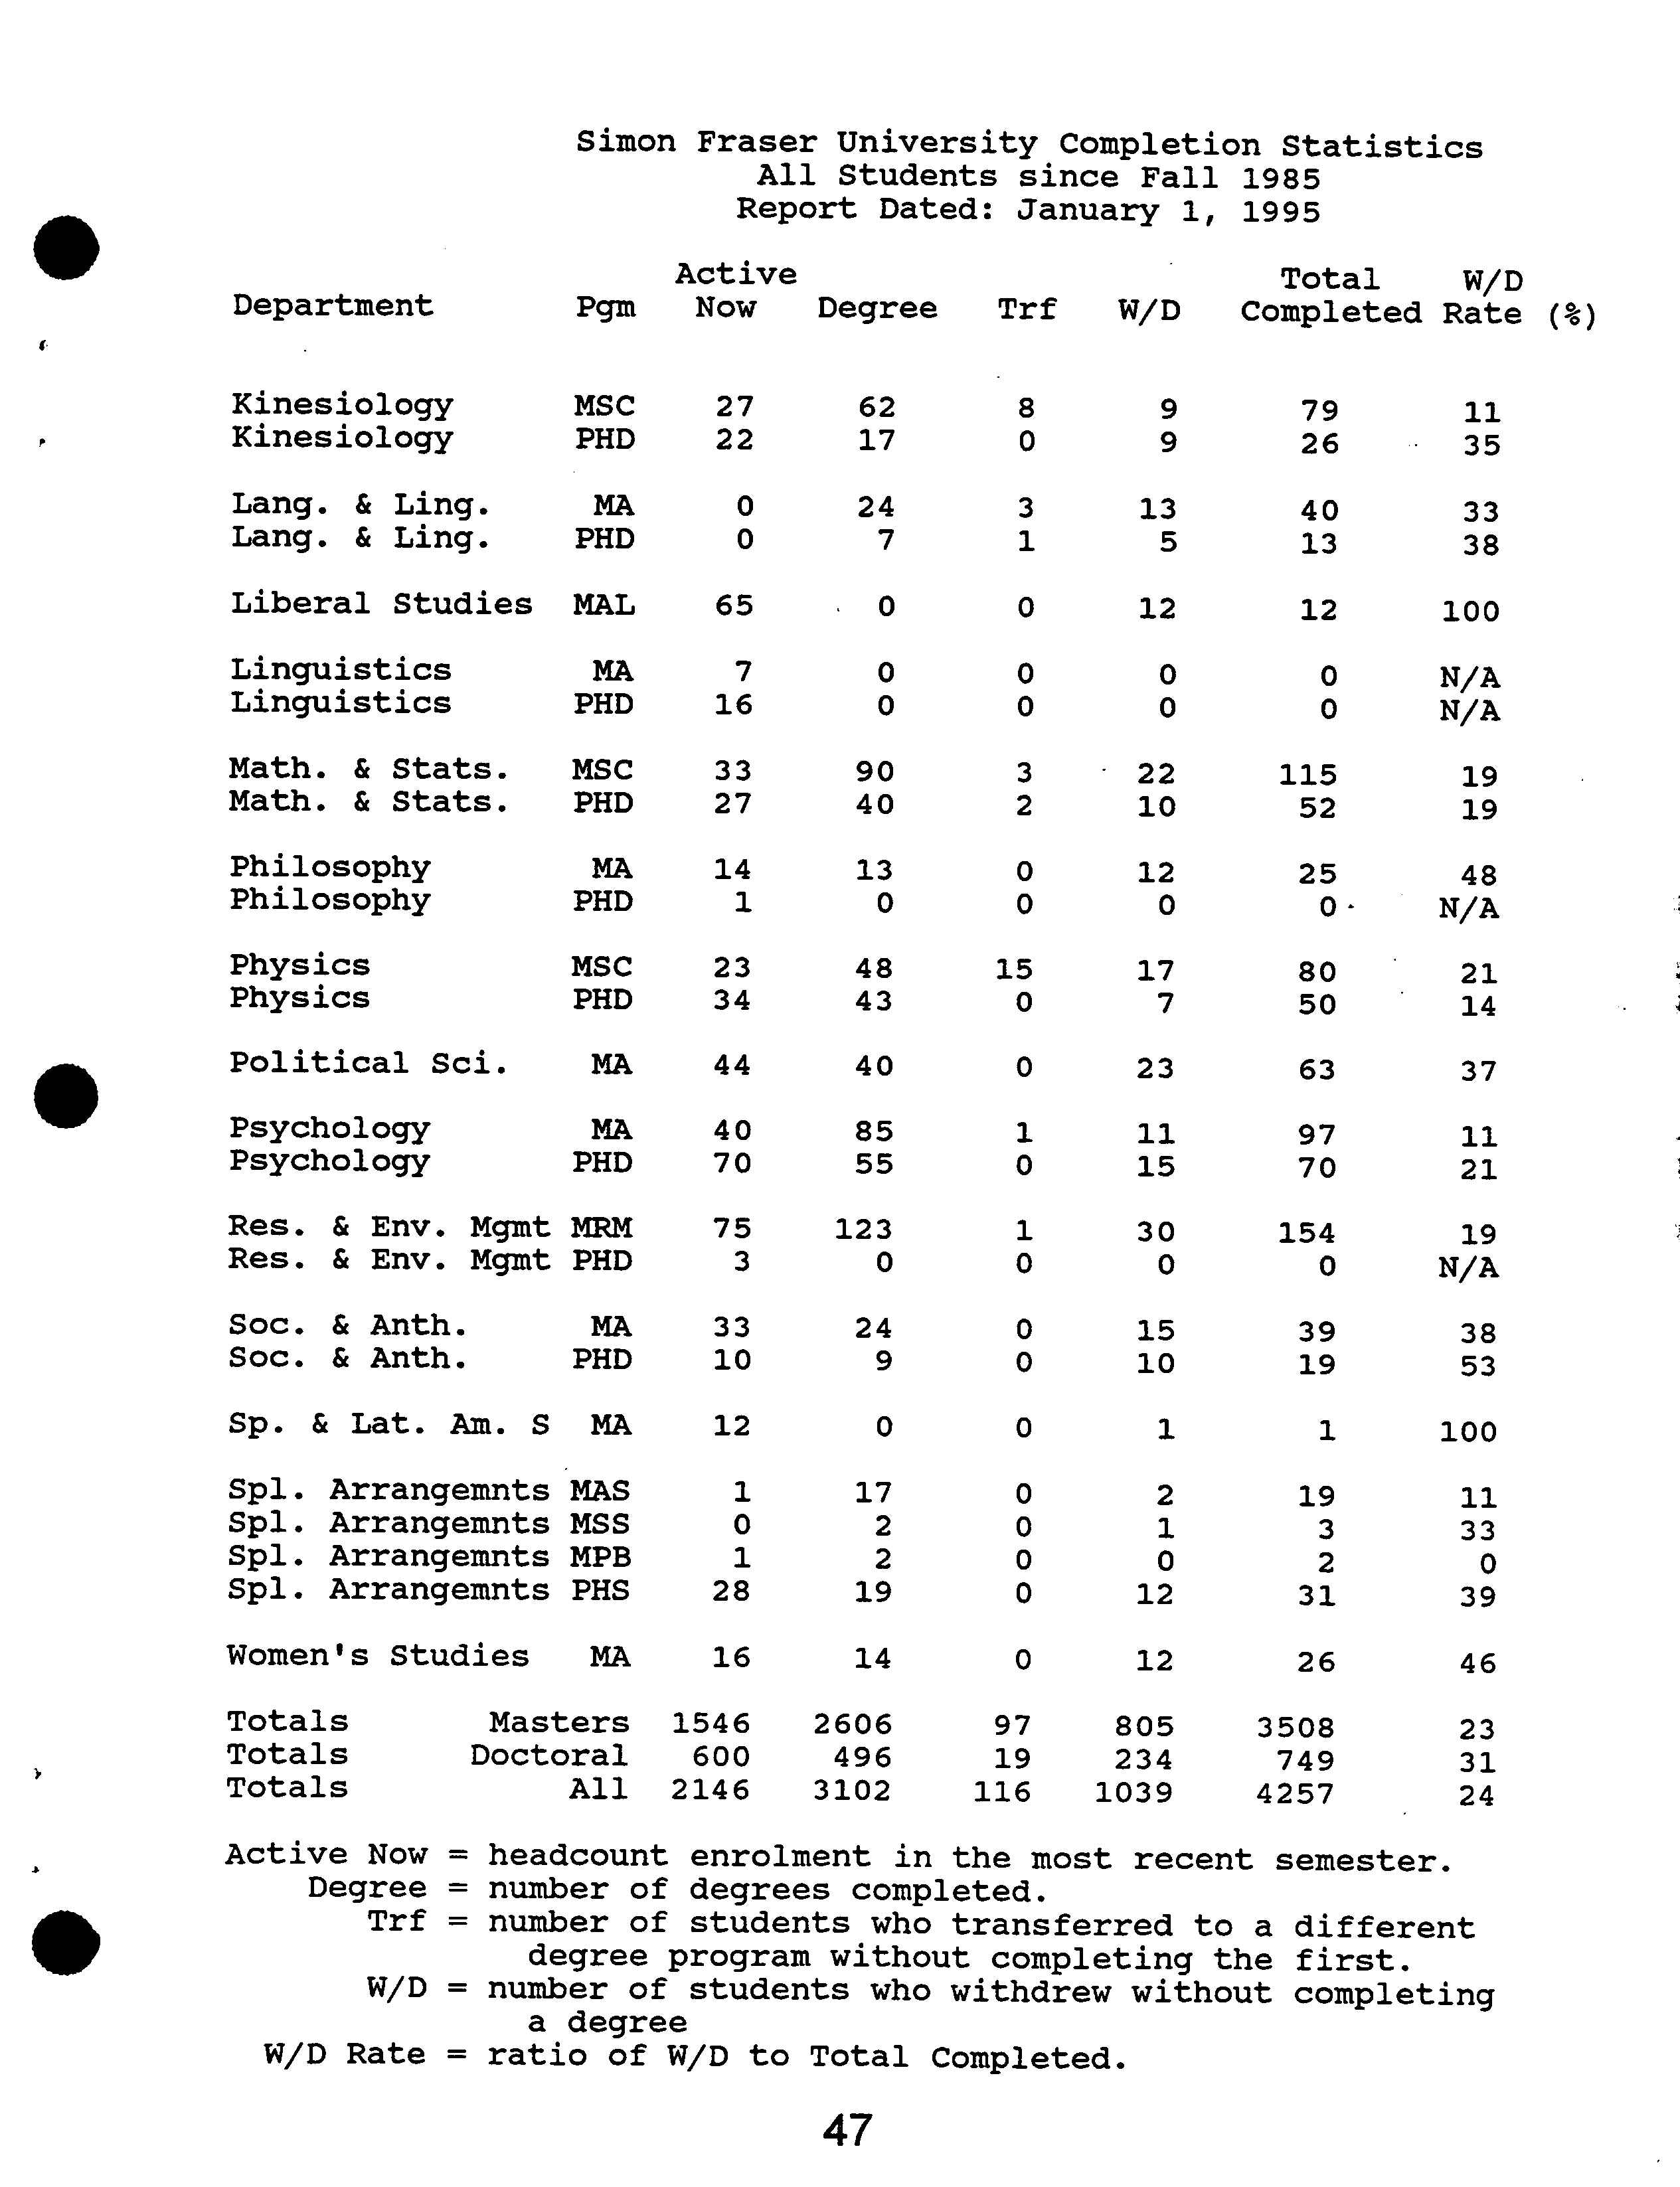
Withdrawal rates are also presented in the Graduate Studies Fact Book. There are tremendous
variations in rates between programs. The overall rates for the University as a whole are in line
with the results of similar studies performed in the U. S. and with a similar study performed by the
Canadian Association for Graduate Studies.
Nonetheless, I am very concerned about low completion rates in some of our graduate programs.
Withdrawal may be due to any one of or a combination of factors including: lack of ability, lack of
motivation, lack of financial resources, health problems, and deficiencies
in
the graduate programs
and/or their implementation. As of January 1, 1993, I have instituted an exit questionnaire to
gather information about many aspects of our graduate programs from students who successfully
complete their degrees and from those who withdraw. Because of the need for confidentiality, the
results are analyzed only statistically, once enough students respond; analysis of the second data-
set is now underway, as is data obtained from similar questionnaires sent to students who with-
drew from their programs without completing the degree. Unfortunately, return rates from stu-
dents who withdrew are very low. Delivery methods other than mail are being explored.
Another serious concern is the 'climate' that graduate students experience at SFU. To learn more
and to attempt to identify the most pressing problems, I am instituting a major study, in coopera-
tion with the Harassment Policy Coordinator, Patricia O'Hagan, and the Employment Equity Of-
ficer, Wendy Scholefield. This will be based on the study recently completed at UBC and will be
performed with the assistance of the IJBC personnel who performed their study.
1995 S.G.S.C. Report to Senate. Page 3 of 8
•
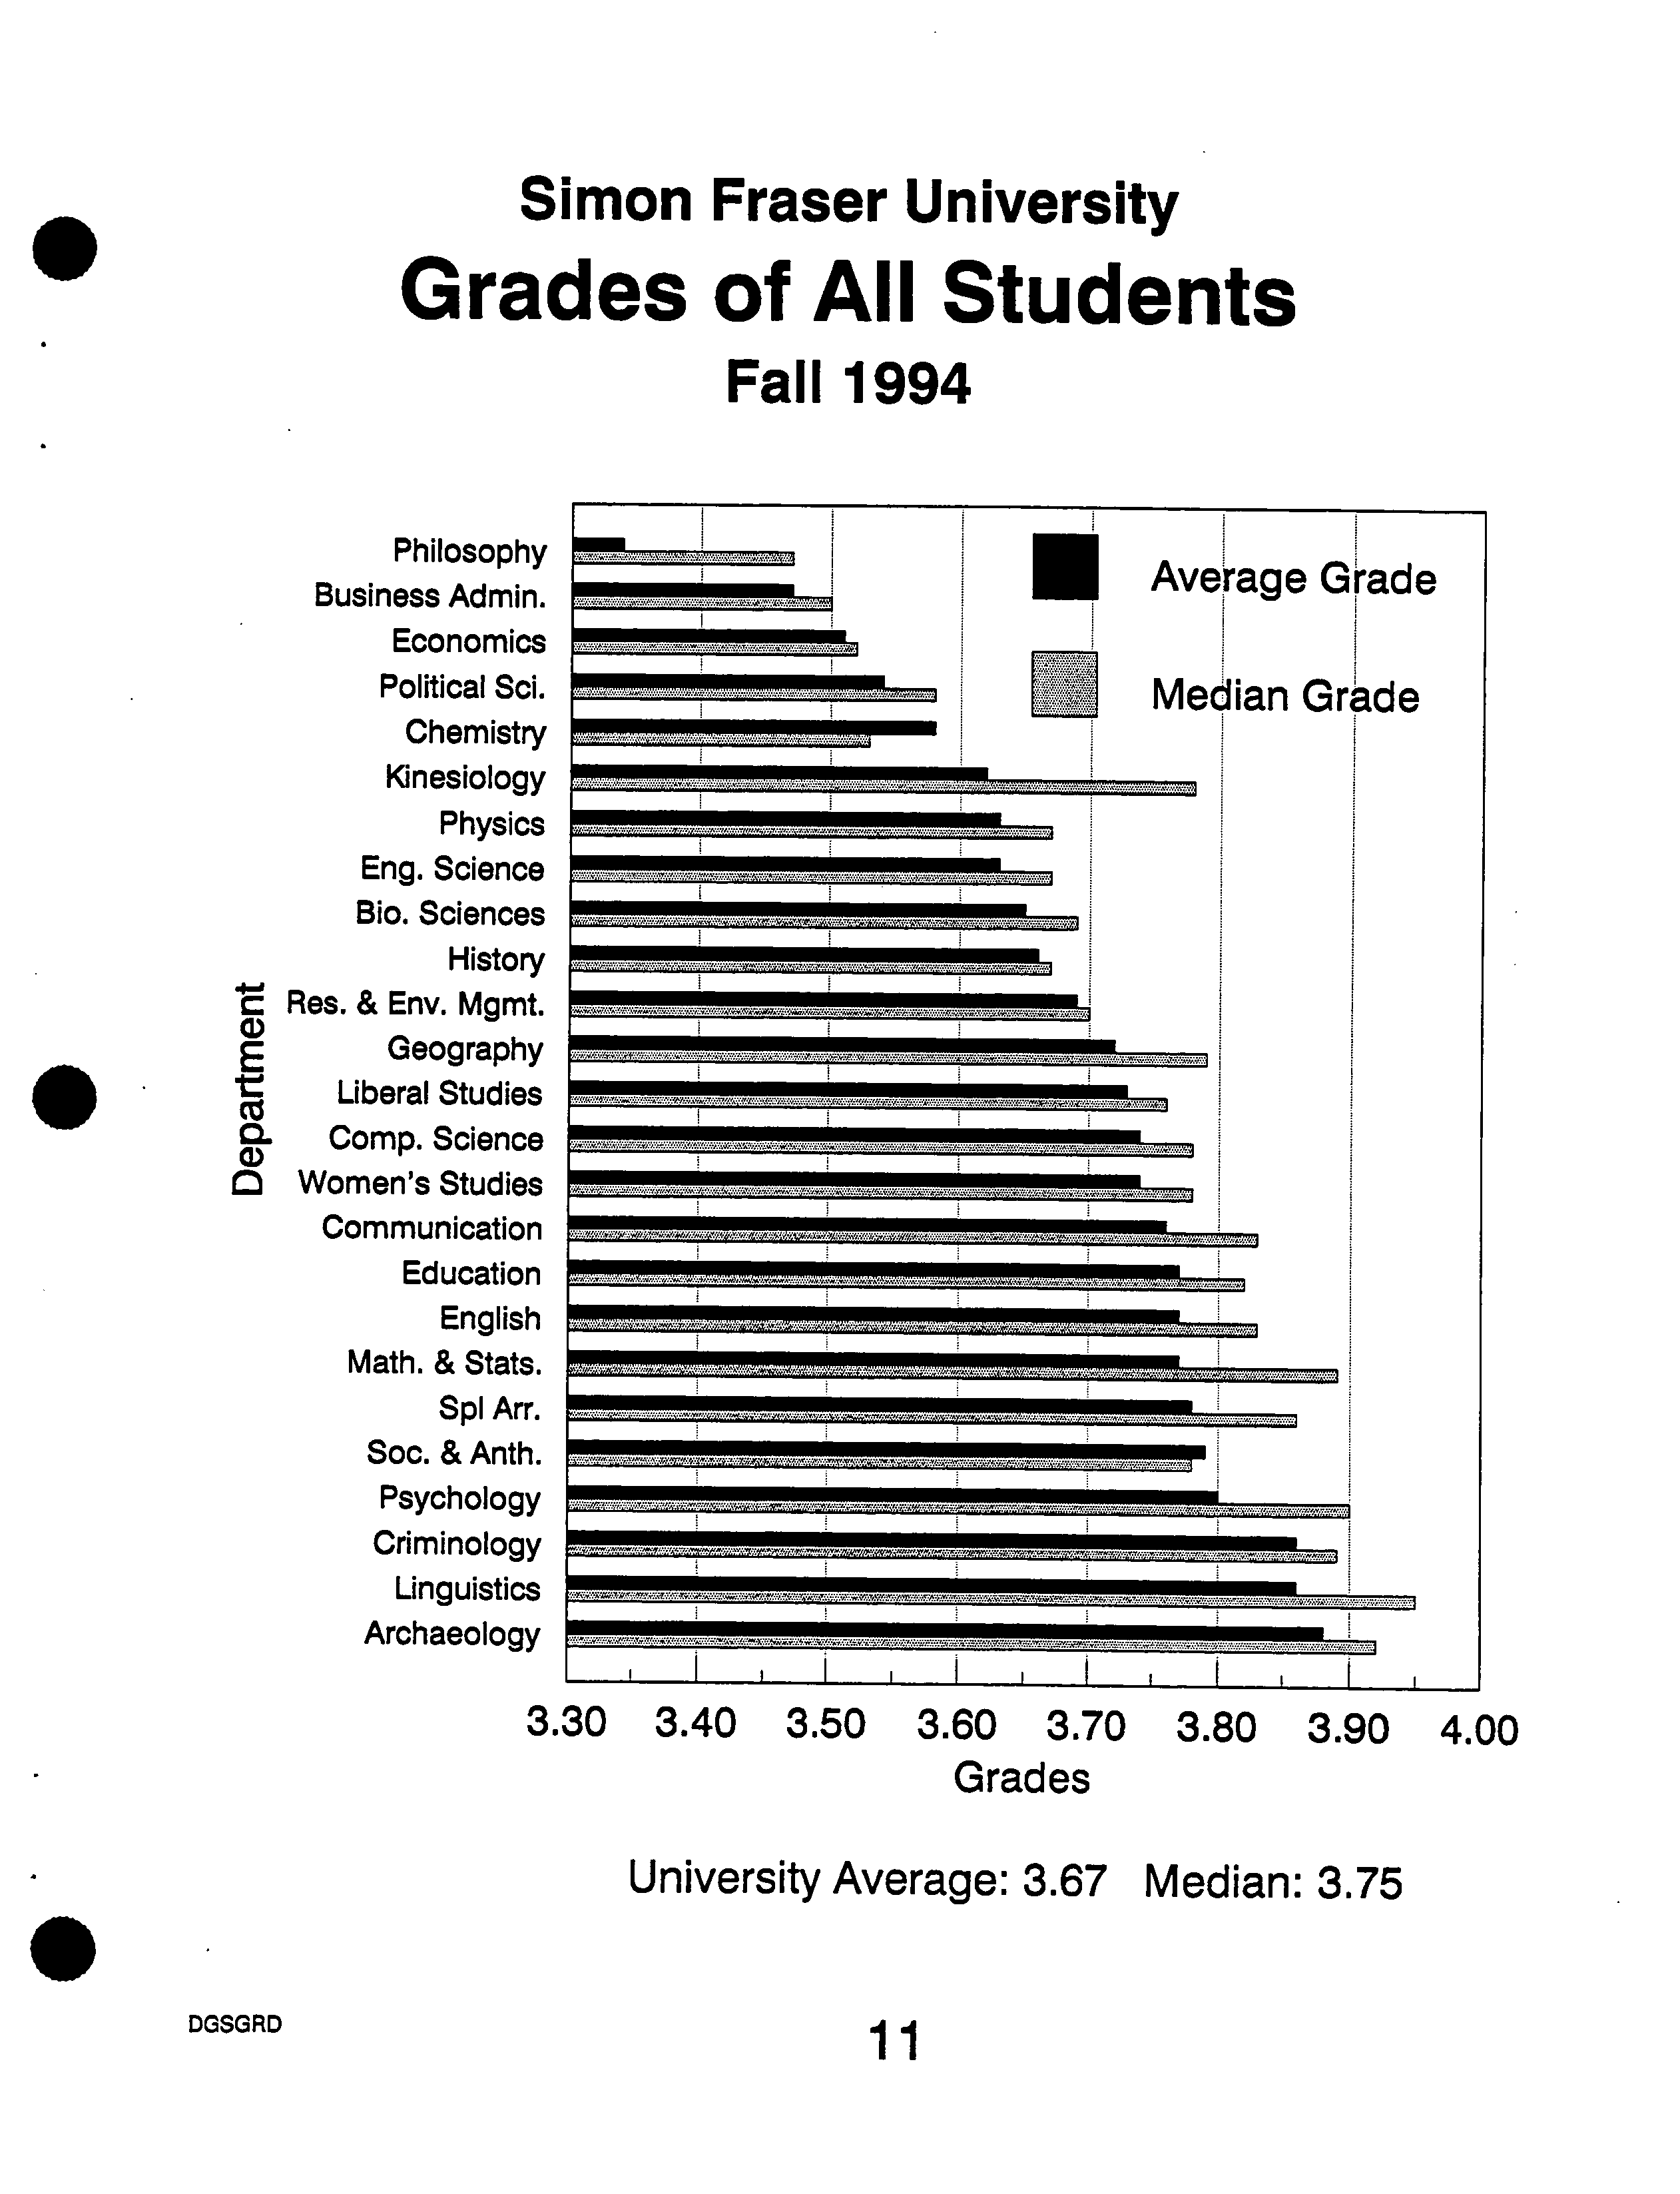
IlL Grades
The Graduate Studies Fact Book gives information on the S.F.U. graduate grades of the end of
the Summer 1994 semester; it excludes students who had not yet taken an S.F.U. graduate
course. Data were taken from the Registrars data files and incorporated into and processed within
the Graduate Studies Database system.
There is a tremendous range in the grade distributions among departments that may stem from
two causes: (1) differences in grading practices and (2) differences in the abilities of students. I
believe that, most likely, it is a mixture of these with the former a larger contributor than the lat-
ter. This range is one of the reasons that I moved away from interdepartmental comparisons of
CGPA in the ranking of applicants for S.F.U. graduate scholarships.
1V. Special Arrangements
The Senate Graduate Studies Committee serves as the Graduate Program Committee of students
enrolled under Special Arrangements. Special Arrangements provide opportunities for students
who
are 'exceptionally able' to pursue graduate programs of their own design, outside the exist-
ing departmental boundaries. Dr. Wrenn and I have given special attention to these students. With
the goal of ensuring their satisfactory progress, we have brought
all
their supervisory committees
into compliance with Senate's regulations and require up-to-date progress reports as a condition
of registration. The response of students and supervisors has been excellent.
• ?
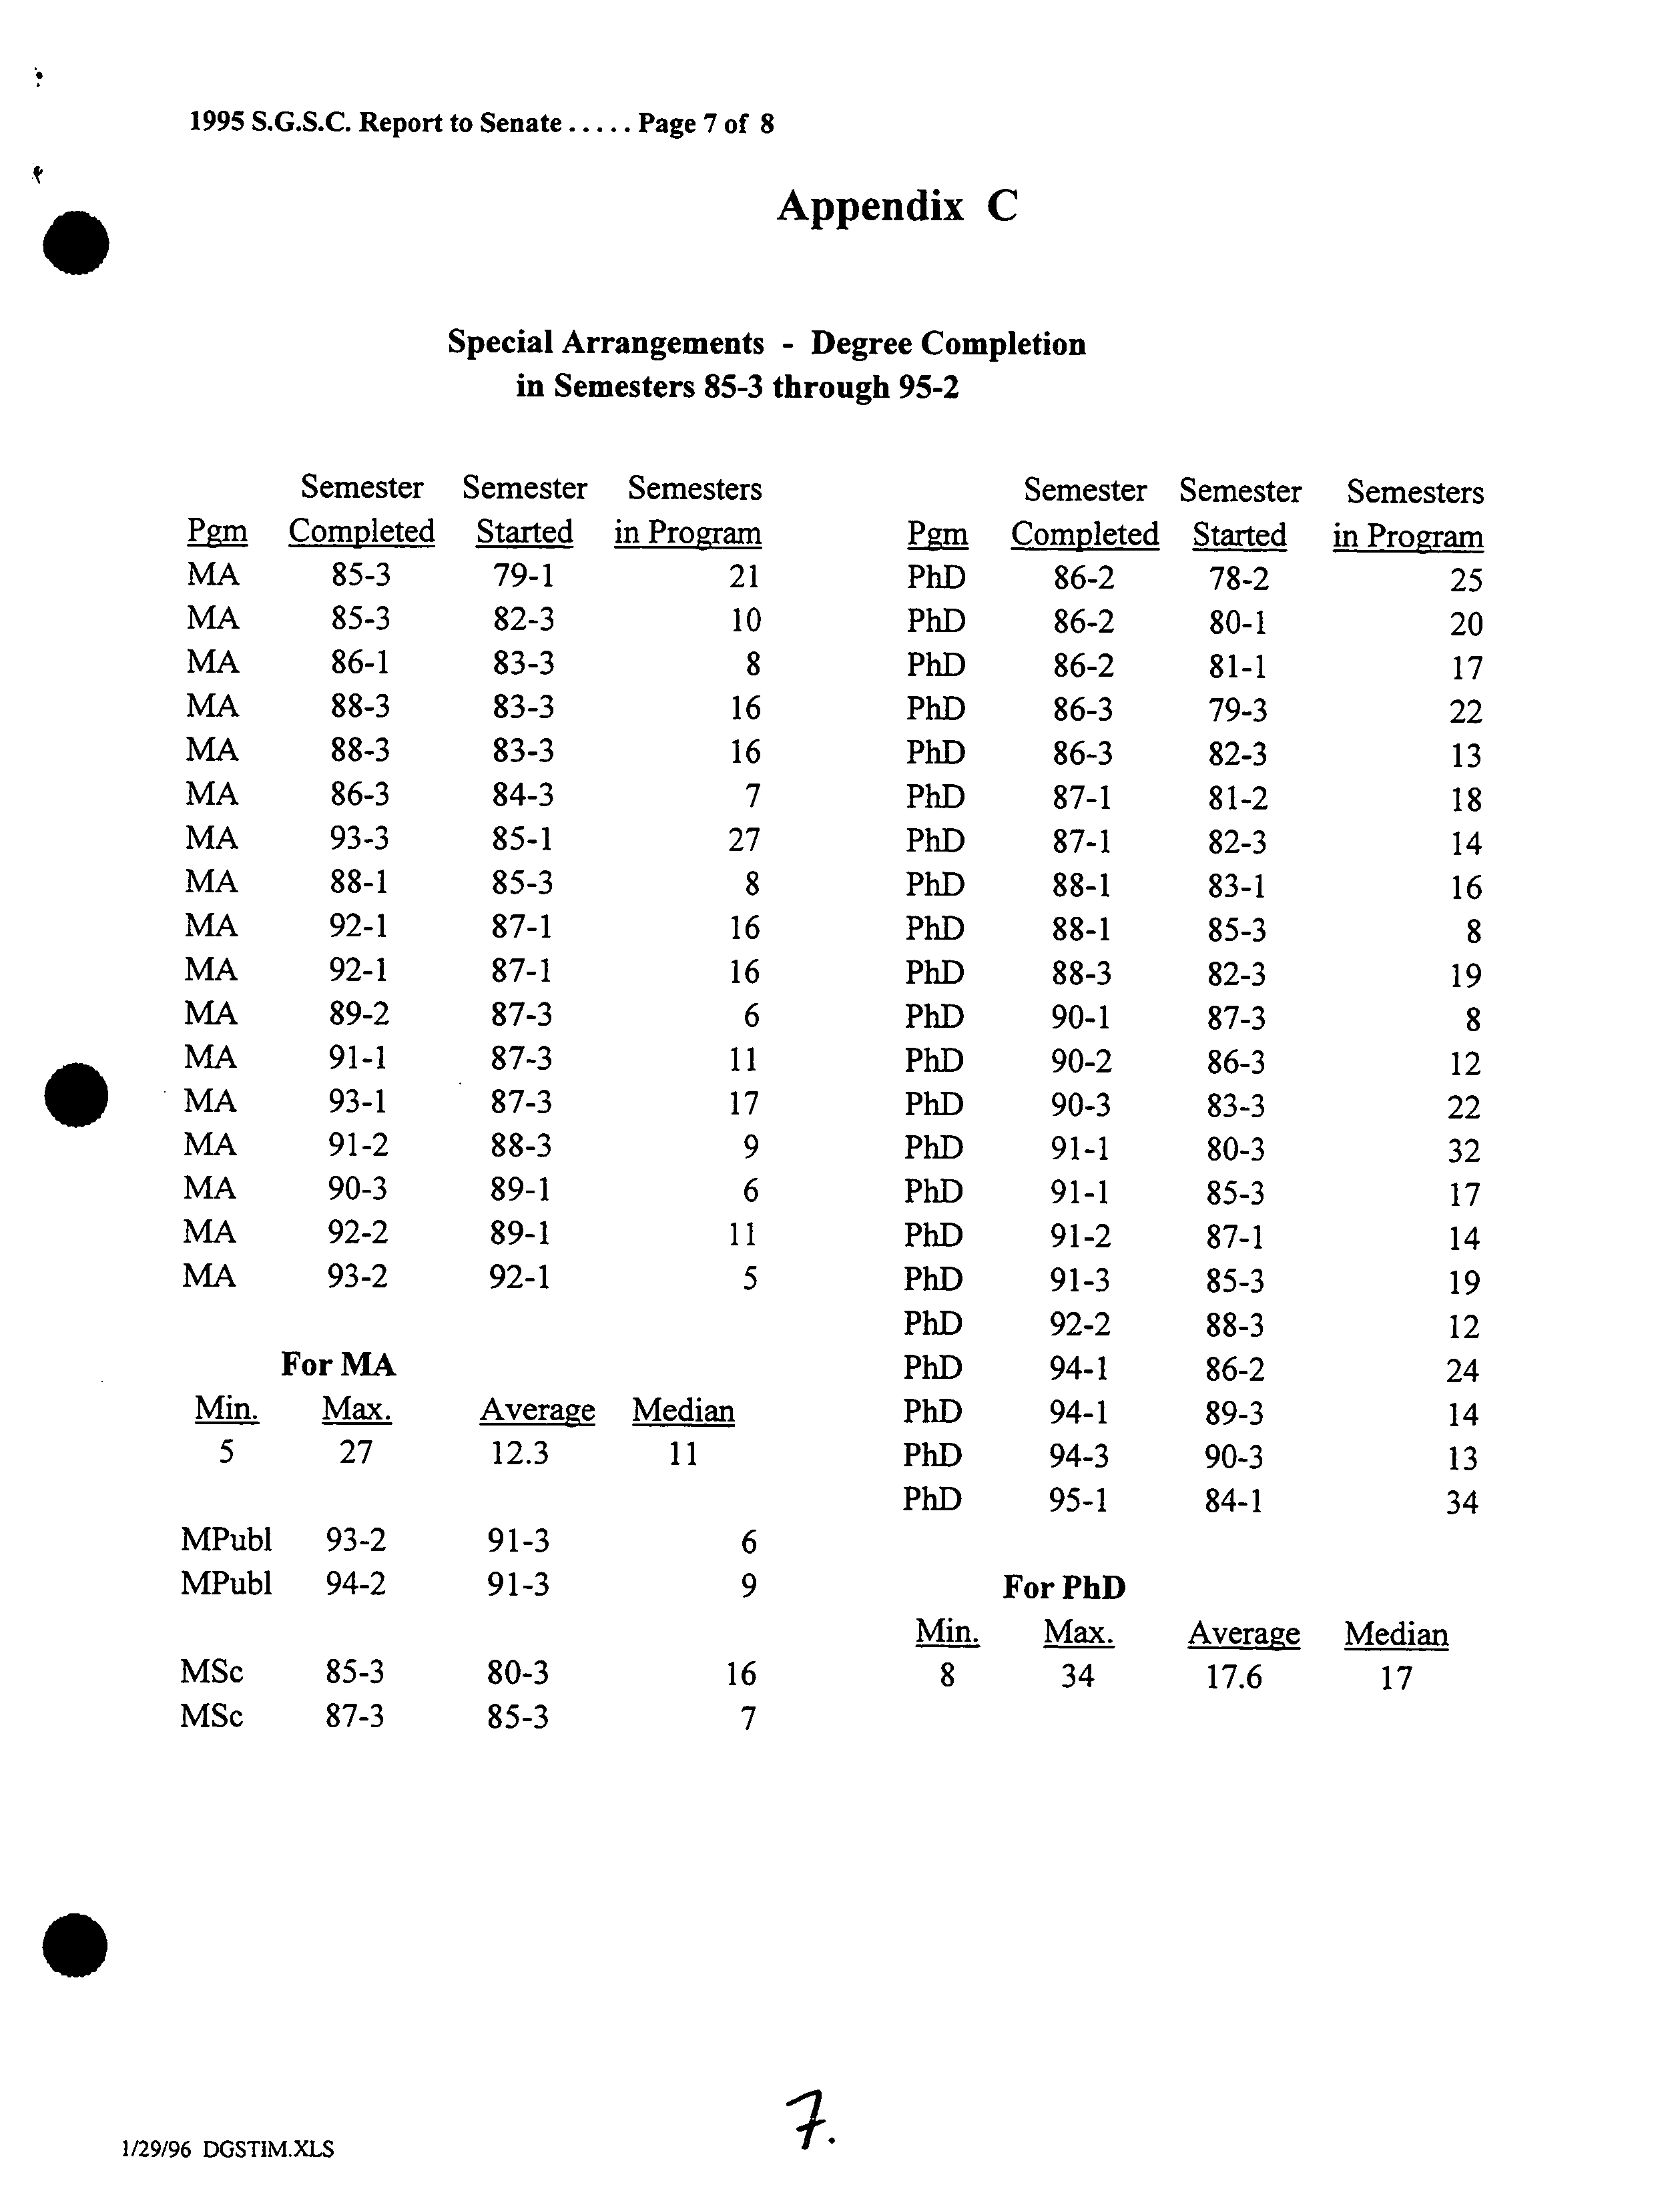
I am pleased to report that the defences of theses completed under Special Arrangements,
which
Dr. Wrenn chairs, have all been quite successful. Historically, Special Arrangements has been a
high risk area; students either succeed or fail spectacularly. The number of students enrolled have
remained roughly constant around 20 - 30. Degree completion has been highly variable; see Ap-
pendix C and the table below (degrees completed in each year):
1981 4 ?
1984 6 ?
1987 7 ?
1990 2 ?
1993 3
1982 2 ?
1985 2
?
1988 4 ?
1991 6 ?
1994 3
1983 1
?
1986 6 ?
1989 3 ?
1992 4 ?
1995 2
Some other students have dropped out and others encountered health problems. By the steps out-
lined above and by continued rigorous adherence to the criteria for entrance into Special Ar-
rangements, we hope to improve the success rate.
V. Administration
In
September 1993, an application fee was introduced. Revenues are directed to General Univer-
sity Revenues and to my office in the proportion of 30:70. Most of the finds directed to my office
are transferred to departments to assist in meeting the costs of recruiting, processing of the appli-
cations, and student travel for research and conference attendance.
In view of the impending financial difficulties, it will be essential to make the most effective use of
our limited resources. To this end, I have instituted a review of administrative procedures, in both
the academic and scholarships areas, with the goal of eliminating approvals and other administra-
tive actions that may had been of value at one point in the history of the university, but are no
. ?
longer necessary. Examples may be the approval of examining committees by Faculty Graduate
Studies Committees and the provision of official transcripts with all applications for scholarships.
MW
1995
S.G.S.C.
Report to Senate
?
. Page 4 of 8
It may also be necessary to consider the reduction or elimination of in-person examinations of
doctoral theses.
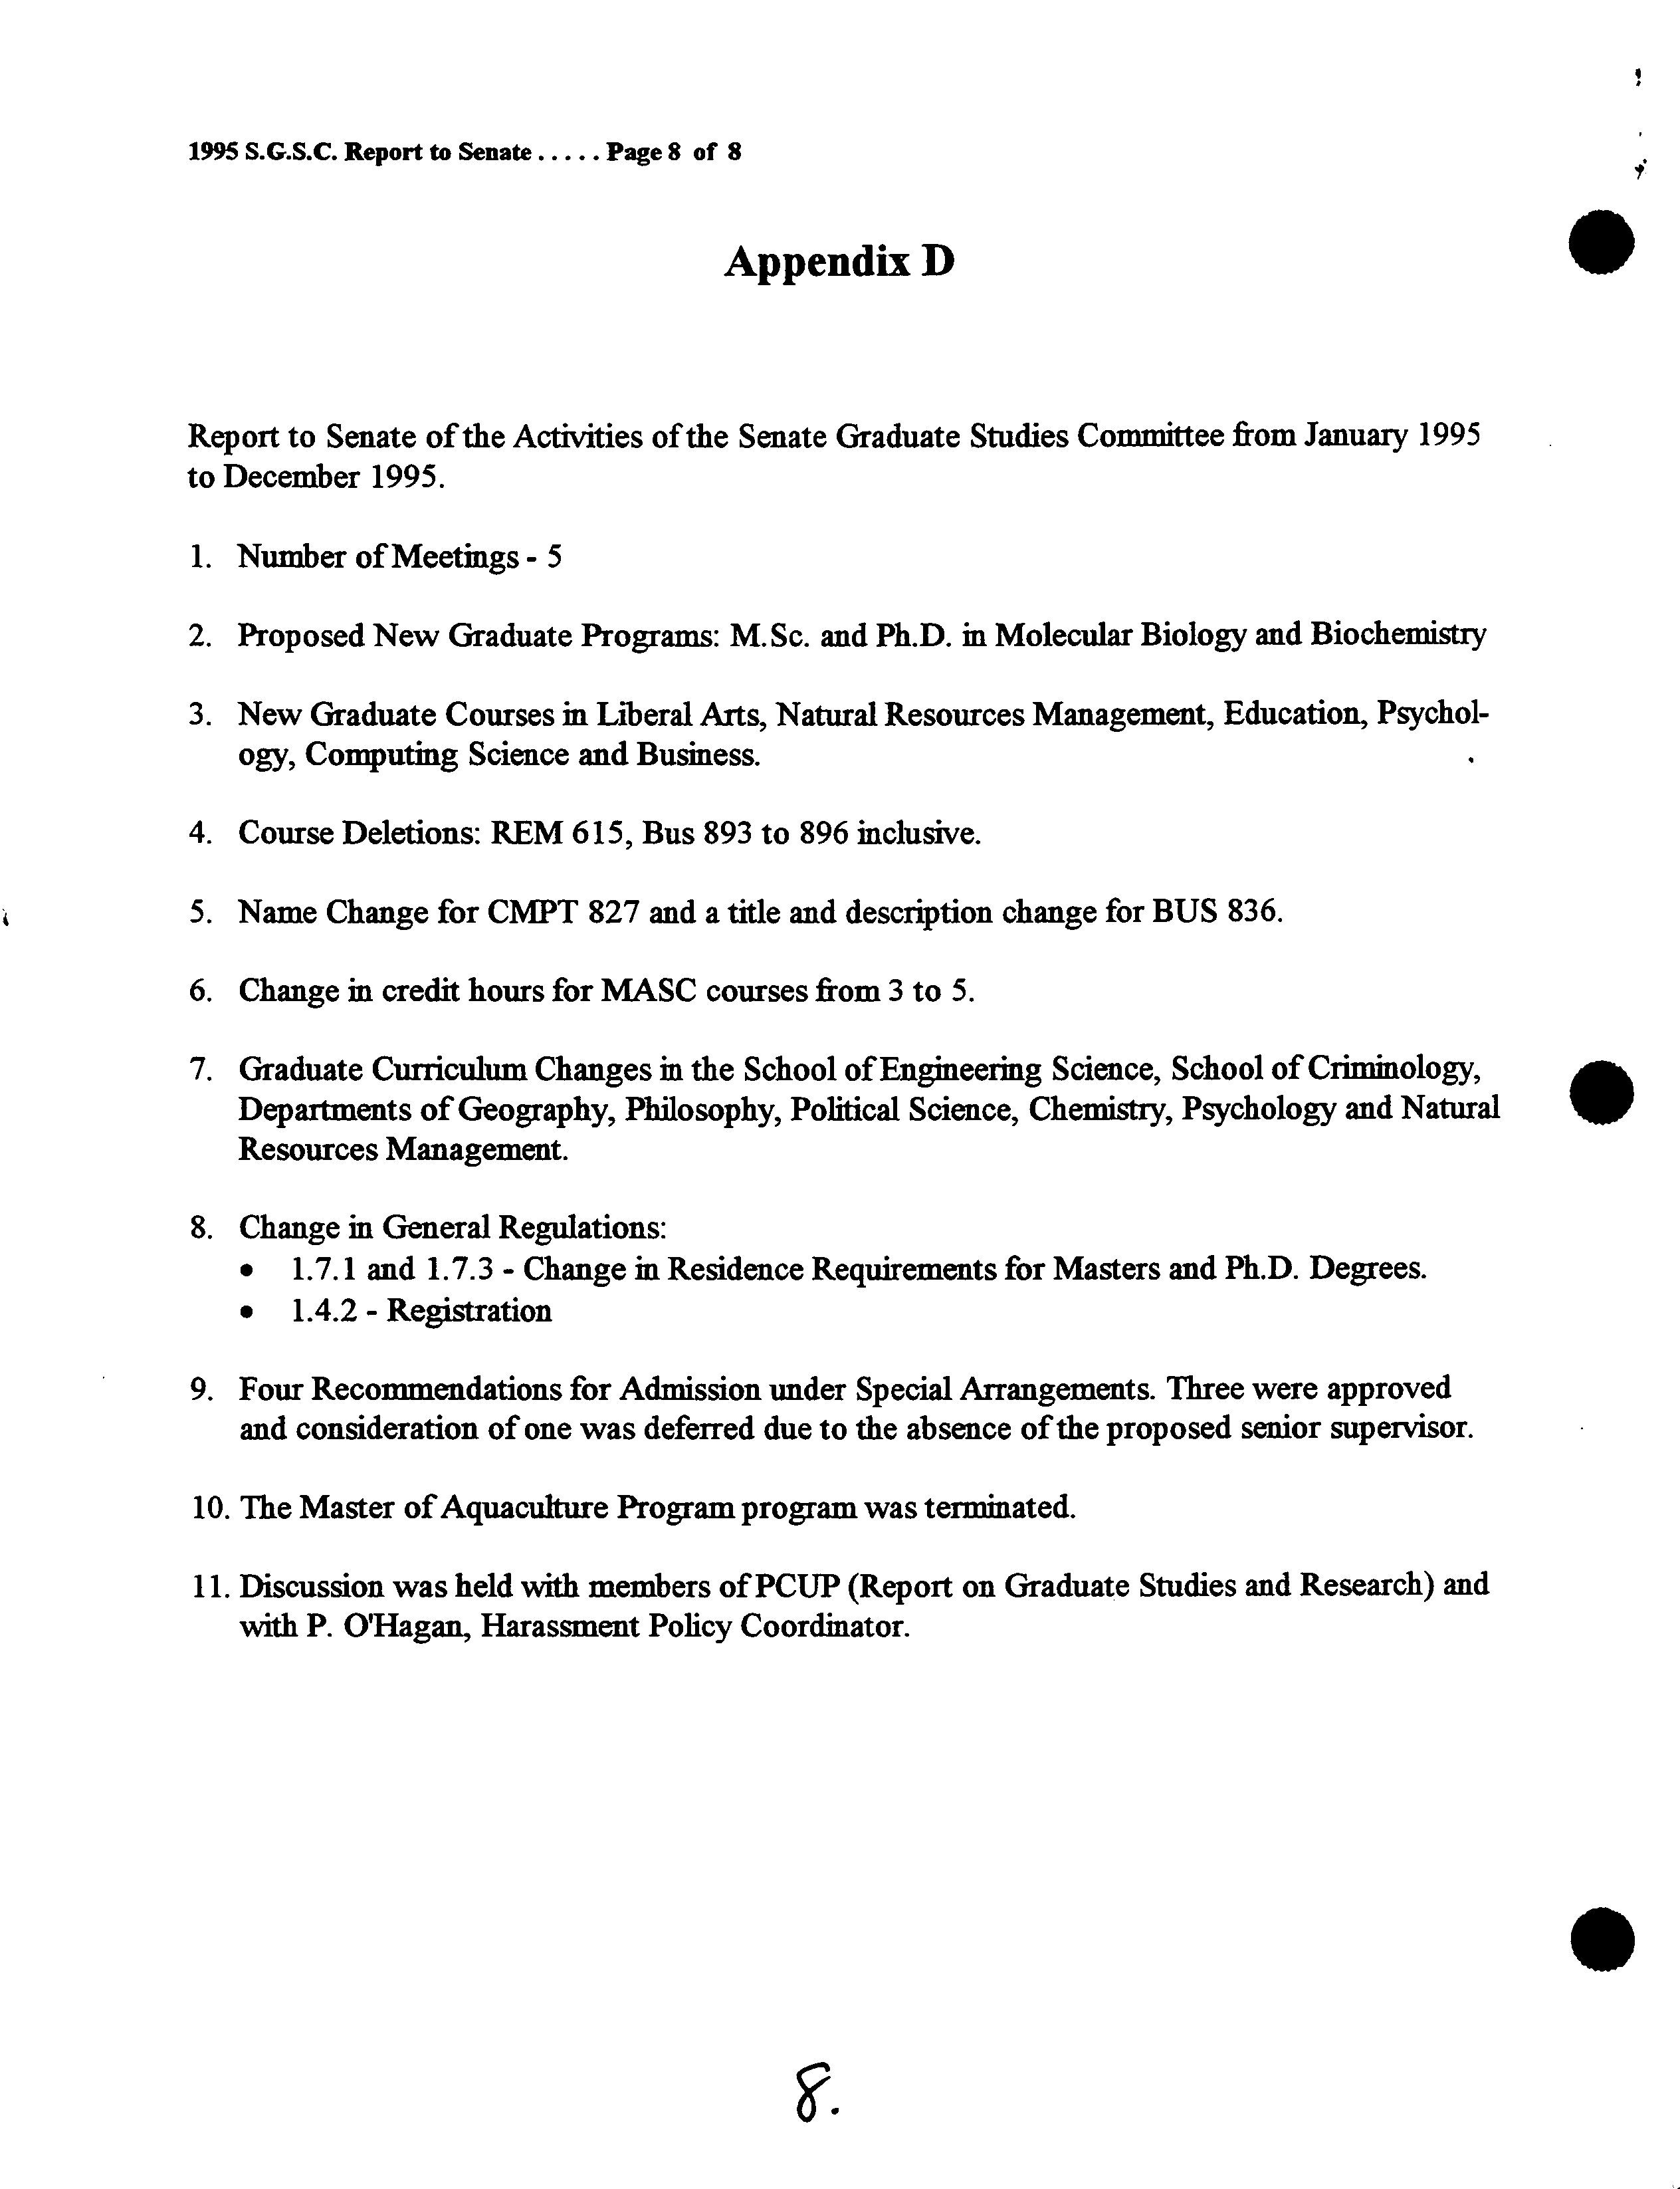
VL S.G.S.C. Motions
A
summary of the motions passed by the S.G.S.C. in 1995, prepared by the Office of the Regis-
trar, is presented in Appendix D.
VII. The
Future
I remain cautiously optimistic about the future of graduate studies at
SFU.
Over the last several
years, we introduced a number of new programs which are in the process of implementation.
Other exciting new program initiatives are presently in the planning/approval process; some of
these have received approval from the Senate Committee on Academic Planning to proceed with
detailed planning. Others have received favourable external assessments and will be considered for
approval later in 1996. It will be essential to ensure that sufficient resources are allocated to sup-
port present and future programs, while maintaining high quality. New programs should be
mounted only if there is demonstrated demand and adequate resources provided; this may imply
the discontinuation of other, less successful programs.
The introduction of a Provincial Degree Approval Process will, unfortunately, likely delay imple-
mentation of some of the new programs. It is hoped that the thorough review that they undergo in
our own assessment process will improve their chances of success at the Provincial level.
The quality
of most of
our existing programs is high, as is the quality of most of the thesis de-
fences which I have attended. With rare exception, applicants recommended by departments for
entry into Ph.D. programs have been very strong. Through aggressive recruiting of excellent ap-
plicants with the aid of entrance scholarships, rigorous enforcement of the requirements for satis-
factory progress, improved financial aid and careful monitoring
of
student supervision, it should
be possible to improve further the quality of our graduate programs, reduce withdrawal rates and
decrease degree completion times.
1^
_4
"
0_4Z4^^^
B.P.
Clayman
Dean of Graduate Studies
Attachments
S
4.
.
1995 S.G.S.C. Report to Senate
?
. Page
5
of 8
Appendix A
Annualized Graduate Enrolments for Fiscal Years:
(projected)
85/86 86/87 87/88 88/89 89/90 90/91 91/92 92/93 93/94 94/95
95/96
Head Count 1,377 1,366 1,426 1,444 1,486 1,623 1,864 2,008 2,071 2,128 2,232
FTE ?
1,125 1,084 1,147 1,169 1,256 1,404 1,593 1,720 1,779 1,844 1,935
0 Head Count 0 FTE
?
-
2,000 ----------------------------
-
?
-
—
?
1,500 ------------------------------ ---------------------- -------
?
- ?
- ?
-
1,000
I
L-
?
- ?
- ?
- ?
- ?
-
?
-
?
- ?
-
500
?
-.
?
-
?
-
?
- ?
-•
?
-
?
.
1-. ?
-
0 --
00 ?
--
00 ?
?
0000
??
---
00 ?
?
O
CD ?
-- --
N
-- --
00 ?
N
00
?
00 ?
00 ?
00 ?
00
?
Degrees Awarded in Fiscal Years:
?
-
85/86
86/87 87/88 88/89 89/90 90/91 91/92 92/93 93/94
94/95
95/96
Master's ?
277
?
212
?
213
?
253
?
245 ?
307
?
246 ?
315
?
400 ?
423 ?
367
Doctoral
?
39 ?
44
?
51
?
45 ?
50
?
60 ?
59
?
66 ?
57 ?
78
?
69
500
?
100
Doctoral ---------------------
--. -----------
CZ
E ?
iFI±ITIIIIIII.IiiIII7IIIIIIIIIIIIIIIIIIIIIIIi ;
10r---------------------------------------------------------------------------------------------------------------------------------j0
V
.
00
00
0000
C\00
Q\
-
N
rfl
00
O
.
N
r
00
00
00
00
00
C
C
O\
O
C\
OIN
•
?
1/29/96
SGSCREP3.XLS
1995 S.G.S.C.
Report to Senate ?
. Page 6 of 8
Appendix B
Programs approved for part-time study, as of December 1995:
Archaeology (MA,
Ph.D.)
Biological Sciences (MPM)
Business Administration (Exec MBA)
Communication (M.A., Ph.D.)
Economics (MA,
Ph.D.)
Education (MA, M.Sc., M.Ed.)
Engineering Science (M.Eng.)
English (MA, Ph.D.)
French (M.A.)
History (MA, Ph.D.)
Liberal Studies (MA)
Mathematics and Statistics (M.Sc., Ph.D.)
Political Science (MA)
Publishing (M.Publ)
Resource and Environment Management (REM)
Spanish and Latin American Studies (MA)
Special Arrangements (MA,
Ph.D.)
Women's Studies (MA)
.
.
MO
1995 S.G.S.C. Report to Senate
?
. Page 7 of 8
Appendix C
Special Arrangements - Degree Completion
in Semesters 85-3 through 95-2
.
Semester
Semester
Semesters
E g rn
Completed
Started
in Program
MA
85-3
79-1
21
MA
85-3
82-3
10
MA
86-1
83-3
8
MA
88-3
83-3
16
MA
88-3
83-3
16
MA
86-3
84-3
7
MA
93-3
85-1
27
MA
88-1
85-3
8
MA
92-1
87-1
16
MA
92-1
87-1
16
MA
89-2
87-3
6
MA
91-1
87-3
11
MA
93-1
87-3
17
MA
91-2
88-3
9
MA
90-3
89-1
6
MA
92-2
89-1
11
MA
93-2
92-1
5
For
MA
Min
Max.
Average
Median
5
27
12.3
11
MPubl
93-2
91-3
6
MPubl
94-2
91-3
9
MSc
85-3
80-3
16
MSc
87-3
85-3
7
Semester
Semester
Semesters
Pgm
Comp leted
Started
in Program
PhD
86-2
78-2
25
PhD
86-2
80-1
20
PhD
86-2
81-1
17
PhD
86-3
79-3
22
PhD
86-3
82-3
13
PhD
87-1
81-2
18
PhD
87-1
82-3
14
PhD
88-1
83-1
16
PhD
88-1
85-3
8
PhD
88-3
82-3
19
PhD
90-1
87-3
8
PhD
90-2
86-3
12
PhD
90-3
83-3
22
PhD
91-1
80-3
32
PhD
91-1
85-3
17
PhD
91-2
87-1
14
PhD
91-3
85-3
19
PhD
92-2
88-3
12
PhD
94-1
86-2
24
PhD
94-1
89-3
14
PhD
94-3
90-3
13
PhD
95-1
84-1
34
For PhD
Mm.
Max.
Average
Median
8
34
17.6
17
.
1/29/96 DGSTIM.XLS
?
1.
1995 S.G.S.C. Report to Senate
?
. Page 8 of 8
Appendix D ?
0
Report to Senate of the Activities of the Senate Graduate Studies Committee from January 1995
to December 1995.
1. Number of Meetings -
5
2.
Proposed New Graduate Programs: M.Sc. and Ph.D. in Molecular Biology and Biochemistry
3. New Graduate Courses in Liberal Arts, Natural Resources Management, Education, Psychol-
ogy, Computing Science and Business.
4.
Course Deletions: REM
615,
Bus 893 to 896 inclusive.
5. Name Change for CWT 827 and a title and description change for BUS 836.
6. Change in credit hours for MASC courses from 3 to
5.
7. Graduate Curriculum Changes in the School of Engineering Science, School of Criminology,
Departments of Geography, Philosophy, Political Science, Chemistry, Psychology and Natural
Resources Management.
8.
Change in General Regulations:
• 1.7.1 and 1.7.3 - Change in Residence Requirements for Masters and Ph.D. Degrees.
• 1.4.2 - Registration
9.
Four Recommendations for Admission under Special Arrangements. Three were approved
and consideration of one was deferred due to the absence of the proposed senior supervisor.
10. The Master of Aquaculture Program program was terminated.
11. Discussion was held with members of PCUP (Report on Graduate Studies and Research) and
with P. O'Hagan, Harassment Policy Coordinator.
0
.
SIMON FRASER UNIVERSITY
Graduate Studies Fact Book
r
January 1995
Office of the Dean of Graduate Studies
Simon Fraser University
Burnaby, British Columbia
V5A 1S6
.
Simon Fraser University
Graduate Studies Fact Book
The Graduate Studies Fact Book provides a snap-shot of the Fall
Semester student population, as well as retrospective data on
program completion. The information is derived from enrolment
data provided by the Office of the Registrar, supplemented by
information gathered and processed in this office. It is
largely complementary to the S.F.U. Fact Book prepared by the
Office of Analytical Studies. Minor differences in enrolment
figures exist between the two publications due to differences
• ?
in data collection intervals. For the same reason, the data should
not be used for inter-year comparisons. Note also that the program
in Languages and Linguistics was separated into the Departments
of French and Linguistics in 1994.
Each section is headed by a graphical summary. In some cases,
the summaries omit programs where the numbers reported are too
small to be significant; the tabular data are complete.
It is hoped that this Fact Book will be a useful source of
information for the campus community. This office can provide
additional more specialized reports, if these are required.
Bruce P. Clayman
Dean of Graduate Studies
Room A06046
Phone: (604) 291-4255
Fax: (604) 291- 3080
Internet: sfu-dgs@sfu.ca
Simon Fraser University
Graduate Studies Fact Book
Contents
Enrolment
?
3
O
Grades
?
11
Citizenship
?
15
Age
?
21
Degree Completion Time
?
26
Degree Completion by Cohorts
?
31
Withdrawal Data
?
43
S.F.U. Financial Awards
?
48
LI
0
Contents.drw ?
2
Simon Fraser University
Annualized Graduate Enrolments for Fiscal Years:
(projected)
•
?
?
85/86 86/87 87/88 88/89 89/90 90/91 91/92 92/93 93/94 94/95
Head Count 1,377 1,366 1,426 1,444 1,486 1,623 1,864 2,008 2,071 2,097
FTE ?
1,125 1,084 1,147 1,169 1,256 1,404 1,593 1,720 1,779 1,807
2,500
?
2,000 ?
1,500 ?
1,000
?
500
?
0
85/86 86/87 87/88 88/89 89/90 90/91 91/92 92/93 93/94 94/95
I
Degrees Awarded in Fiscal
Years:
85/86 ?
86/87 ?
87/88 88/89 ?
89/90 ?
90/91 ?
91/92 ?
92/93 ?
93194
?
94/95
Masters ?
279 ?
214 ?
213 253 ?
245 ?
219 ?
285 ?
315 ?
308 ?
425
Doctoral ?
39 ?
42 ?
50 45 ?
50 ?
49 ?
64 ?
66 ?
66 ?
78
500
400
300
200
100
0
85/86 86/87 87/88 88/89 89/90 90/91 91/92 92/93 93/94
94/95
sgsctepl.XI$ 4-Jan-S
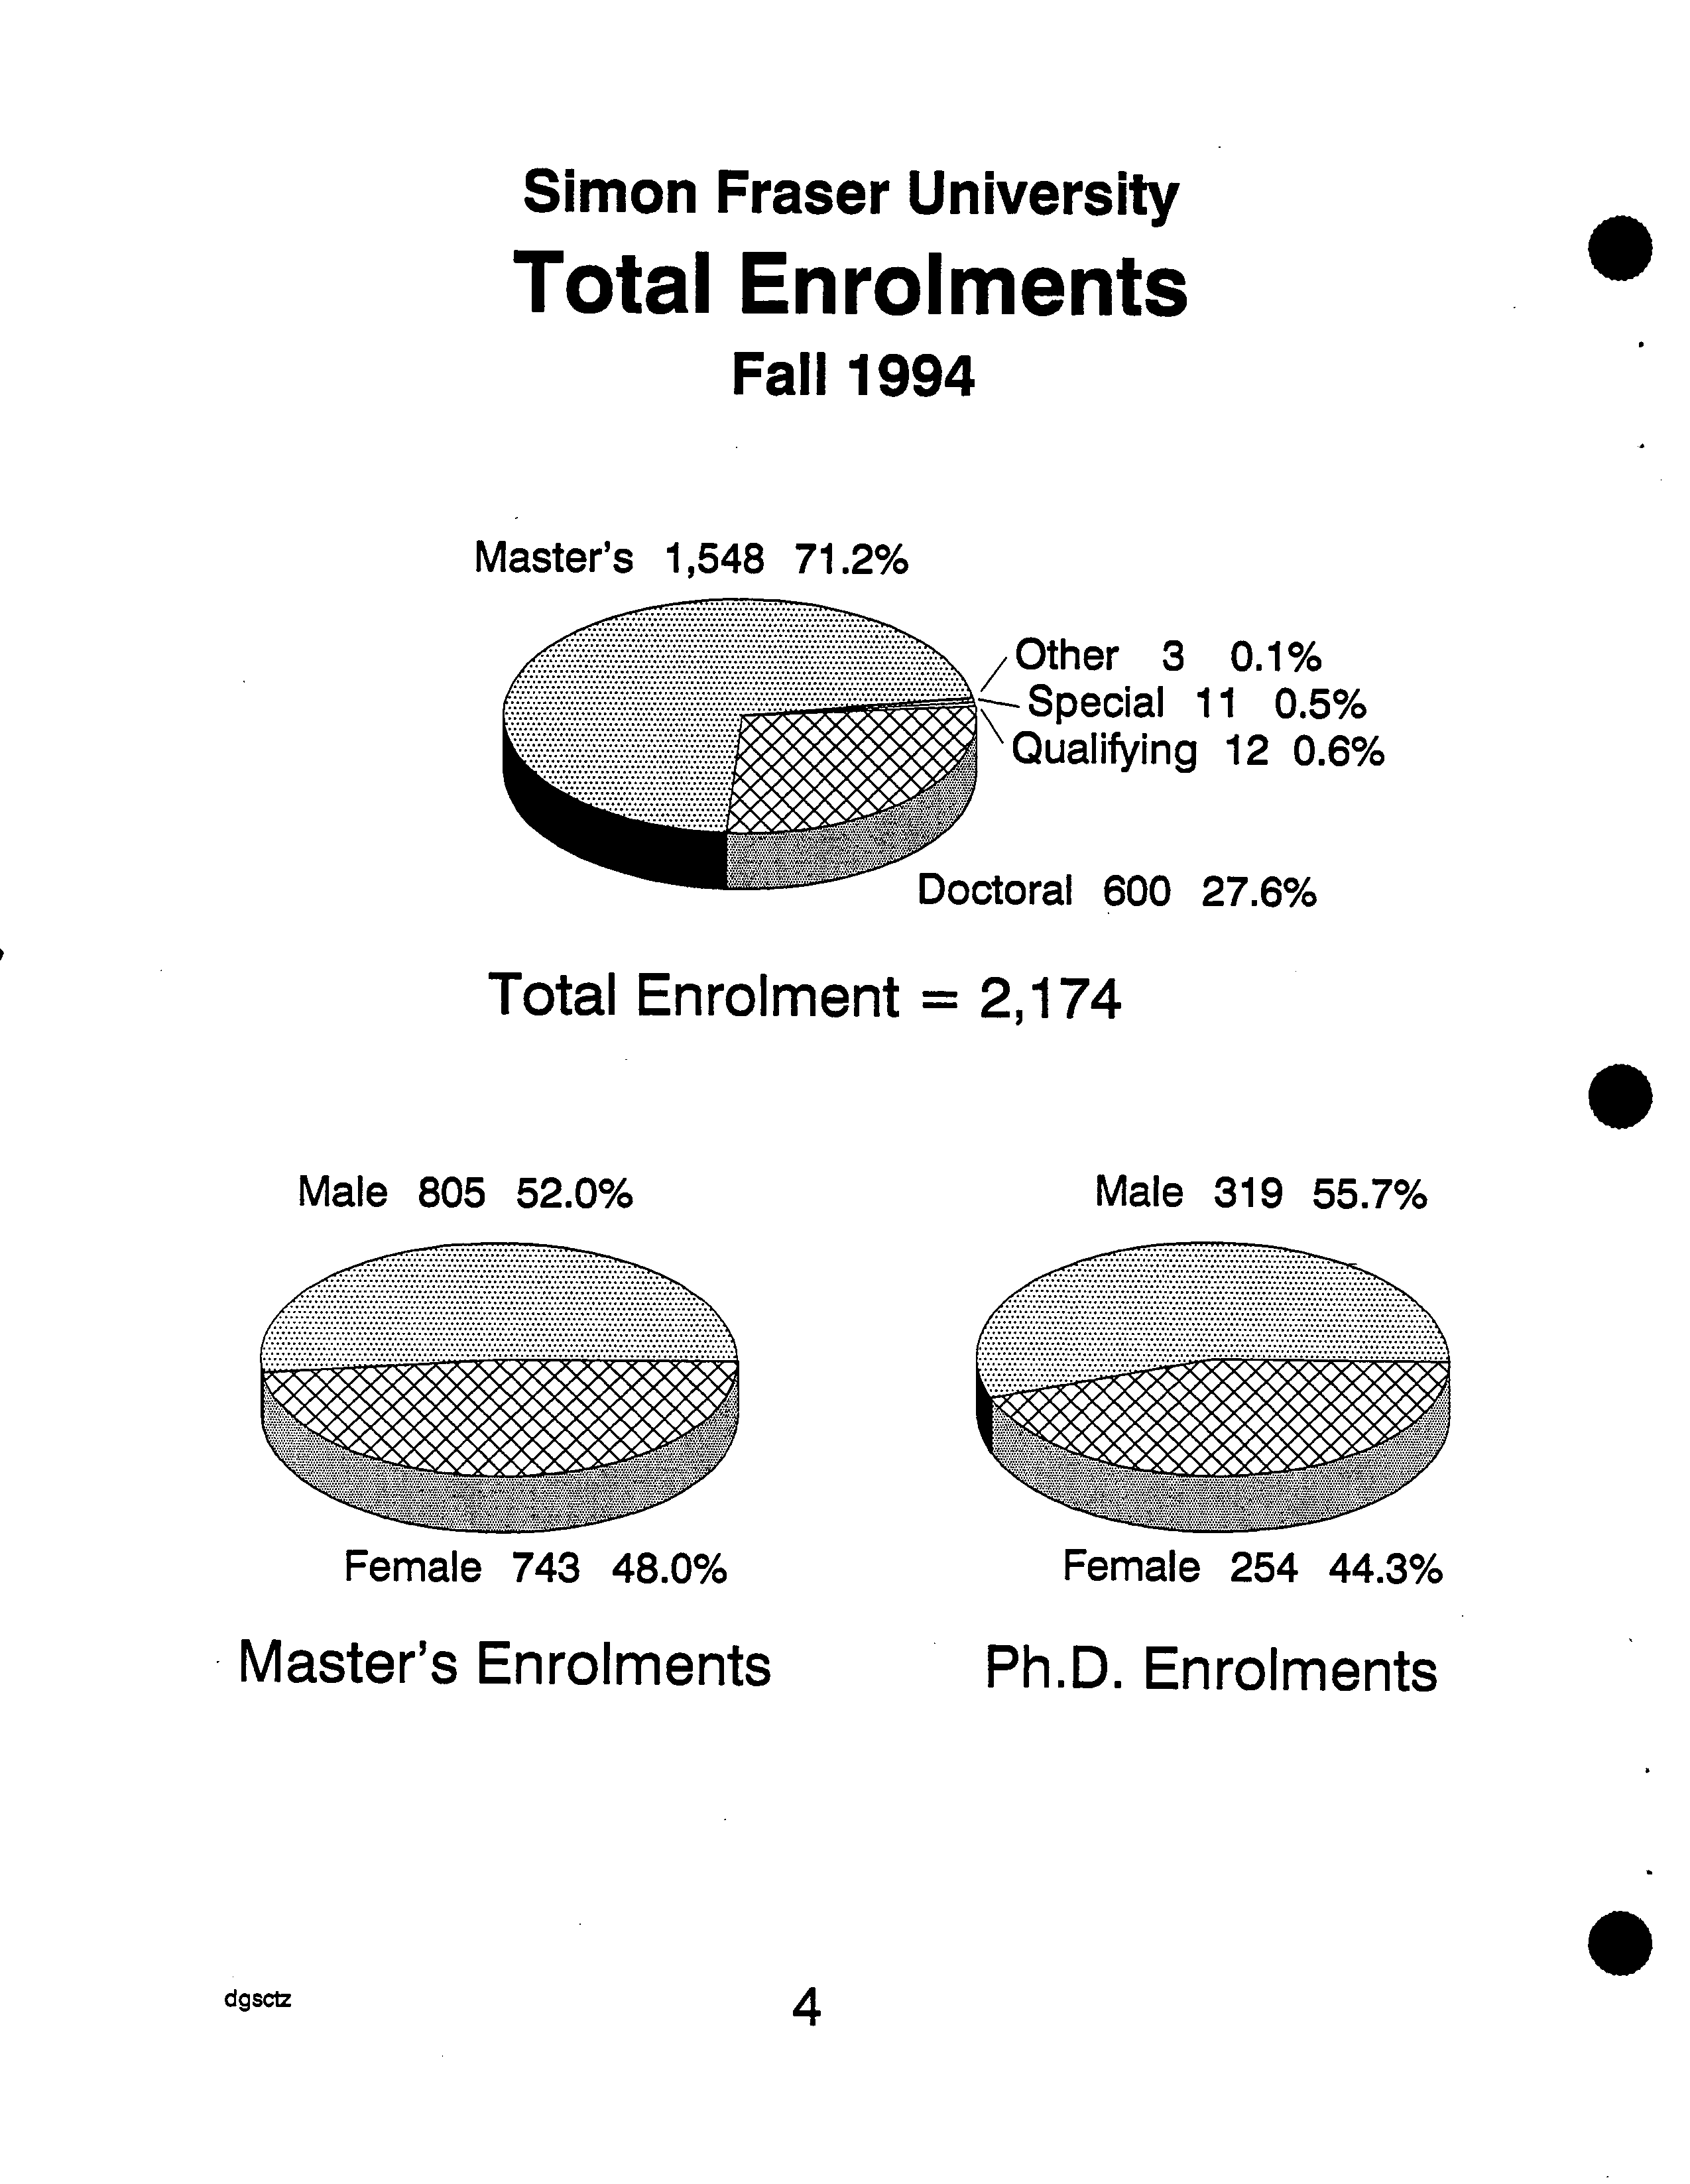
Other 3 0.1%
Special 11 0.5%
ualifying 12 0.6%
IJJdLJral 600 27.6%
Male 805 52.0%
Female 743 48.0%
Male 319 55.7%
Female 254 44.3%
Simon Fraser University
Total Enrolments
Fall 1994
Master's 1,548 71.2%
.
Total Enrolment = 21174
EI
Master's Enrolments
?
Ph.D. Enrolments
.
dgsct ?
4
33
33
33
33
34
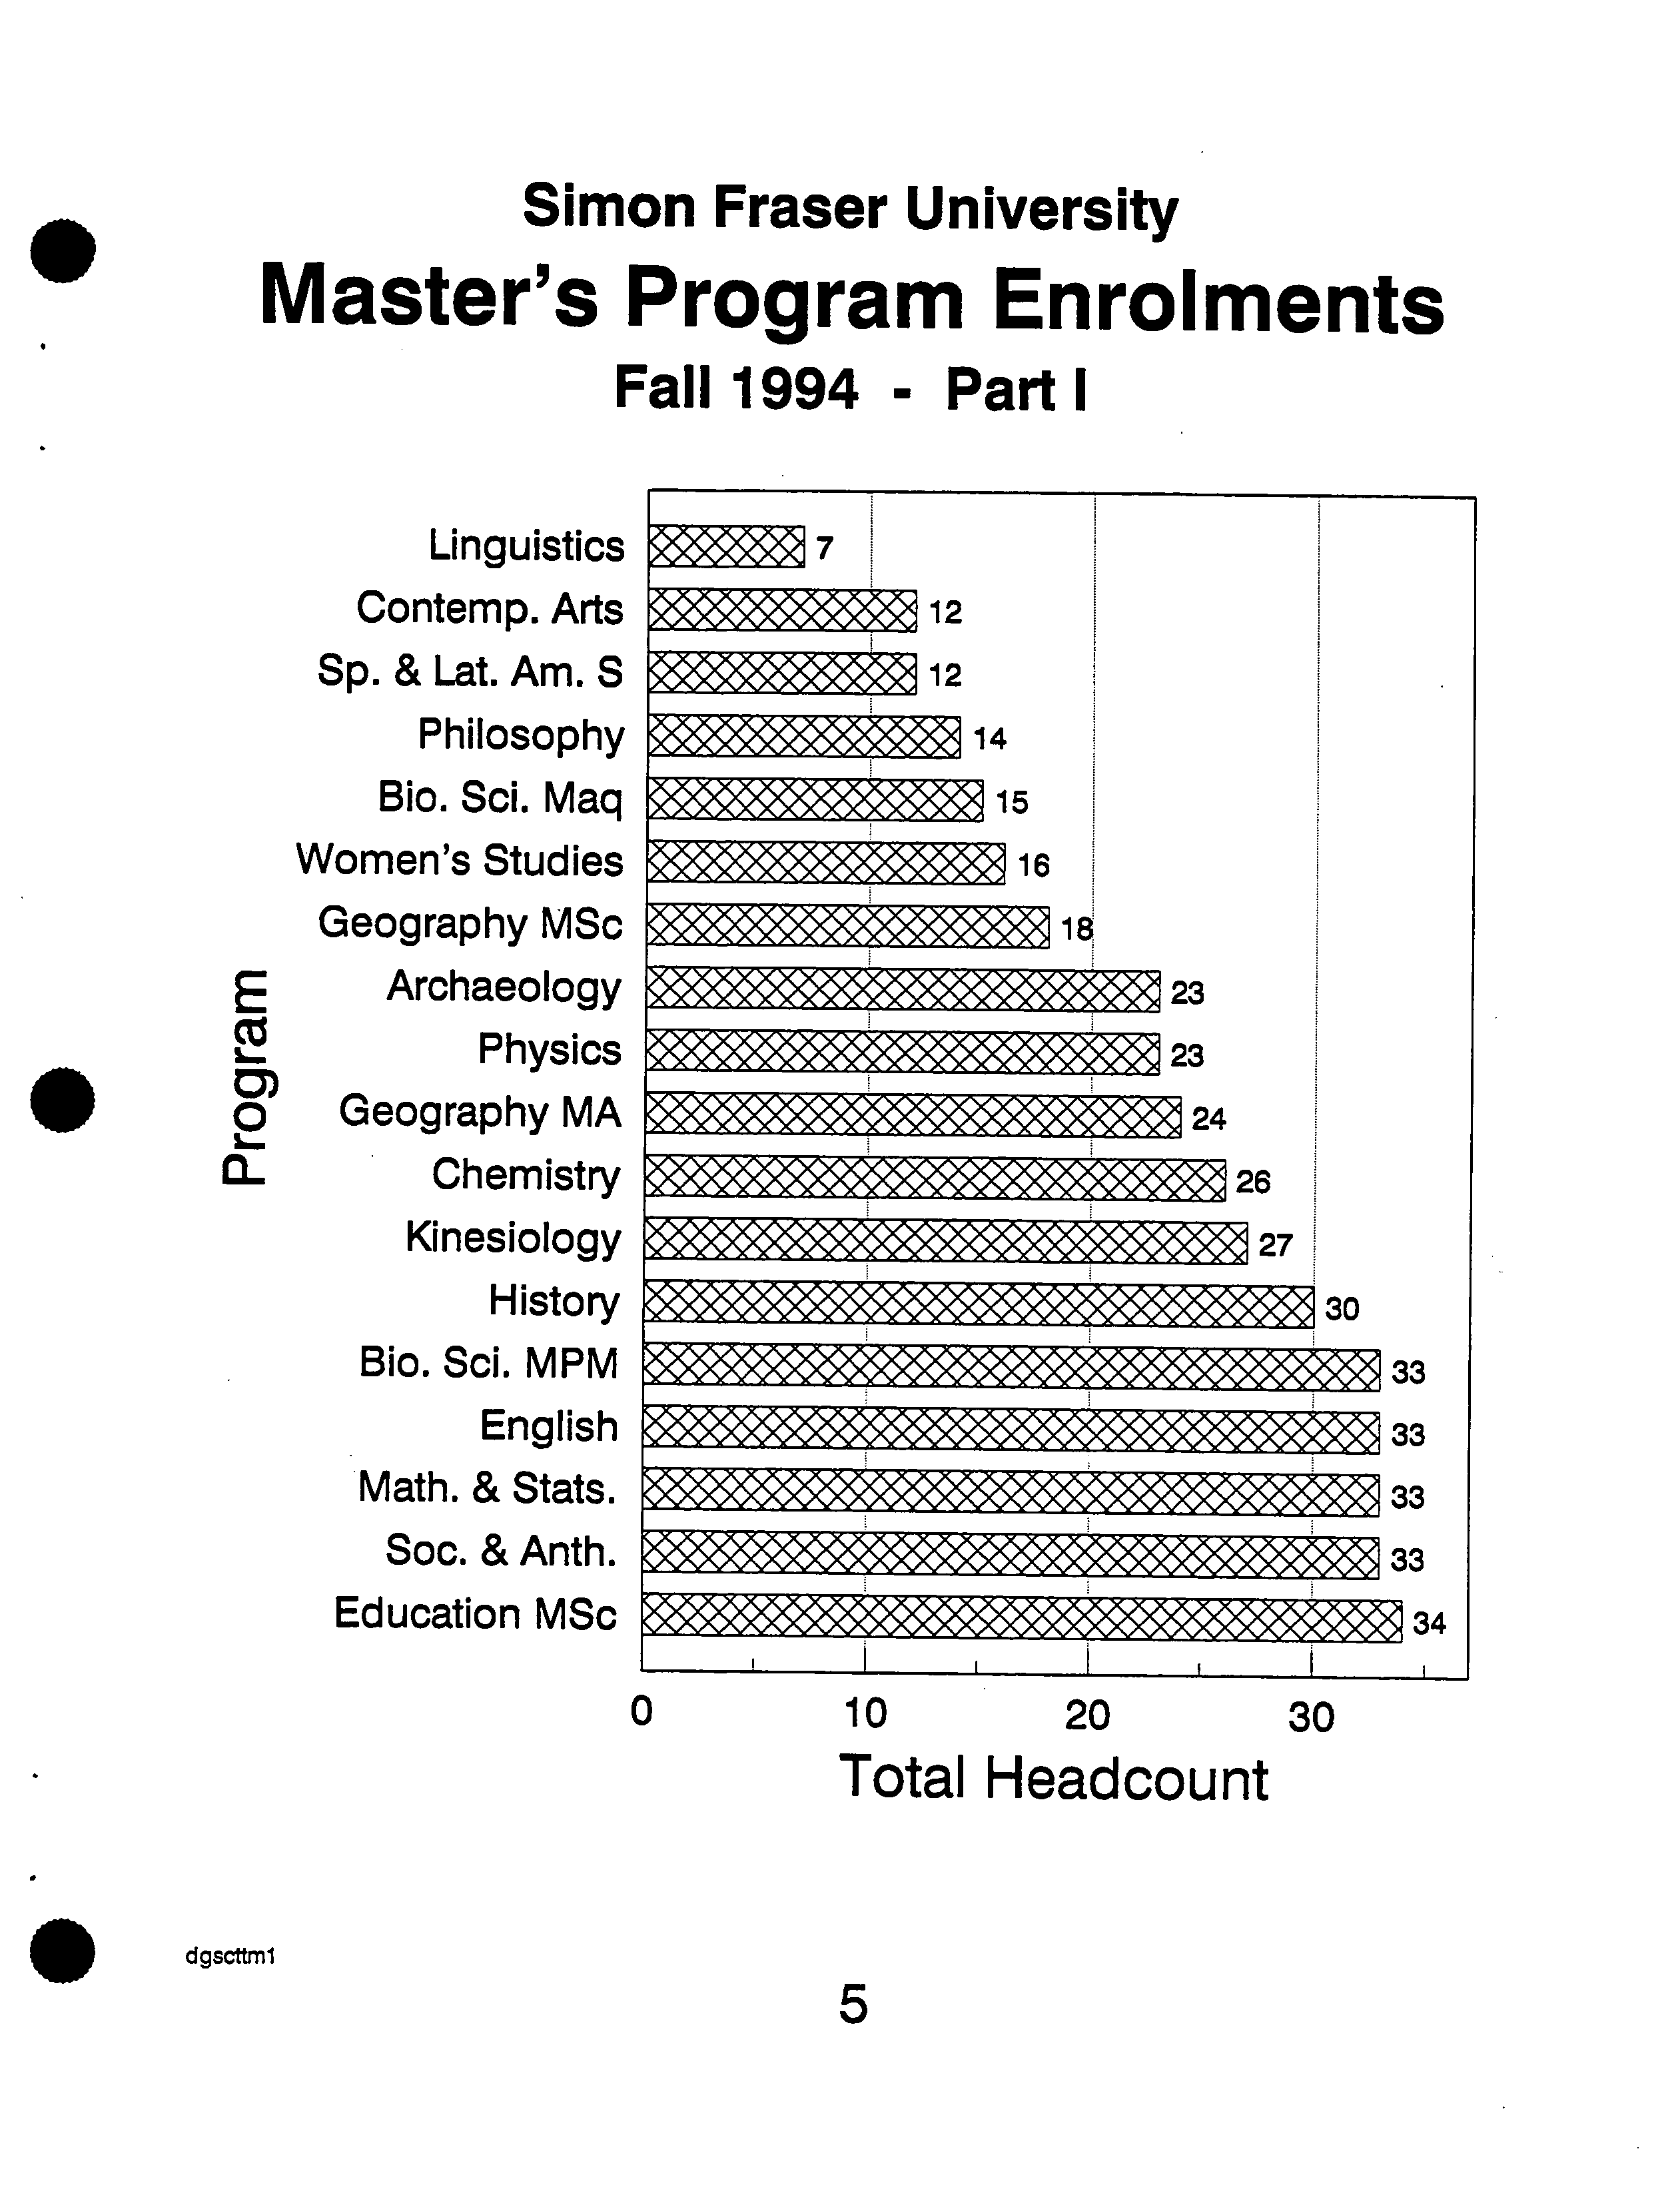
Simon Fraser University
Master's Program Enrolments
Fall 1994 - Part
CU
E
O
C)
0
2
Linguistics
Contemp. Arts
Sp. & Lat. Am. S
Philosophy
Bio. Sci. Maq
Women's Studies
Geography MSc
Archaeology
Physics
Geography MA
Chemistry
Kinesiology
History
Blo. Sd. MPM
English
Math. & Stats.
Soc. & Anth.
Education MSc
0 ?
10 ?
20 ?
30
Total Headcount
•
?
5
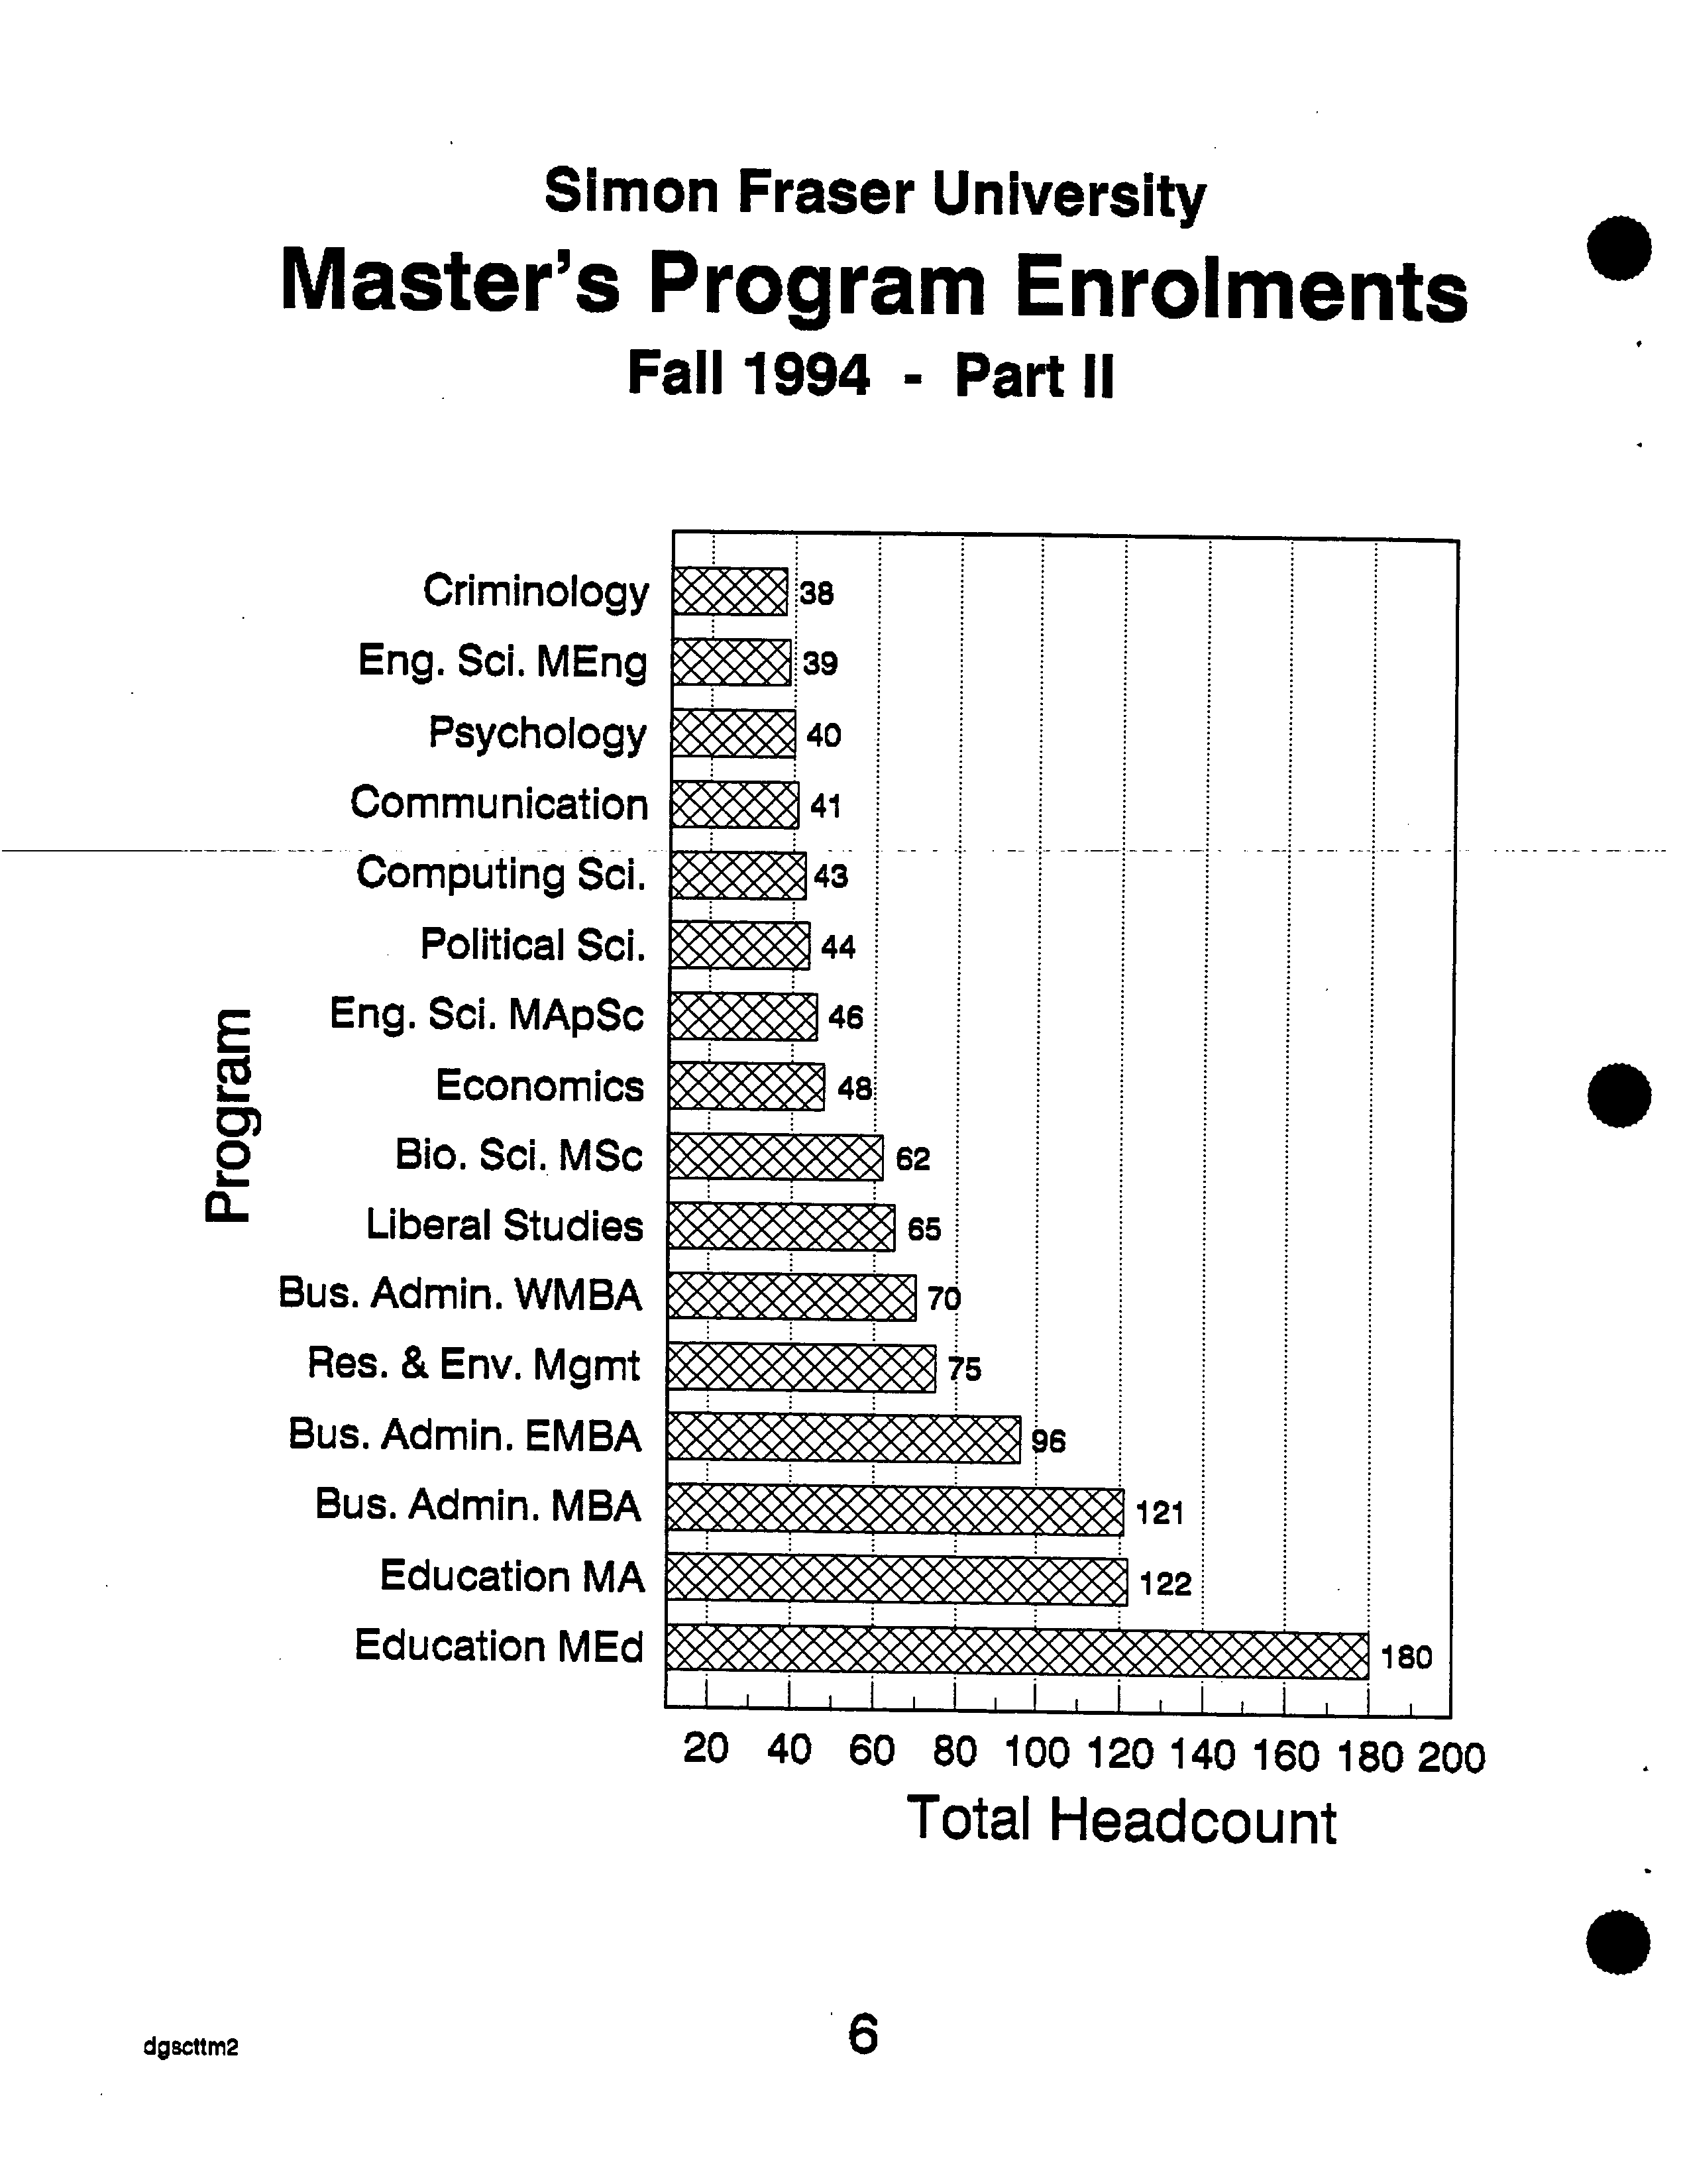
Criminology
Eng. Sol. MEng
Psychology
Communication
Computing Sol.
Political Sol.
Eng. Sci. MApSc
Economics
Blo. Sd. MSc
Liberal Studies
Bus. Admin. WMBA
Res. & Env. Mgmt
Bus. Admin. EMBA
Bus. Admin. MBA
Education MA
Education MEd
E
0,
0
2
LI
Simon Fraser University
Master's Program Enrolments
Fall 1994- Part lI
20 40 60 80 100 120 140 160 180 200
Total Headcount
dgscttm2 ?
6
Philosophy
Res. & Env. Mgmt
Soc. &Anth.
Archaeology
History
Geography
Linguistics
Criminology
Engineering Sci.
E
Kinesiology
Cz
English
CL
Q
Spi.
Math.
Arrangemnts
&Stats.
Communication
Physics
Economics
Computing Sci.
Chemistry
Education
Psychology
Biological Sci.
63
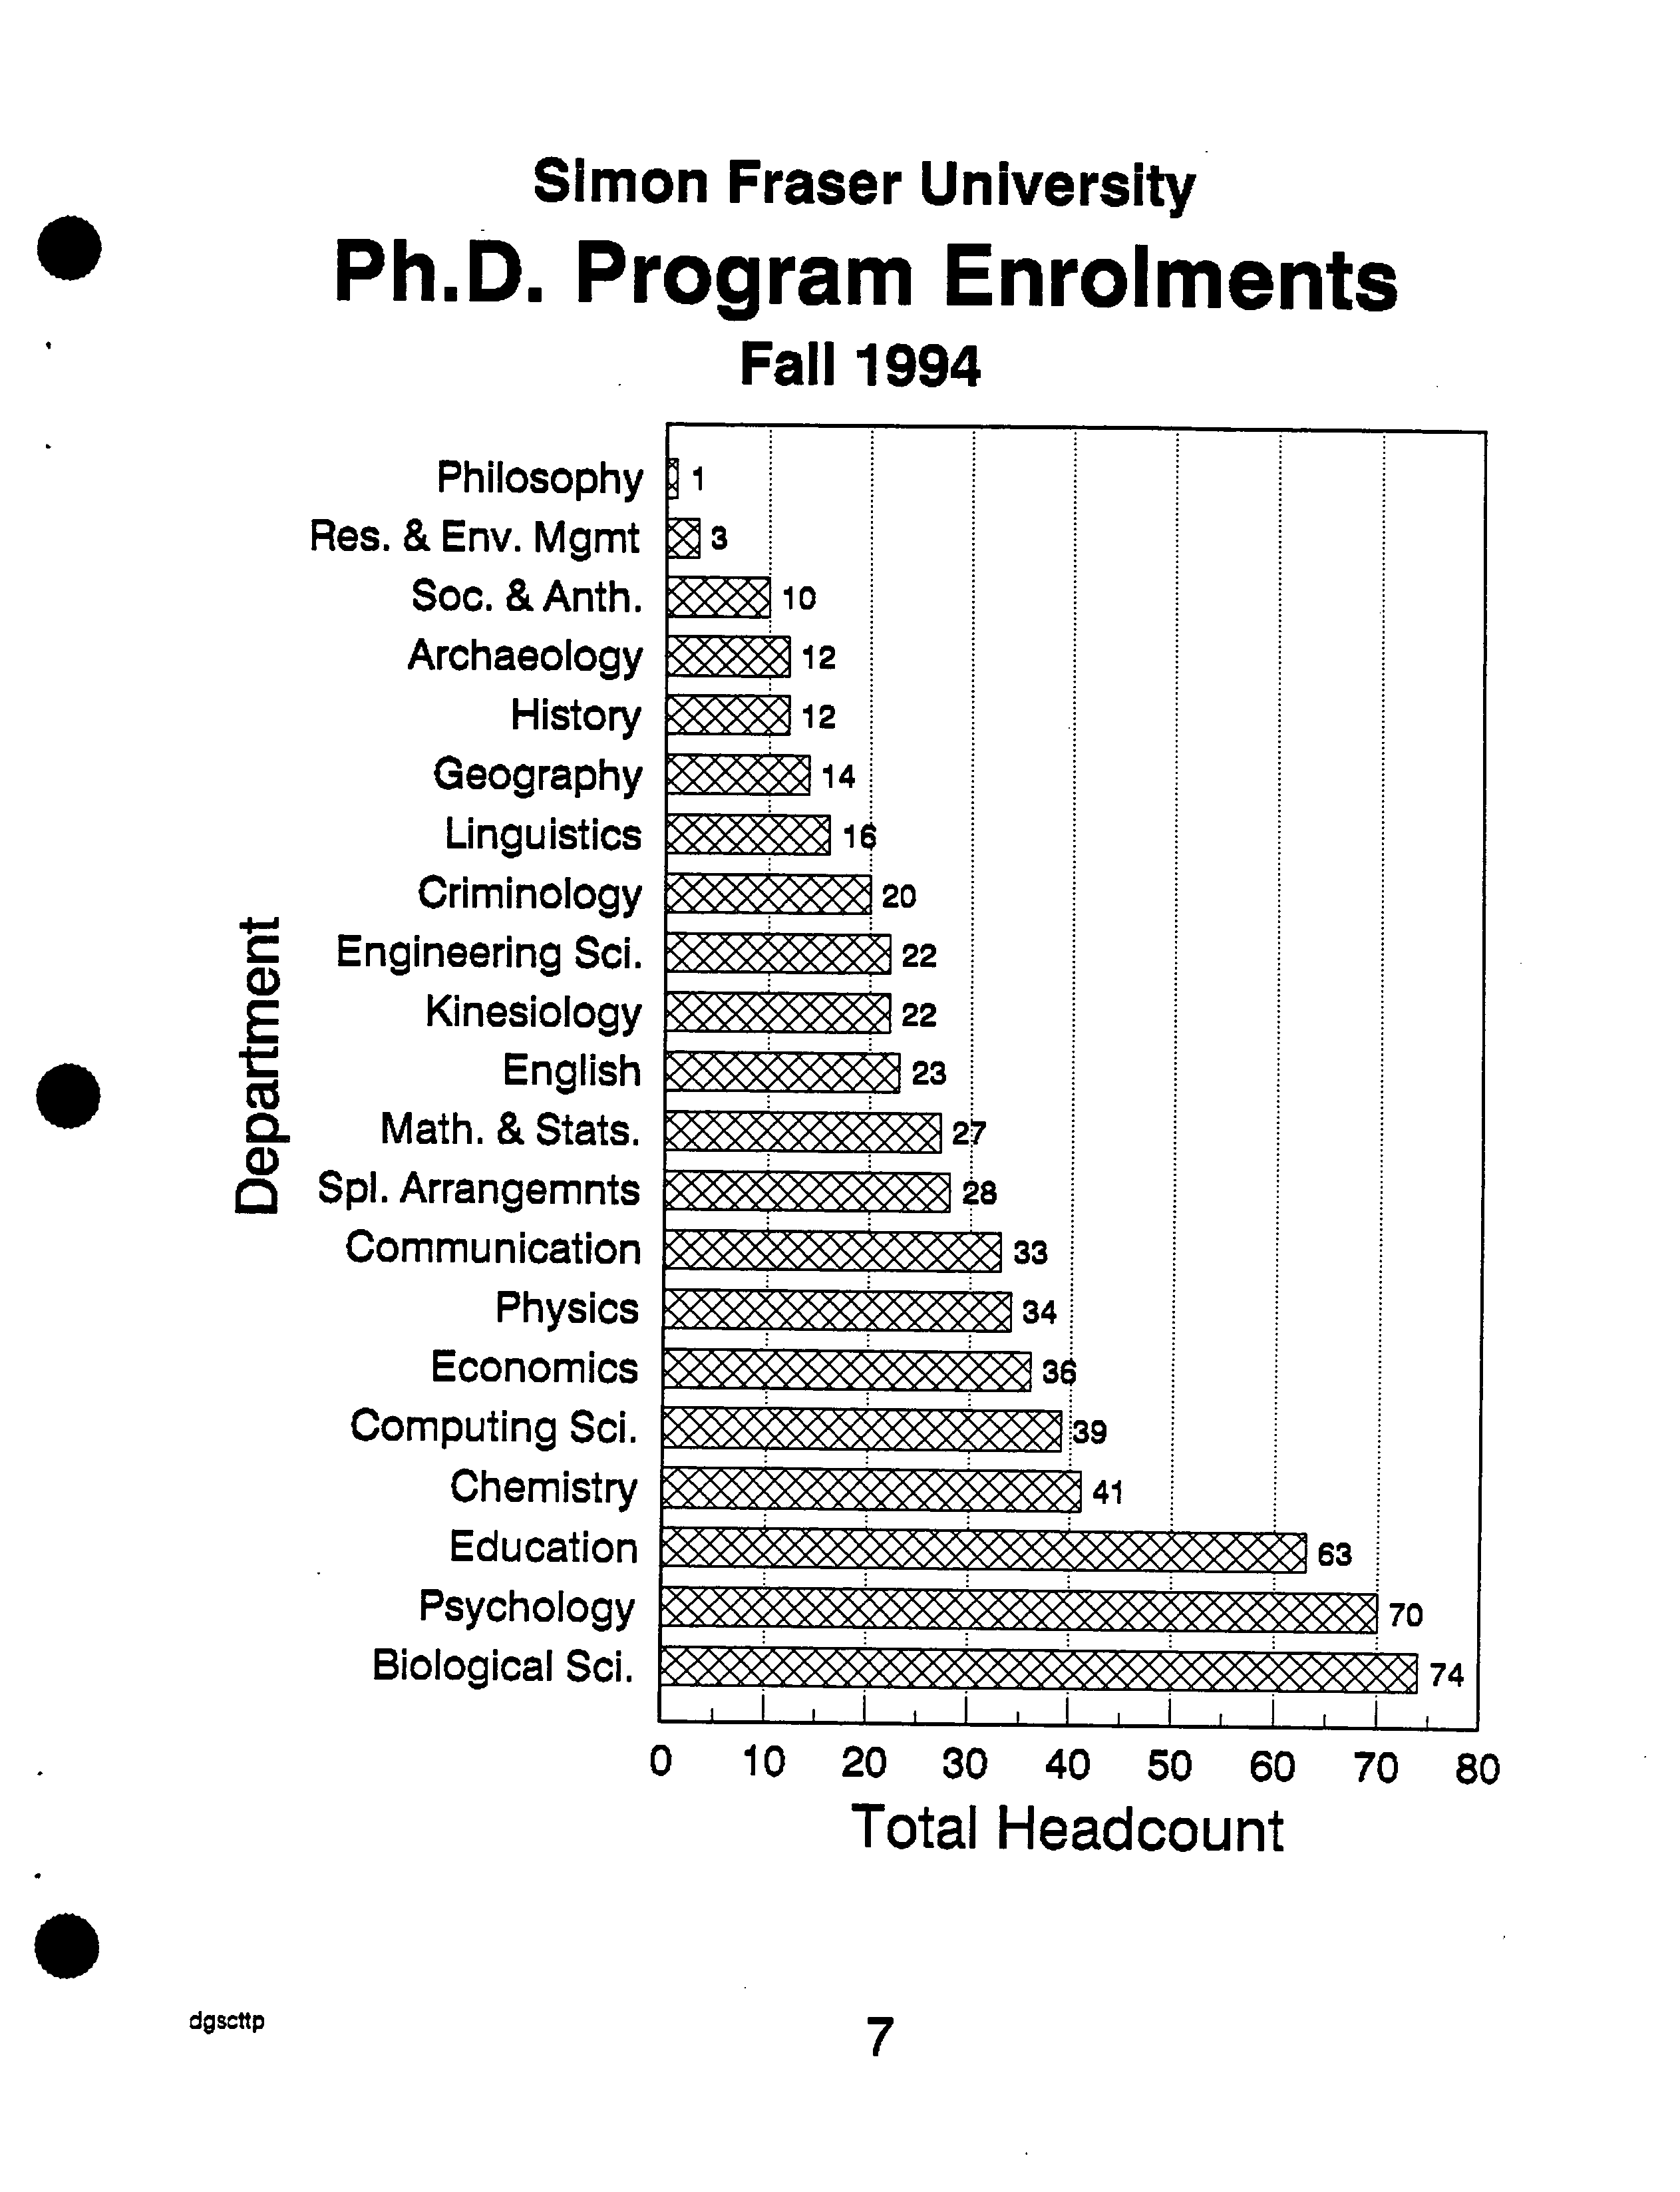
Simon Fraser University
•
Ph.D. Program Enrolments
Fall 1994
o io
20 30 40 50 60 70 80
Total Headcount
dgscttp
?
7
Male SFU
Students
Registered
in Semester
94-3
Status
Masters
PhD
Qualifying
Special
Other
FT
696
319
7
5
1
PT
80
5
1
1
0
OL
29
22
0
0
0
Totals
805
346
8
6
1
.
Total ?
1028 ?
87 ?
51 ?
1166
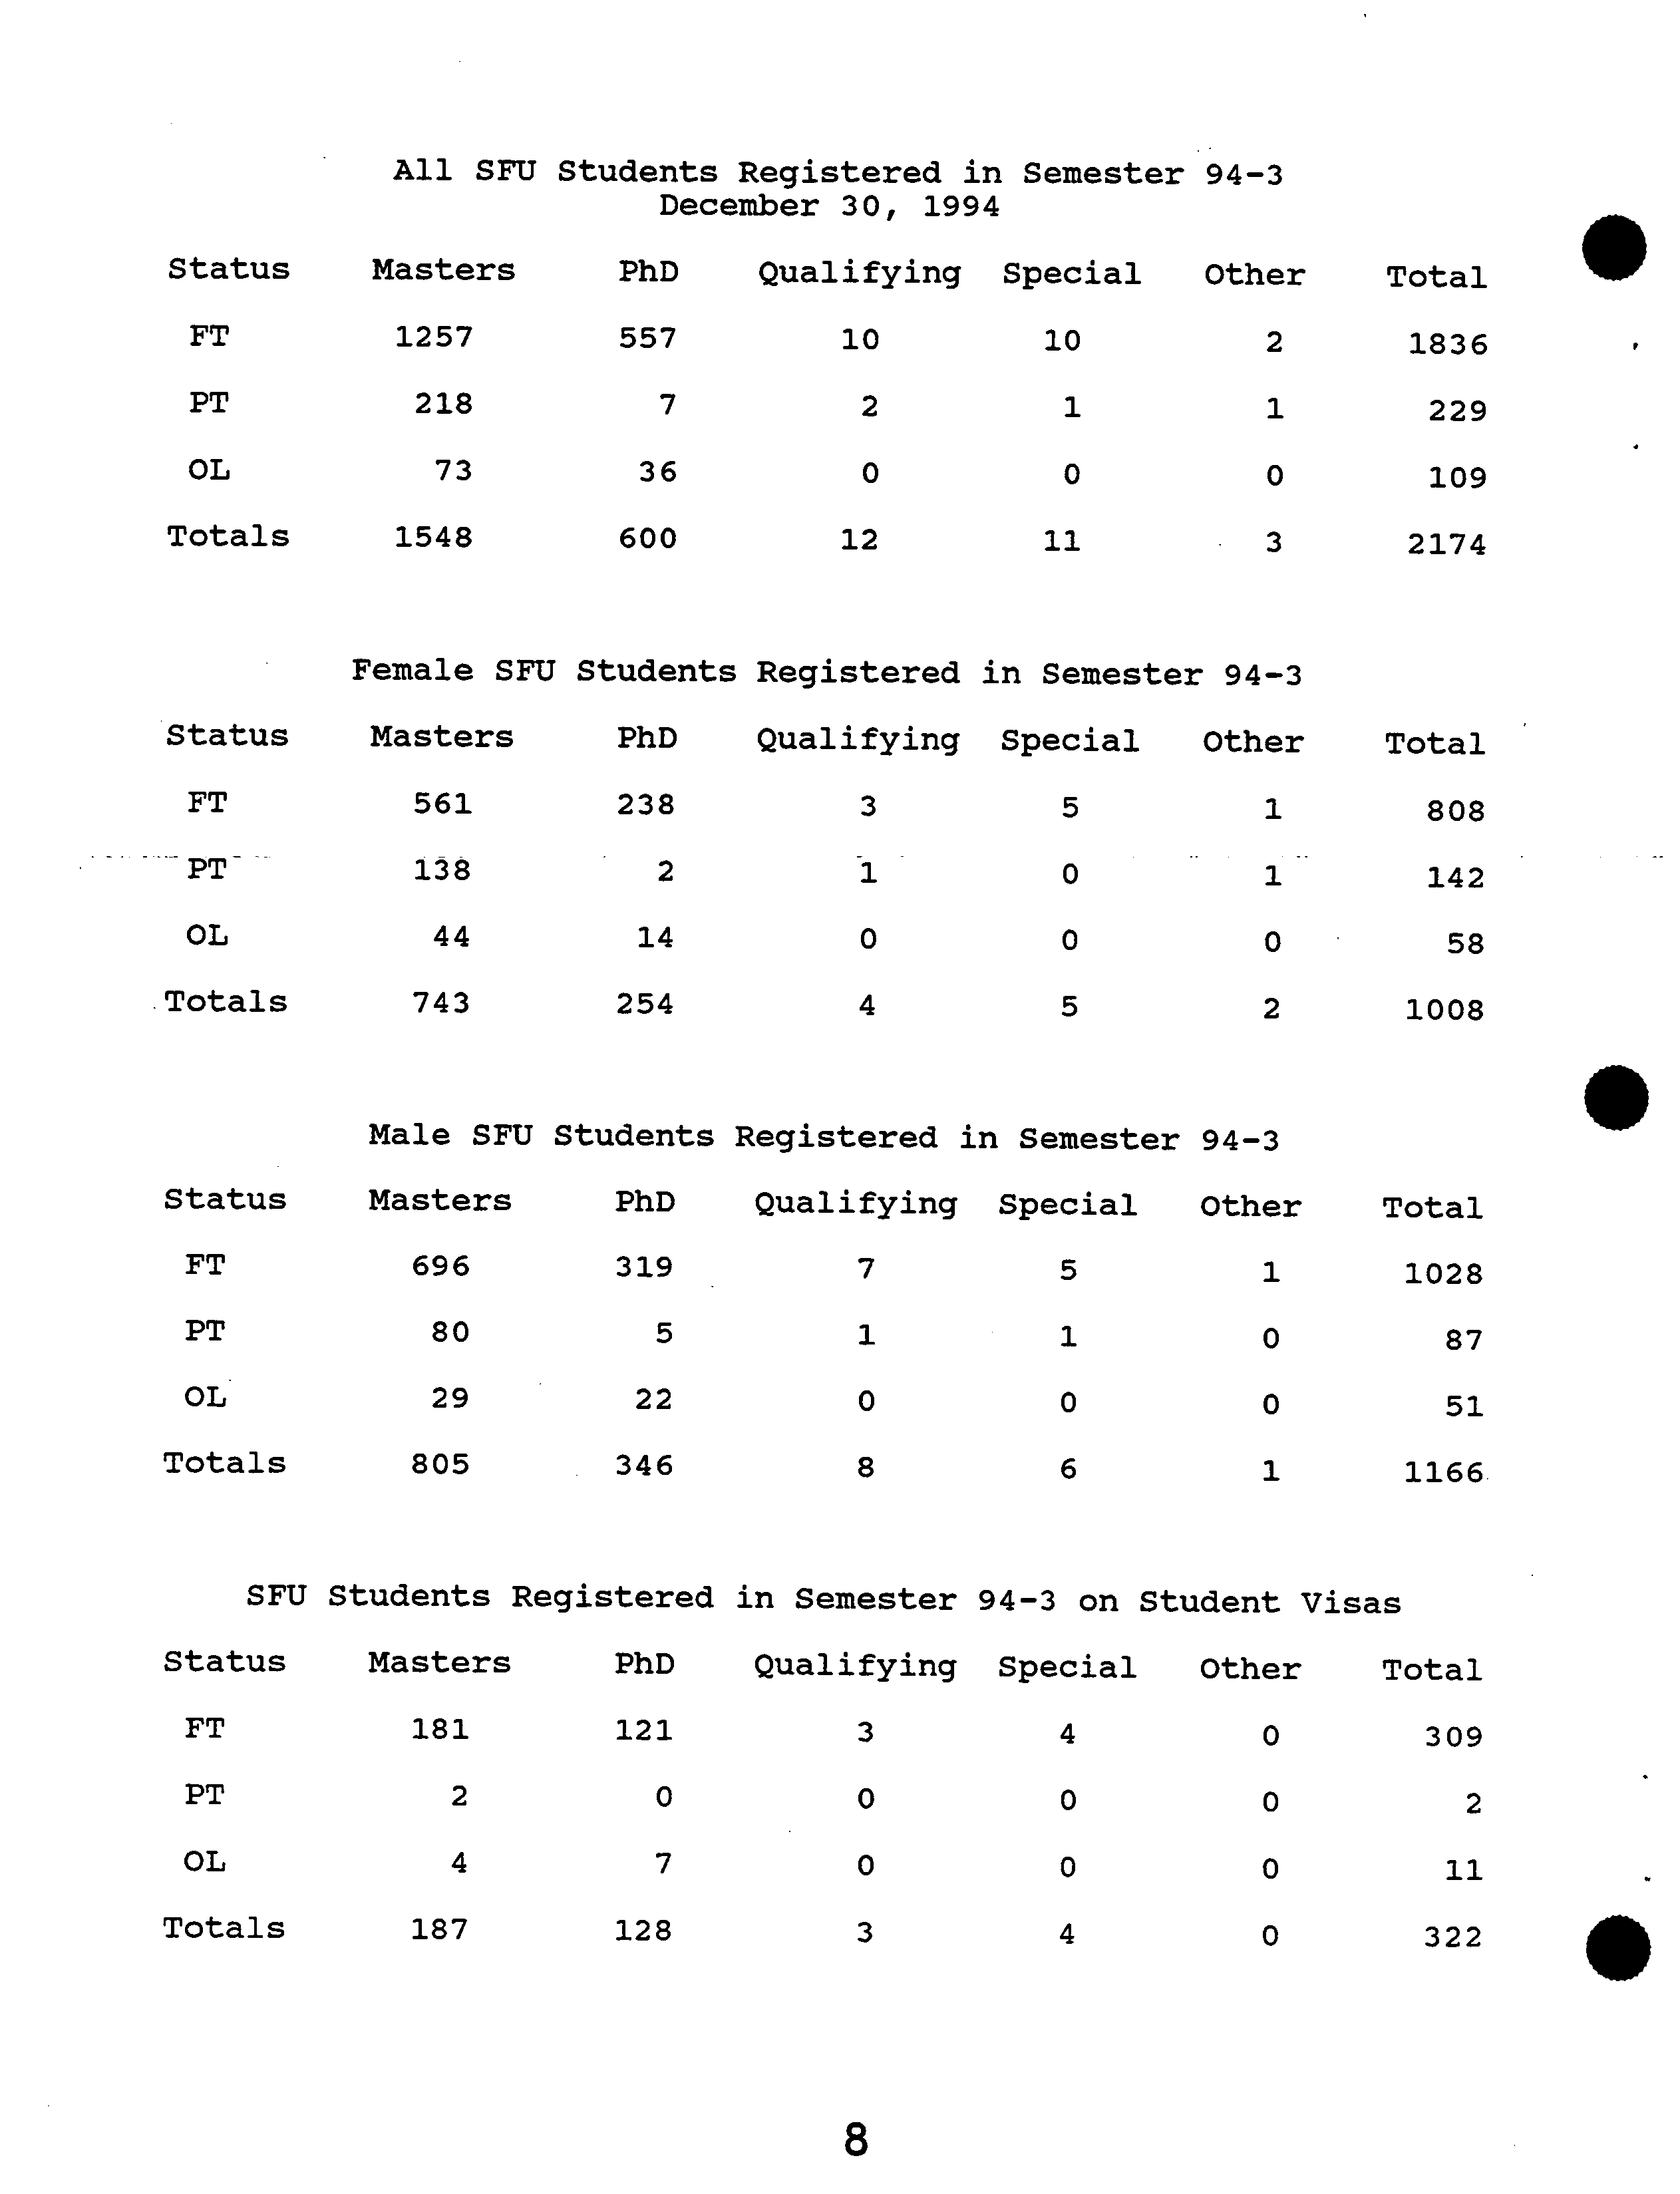
All SFTJ
Students
Registered in
Semester
94-3
December 30, 1994
Status
Masters
PhD
Qualifying
Special
Other
FT
1257
557
10
10
2
PT
218
7
2
1
1
CL
73
36
0
0
0
Totals
1548
600
12
11
3
Total
1836
229
109
2174
Female SFU Students Registered in Semester 94-3
Status
Masters
PhD
Qualifying
Special
Other
FT
561
238
3
5
1
PT
138
2
1
0
1
CL
44
14
0
0
0
Totals
743
254
4
5
2
Total ?
808 ?
142 ?
58
?
1008
SFU Students Registered in Semester 94-3 on Student Visas
Status
Masters
PhD
Qualifying
Special
Other
Total
FT
181
121
3
4
0
309
PT
2
0
0
0
0
2
CL
4
7
0
0
0
11
Totals
187
128
3
4
0
322
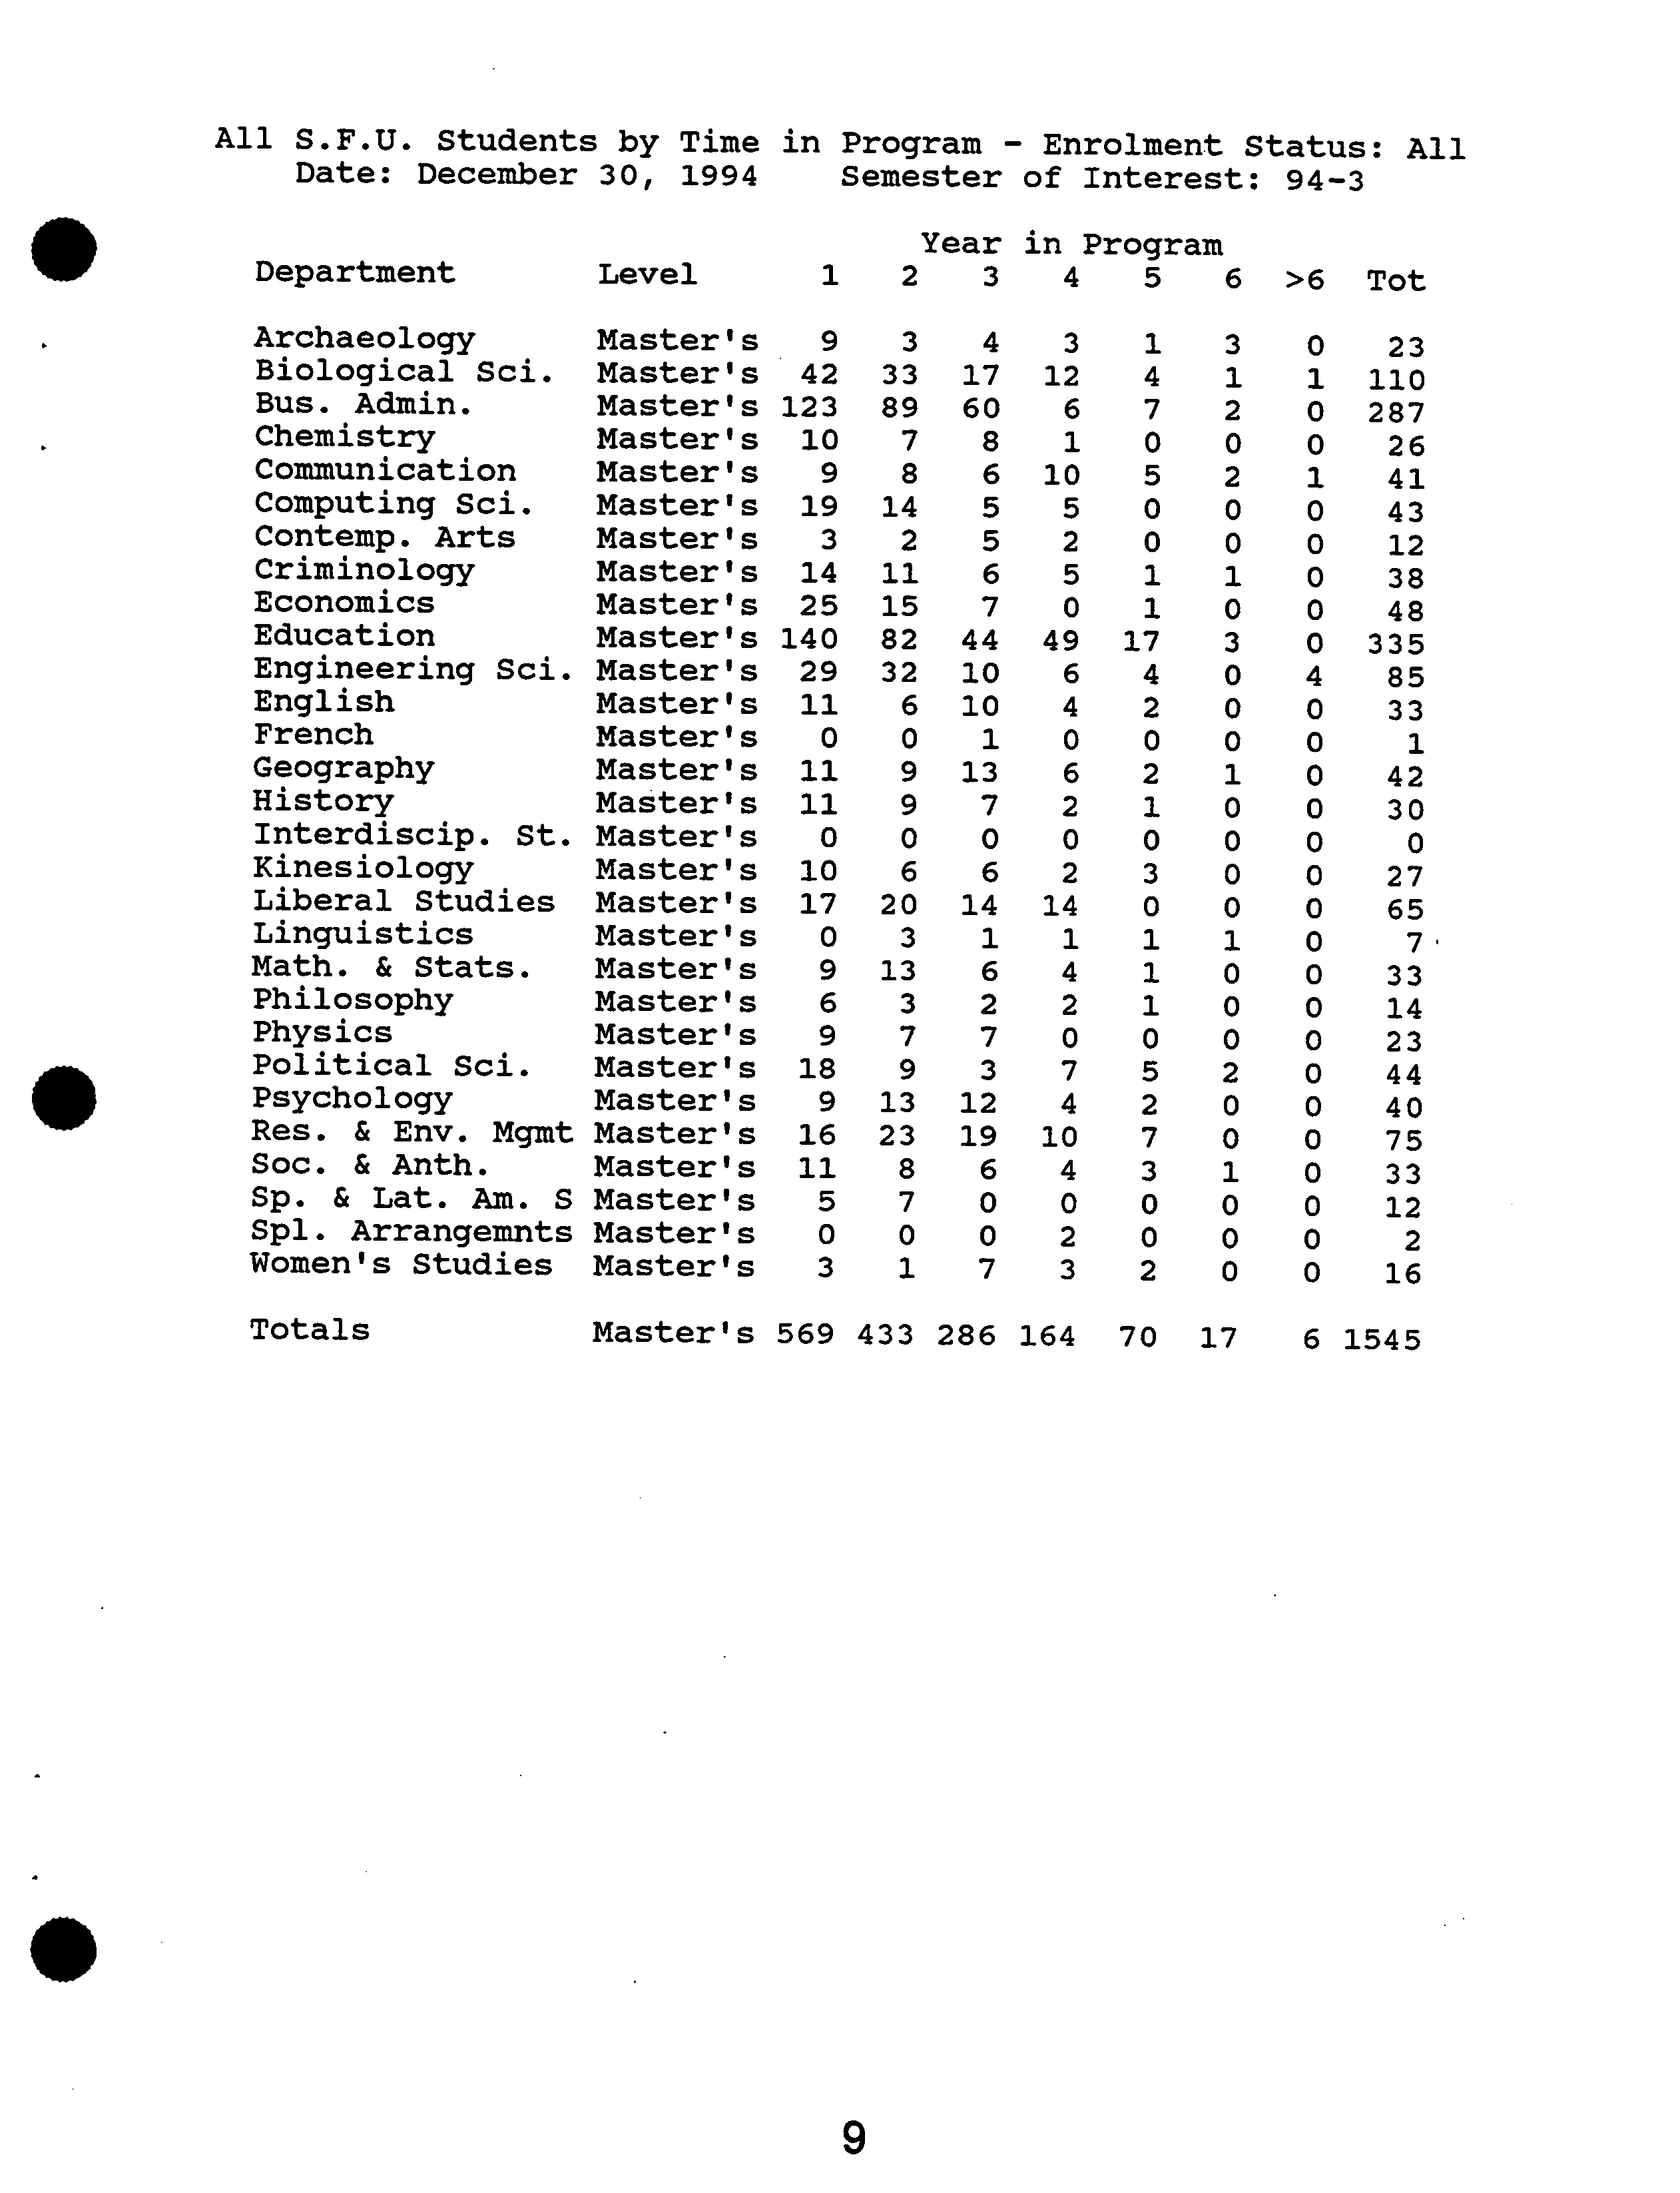
All S.F.U. Students by Time
in
Program
- Enrolment Status: All
Date: December
30,
?
1994
Semester
of
Interest:
94-3
.
Year
in
Program
Department
Level
1
2
3
4
5
6
>6
Tot
Math.
HistoryPhysicsGeographyArchaeologyLinguisticsPhilosophyKinesiologyLiberal
EducationEnglishEconomicsEngineering
FrenchInterdiscip.
ChemistryCriminologyCommunicationComputing
Contemp.
Biological
Bus. Admin.&
Stats.StudiesArtsSci.Sci.Sci.St.
Master'sMaster'sMaster'sMaster'sMaster'sMaster'sMaster'sMaster'sMaster'sMaster'sMaster'sMaster'sMaster'sMaster'sMaster'sMaster'sMaster'sMaster'sMaster'sMaster'sMaster'sMaster's
1401232529
1710
11111142
191410
99
600909
3
20
13
82158932331114
7
33
2969
0
0678
3
13
44
1410
106017
2
77067
6
15
8
51
4
6
6
4914
12
10
4
22024
1
0
2
55660016
3
17
2
4
0
1100
2
1
1
3
0
5110
4
7001
0000011010
00002
2
0
3
0
1
03
0
0
040000000
0
0010000100
287
335
110
23
33
42
14
27
85
30
41
65
43
48
33
26
23
38
12
7
0
1
•
Political Sci.
Psychology
Master's
Master's
18
9
9
13
3
12
7
4
5
2
2
0
0
0
44
40
Women's
Sp.
Spi.
Res.
Soc.
&
&
Arrangemnts&
Lat.
Anth.
Env.
StudiesAm.
MgmtS
Master'sMaster'sMaster'sMaster'sMaster's
1116
5
30
23
1
870
19
7
0
06
10
3
4
2
0
2
00
3
7
00
0
10
00
000
16
33
75
12
2
Totals
Master's
569
433
286
164
70
17
6
1545
0
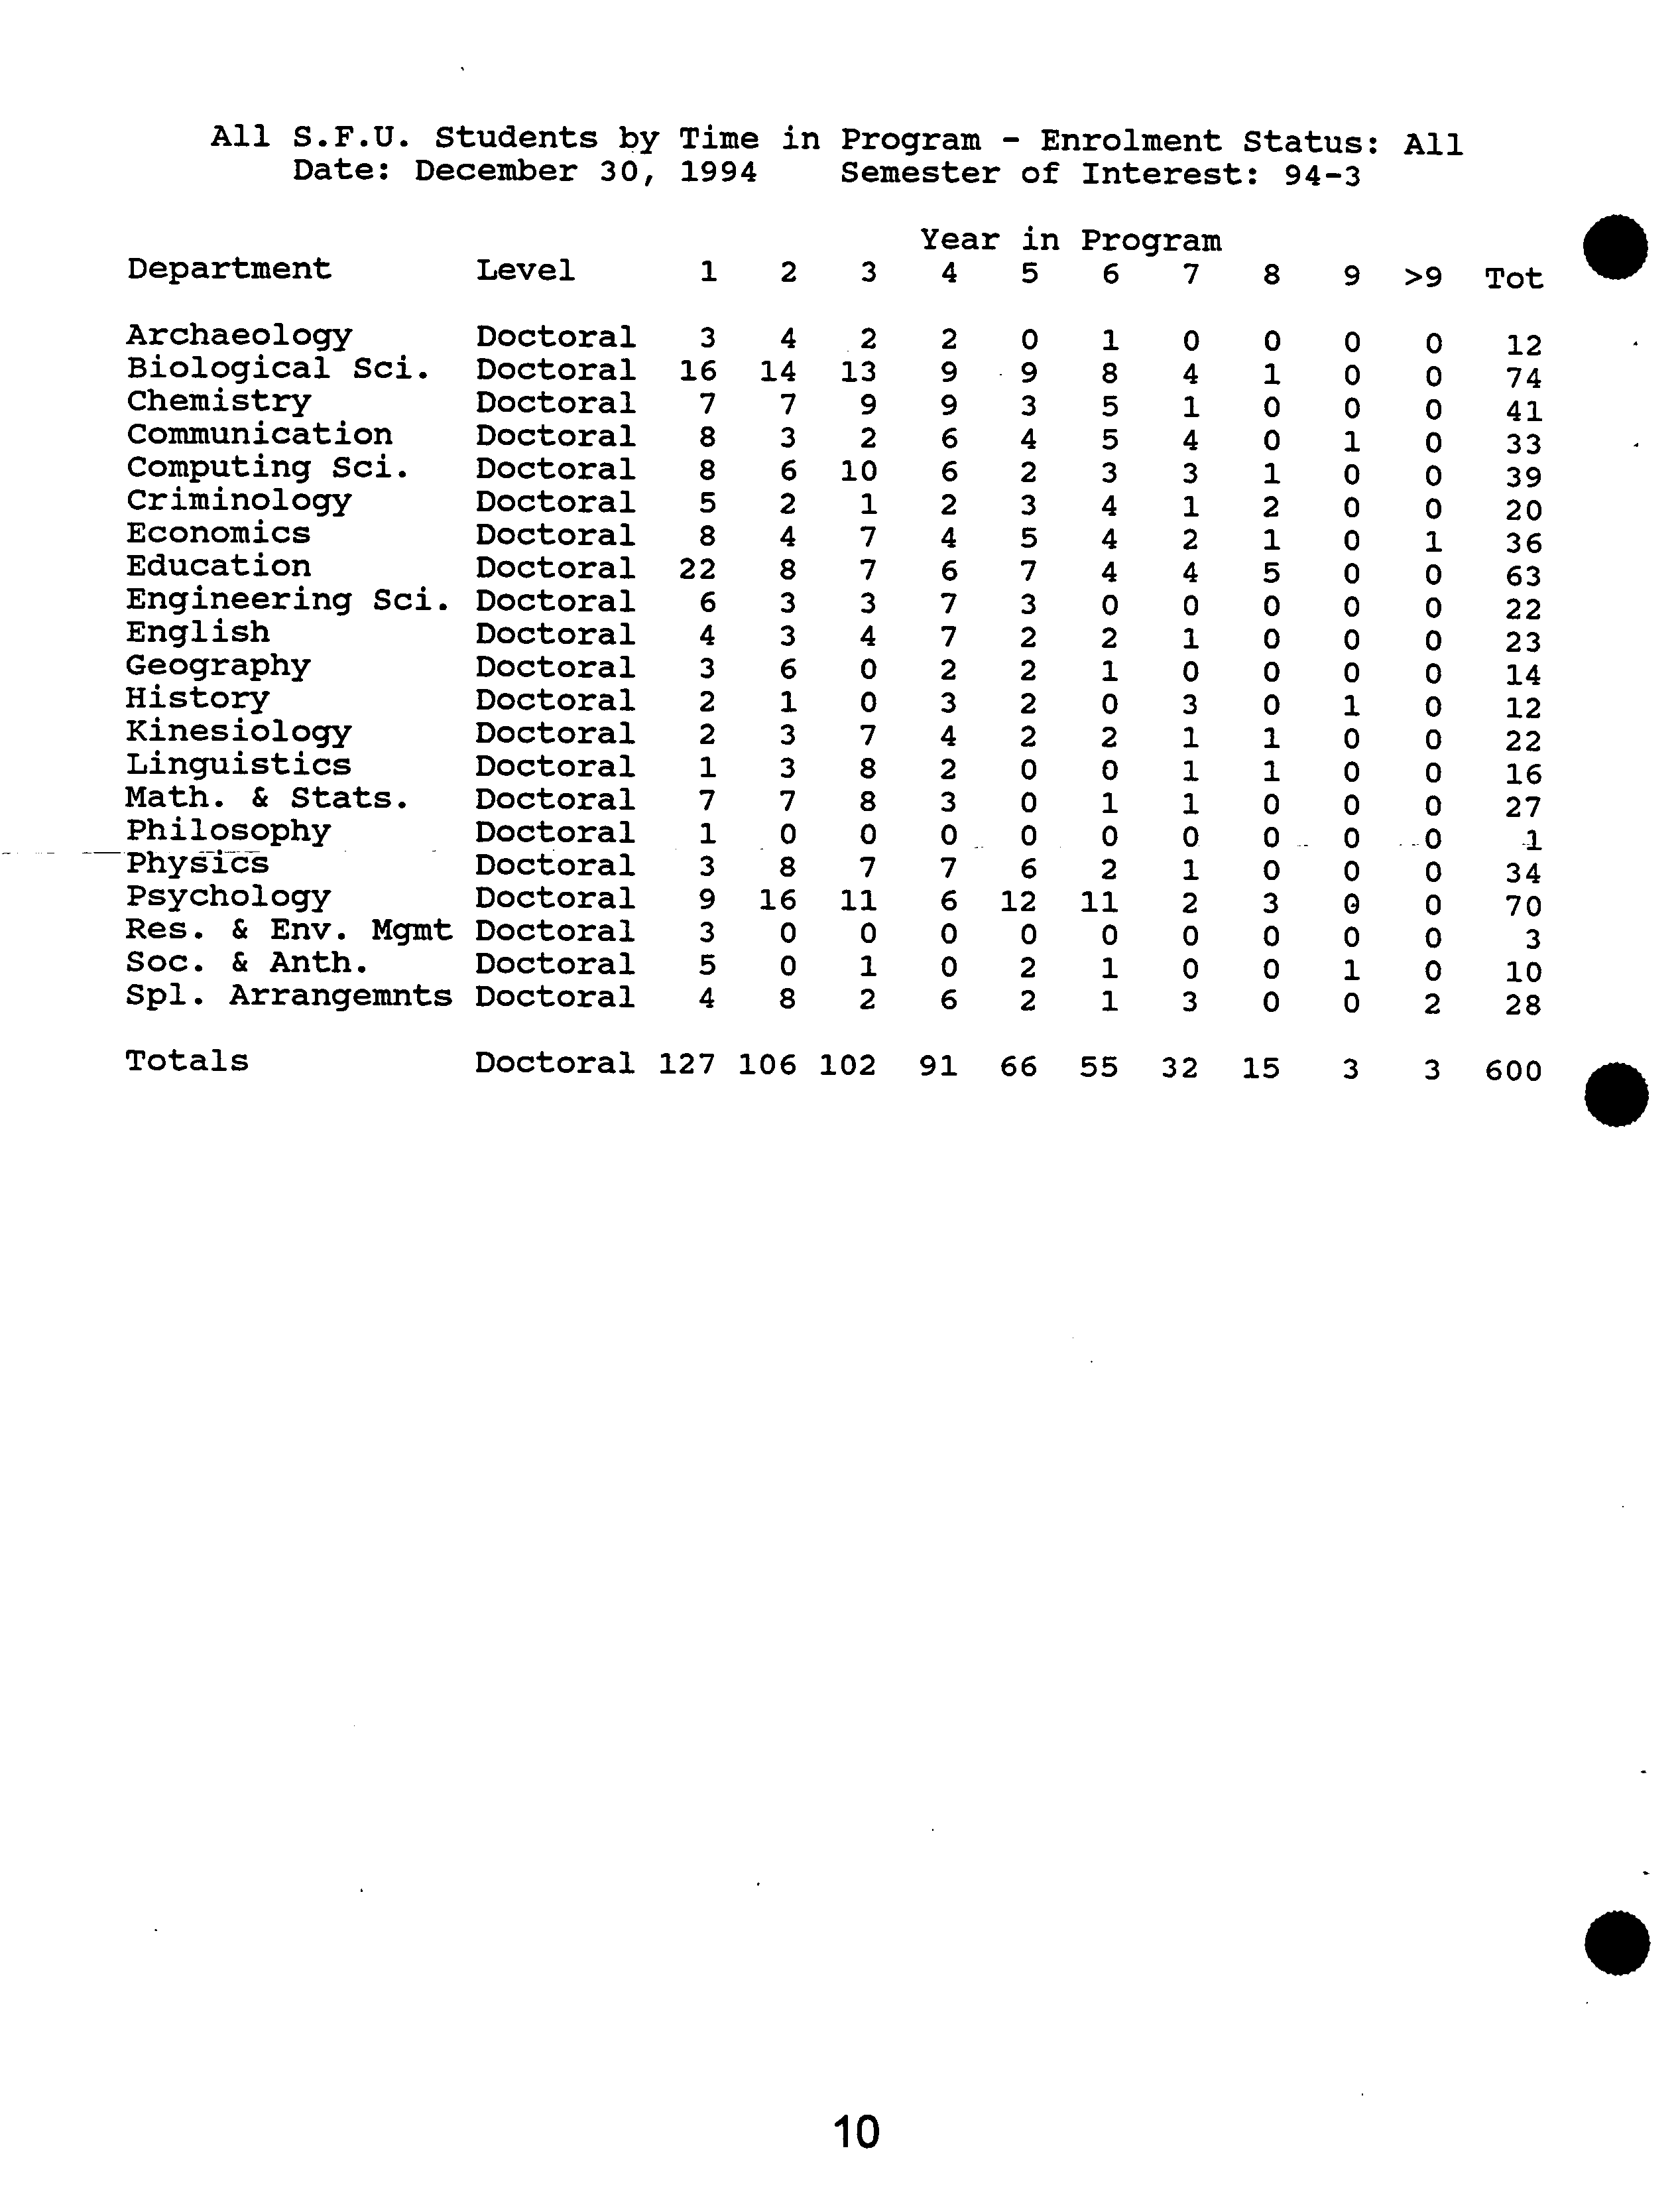
All S.F.U.
Date: December
Students
30,
by
1994Time
?
in Program
Semester
-
of
Enrolment
Interest:
Status:
94-3
All
?
Year
in
Program
Department
Level
1
2 3
4
5
6 7
8
9
>9
Tot
Math.
Archaeology
Res
HistoryKinesiologyEducation
Soc.
GeographyEngineering
English
Spl.
EconomicsPhilosophyLinguisticsPhysicsPsychologyChemistryBiological
Computing
CommunicationCriminology
•
Arrangeinnts
&Anth.
&
&
Env.
Stats.Sci.Sci.Sci.
Mgmt
DoctoralDoctoralDoctoralDoctoralDoctoralDoctoralDoctoralDoctoralDoctoralDoctoralDoctoralDoctoralDoctoralDoctoralDoctoralDoctoralDoctoralDoctoralDoctoralDoctoralDoctoral
2216
4
5
9788
33
5
28
7
24
11
6
33
1614
8
88
2
4
703
1
3
7
3
46
0
3
0
3
6
11
13
10
2
77748078
1
2
00
3
90
1
2
2
7470
296406092
3
736662
12
2224
5
2
227
26
9
0300033
0
11
2422
441
3
8
00115
0
50011
2
0114
3
1
3
11
2
04004
3
0
0
1
1
00
5
00
23
0
010
11
00
0
0
1
010
0
1
0000000
11
0000
0
00000
2000000001000000
0
0000
28
27
70
23
22
20
22
33
41
63
12
74
34
10
36
39
14
16
12
1
3
Totals
Doctoral
127
106
102
91
66
55
32
15
3
3
600
10
Simon Fraser University
Grades of All Students
Fall 1994
Philosophy
Business Admin.
Economics
Political Sci.
Chemistry
Kinesiology
Physics
Eng. Science
Bio. Sciences
History
E
Res. & Env. Mgmt.
Geography
cz
Liberal Studies
.
Comp. Science
Women's Studies
Communication
Education
English
Math. & Stats.
Spi Arr.
Soc. & Anth.
Psychology
Criminology
Linguistics
Archaeology
3.30 3.40 3.50 3.60 3.70 3.80 3.90 4.00
-
?
Grades
• ?
University Average: 3.67 Median: 3.75
..
DGSGRD ?
11
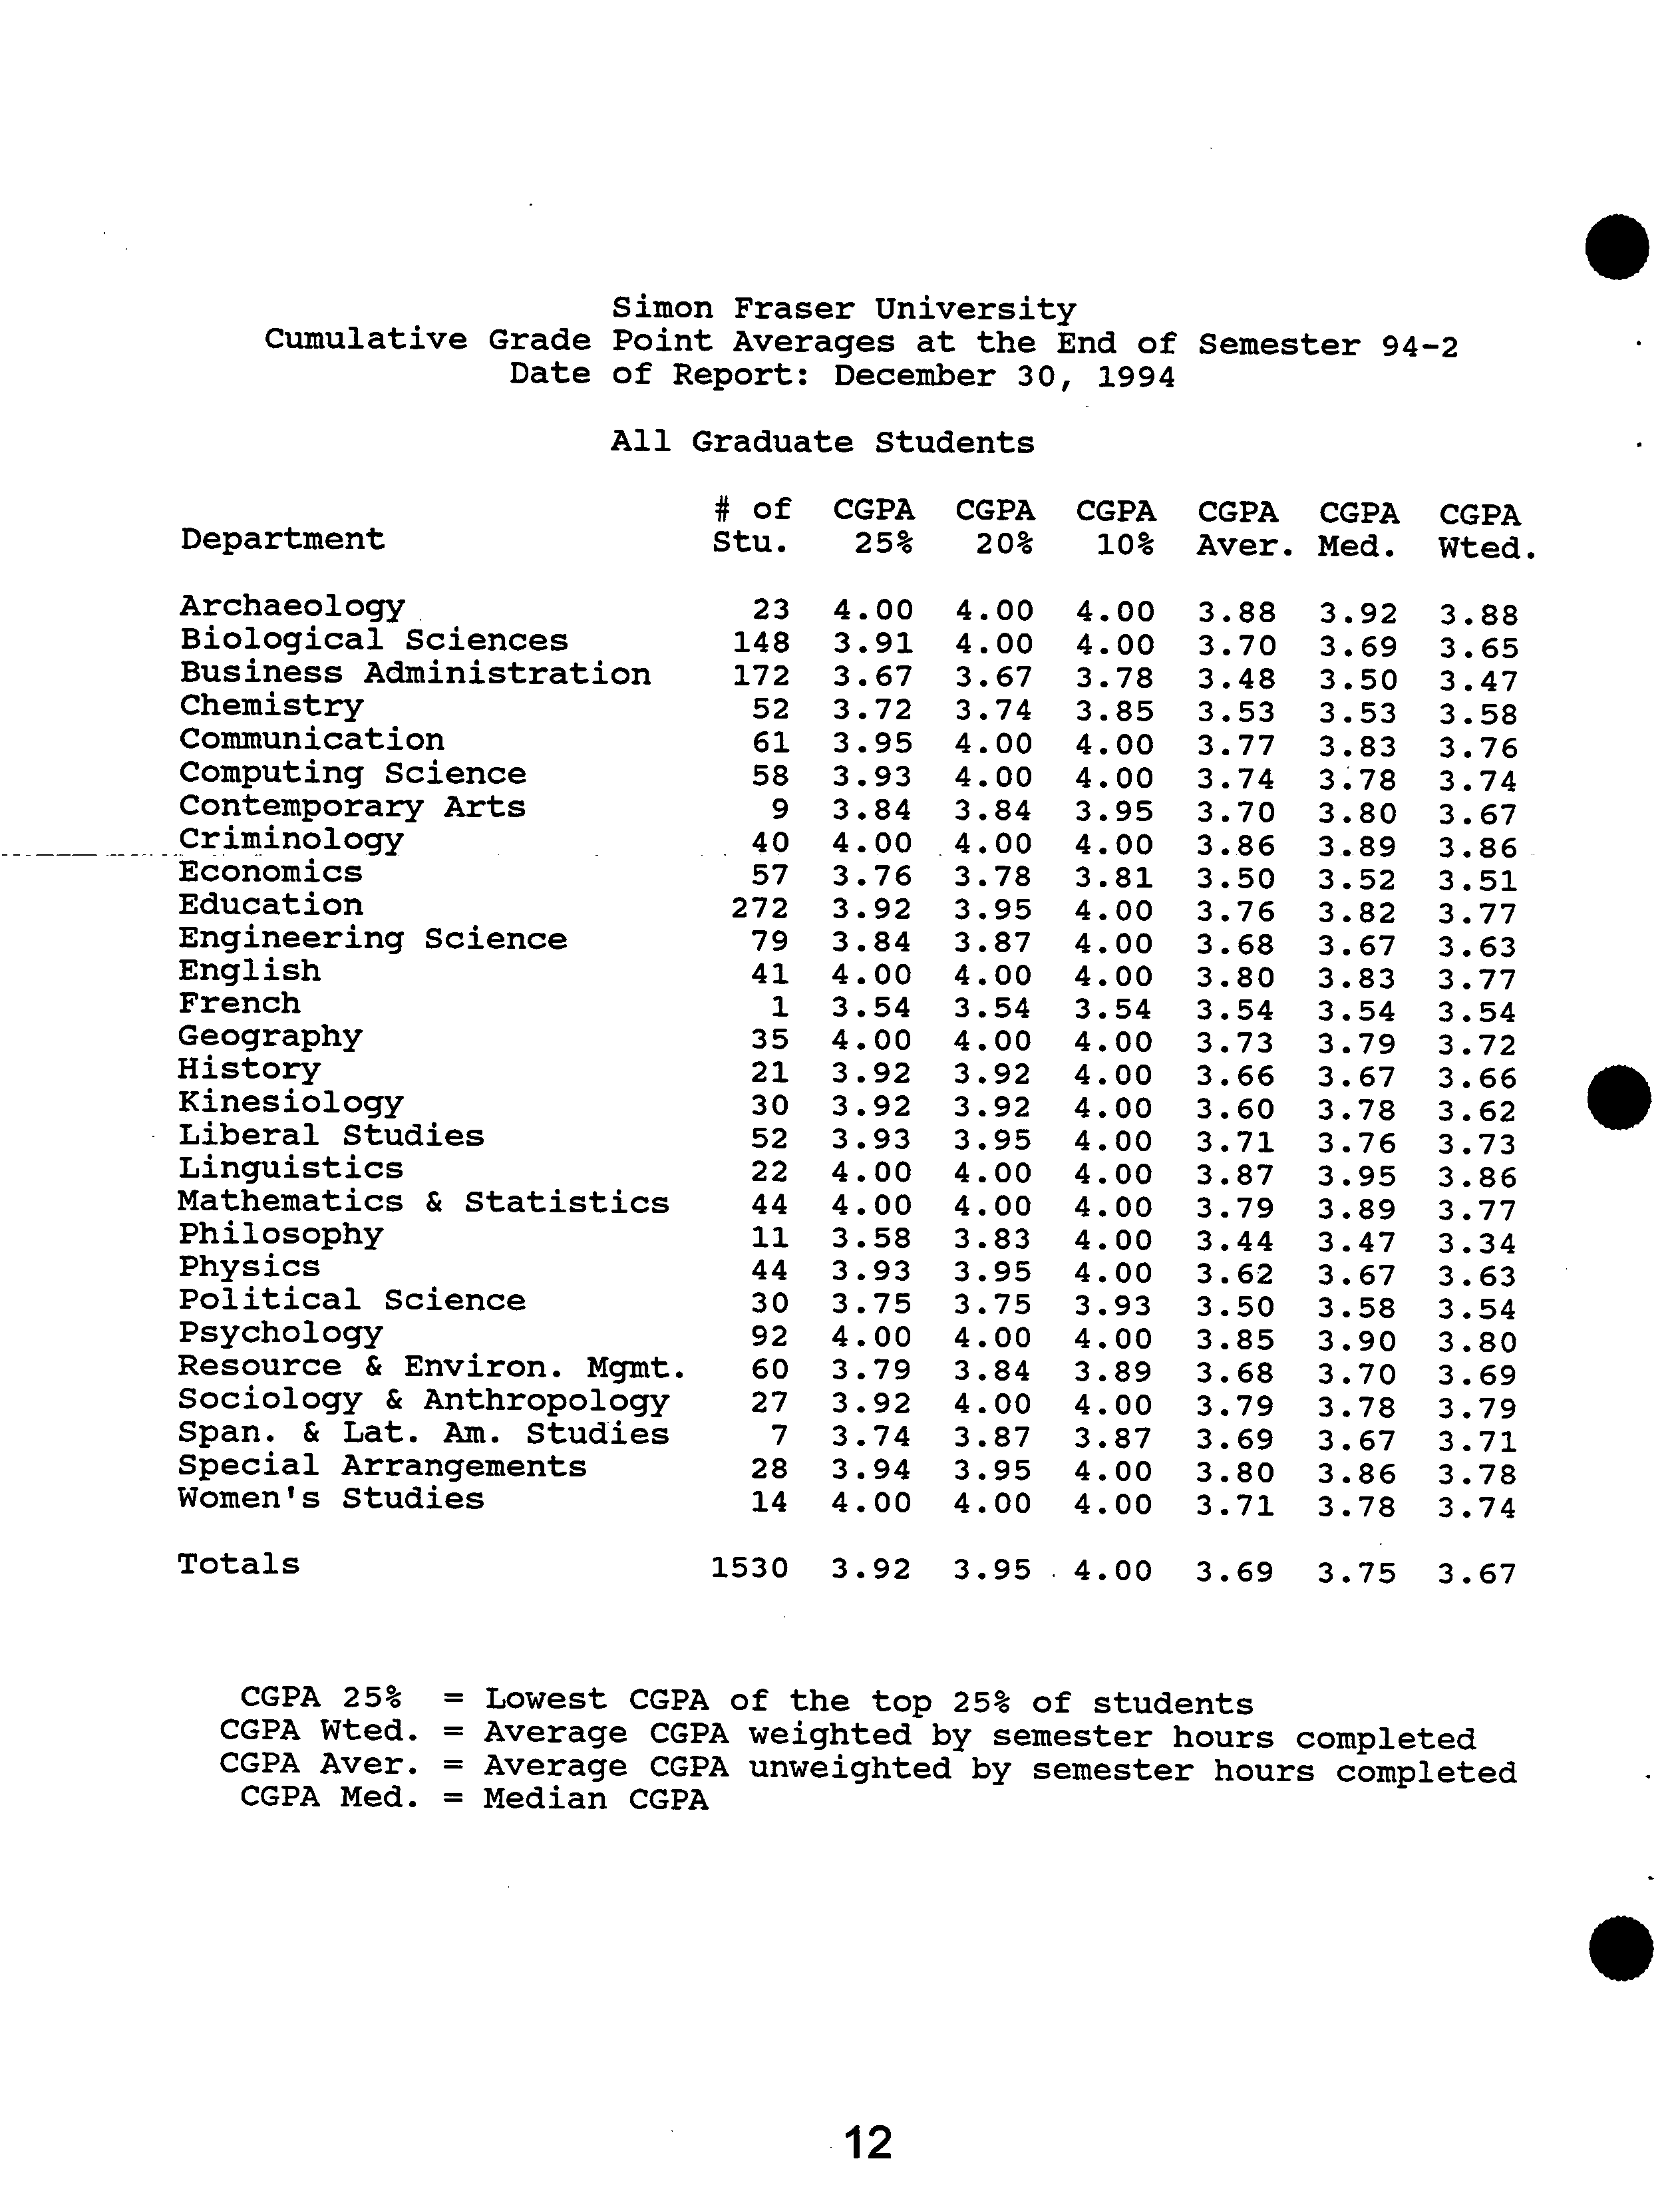
Simon Fraser University
Cumulative Grade Point Averages at the End of Semester 94-2
Date of Report: December 30, 1994
All Graduate Students
# of CGPA CGPA CGPA CGPA CGPA CGPA
Department ?
Stu. ?
25% 20% 10% Aver. Med. Wted.
.
Women's
Mathematics
HistoryResource
EducationSpecial
KinesiologyGeographyEconomicsEngineering
EnglishSociology
Span.
Liberal
ArchaeologyPolitical
PsychologyLinguisticsPhysicsPhilosophyFrenchContemporary
CommunicationCriminologyComputing
Business
ChemistryBiological
&
StudiesLat.
ArrangementsStudies&
Administration&
ScienceScienceEnviron.
Sciences
.
&
AnthropologyScienceAm.
ArtsStatisticsStudiesMgmt.
272172148
924422792852
21
44
41
2757113540603030
1452
582361
7
i
9
4.004.004.004.004.004.003.583.843.933.923.943.753.923.923.544.003.933.923.793.743.763.933.843.913.673.723.954.00
.
4.004.004.004.004.003.754.003.923.953.924.004.003.953.953.873.843.954.003.844.003.543.783.833.874.003.673.744.00
4.004.004.004.004.004.004.004.004.004.004.003.874.004.004.003.894.004.00
3.93
3.814.00
3.543.95
4.004.003.854.003.78
3.713.683.693.803.713.503.623.443.603.793.863.503.853.543.803.683.663.793.763.733.873.773.743.703.703.48
3.533.88
3.673.783.473.833.903.953.863.703.583.783.793.763.673.673.783.893.543.523.823.673.803.893.533.833.783.503.923.69
3.62
3.74
3.77
3.54
3.63
3.54
3.66
3.51
3.72
3.77
3.86
3.80
3.63
3.73
3.71
3.79
3.69
3.34
3.78
3.77
3.86
3.67
3.74
3.47
3.58
3.76
3.88
3.65
Totals ?
1530
3.92
3.95
4.00
3.69
3.75
3.67
CGPA 25%
?
= Lowest CGPA
of the
top
25% of
students
CGPA
CGPA
CGPA
Wted.
Aver.
Med.
=
=
=
Average
Average
Median CGPACGPACGPA
weightedunweighted
by
by
semestersemesterhours
hours
completed
completed
.
S
12
Simon Fraser University
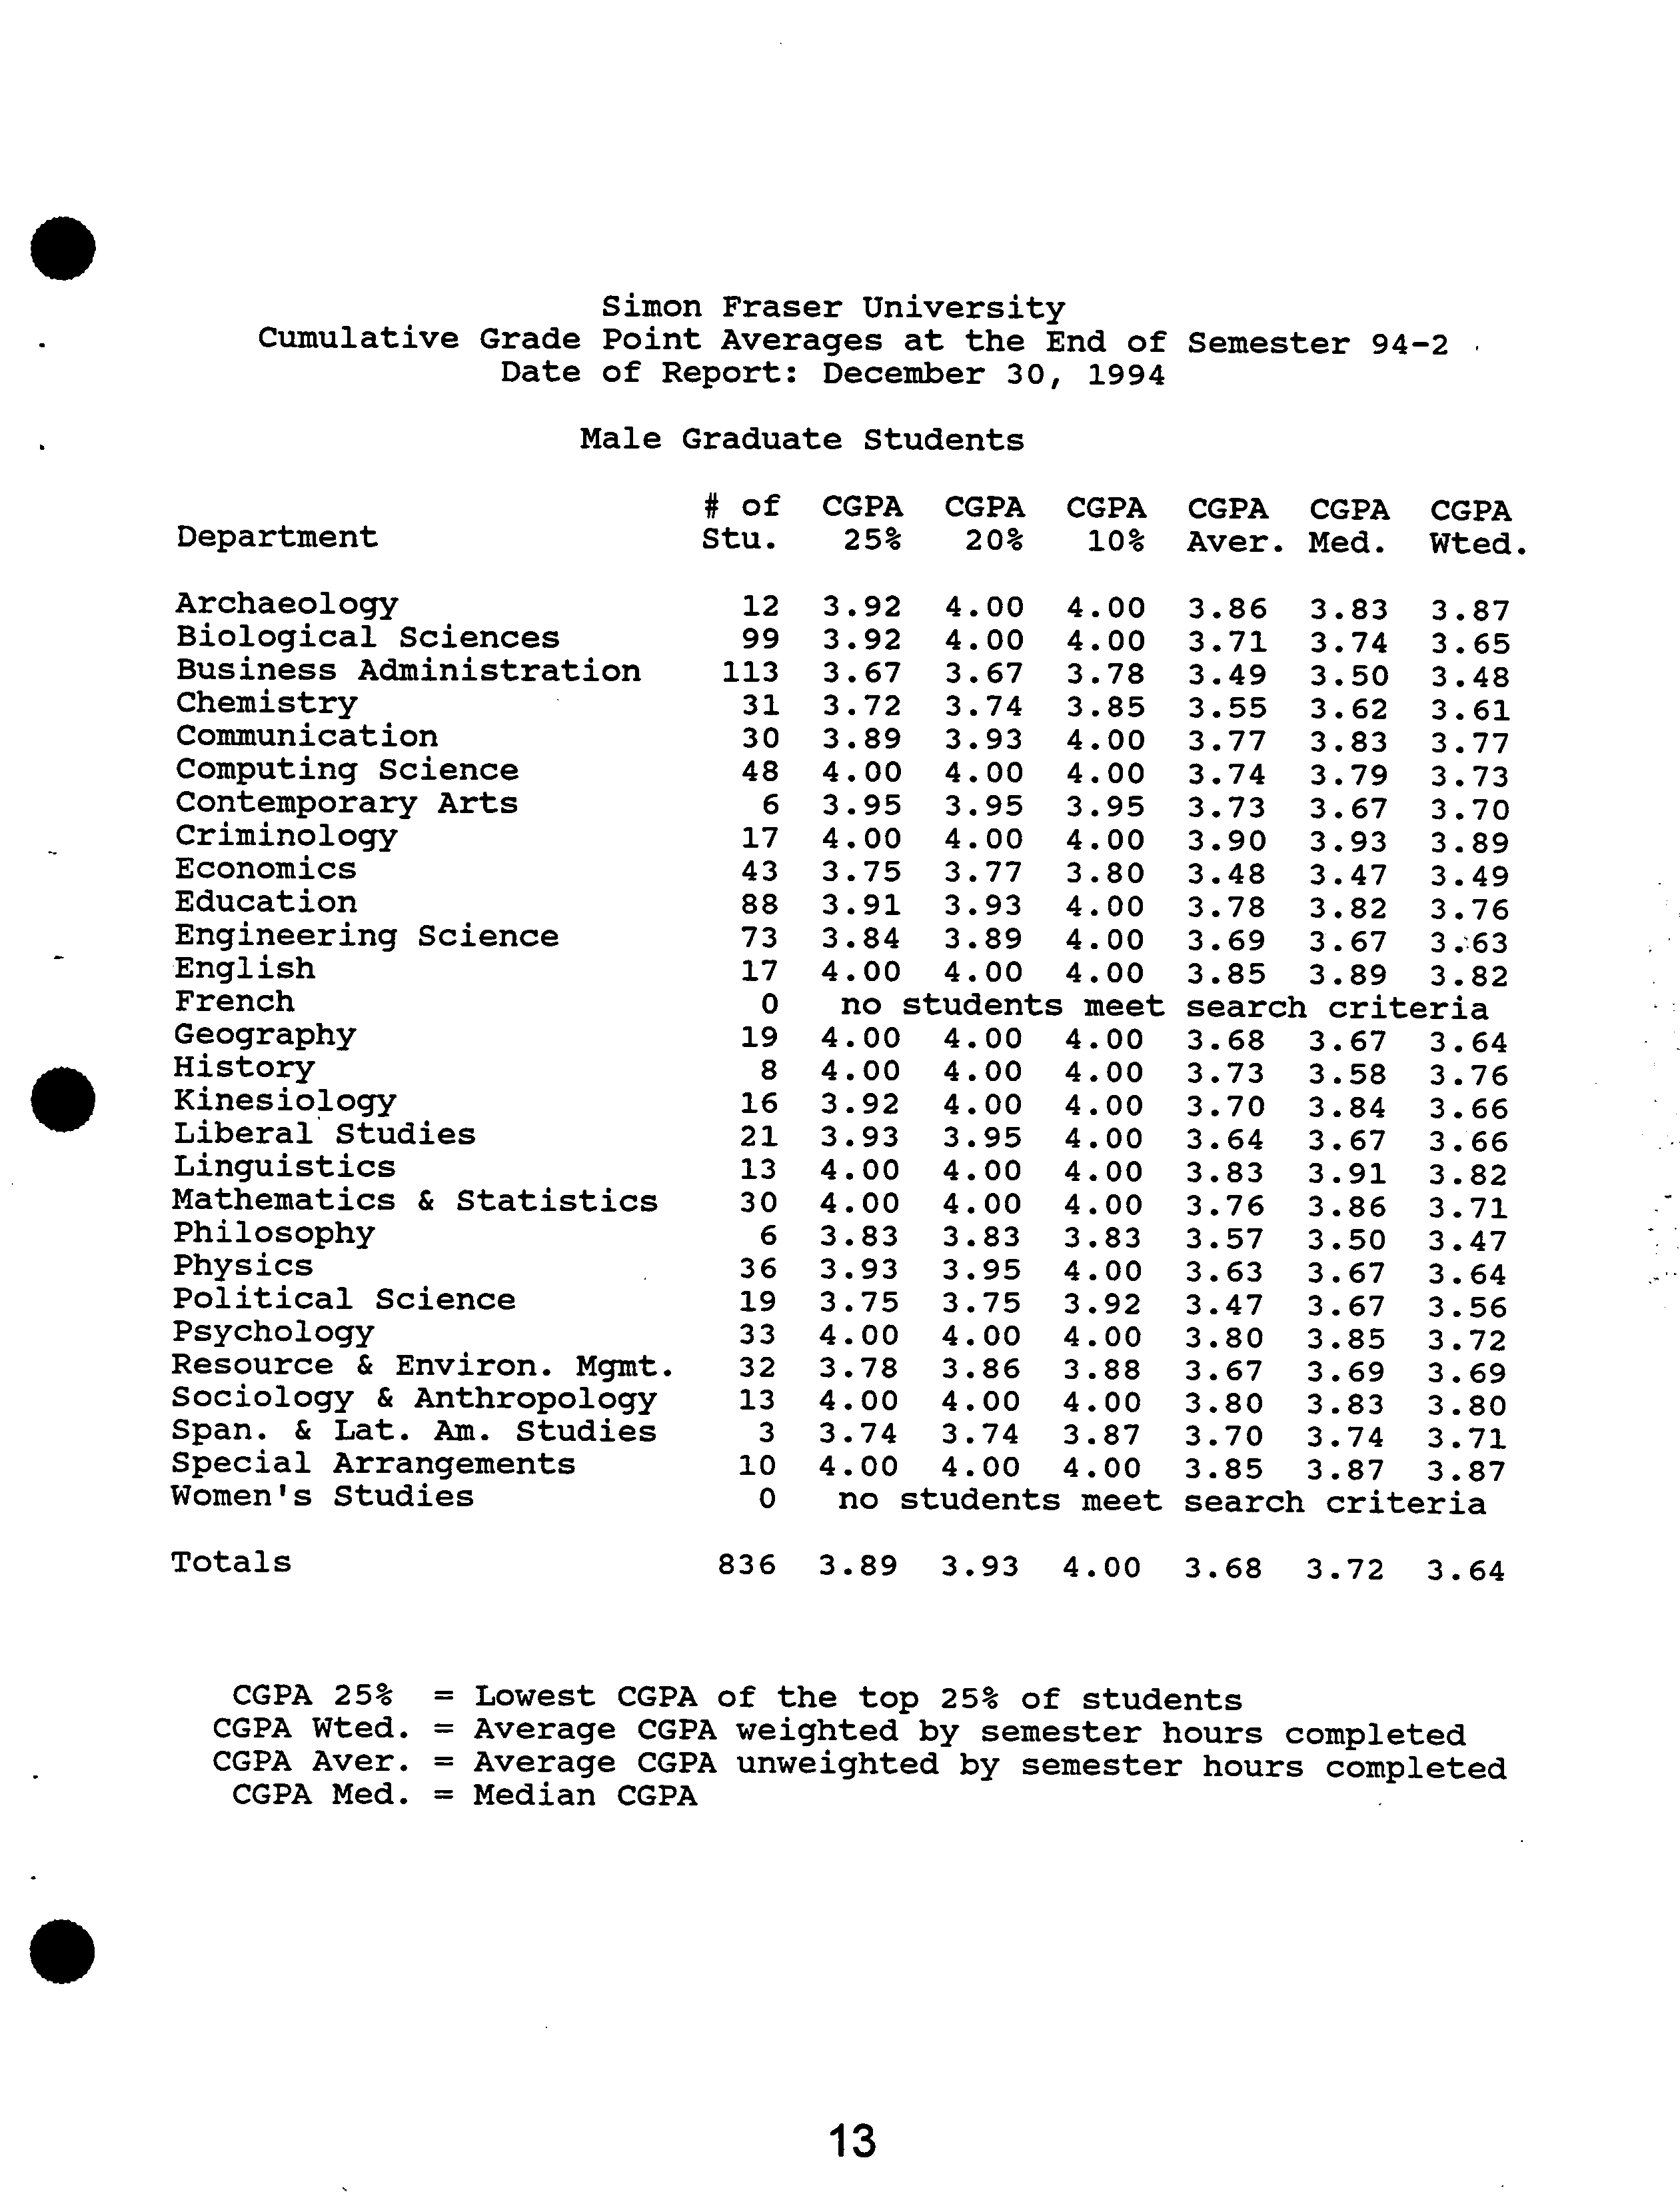
Cumulative Grade Point Averages at the End of Semester 94-2
Date of Report: December 30, 1994
Male Graduate Students
# of CGPA CGPA CGPA CGPA CGPA CGPA
Department ?
Stu.
?
25% 20% 10% Aver. Med. Wted.
Archaeology
12 3.92
4.00
4.00
3.86
3.83
3.87
Biological Sciences
99
3.92
4.00
4.00
3.71
3.74
3.65
Business Administration
113
3.67
3.67
3.78
3.49
3.50
3.48
Chemistry
31 3.72
3.74
3.85
3.55
3.62
3.61
Communication
30
3.89
3.93
4.00
3.77
3.83
3.77
Computing Science
48
4.00
4.00
4.00
3.74
3.79
3.73
Contemporary Arts
6
3.95
3.95
3.95
3.73
3.67
3.70
Criminology
17
4.00
4.00
4.00
3.90
3.93
3.89
Economics
43 3.75
3.77
3.80
3.48
3.47
3.49
Education
88
3.91 3.93
4.00
3.78
3.82
3.76
Engineering Science
73
3.84
3.89
4.00
3.69
3.67
3.63
English
17
4.00
4.00
4.00
3.85
3.89
3.82
French
0
no students
meet
search criteria
Geography
19 4.00
4.00
4.00
3.68
3.67
3.64
History
8
4.00
4.00
4.00
3.73
3.58
3.76
Kinesiology
16
3.92
4.00
4.00
3.70
3.84
3.66
Liberal Studies
21 3.93
3.95
4.00
3.64
3.67
3.66
Linguistics
13
4.00
4.00
4.00
3.83
3.91
3.82
Mathematics & Statistics
30
4.00
4.00
4.00
3.76
3.86
3.71
Philosophy
6
3.83
3.83
3.83
3.57
3.50
3.47
PsychologyPolitical
Physics
Science
193336
4.003.75
3.93
4.003.753.95
4.004.003.92
3.803.633.47
3.853.673.67
3.72
3.56
3.64
Resource & Environ. Mgmt.
32
3.78
3.86
3.88
3.67
3.69
3.69
Sociology & Anthropology
13
4.00
4.00
4.00
3.80
3.83
3.80
Span. & Lat. Am. Studies
3
3.74
3.74
3.87
3.70
3.74
3.71
Women's
Special
StudiesArrangements
10
0
4.00
no students
4.00
4.00
meet
search
3.85
3.87criteria
3.87
Totals
836
3.89
3.93
4.00
3.68
3.72
3.64
CGPA 25%
?
= Lowest CGPA
of the top
25% of
students
CGPA Wted. = Average CGPA
weighted
by
semester
hours
completed
CGPA Aver. = Average CGPA
unweighted
by semester
hours completed
CGPA Med. = Median CGPA
13
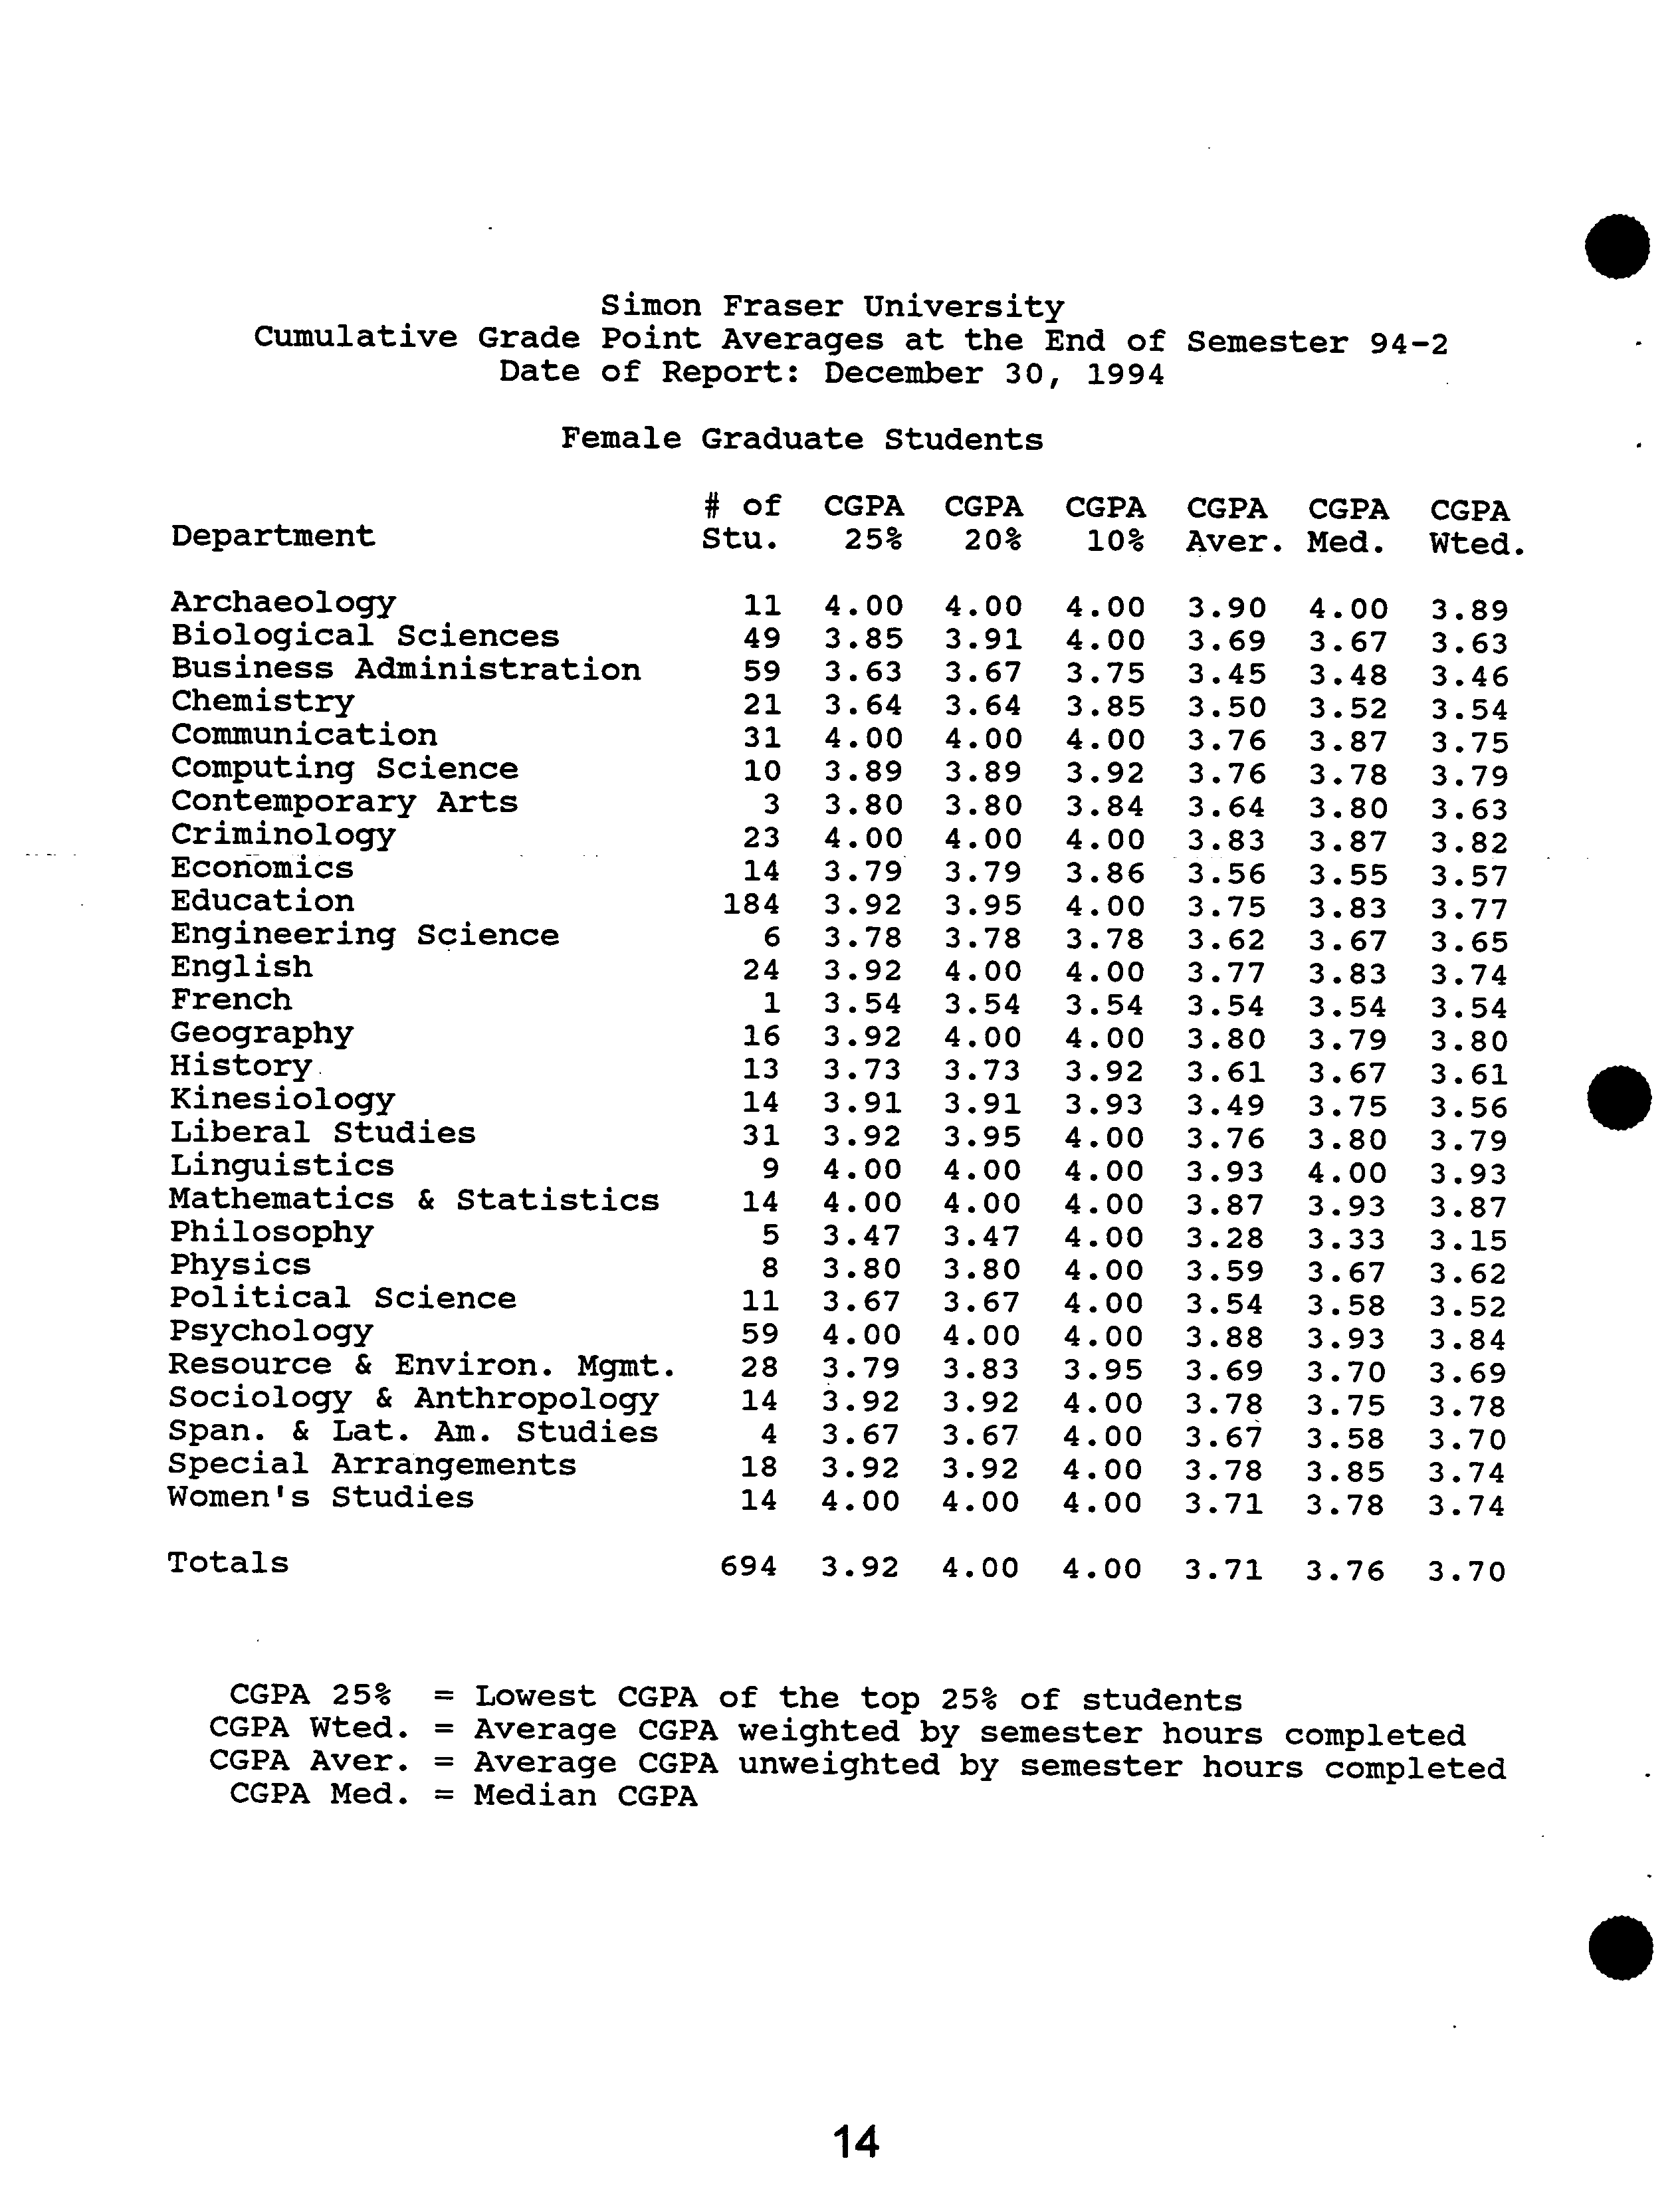
Simon Fraser University
Cumulative Grade Point Averages at the End of Semester 94-2
Date of Report: December 30, 1994
Female Graduate Students
# of CGPA CGPA CGPA CGPA CGPA CGPA
Department ?
Stu. ?
25% 20% 10% Aver. Med. Wted.
I
Women's
Mathematics
Resource
Special
Span.
Sociology
Political
History.
PsychologyArchaeologyGeographyKinesiologyPhilosophyPhysicsLinguisticsEducationFrenchEnglishEngineering
EconomicsLiberal
Computing
CommunicationBusiness
Contemporary
CriminologyBiological
Chemistry&
StudiesArrangementsLat.
Studies&
Administration&
ScienceScienceEnviron.
Sciences&
AnthropologyScienceAm.
ArtsStatisticsStudiesMgmt.
184
2814
1418
5911
1414
3149
13
21
23592416
3110ii
14
4
5
8961
3
4.003.673.923.924.003.793.804.003.673.474.003.734.003.913.92
3.92
4.003.793.923.923.783.543.854.003.893.803.633.64
4.003.923.674.003.924.004.003.833.673.954.003.803.473.914.004.003.734.003.794.003.543.893.953.783.803.643.913.67
4.004.004.004.004.004.004.004.003.954.004.004.004.003.543.934.003.924.004.004.004.004.003.843.923.753.863.783.85
3.783.713.673.693.783.883.593.873.283.763.933.543.613.803.773.543.493.833.753.563.763.693.503.623.643.453.903.76
3.783.703.583.753.853.933.583.674.003.333.753.803.934.003.673.833.673.543.793.833.873.553.783.523.483.673.803.87
3.74
3.70
3.74
3.78
3.69
3.15
3.84
3.52
3.62
3.87
3.61
3.93
3.79
3.56
3.63
3.65
3.77
3.79
3.82
3.54
3.80
3.57
3.74
3.54
3.75
3.89
3.63
3.46
Totals
694
3.92
4.00
4.00
3.71
3.76
3.70
CGPA 25% = Lowest CGPA of the top 25% of students
CGPA Wted. = Average CGPA weighted by semester hours completed
CGPA Aver. = Average CGPA unweighted by semester hours completed
CGPA Med. = Median CGPA
S
S
14
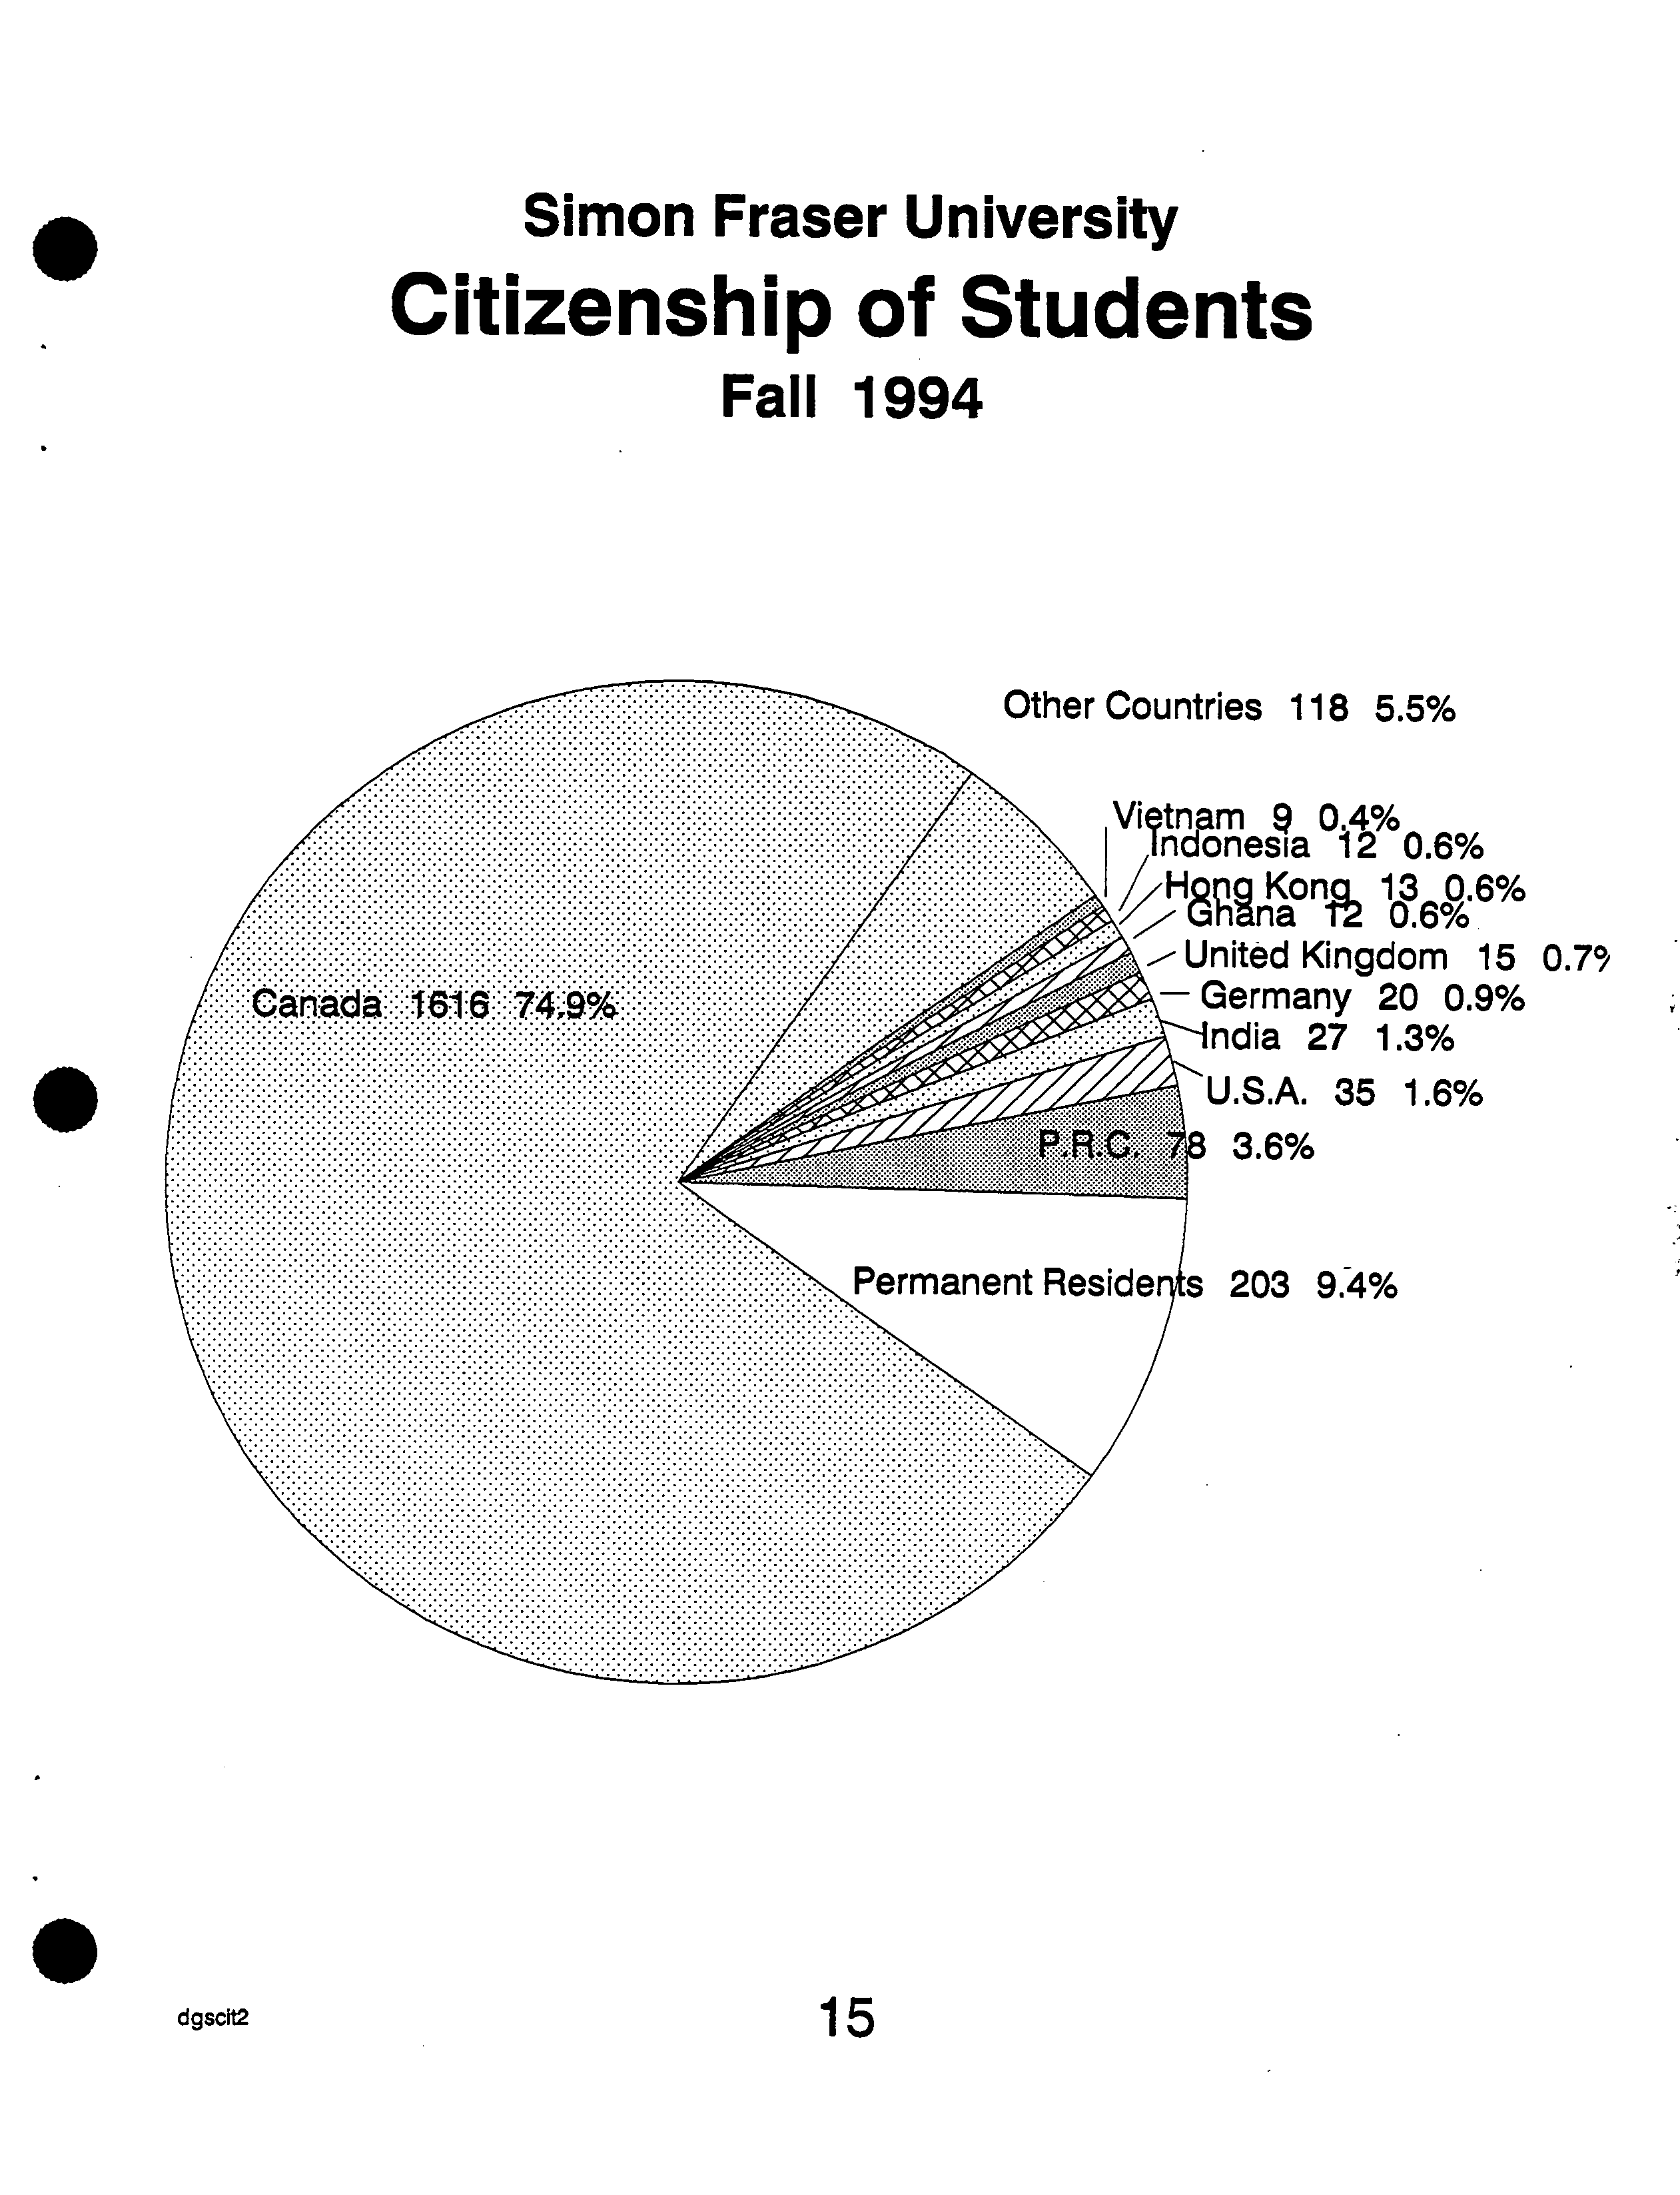
Vietnam
Indonesia
9 0.4%
12 0.6%
,/^
H
gg ?
10369.6%
4.—United Kingdom 15 0.7
•:
Germany 20 0.9%
iJndja 27 1.3%
U.S.A. 35 1.6%
3.6%
203 9.4%
Simon Fraser University
Citizenship of Students
Fall 1994
Other Countries 118 5.5%
.
dgsclt2
?
1
5
Simon Fraser University
?
0
Citizenship of Visa Students
Fall 1994
Other Countries 75 22.8%
Malaysia 5 1.5%
Japan 5 1.5%
. Singapore 5 1.5%
?
Taiwan 5 1.5%
Sri Lanka 6 18%
New Zealand 7 2.1%
Vietnam 9 2.7%
Indonesia 12 3.6%
Hong Kong 13 4.0%
Ghana 12 3.6%
United Kingdom 15 4.6%
Germany 20 6.1%
India 27 8.2%
dgscit
?
16
.
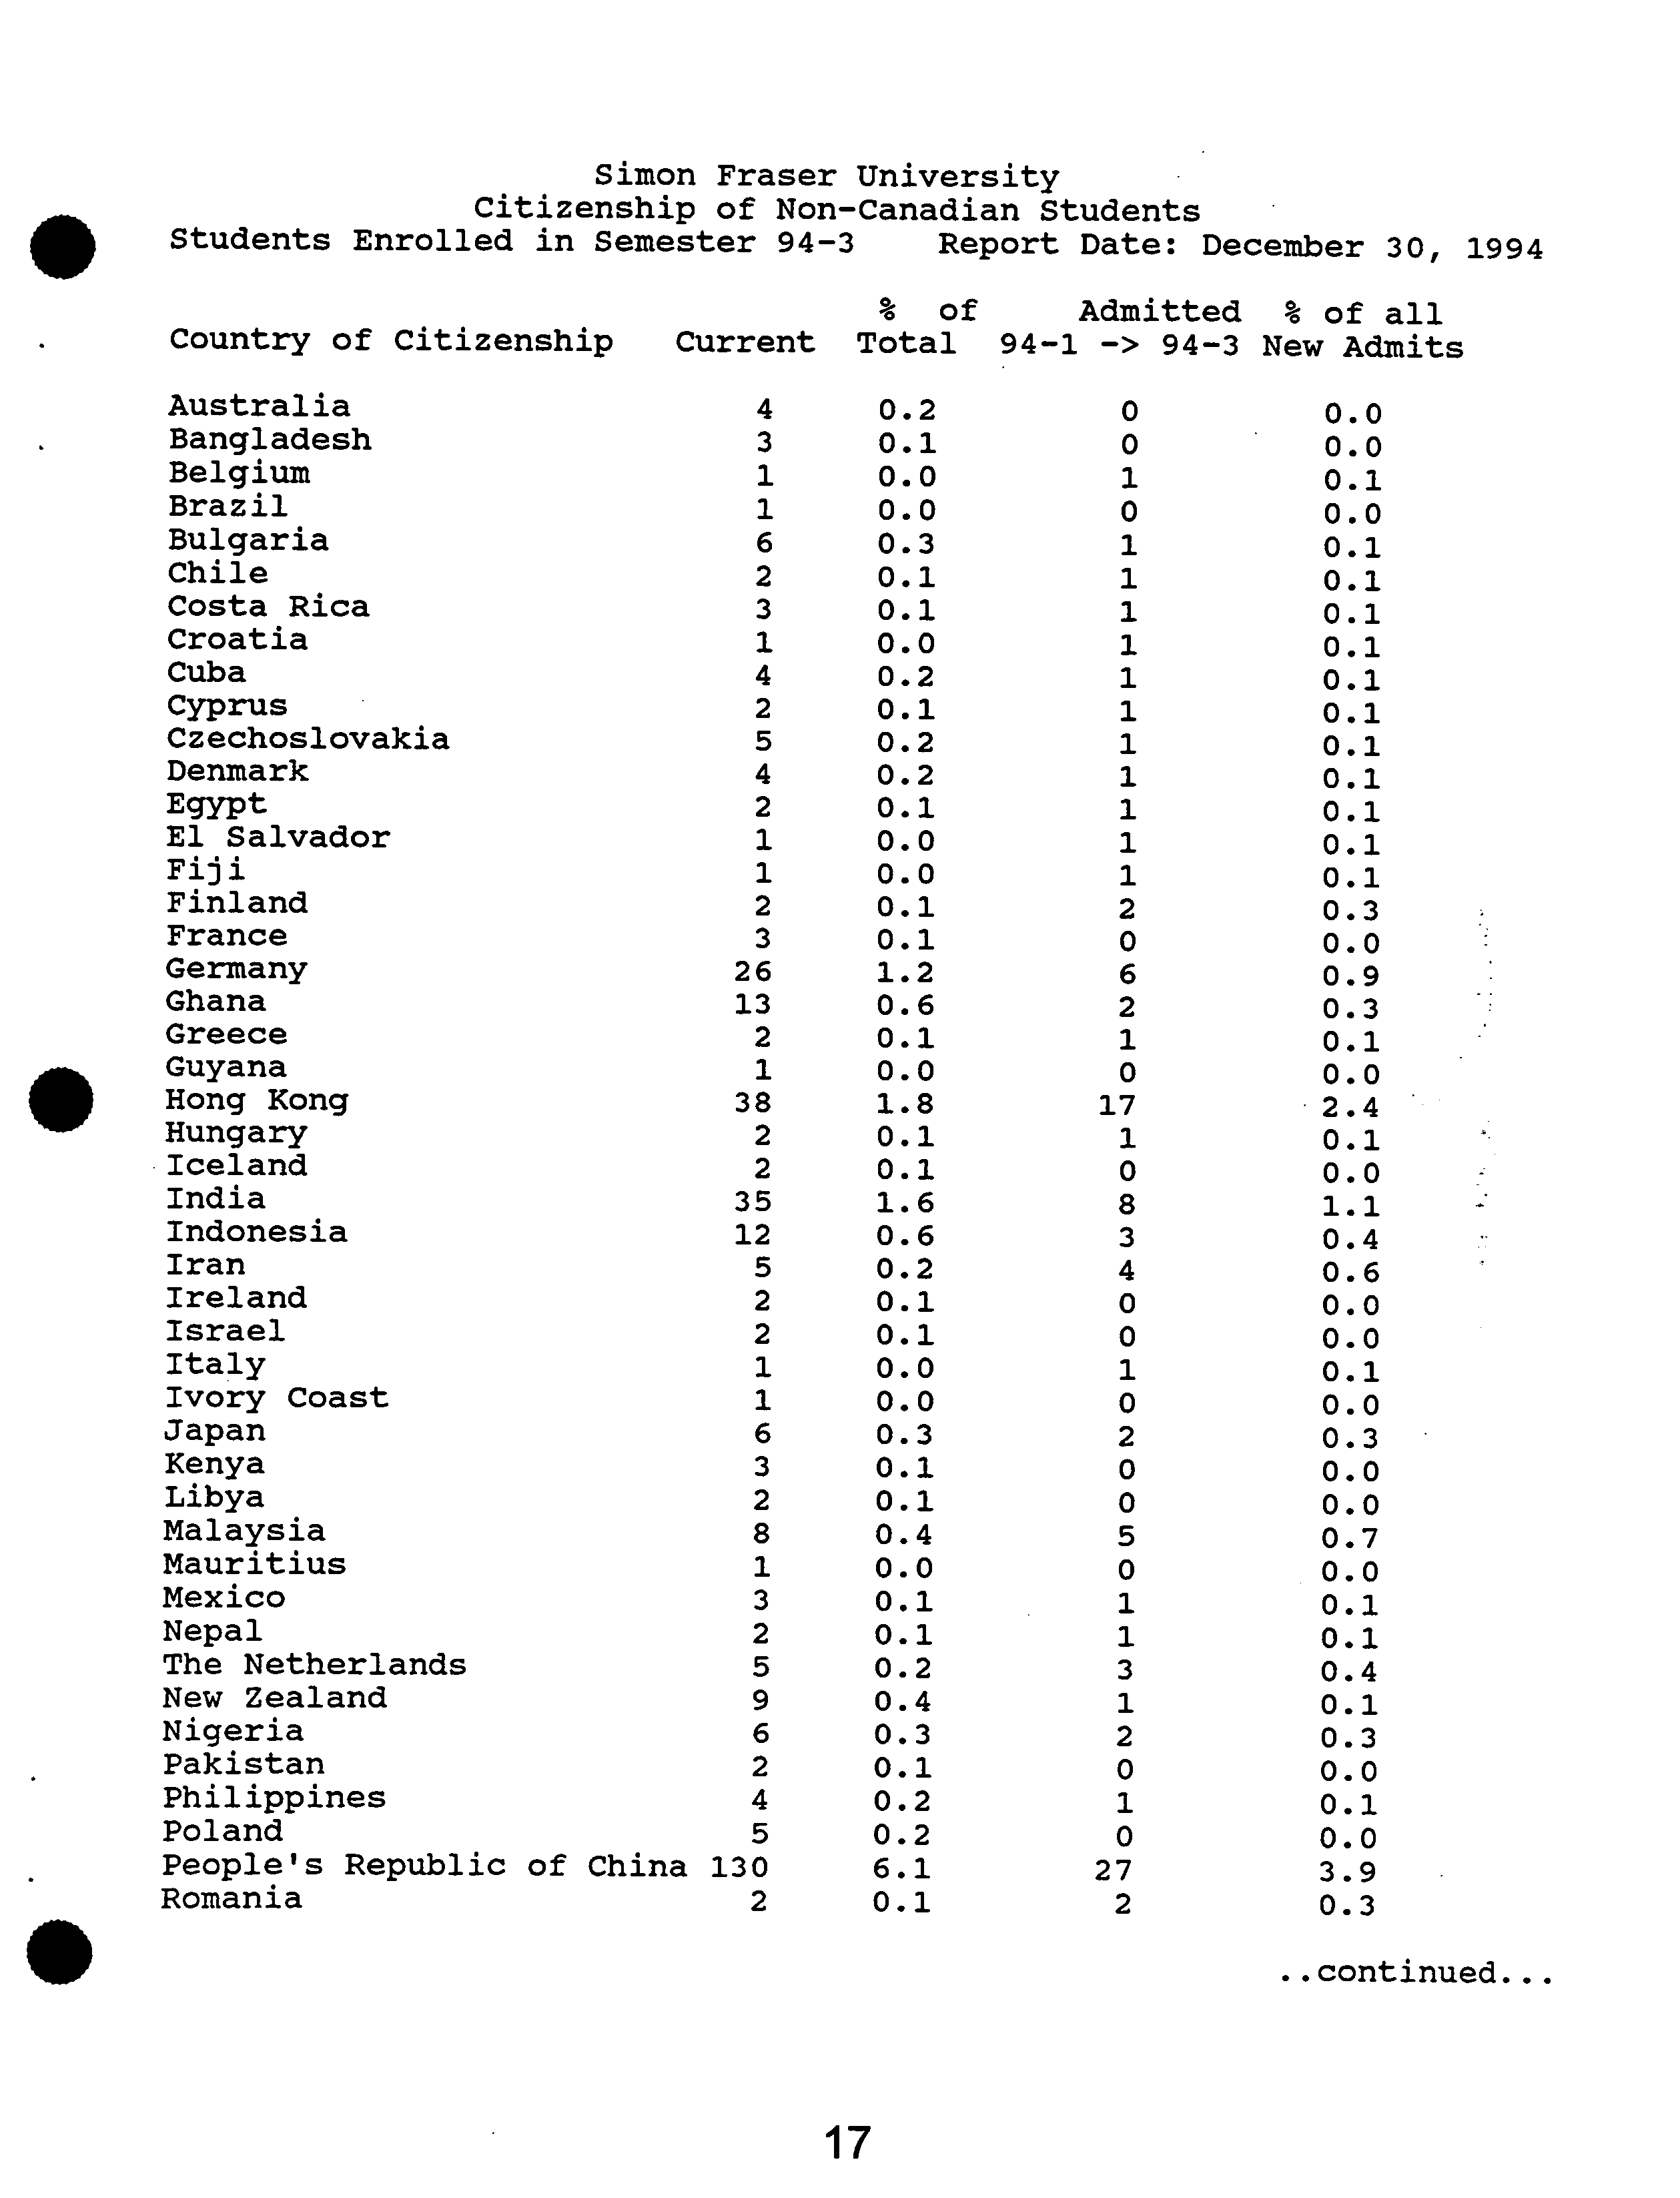
Simon Fraser University
Citizenship of Non-Canadian Students
Students Enrolled in Semester 94-3
?
Report Date: December 30, 1994
r
% ?
of
Admitted
% of all
Country of Citizenship ?
Current
Total
94-1 -> 94-3
New Admits
New
MexicoMauritiusThe
NepalMalaysiaJapan
Hong
HungaryKenyaLibyaGhanaGreeceGermanyGuyanaIsraelEl
ItalyEgyptIvory
Ireland
FiJI.
IndonesiaFinlandIndia
Iran
IcelandCzechoslovakiaFranceDenmarkAustraliaCroatiaCyprusCosta
CubaBulgariaChile
BelgiumBrazilBangladeshSalvadorNetherlandsZealandKongCoastRica
2635
123813
92
5
82
3
1
23
4
2
65
2
1
22
1
2
1
2
2
1
32
5
4
1
3
114
61
3
0.20.4
0.10.10.00.40.10.11.60.10.60.10.00.60.00.10.2
0.30.00.00.00.21.20.10.10.20.0
0.1
1.80.10.10.10.10.20.30.1
0.10.00.00.2
17
51
1
3
4
8
2
0
01020
1
0
23
0101101161101111101001
0.1
0.1
0.4
0.0
0.1
0.7
0.6
0.3
0.0
0.0
0.0
0.0
0.0
0.1
0.4
2.4
0.1
0.1
0.3
0.0
0.9
0.1
1.1
0.0
0.1
0.1
0.1
0.1
0.0
0.1
0.3
0.1
0.1
0.1
0.1
0.1
0.0
0.1
0.0
0.0
NigeriaPakistan
2
6
0.3
0.1
20
0.0
0.3
Philippines
4
0.2
1
0.1
Poland
5
0.2
0
0.0
People's Republic of China
130
6.1
27
3.9
Romania
2
0.1
2
0.3
.continued...
17
Simon
Fraser
University
Citizenship
of Non-Canadian Students
Students Enrolled in Semester 94-3
?
Report
Date: December 30, 1994
% ?
of
Admitted
% of all
Country of Citizenship ?
Current
Total ?
94-1 -> 94-3
New Admits
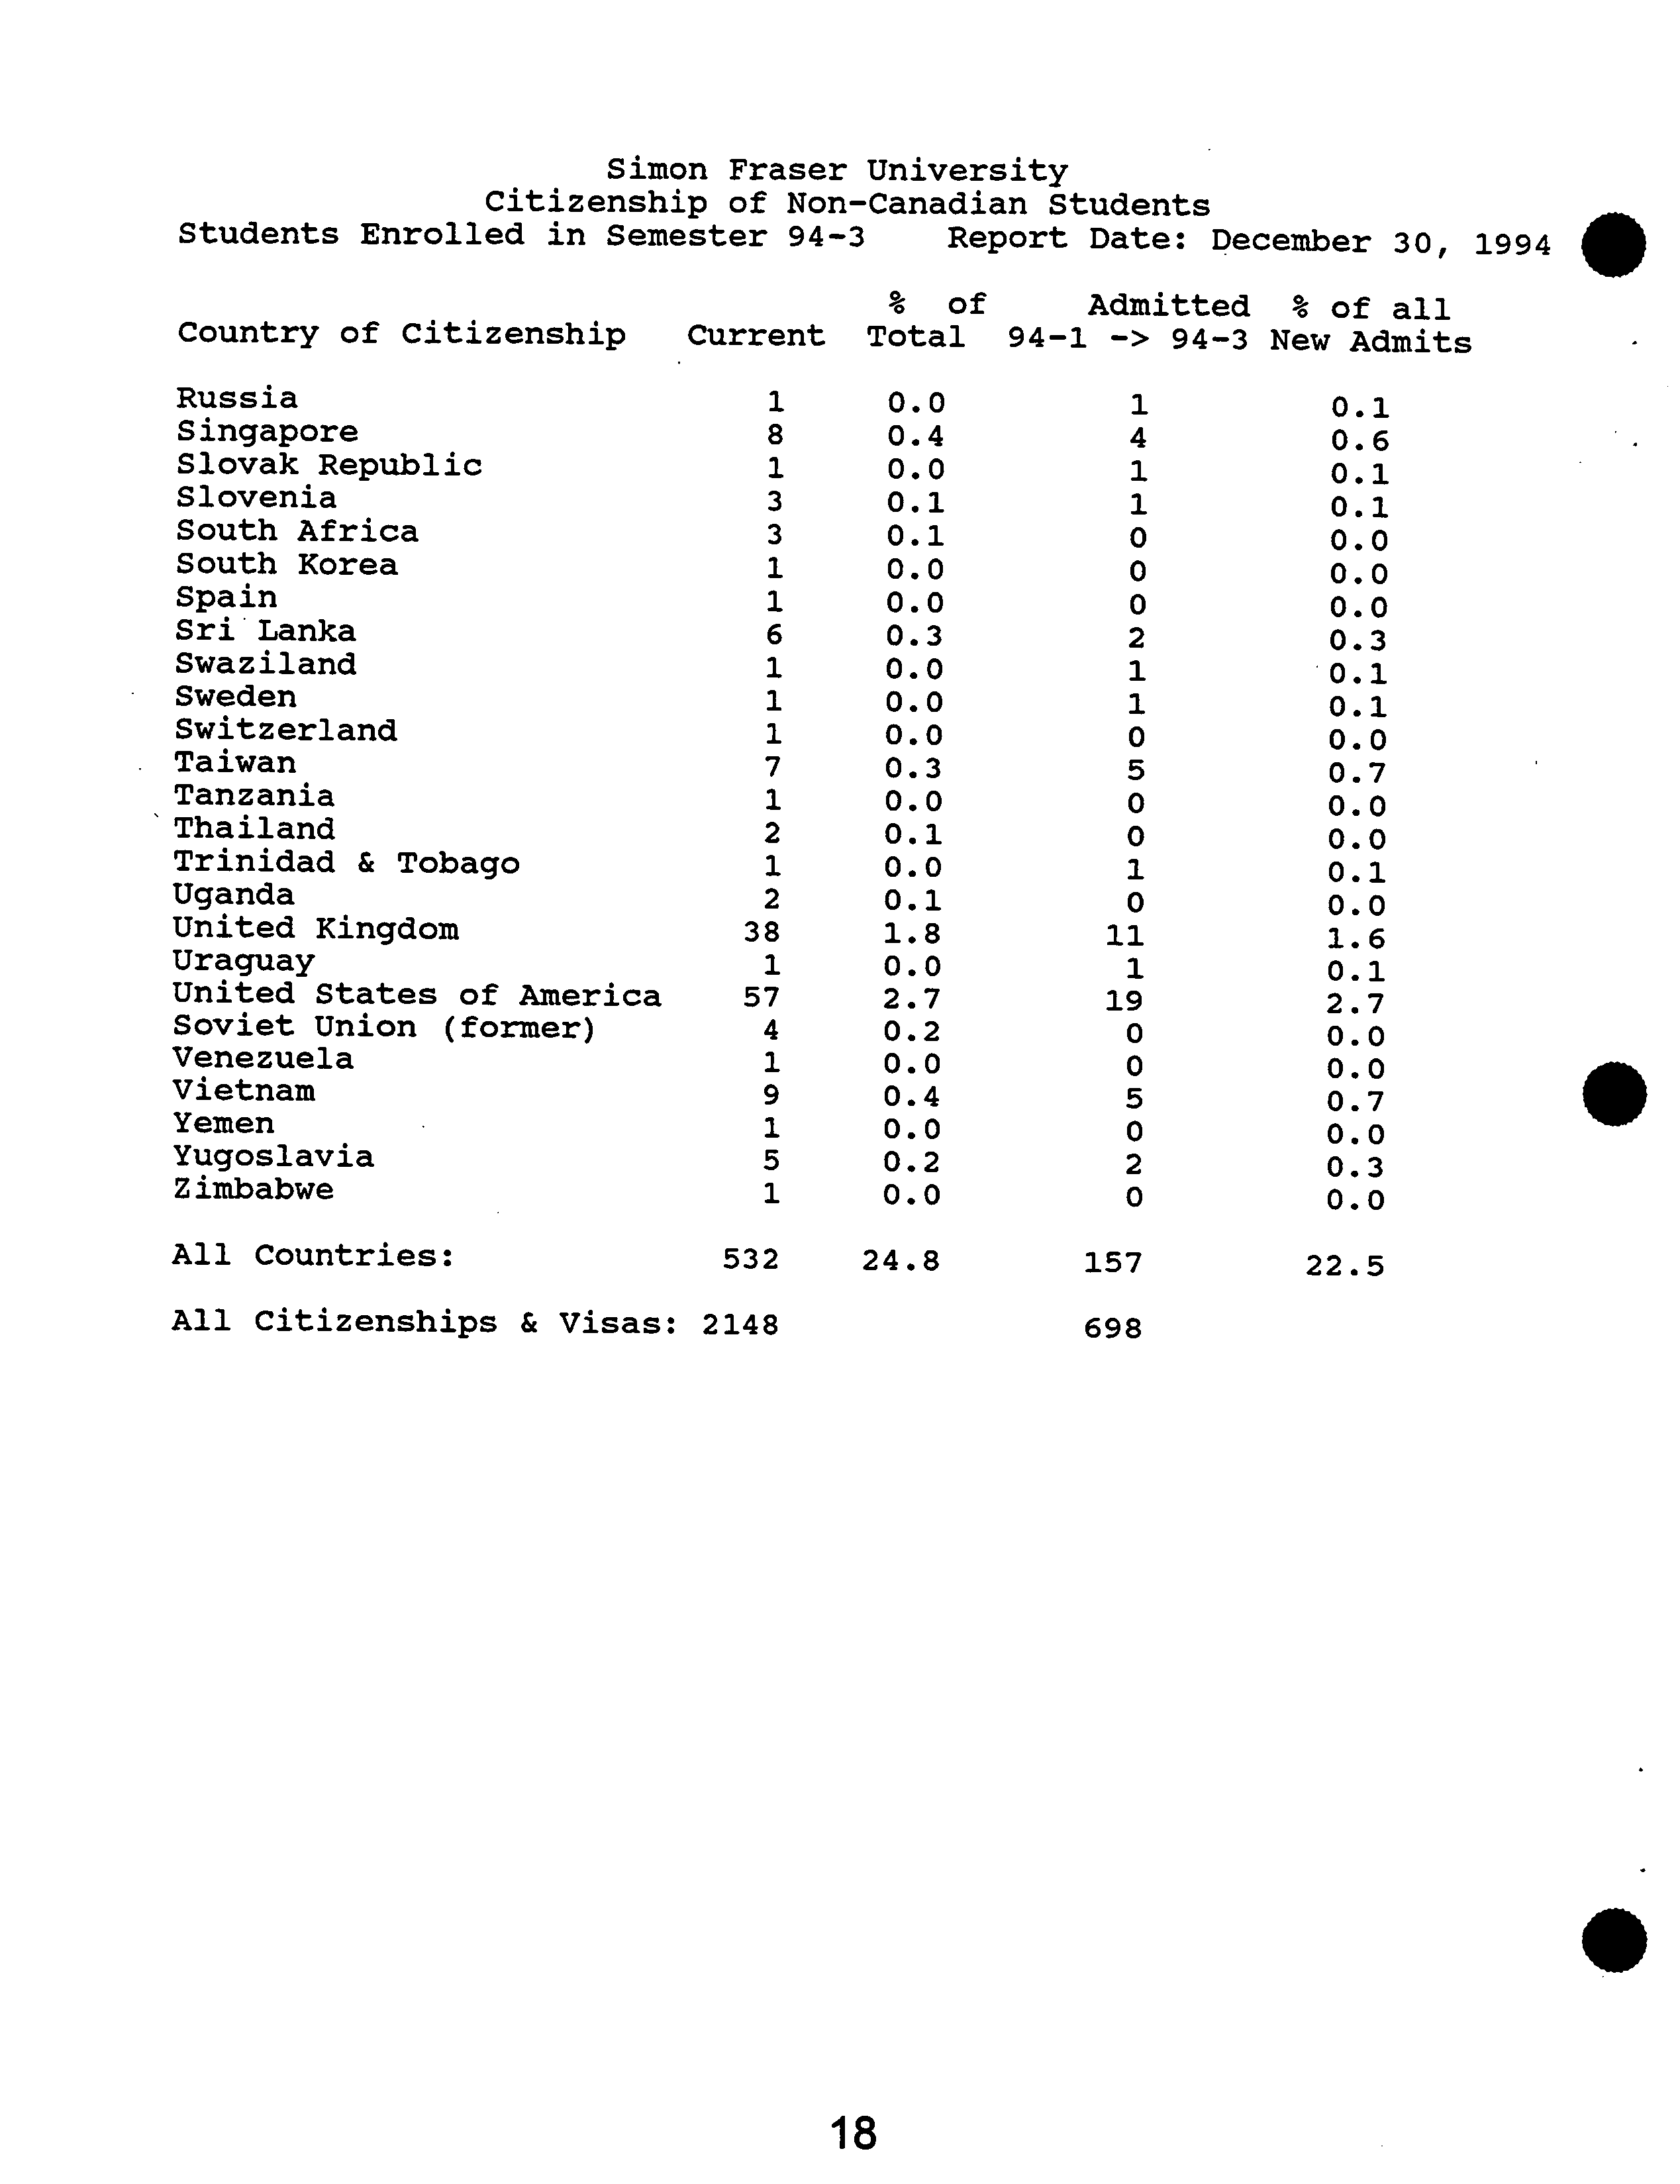
VietnamVenezuelaUraguayUnited
United
UgandaYemenYugoslaviaThailandSoviet
TanzaniaTrinidad
TaiwanZimbabwe
SriLanka
SwitzerlandSwedenSwazilandRussiaSpainSouth
SloveniaSouth
Slovak
SingaporeKoreaAfricaUnion
States
KingdomRepublic&
Tobago(former)of
America
5738
5
4
9121
2
3.
i711ii
ii
68
3
1
3
11
0.22.70.00.20.00.01.80.10.00.40.00.10.00.30.00.00.00.00.30.10.10.00.40.00.0
19
11
05
2
000
11500
0
1
1
0200
041
11
2.7
0.0
0.0
0.0
0.0
0.3
0.7
0.0
0.1
1.6
0.0
0.0
0.1
0.0
0.7
0.1
0.3
0.1
0.0
0.0
0.0
0.1
0.1
0.1
0.6
All Countries:
532
24.8
157
22.5
All Citizenships & Visas: 2148
698
.
18
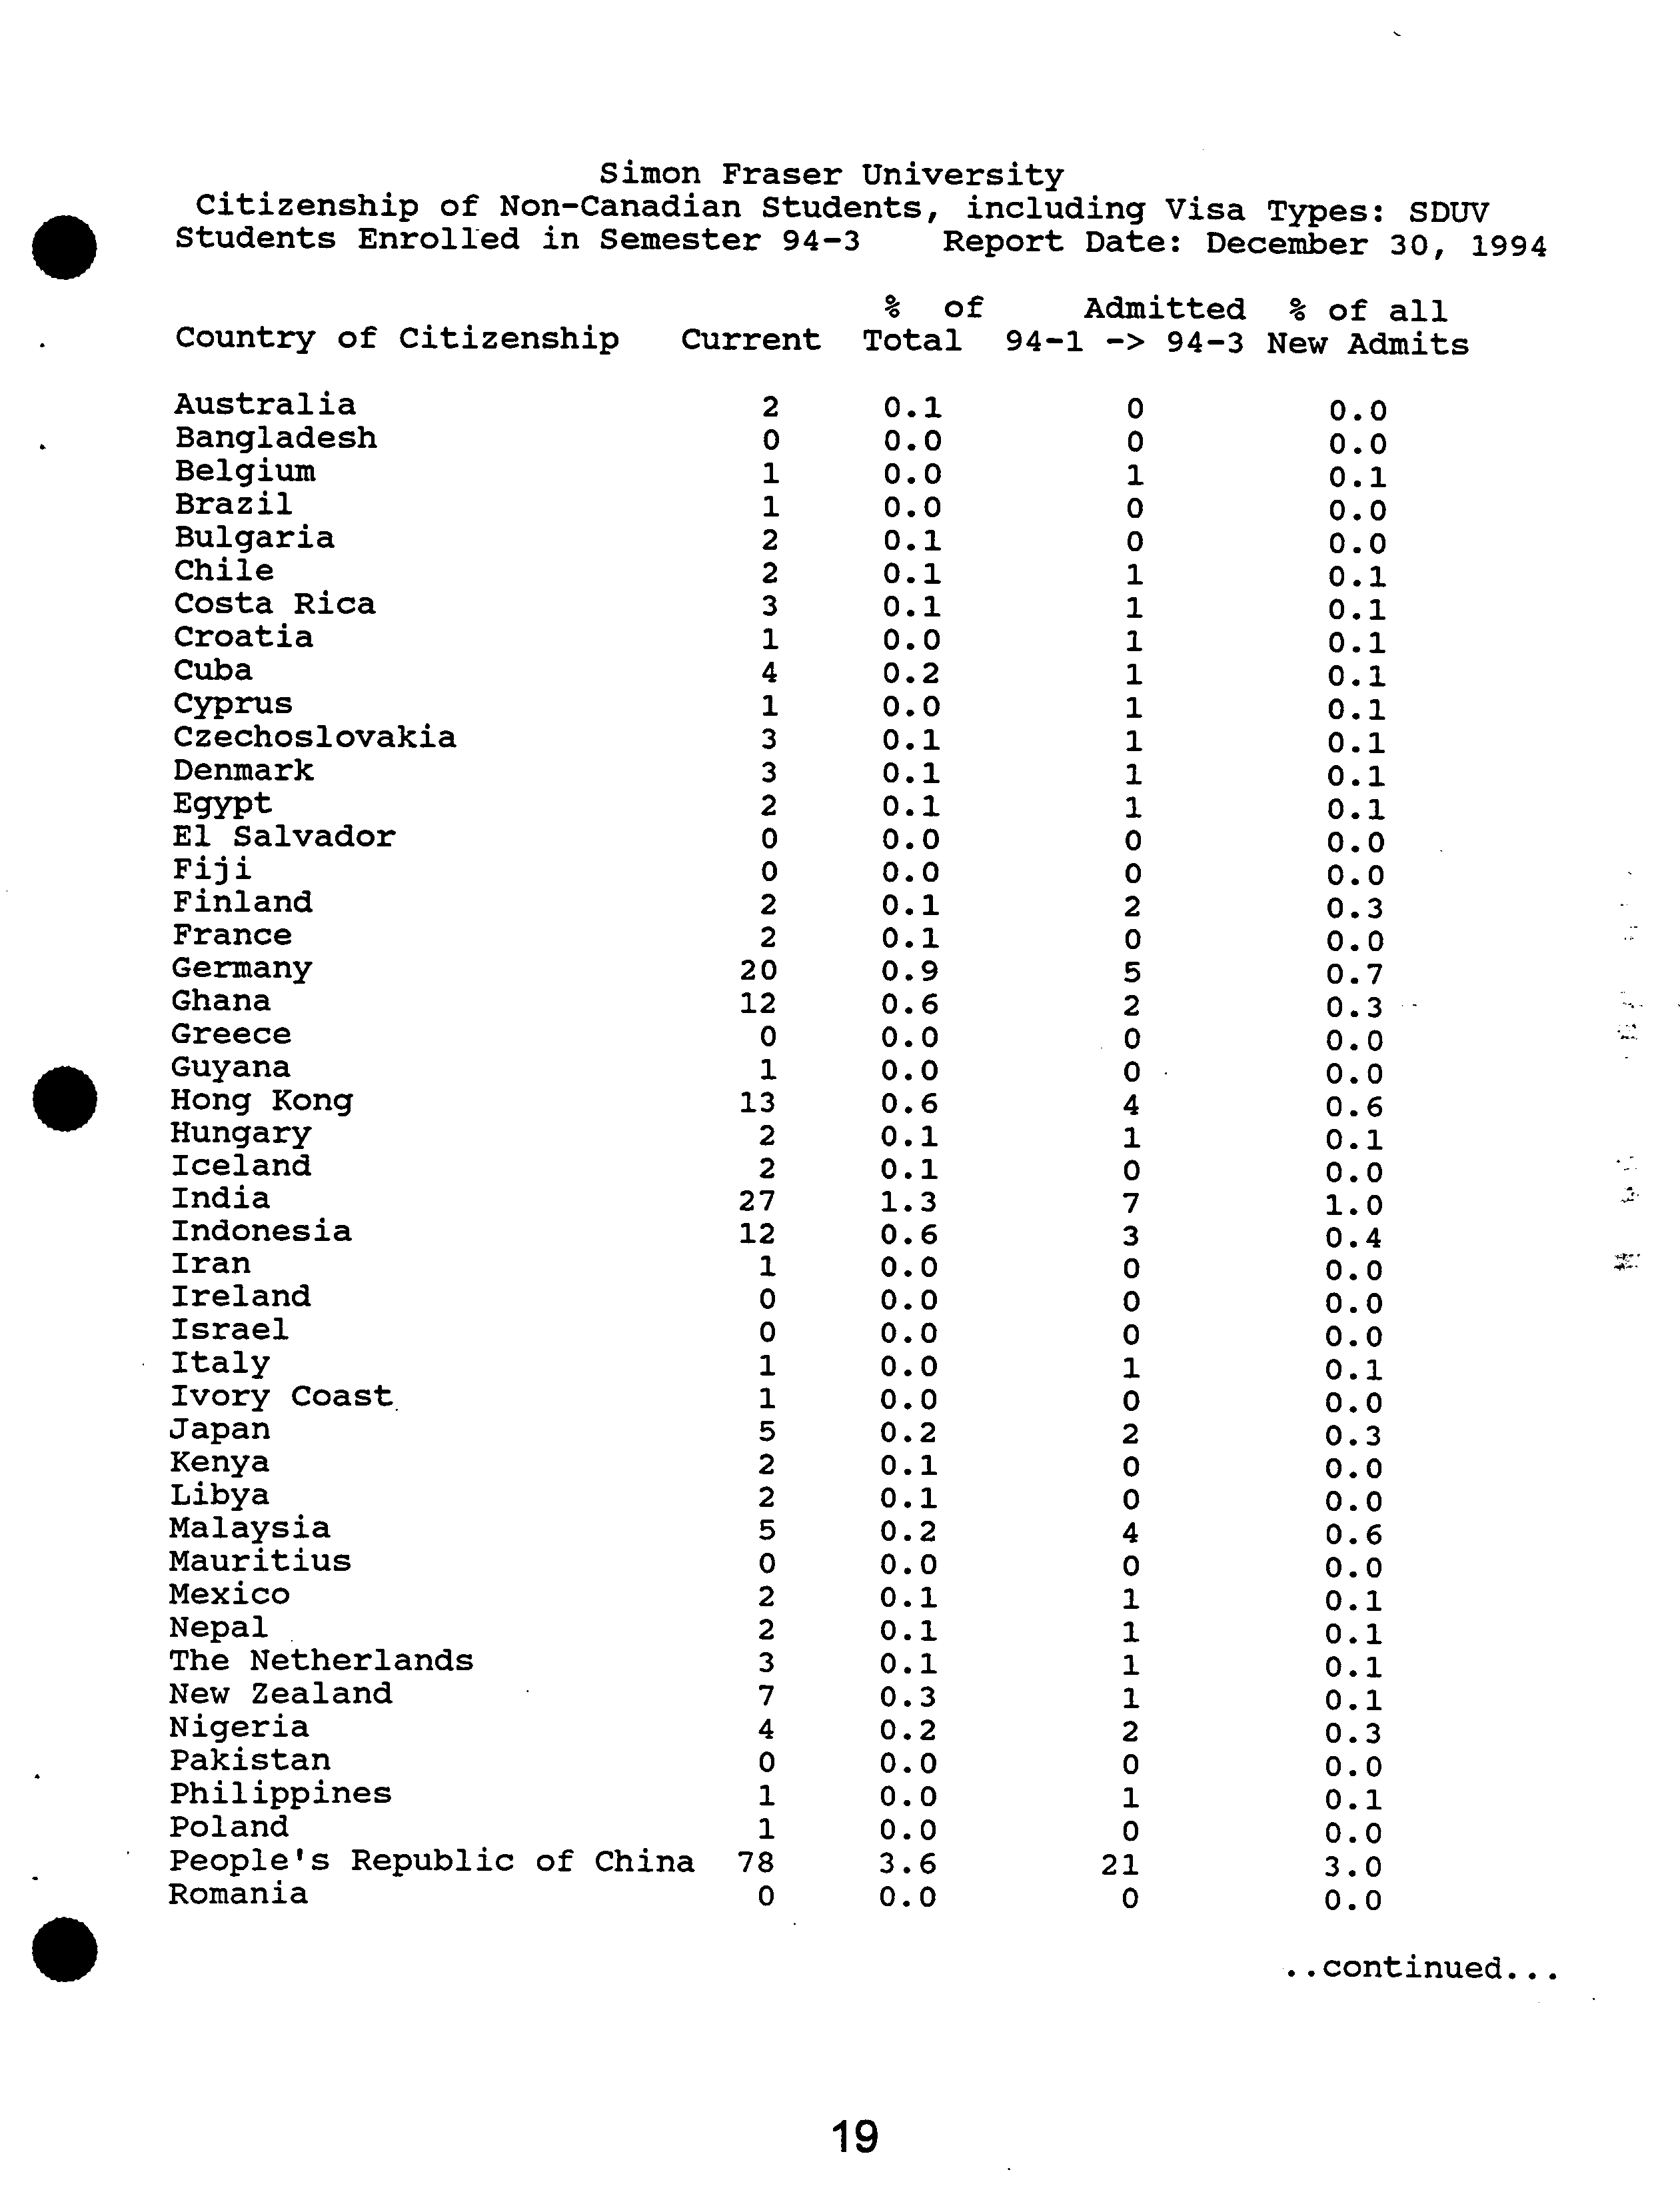
Simon Fraser
University
Citizenship of Non-Canadian Students, including
Visa
Types: SDUV
Students Enrolled
in Semester 94-3
Report
Date: December 30, 1994
% ?
of
Admitted
% of all
•
Country of Citizenship
?
Current
Total ?
94-1
-> 94-3
New Admits
Australia
2
0.1
0
0.0
Bangladesh
0
0.0
0
0.0
Belgium
1
0.0
1
0.1
Brazil
1
0.0
0
0.0
Bulgaria
2
0.1
0
0.0
Chile
2
0.1
1
0.1
Costa Rica
3
0.1
1
0.1
Croatia
1
0.0
1
0.1
Cuba
4
0.2
1
0.1
Cyprus
1
0.0
1
0.1
Czechoslovakia
3
0.1
1
0.1
Denmark
3
0.1
1
0.1
Egypt
2
0.1
1
0.1
El Salvador
0
0.0
0
0.0
Fiji
0
0.0
0
0.0
Finland
2
0.1
2
0.3
France
2
0.1
0
0.0
Germany
20
0.9
5
0.7
Ghana
12
0.6
2
0.3 ?
-
Greece
0
0.0
0
0.0
Guyana
1
0.0
0
0.0
•
Hong Kong
13
0.6
4
0.6
Hungary
2
0.1
1
0.1
Iceland
2
0.1
0
0.0
India
27
1.3
7
1.0
Indonesia
12
0.6
3
0.4
Iran
1
0.0
0
0.0
Ireland
0
0.0
0
0.0
Israel
0
0.0
0
0.0
Italy
1
0.0
1
0.1
Ivory Coast
1
0.0
0
0.0
Japan
5
0.2
2
0.3
Kenya
2
0.1
0
0.0
Libya
2
0.1
0
0.0
Malaysia
5
0.2
4
0.6
Mauritius
0
0.0
0
0.0
Mexico
2
0.1
1
0.1
Nepal
2
0.1
1
0.1
The Netherlands
3
0.1
1
0.1
New Zealand
7
0.3
1
0.1
Nigeria
4
0.2
2
0.3
Pakistan
0
0.0
0
0.0
Philippines
1
0.0
1
0.1
Poland
1
0.0
0
0.0
People's Republic
of China ?
78
3.6
21
3.0
Romania
0
0.0
0
0.0
..continued...
19
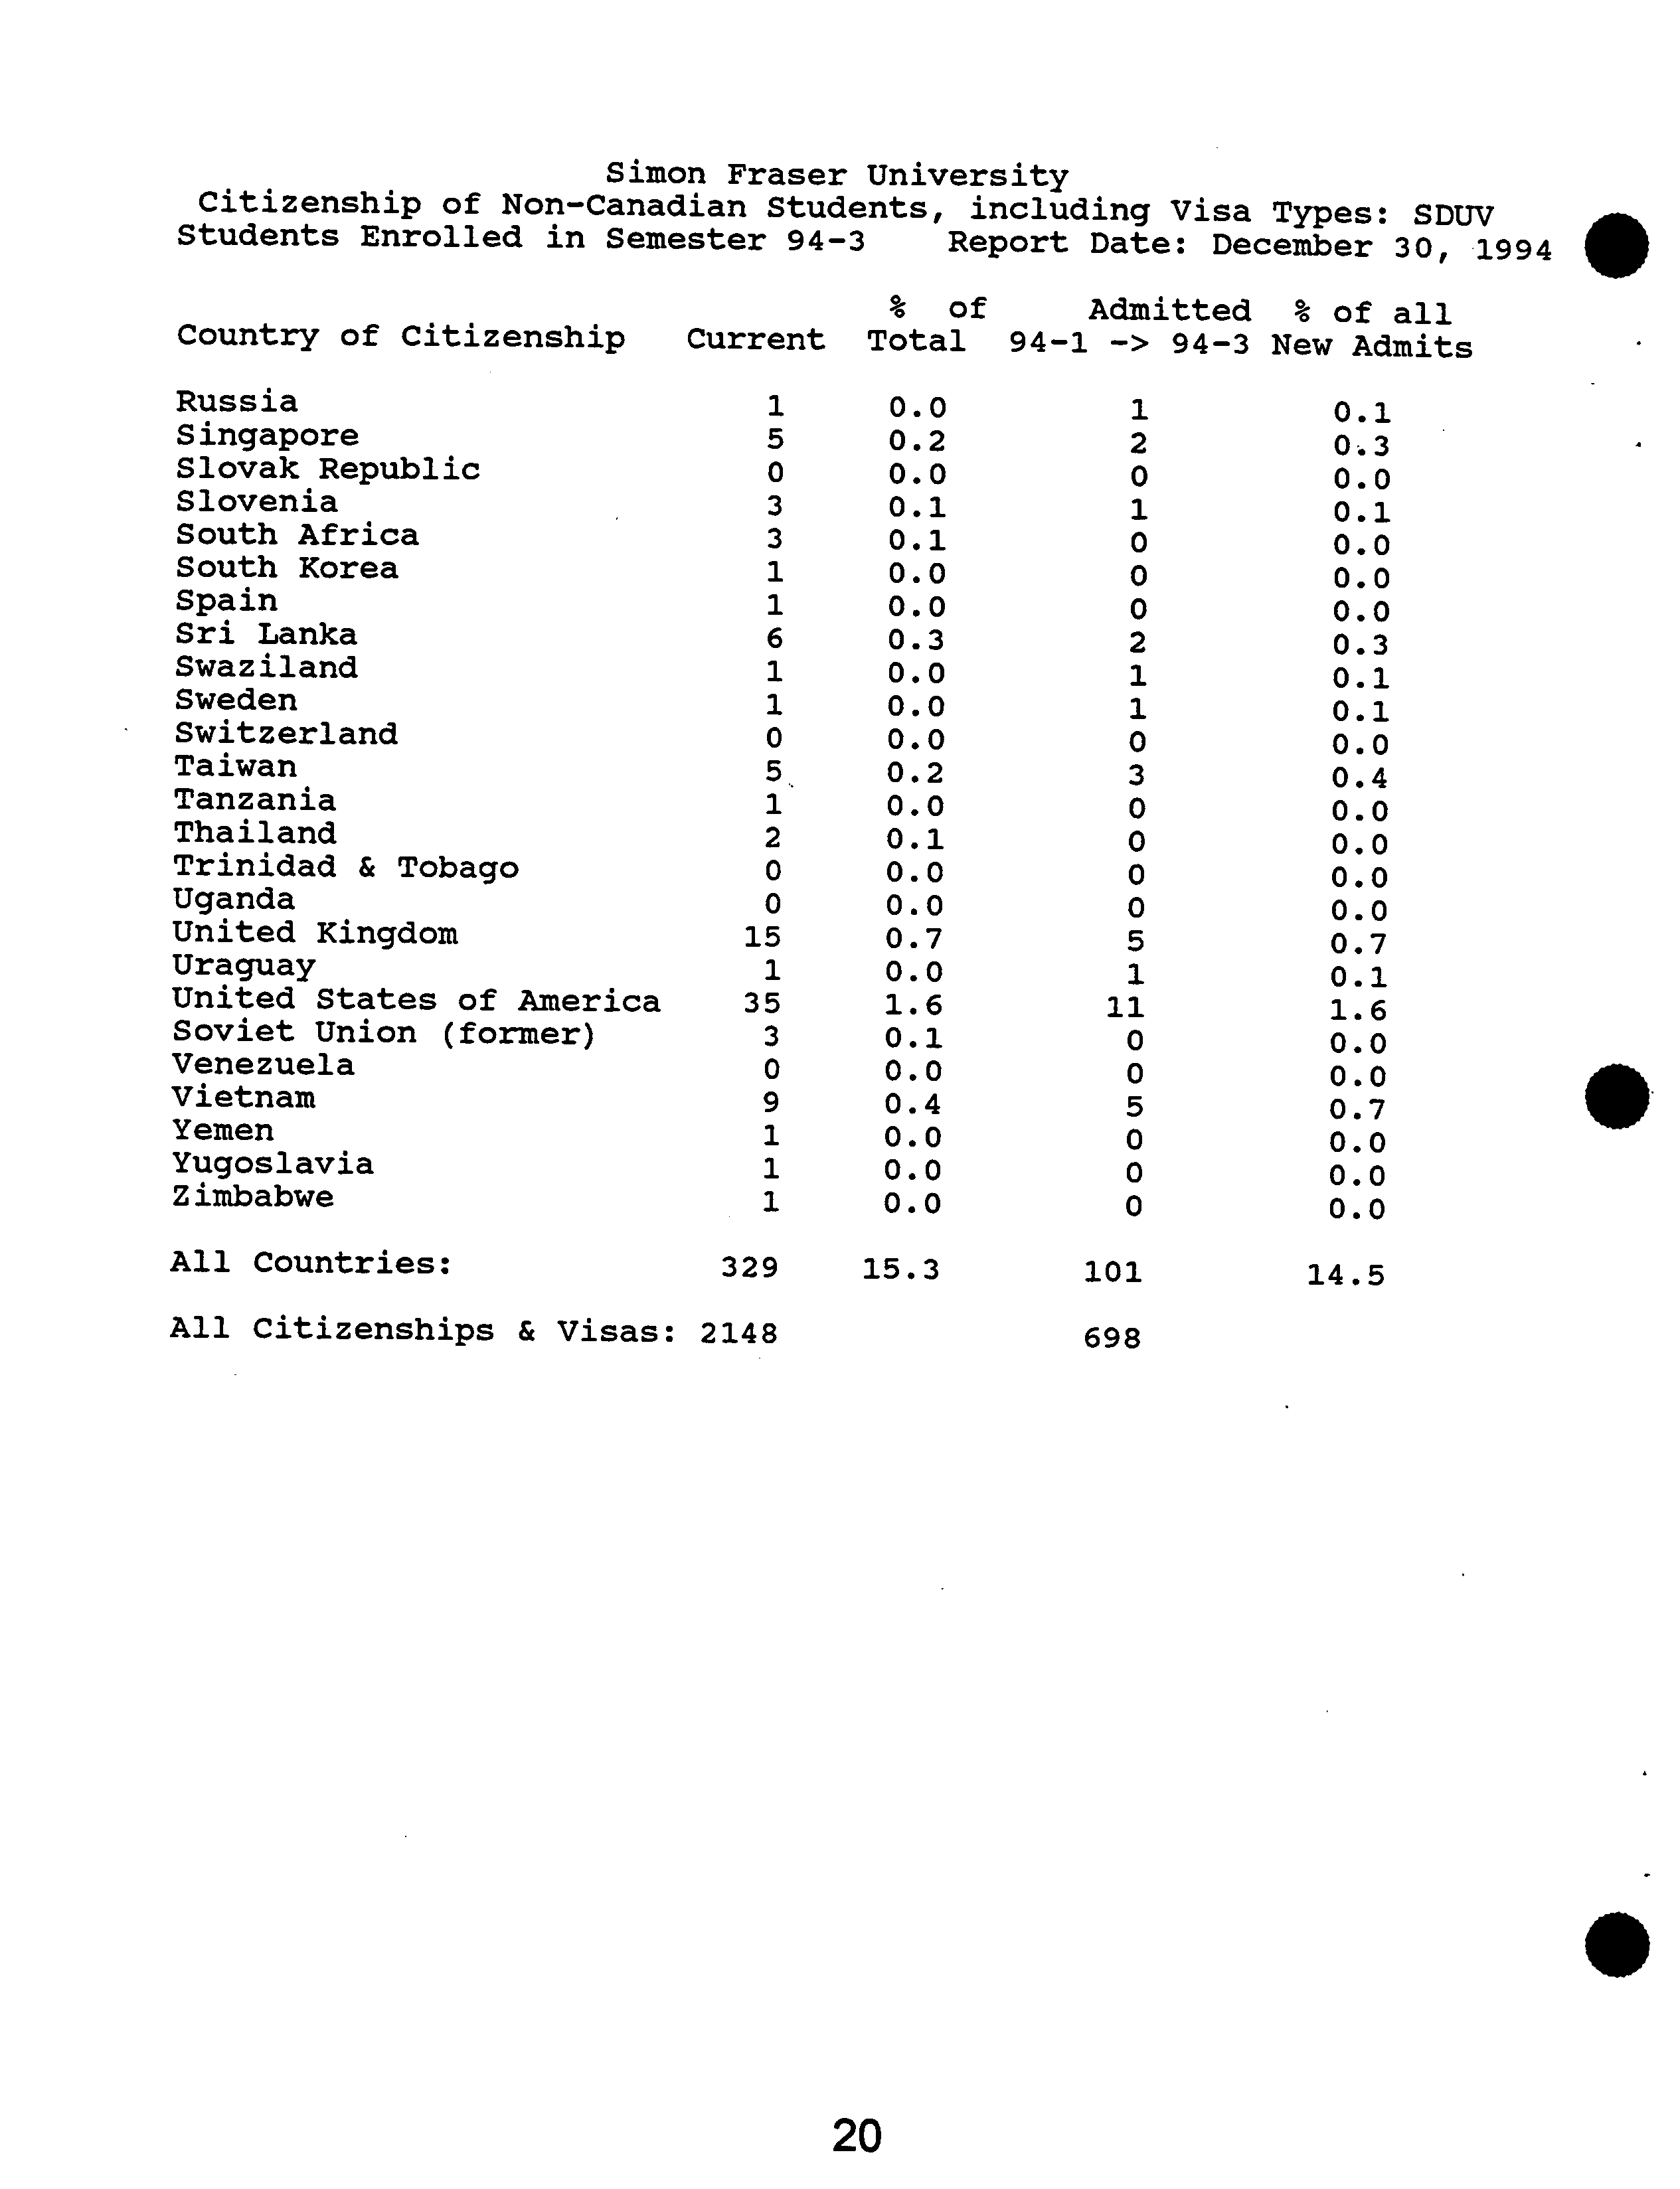
Simon Fraser University
Citizenship of Non-Canadian Students, including Visa Types: SDUV
Students Enrolled in Semester 94-3
?
Report Date: December 30, 1994
% ?
of
Admitted
% of all
Country of Citizenship
Current
Total
94-1 -> 94-3
New Admits
VietnamVenezuelaUnited
YugoslaviaUraguayUnited
YemenZimbabweUgandaSoviet
Trinidad
TanzaniaThailandTaiwanSwitzerlandSwedenSwazilandRussiaSpainSri
SloveniaSingaporeSouth
South
Slovak
LankaAfricaKoreaUnion
States
KingdomRepublic&
Tobago(former)of
America
3515
19
11
1
3
o02
51
0o161
3
1
5
1
3
0i
0.00.00.00.40.10.01.60.70.00.10.00.00.00.20.00.00.00.30.00.10.20.00.10.00.0
11
00
5
000
510
30
000
1
2
100200
1
1
0.0
0.0
0.7
0.0
0.0
1.6
0.0
0.7
0.1
0.0
0.0
0.0
0.0
0.0
0.4
0.1
0.1
0.0
0.0
0.3
0.0
0.1
0.0
0.3
0.1
All Countries:
329
15.3
101
14.5
All Citizenships & Visas:
2148
698
.
.
20
O
?
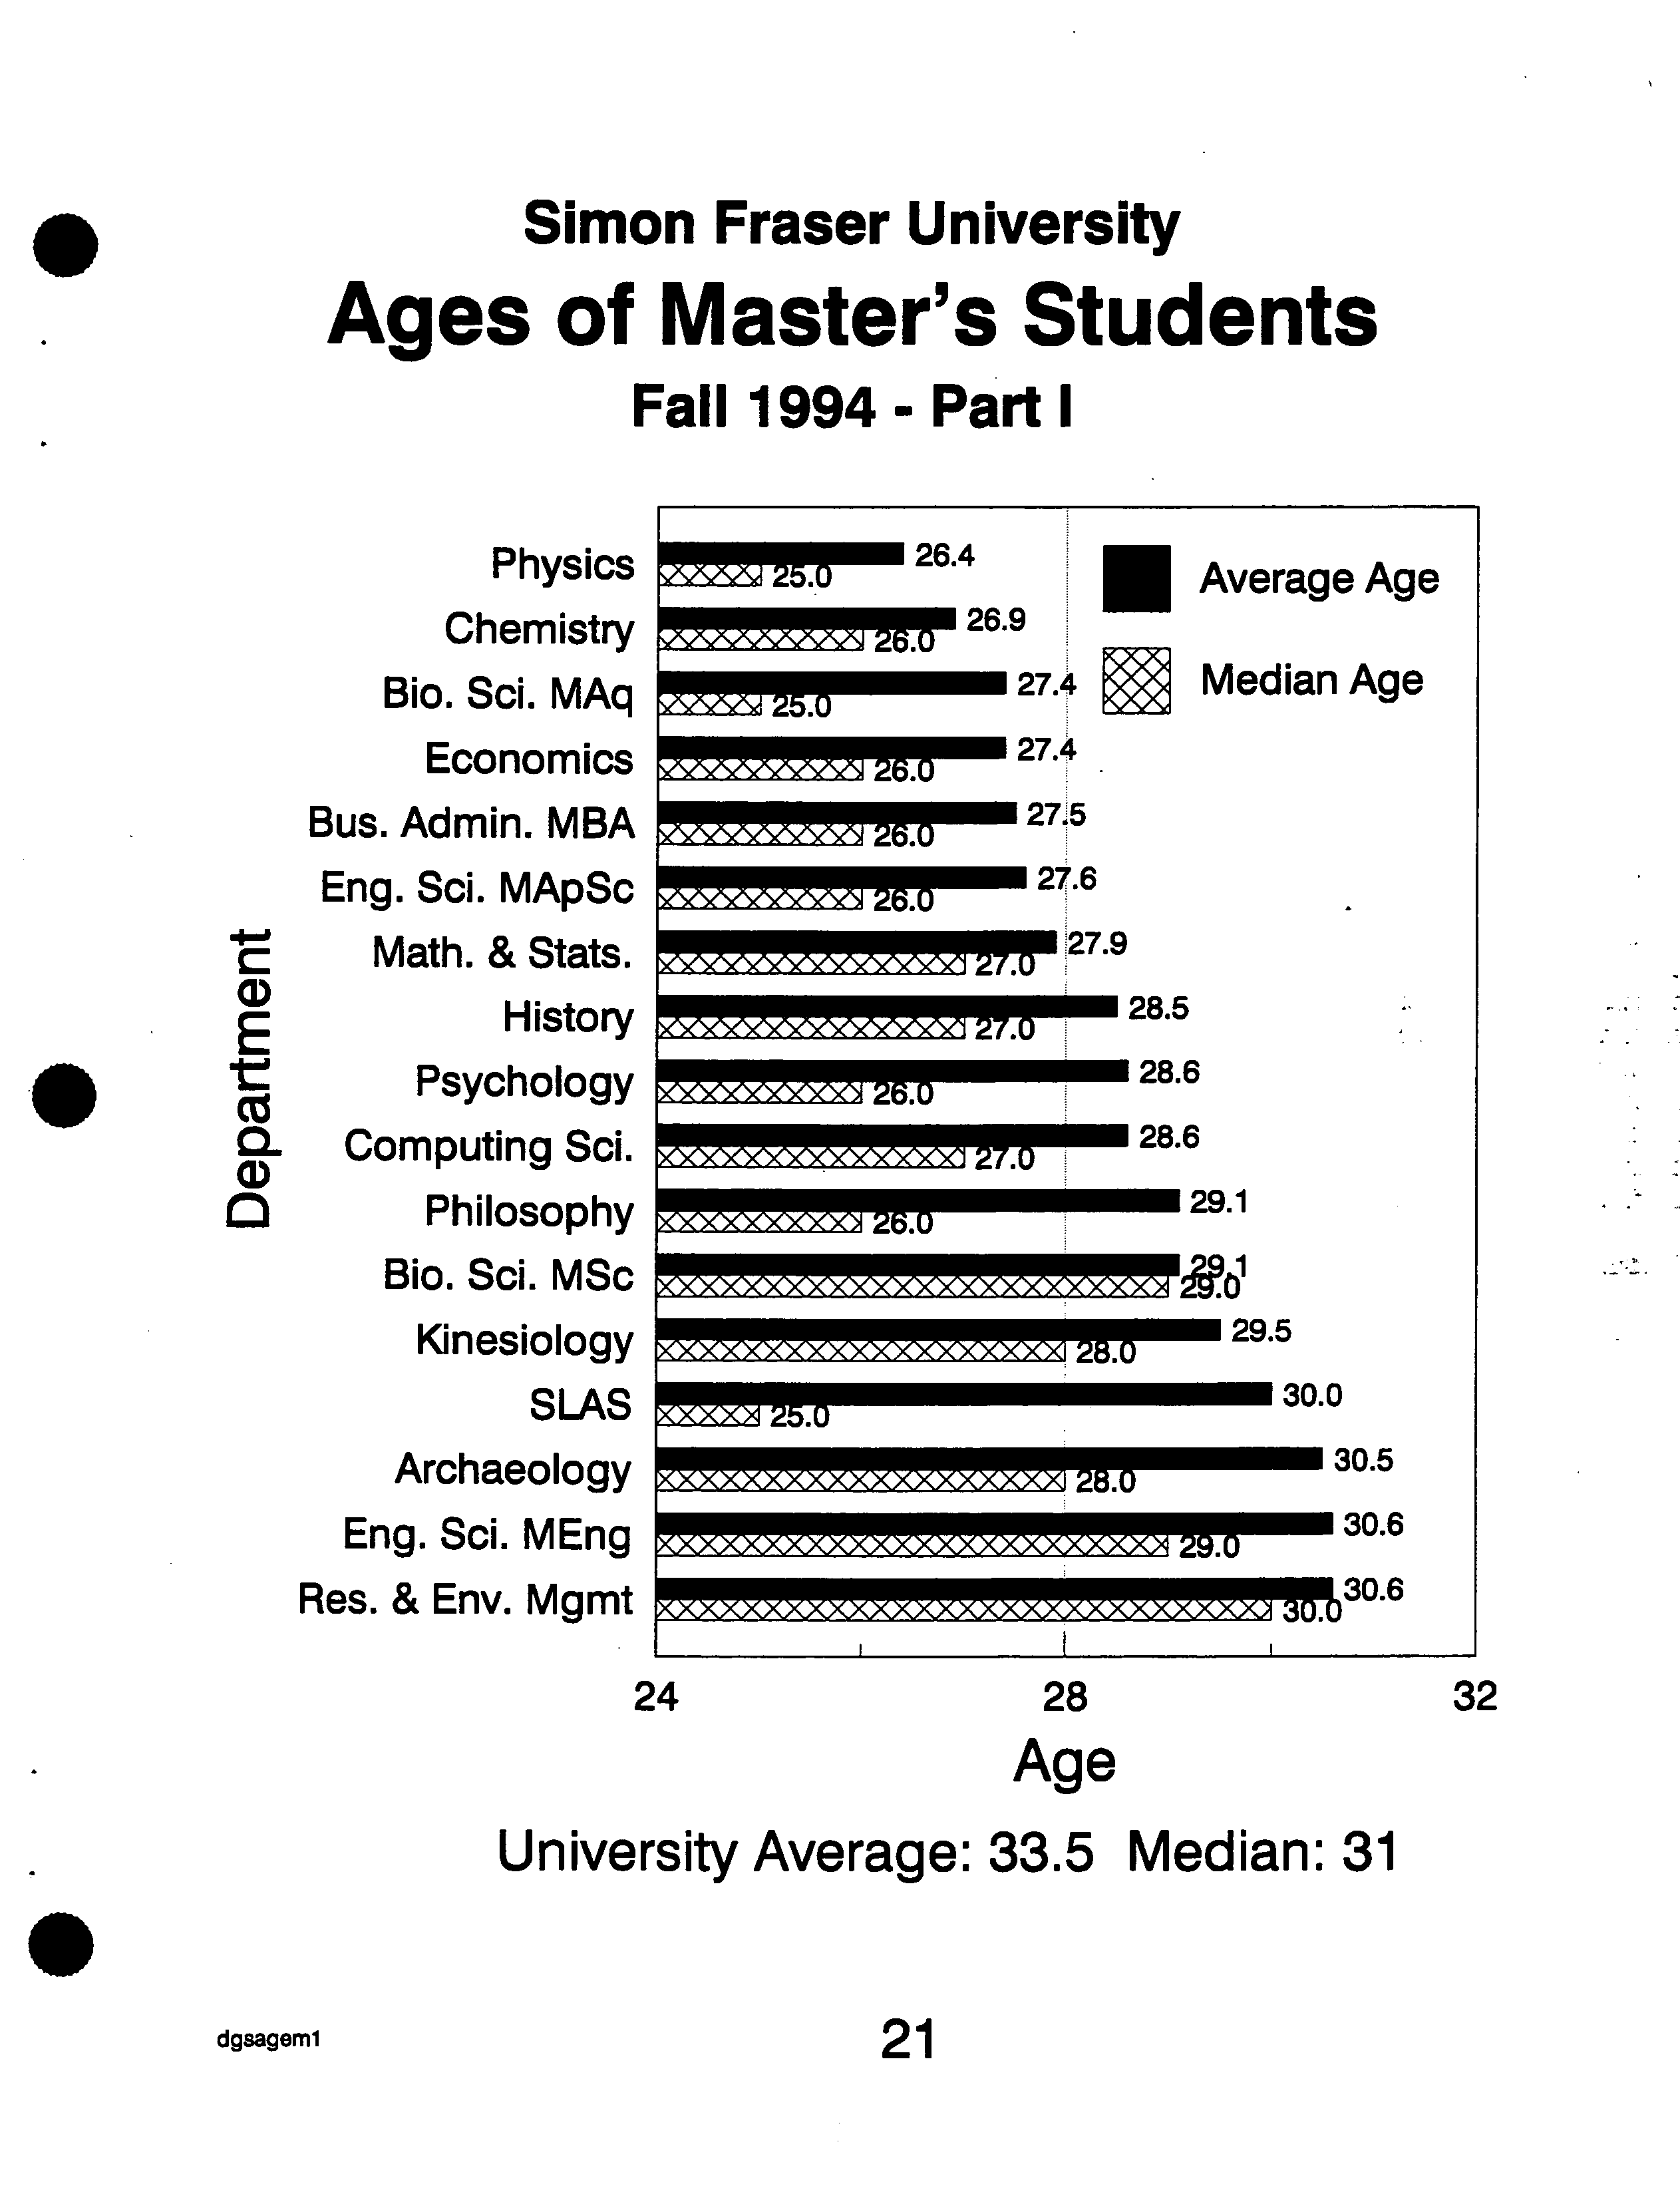
Simon Fraser University
•
?
Ages of Master's Students
Fall 1994- Part l
26.4
Average Age
1026.9
27.4
?
Median Age
27.4
275
Physics
Chemistry
Bio. Sci. MAq
Economics
Bus. Admin. MBA
Eng. Sci. MApSc
Math. & Stats.
History
Psychology
cz
-
Computing Sci.
0
Philosophy
Bio. Sd. MSc
Kinesiology
SLAS
Archaeology
Eng. Sci. MEng
Res. &
Env. Mgmt
27.9
— 28.5
28.6
28.6
29.1
?
128.0 ?
29.5
30.0
?
28.0 ?
30.5
)00004
29.0
?
30.6
-- _30.6
24
?
28
?
32
Age
University Average: 33.5 Median: 31
dgsageml ?
21
0
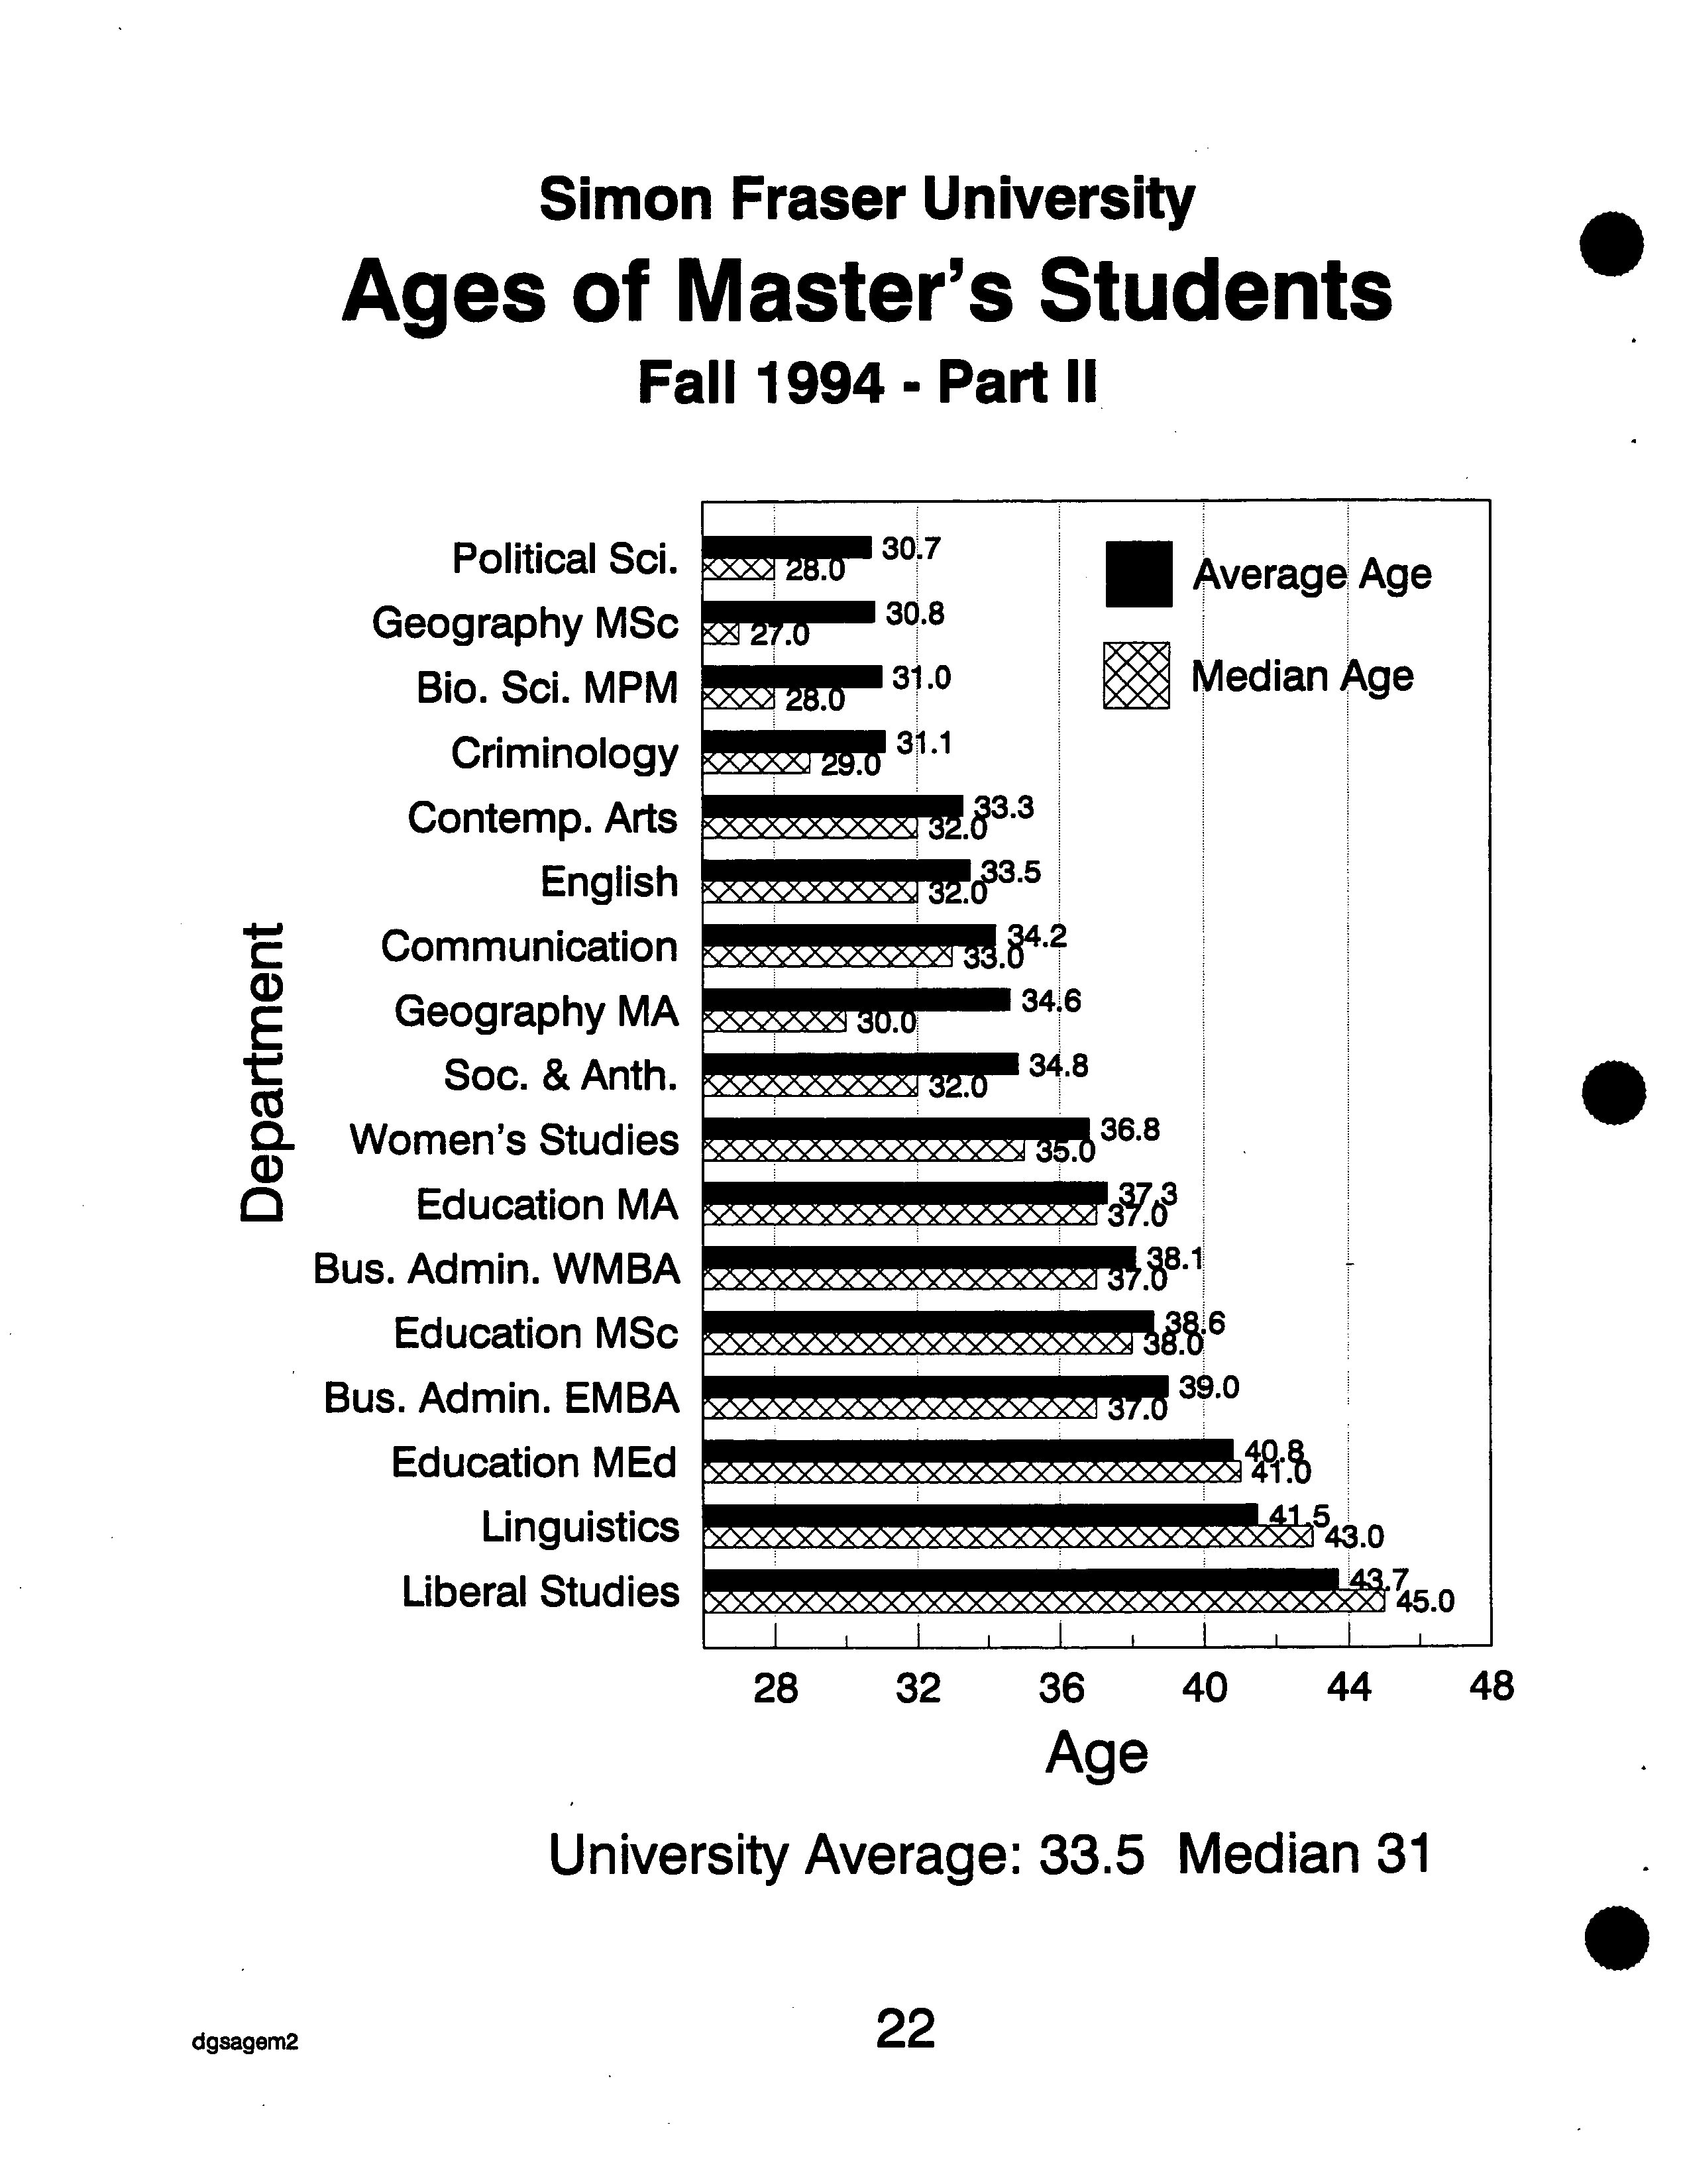
Simon Fraser University
Ages of Master's Students
Fall 1994- Part II
S
Political Sci.
Geography MSc
Bio. Sci. MPM
Criminology
Contemp. Arts
English
Communication
a)
E ?
Geography MA
I
cz
t ?
Soc. & Anth.
CL Women's Studies
0 ?
Education MA
Bus. Admin. WMBA
Education MSc
Bus. Admin. EMBA
Education MEd
Linguistics
Liberal Studies
S
28 ?
32 ?
36 ?
40
?
44
?
48
Age
University Average: 33.5 Median 31
.
dgsagem2
?
22
Chemistry
Computing Sci.
•
?
Math.&Stats.
Physics
Kinesiology
Engineering Sci.
Biological Sd.
Economics
Psychology
E
Criminology
CO
Res. & Env. Mgmt
CL
Philosophy
Geography
English
Soc. &
Anth.
Linguistics
History
Communication
Archaeology
Education
SpI. Arrangemnts
.
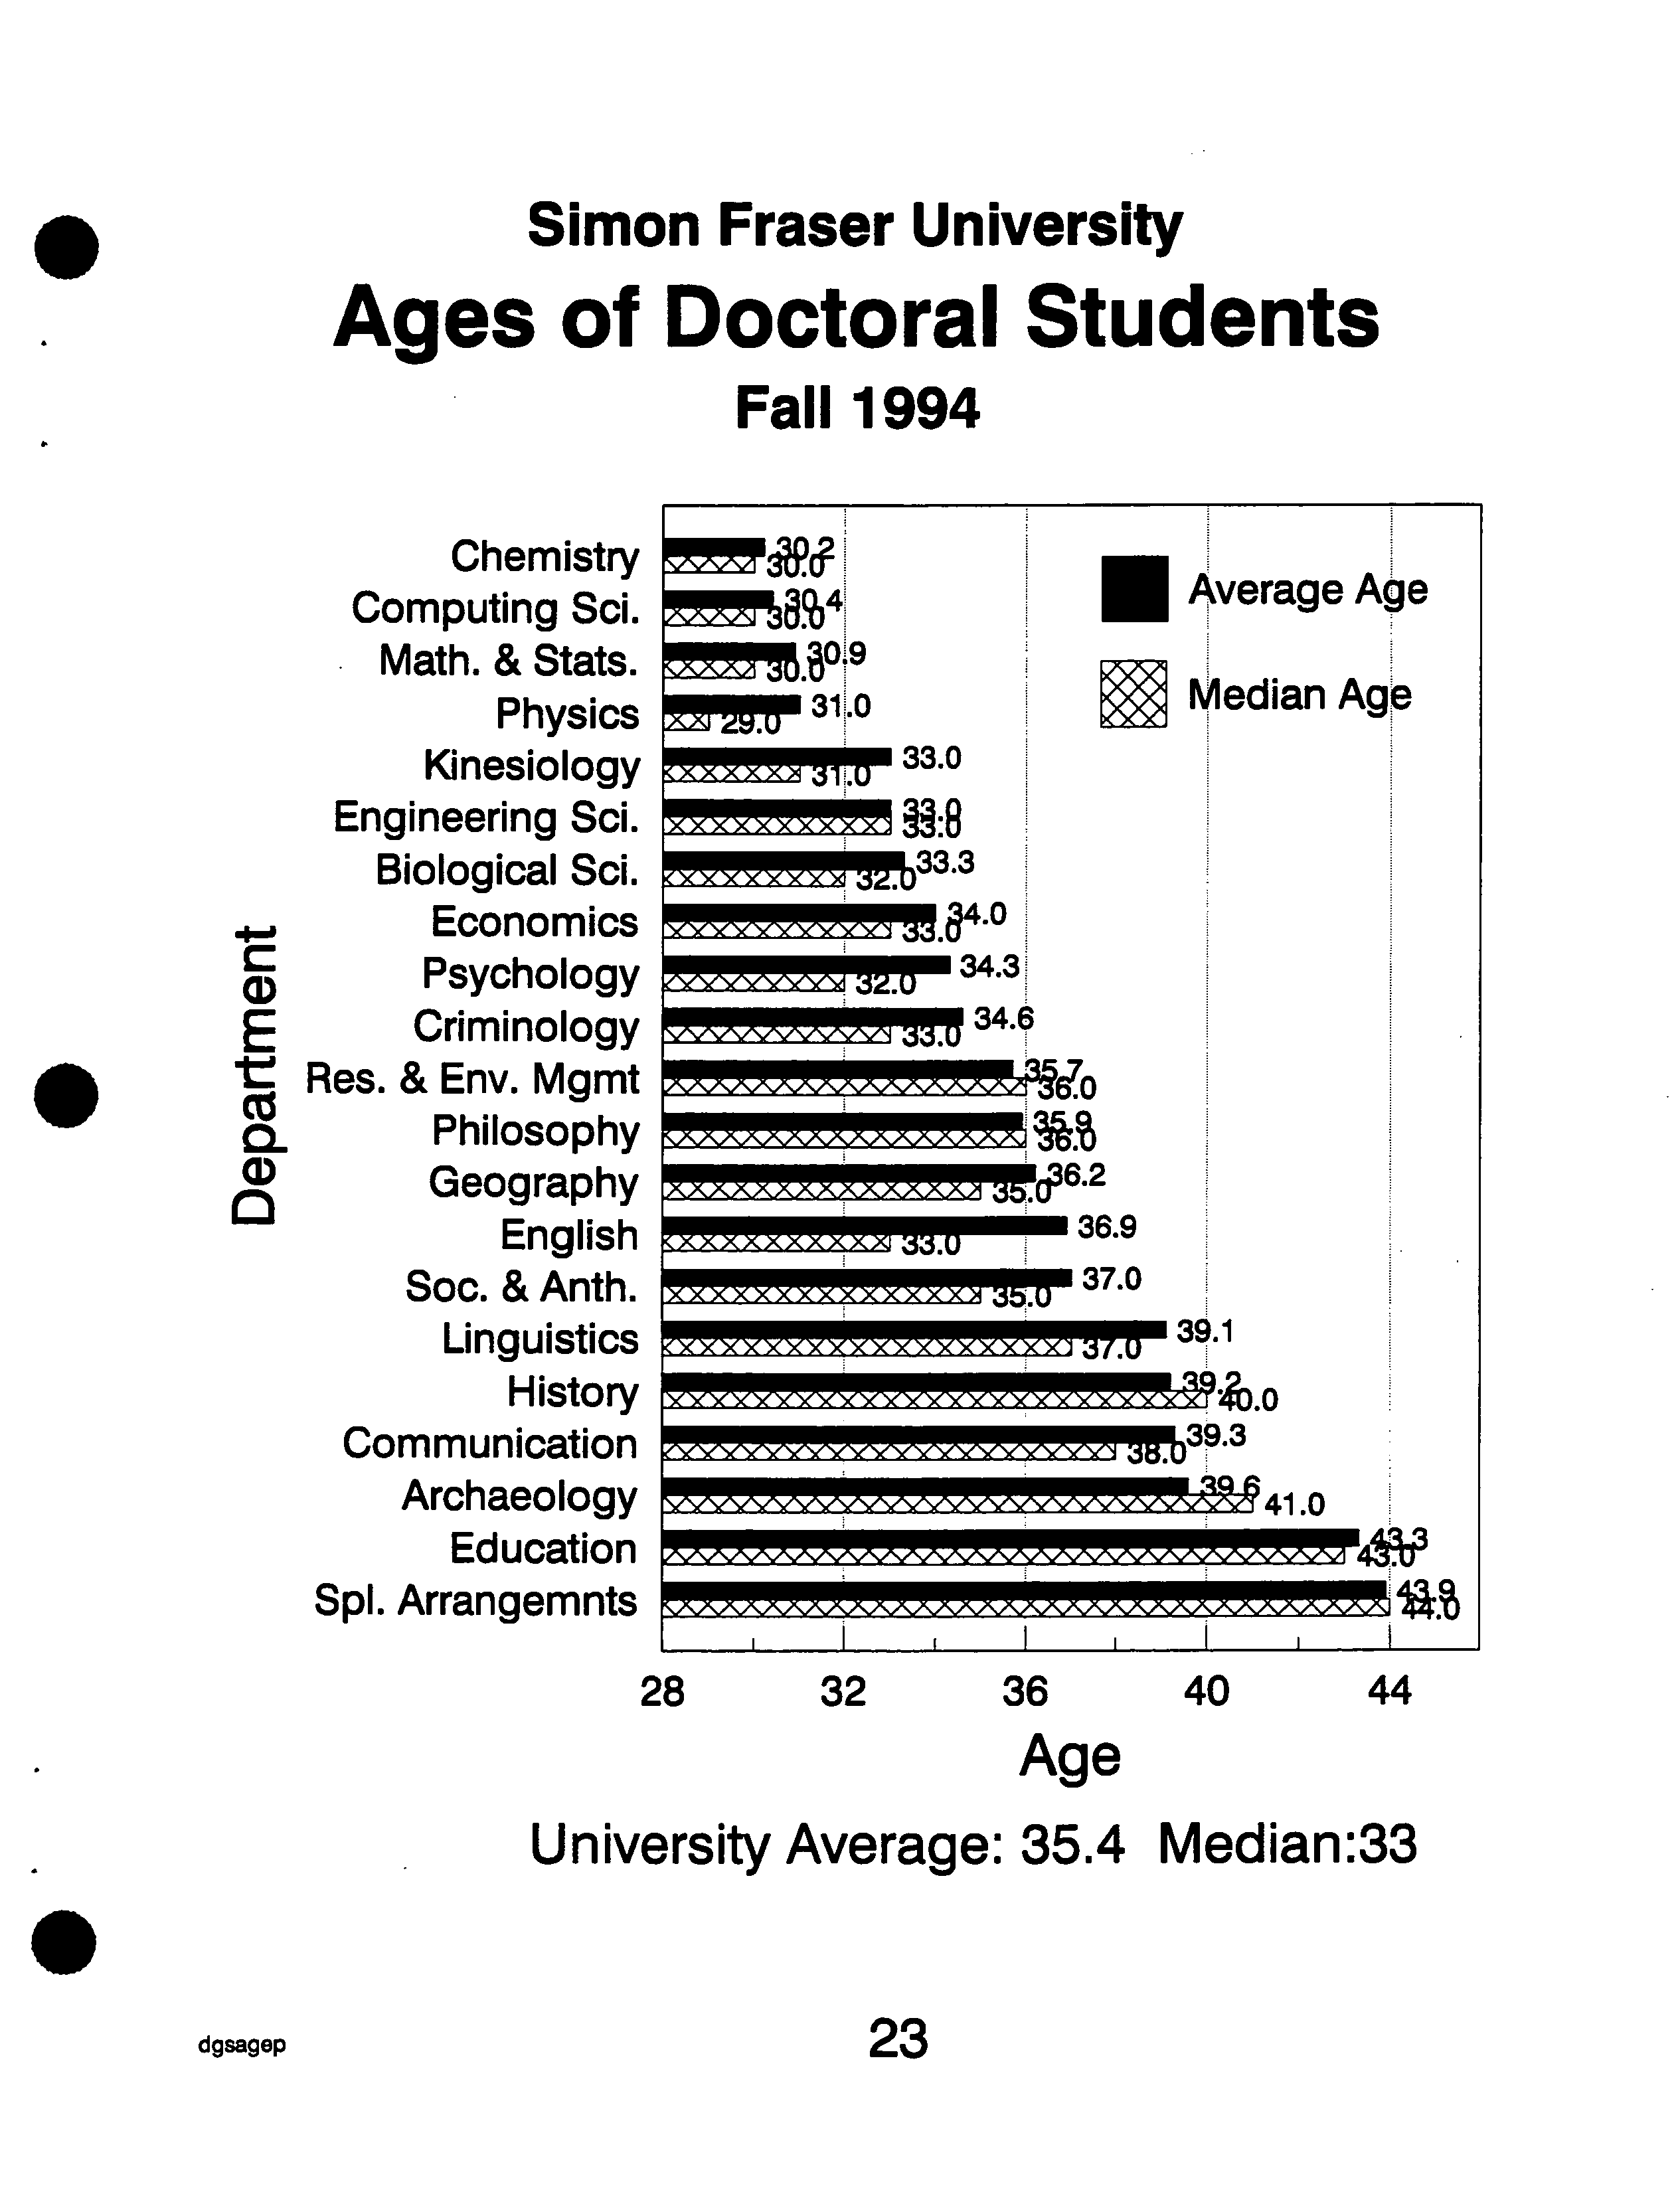
Simon Fraser University
Ages of Doctoral Students
Fall 1994
28
?
32
?
36
?
40 ?
44
Age
University Average: 35.4 Median:33
dgsagep ?
23
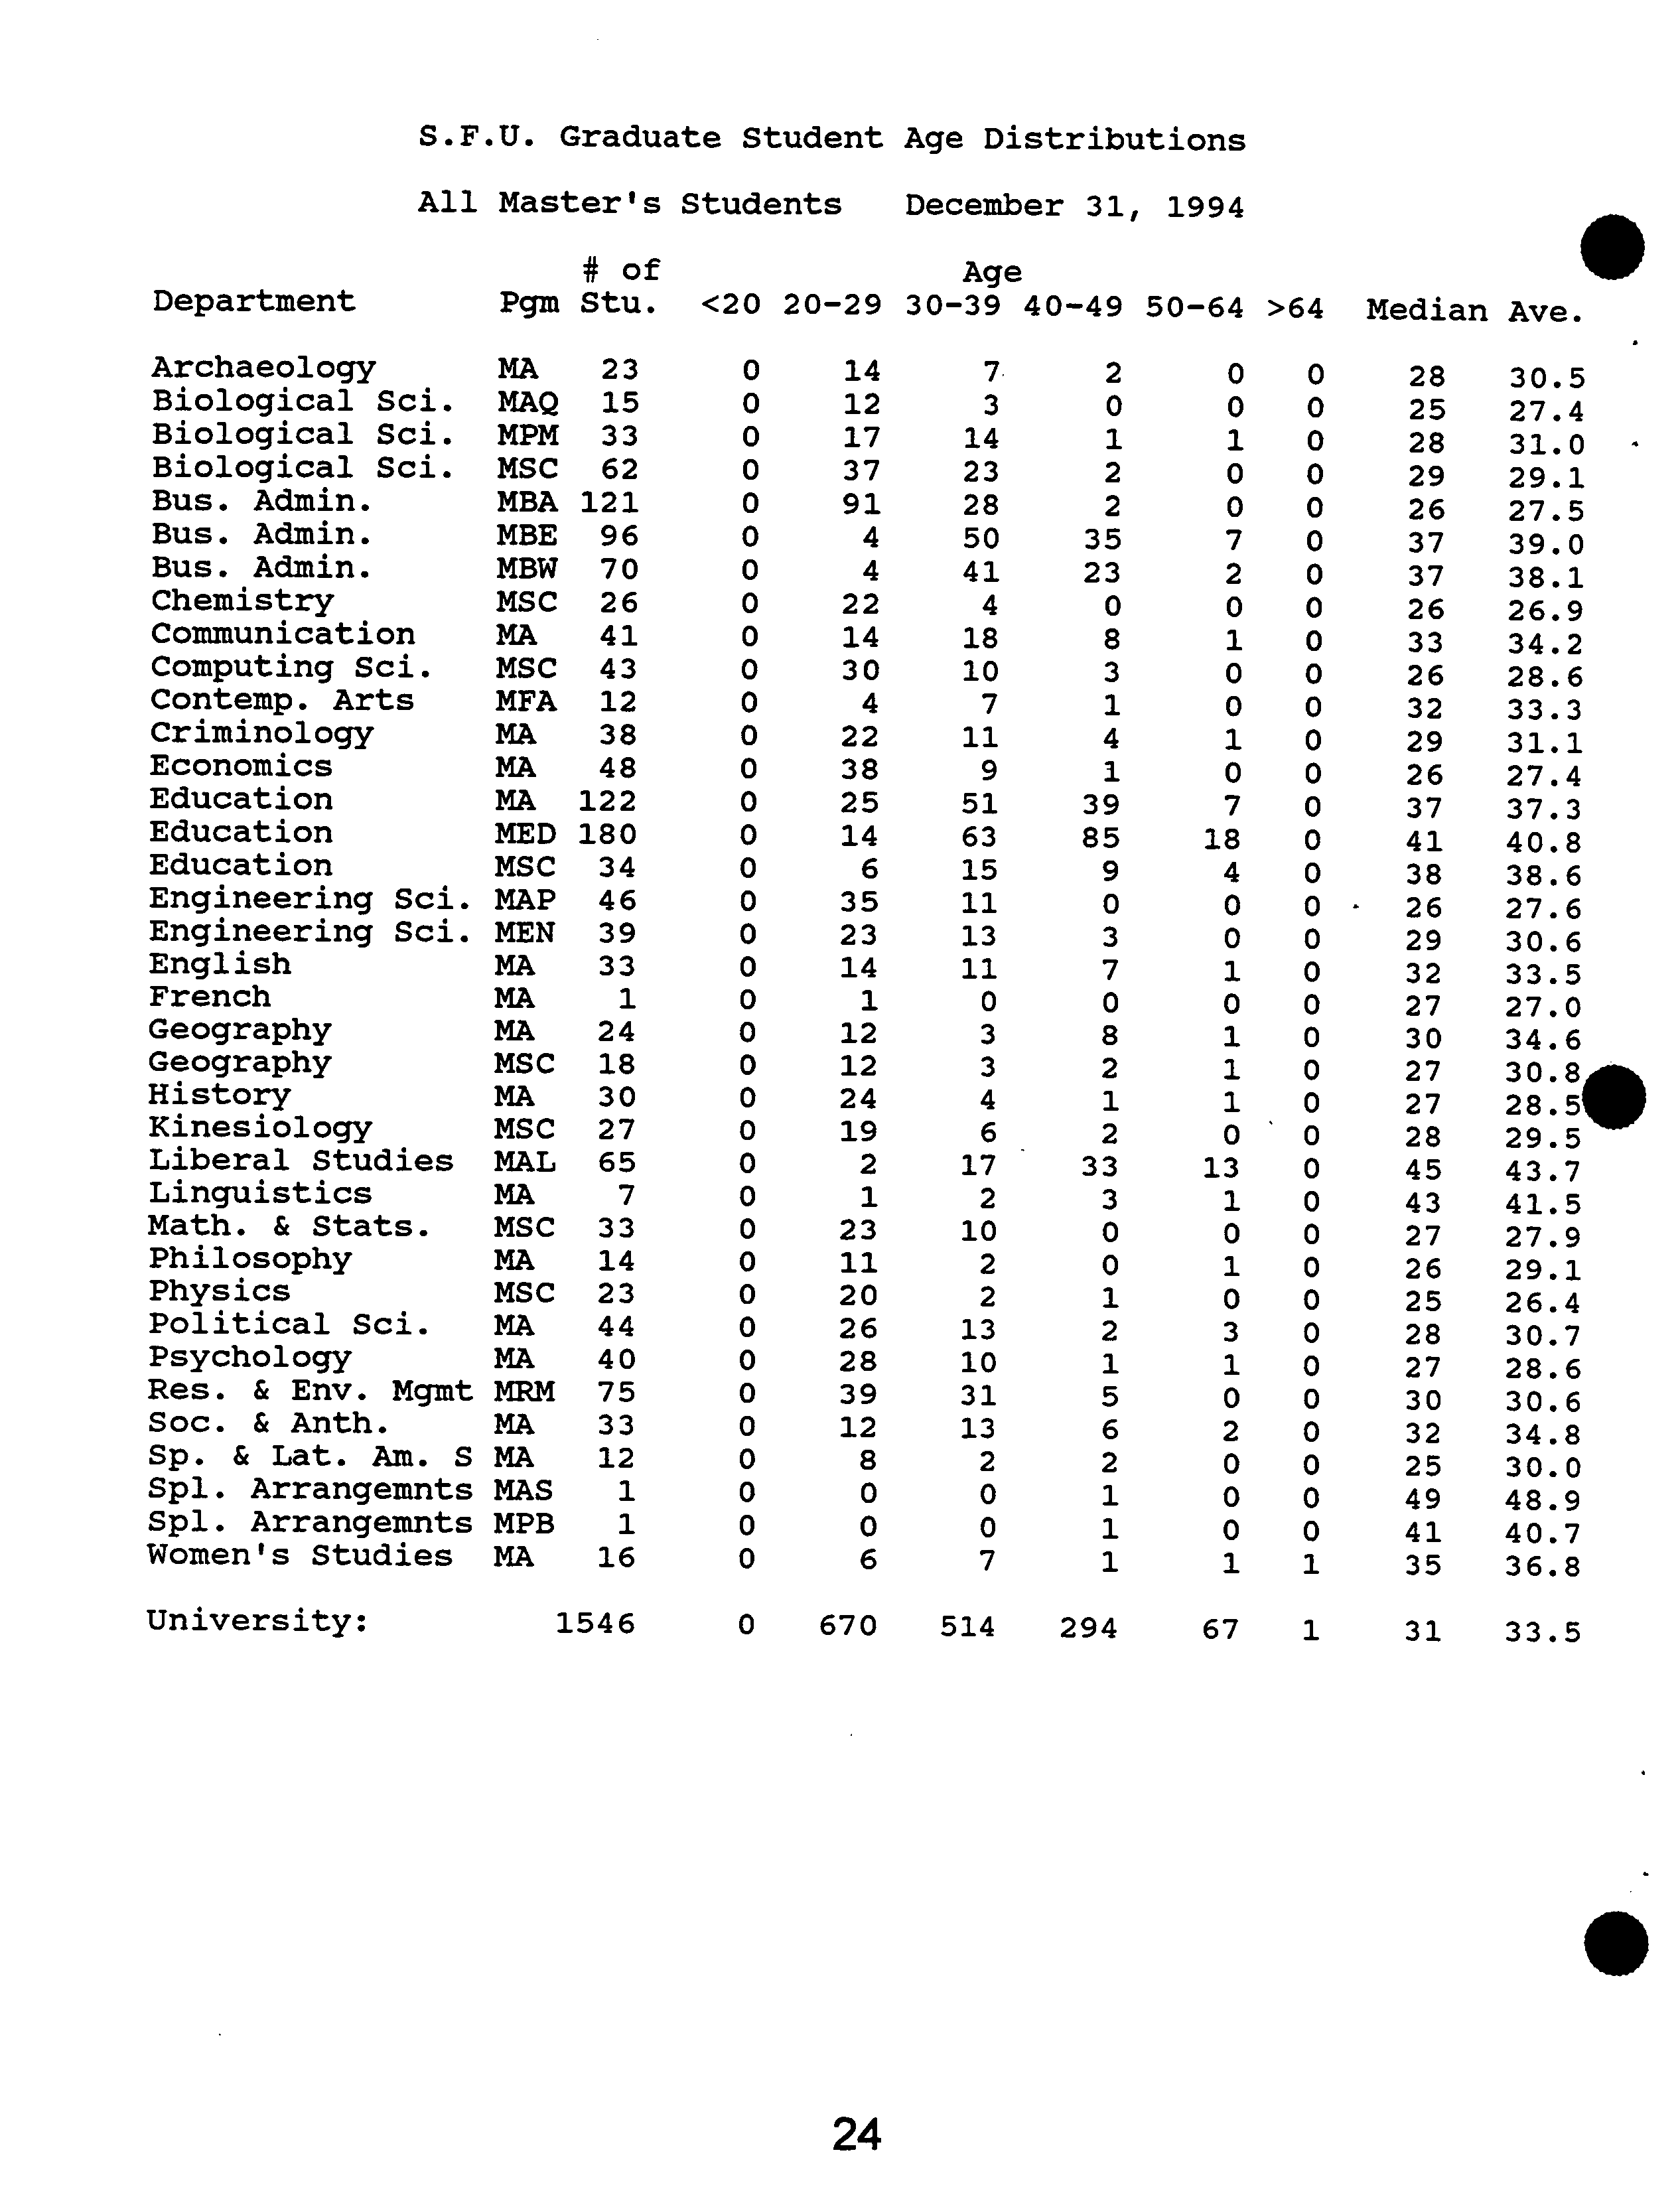
S.F.U. Graduate Student Age Distributions
All
Master's
#of
Students
December
Age
31,
1994
0
Department
Pgm Stu.
<20
20-29
30-39
40-49
50-64
>64
Median
Ave.
Women's
Math.
Res.
Spi.
Spi.
HistoryEnglish
Political
Engineering
KinesiologyEducationSp.
GeographyPsychology
Soc.
Engineering
PhysicsGeographyPhilosophyLinguisticsEducationEducationEconomicsFrenchLiberal
ArchaeologyCriminologyContemp.
CommunicationComputing
Bus.
Biological
Chemistry
Bus.
Bus.
Biological
Biological
&
Arrangexnnts
&
Arrangemnts&
Admin.Admin.Admin.&
Lat.
Anth.
Env.
Stats.StudiesStudiesArtsSci.Sci.Sci.Am.
Sci.Sci.Sci.Mgmt
Sd.
S
MPBMAMAMAMAMA
MAS
MRMMAMSCMALMSCMAMAMSCMAMAMSCMSCMAPMEDMENMAMFA
MA
MAMAMAMSCMSCMBWMBEMPMMSCMBAMAMAQ
180122121
40
44242375
12
30
33
65
33
46
27161439334834184338
41
2670
12
96
33236215
11
71
0000000000
0
00000
0
00
0
000
0
00
0
0000000000
28202326
23392412
3511
12121914
25
142238
302291
1437121714
806
20
1
61
444
31
1313
111051
171011631513
1110
41
18
502328
14
72
22
04
0
2
6
33
7
0
94
3
7
33
85
392335
5
2
8
2
229
1
7
1
06
3
01
11
0
3
4101
3
8
1
2
2
0
1
2
0
1318
01
2
0
4
3
0
1
0011
1
00
1
0
1
71000
107
2
00101000
01000000000
0000
0
00
0
00
000000
0
000000000
41
492727352525282726452827274330292630
32
41
32
3829
26
37
26
3233
2629
3728
26
3728
25
48.9
40.7
36.8
27.6
28.5
26.4
28.6
27.9
30.8
29.1
41.5
29.5
34.6
27.0
43.7
33.5
30.0
34.8
30.7
30.6
38.6
30.6
40.8
27.4
37.3
28.6
31.1
33.3
26.9
34.2
39.0
29.1
27.5
38.1
27.4
31.0
30.5
University:
1546
0
670
514
294
67
1
31
33.5
S
24
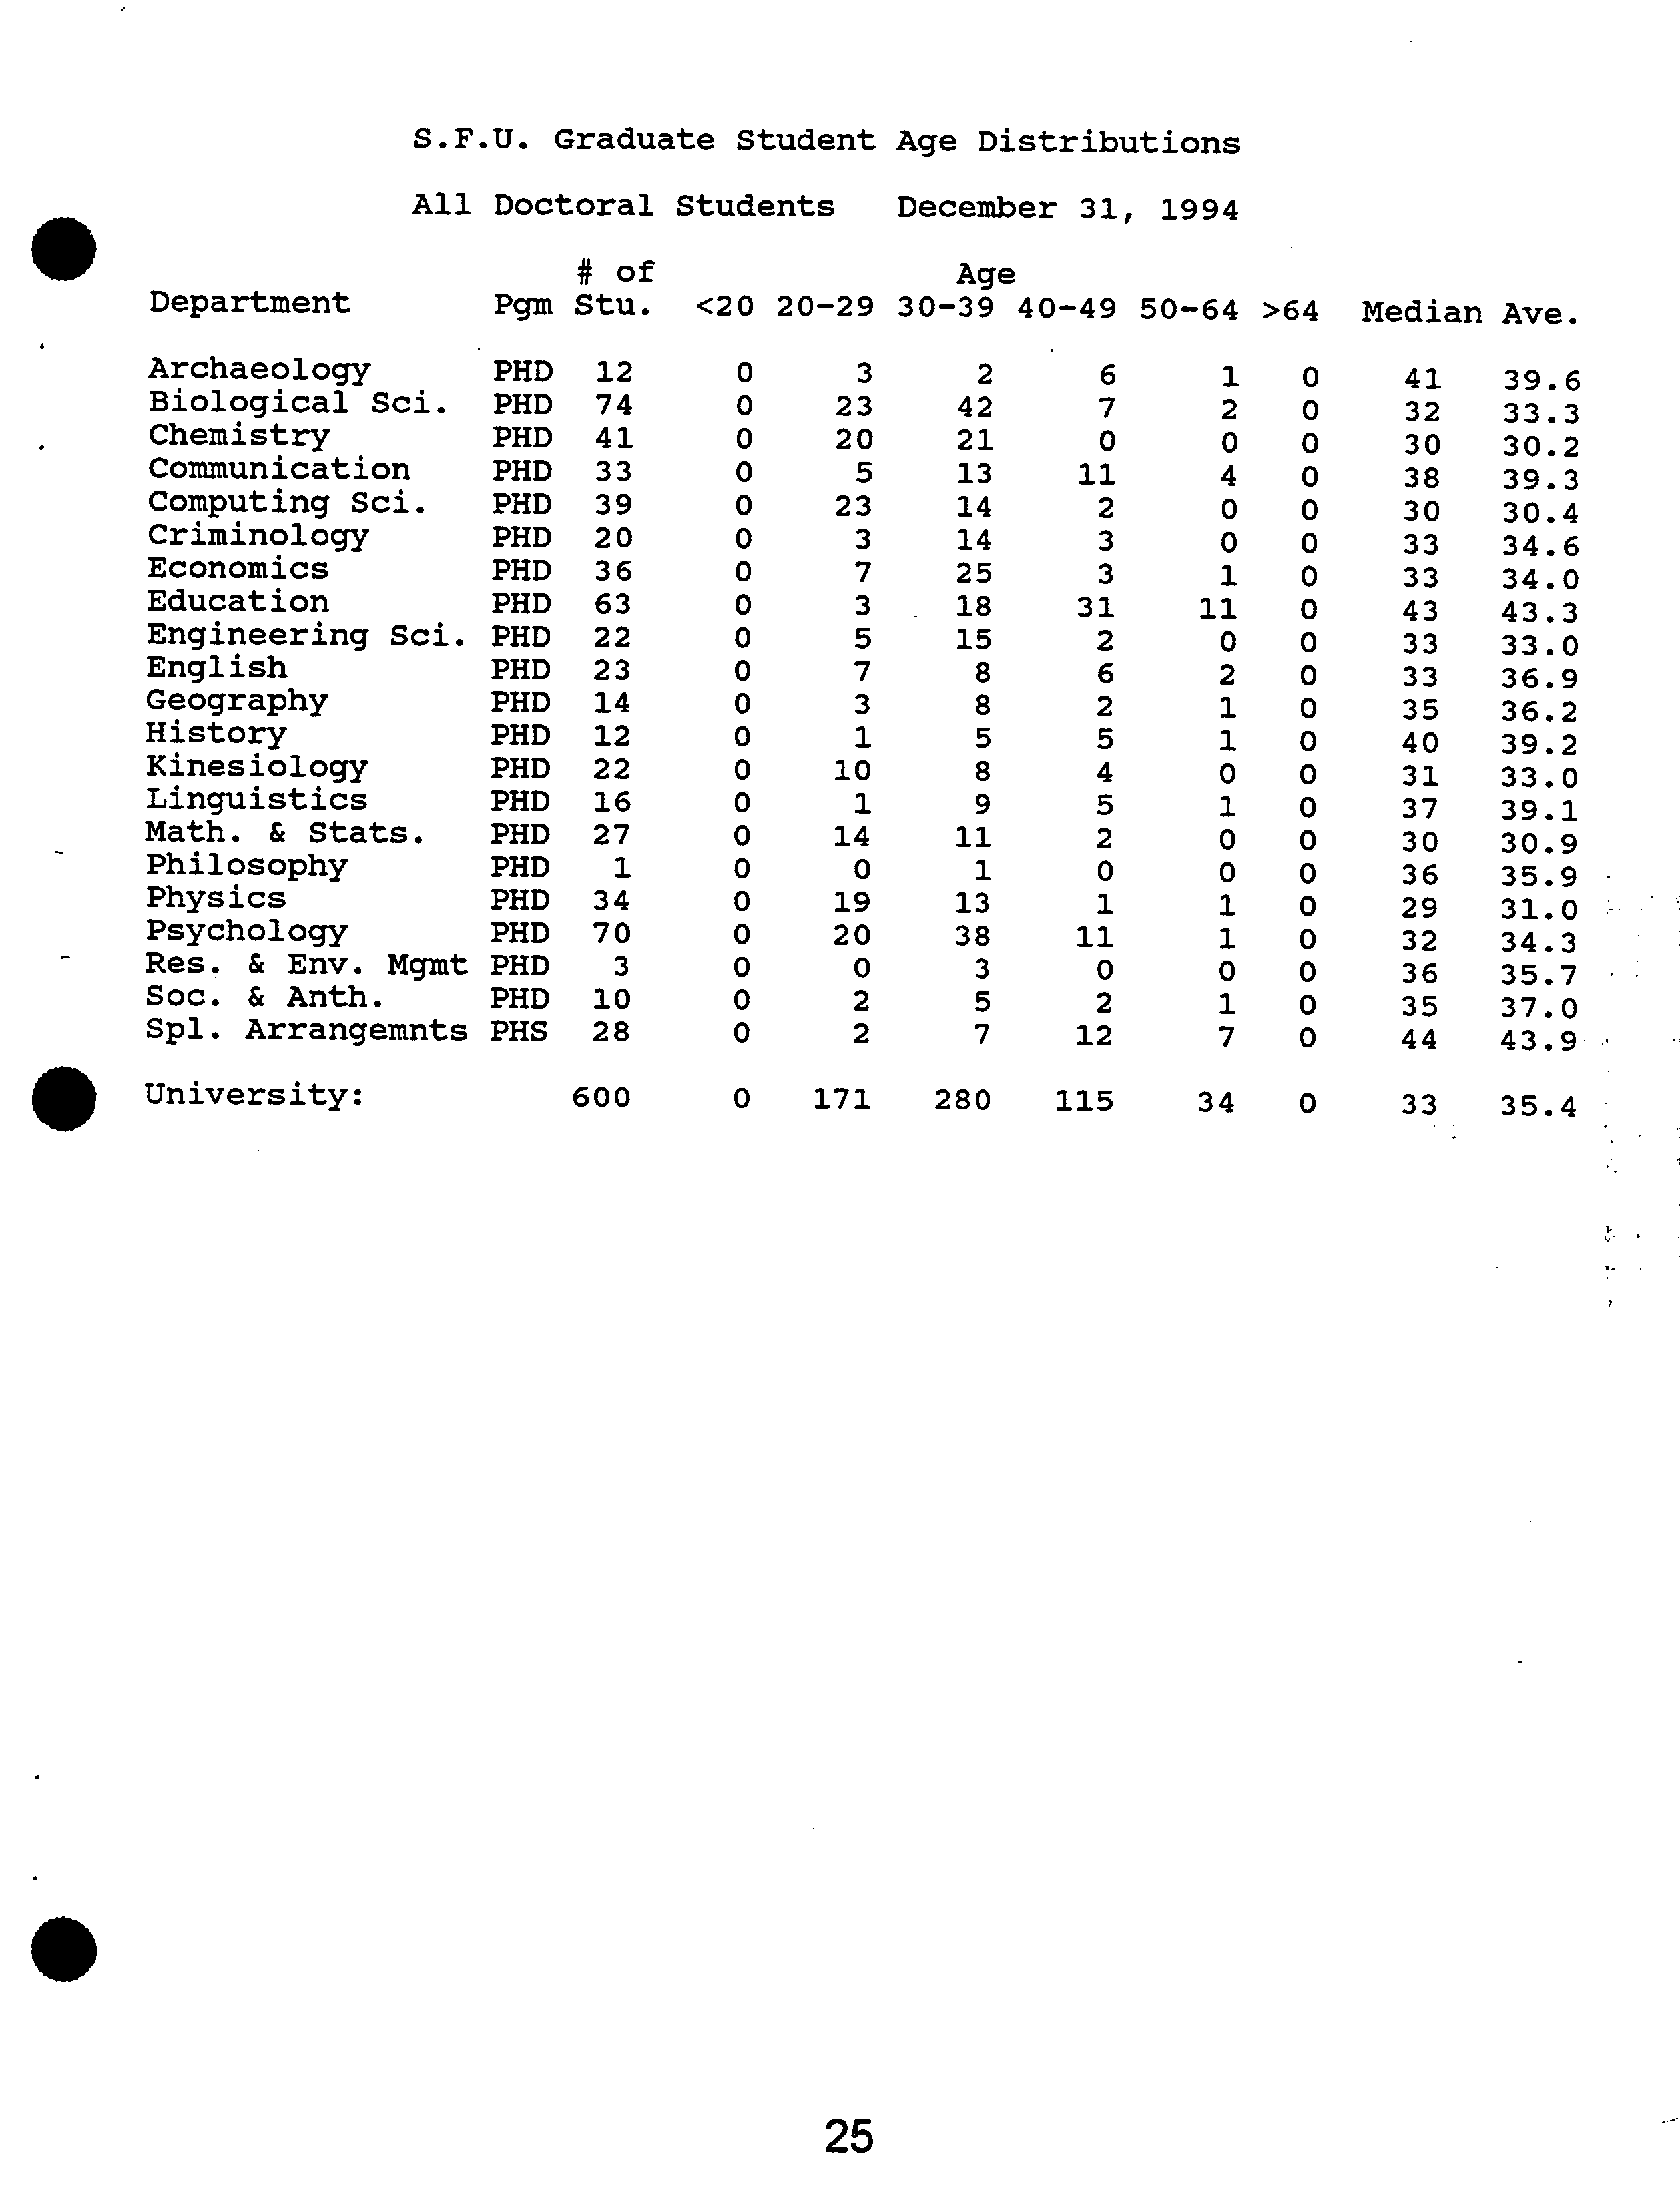
S.F.U.
Graduate Student
Age Distributions
All
Doctoral
Students
December
31,
1994
#of
Age
Department
Pgm Stu.
<20
20-29
30-39
40-49
50-64
>64
Median
Ave.
Archaeology
Biological Sci.
PHDPHD
74
12
0
0
23
3
42
2
7
6
2
1
00
41
32
33.3
39.6
•
Math.
Res.
HistoryPsychologyEnglishSpl.
Soc.
PhysicsPhilosophyKinesiologyGeographyLinguisticsEducationEngineering
EconomicsComputing
CriminologyCommunicationChemistry&
&
Arrangemnts&
Anth.
Env.
Stats.Sci.Sci.Mgmt
PHDPHD
PHS
PHDPHDPHDPHDPHDPHDPHDPHDPHDPHDPHDPHDPHDPHDPHDPHD
7028
231022273422121663
20
1433
41
3639
3
1
00000000
0
0000000000
20
19141023
20
22
0701175
3
3
5
3
381113
2515
181414
21
13
7
515
8889
3
11
12
3111
22
5
2
2
1
04
5
6
0
3
2
3
0
11
70
1
2
111
0
0
1
00110
40
0
0
0000000
0
0000000000
4440352931363537
32
364330
333333
30
33
3038
43.9
33.0
35.9
34.3
35.7
39.1
37.0
30.9
31.0
36.9
36.2
39.2
43.3
33.0
34.6
34.0
39.3
30.4
30.2
University:
600
0
171
280
115
34
0
33
35.4
.
25
0
I
Math. & Stats.
Physics
Education
Computing Sd.
Kinesiology
Biological Sd.
Spi. Arrangemnts
E
Chemistry
C)
o
Cz
Communication
English
0..
Psychology
Economics
Lang. & Ling.
Criminology
History
Geography
Archaeology
Soc. &Anth.
Simon Fraser University
Doctoral Degree Completion
Fall 1985-Summer 1994
Times
.
12 13 14 15 16 17 18 19 20 21 22 23 24 25
Semesters to Completion
University Average: 16.99 Median: 16
.
dgstimp ?
28
Simon
Fraser
University
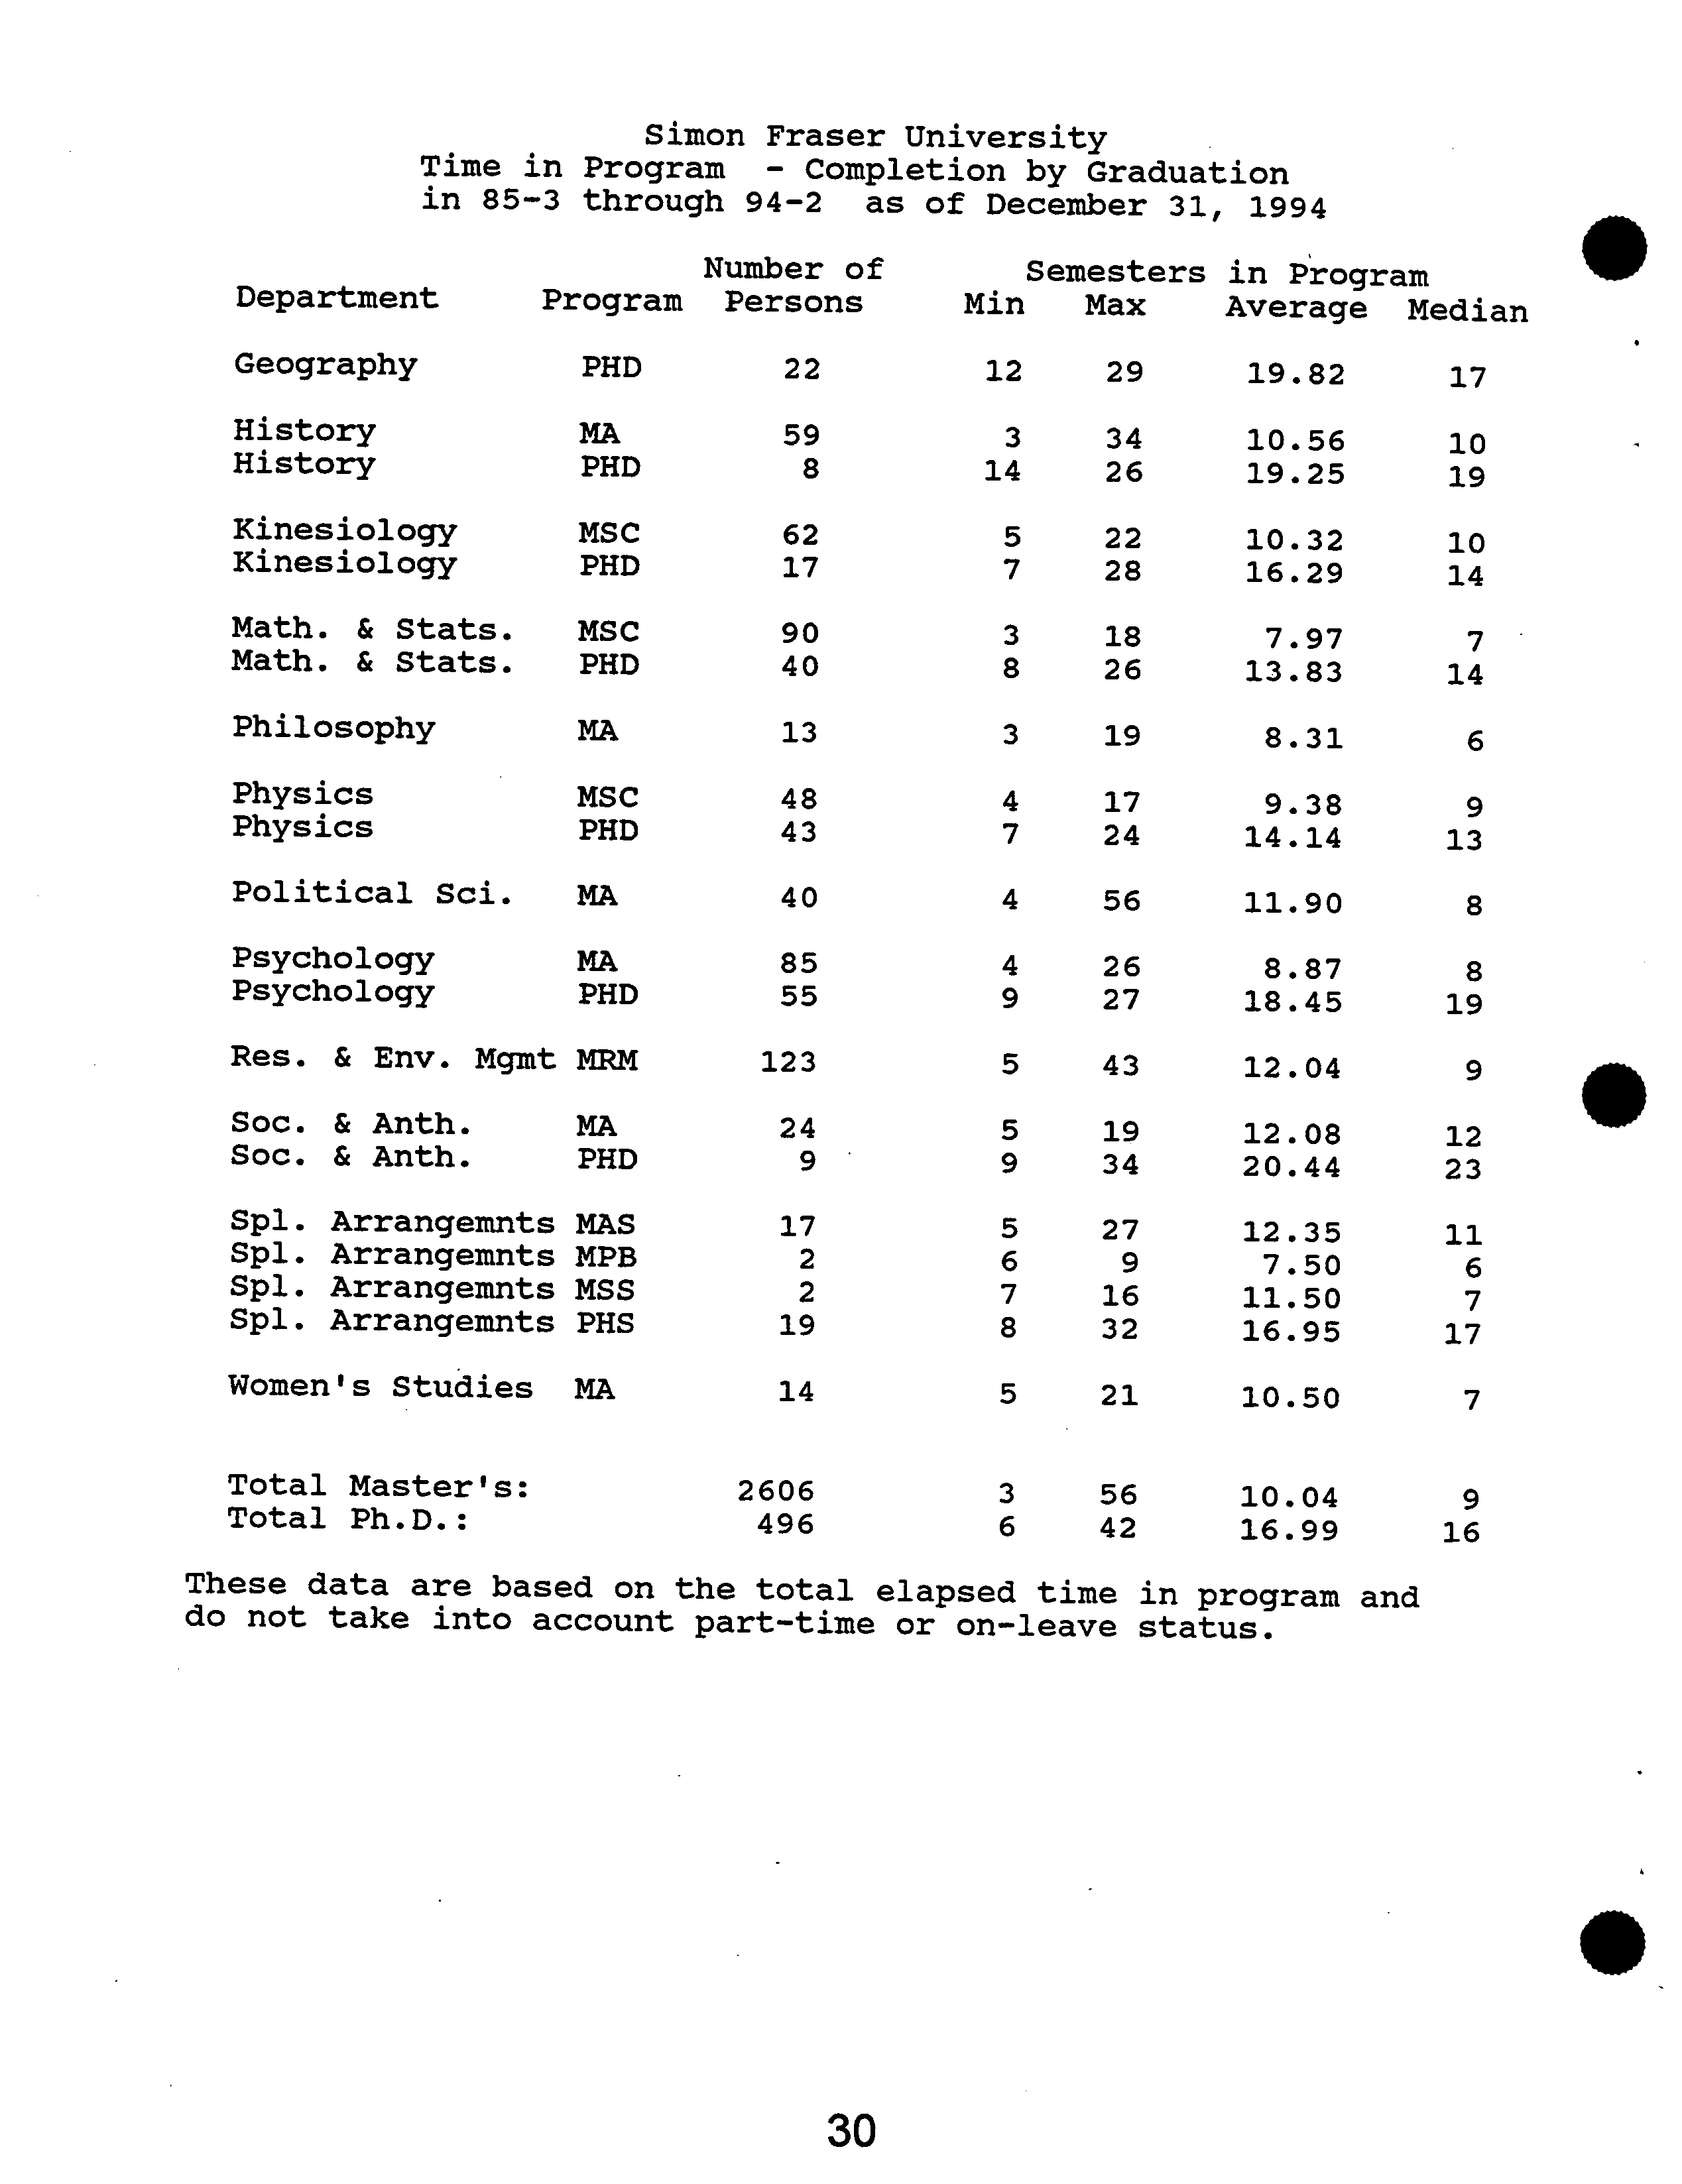
Time in
Program
- Completion by
Graduation
in 85-3
through
94-2 ?
as
of December
31, ?
1994
Number of
Semesters in Program
Department ?
Program ?
Persons
Min
Max
Average
Median
ArchaeologyArchaeology
MA
PHD
3417
12
6
2718
20.3512.94
22
14
Biological
Biological
Biological
Biological
Sci.Sci.Sci.Sci.
MSCMAQMPH
PHD
10086
93
13
10
55
3
281710
19
10.8716.4810.355.85
16
10
10
6
Bus.
Bus.
Bus. Admin.Admin.Admin.
MBW
MBE
MBA
26318845
5
33
31
18
8
10.087.006.11
9
6
6
Contemp. Arts
MFA
14
5
10
7.00
7
ChemistryChemistry
MSCPHD
45
49
11
4
2418
17.079.80
17
9
CommunicationCommunication
MA
PHD
76
13
11
5
4526
17.9212.47
18
12
Computing Sci.
MSC
131
4
18
8.85
8
•
Computing Sci.
PHD
20
6
25
16.20
15
CriminologyCriminology
MA
PHD
75
6
9
3
27
33
19.1711.71
11
19
Lang.
Lang.
Lang.
&
&
&
Ling.Ling.Ling.
MAMAT
PHD
17
77
14
7
3
2428
17
10.5918.8616.43
24
11
15
EconomicsEconomics
MA
PHD
14244
11
3
2442
18.50
6.92
18
6
EducationEducationEducationEducation
MSC
MAMED
PHD
239307
28
20
8
4
5
3
263716
23
11.3515.7111.0711.30
15
11
13
10
EnglishEnglish
MA
PHD
92
9
12
3
29
43
18.2212.72
11
19
Engineering
Engineering
Engineering
Sci.Sci.Sci.
MENMAPPHD
1264
1
87
3
2312
8
14.508.006.42
14
8
6
GeographyGeography
MSC
MA
3419
76
21
16
11.568.84
10
9
continued...
29
Simon
Fraser
University
Time in
Program
- Completion
by Graduation
in 85-3
through
94-2 ?
as
of December 31,
1994
Number
of
Semesters
in Program
Department ?
Program ?
Persons
Min
Max
Average ?
Median
Geography
PHD
22
12
29
19.82
17
HistoryHistory
MA
PHD
59
8
14
3
26
34
10.5619.25
19
10
KinesiologyKinesiology
MSCPHD
6217
75
2822
10.3216.29
10
14
Math.
Math.
&
&
Stats.Stats.
MSCPHD
4090
8
3
26
18
13.837.97
14
7
Philosophy
MA
13
3
19
8.31
6
PhysicsPhysics
MSC
PHD
4348
74
2417
14.149.38
13
9
Political Sci.
MA
40
4
56
11.90
8
PsychologyPsychology
MA
PHD
8555
94
2726
18.458.87
19
8
Res.
Soc.
Soc.
&
&
&
Anth.Anth.Env.
Mgmt
MAMRM
PHD
123
24
9
9
55
344319
20.4412.0812.04
23
12
9
0
Spi.
Spi.
Spi.
Spi. ArrangemntsArrangemntsArrangemntsArrangemnts
MSS
MPB
MAS
PHS
1917
22
876
5
27
3216
9
16.9511.5012.357.50
17
11
7
6
Women's Studies
MA
14
5
21
10.50
7
Total
Total
Ph.D.:Master's:
??
2606496
??
6
3
??
56
42 ??
16.9910.04 ??
16
9
These data are based on the total elapsed time in program and
do not take into account part-time or on-leave status.
30
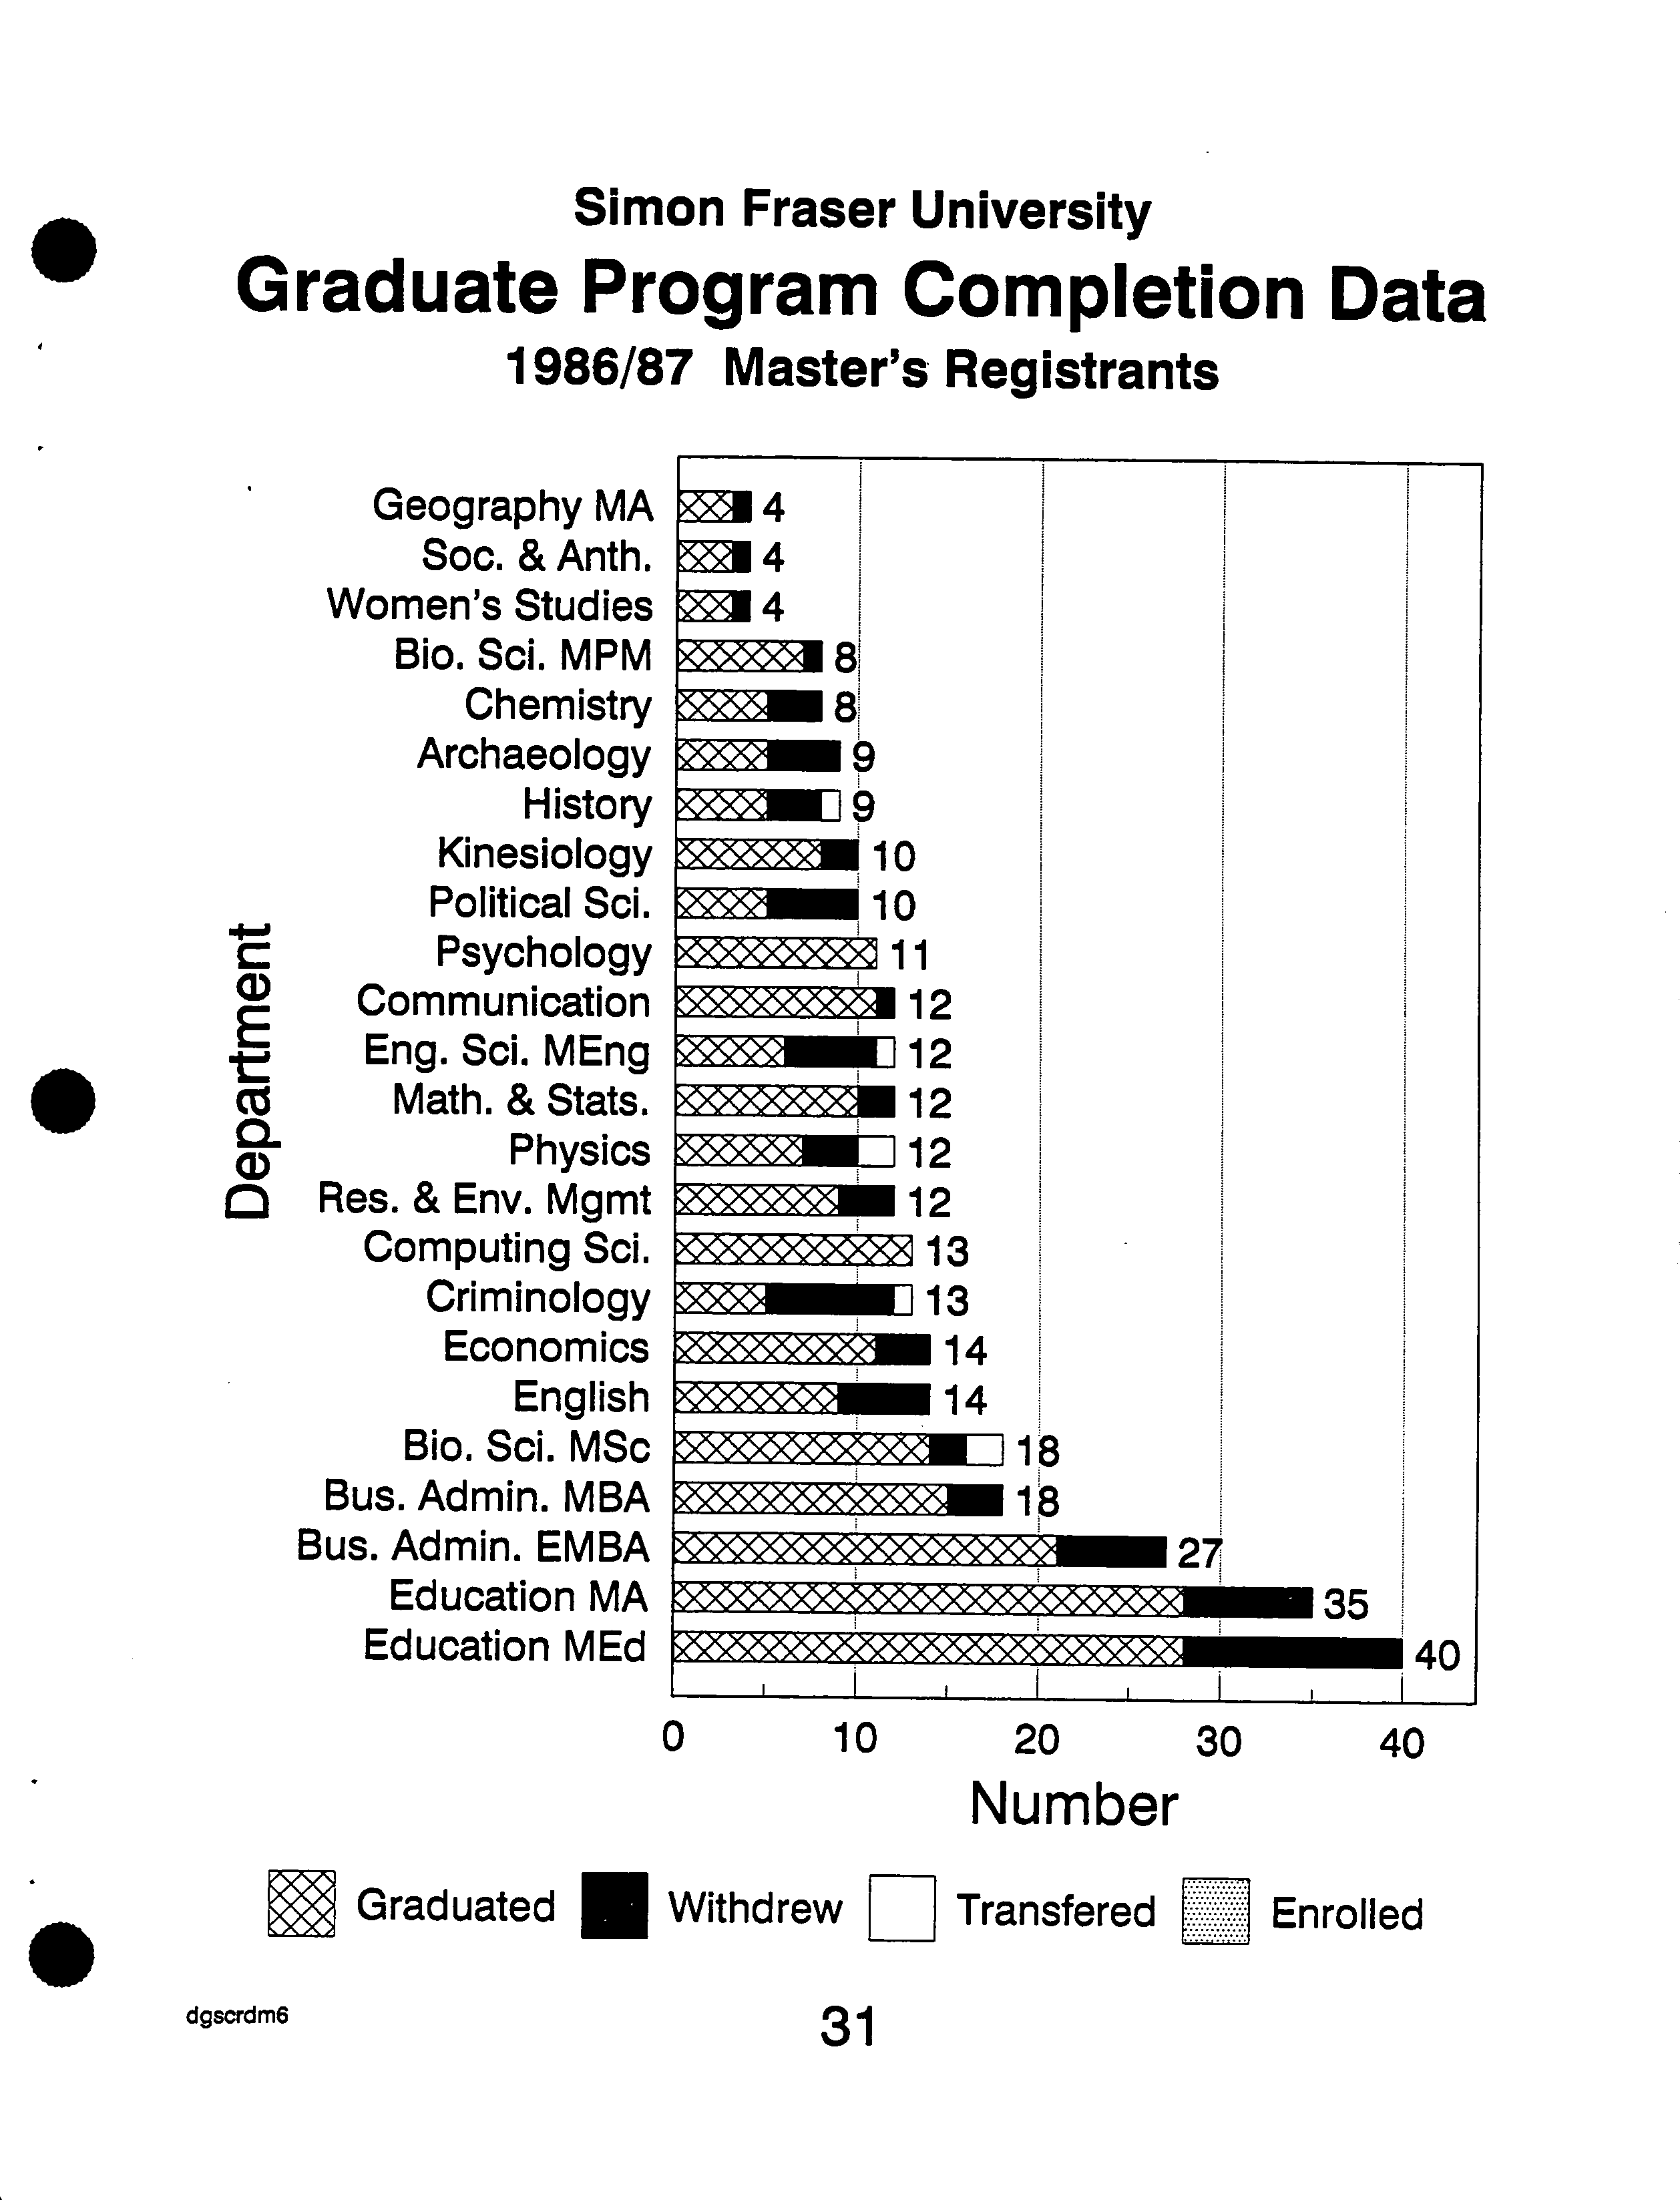
Simon Fraser University
Graduate Program Completion Data
.
1986/87 Master's Registrants
Geography MA
Soc. & Anth.
Women's Studies
Bio. Sci. MPM
Chemistry
Archaeology
History
Kinesiology
Political Sci.
Psychology
CD ?
Communication
Eng. Sci. MEng
Cz
Math. & Stats.
CL
CD
Physics?
Res. & Env. Mgmt
?
Computing Sd.
?
Criminology ?
Economics
?
English
?
Bio. Sci. MSc
?
Bus. Admin. MBA
?
Bus. Admin. EMBA
?
Education MA
?
Education MEd
4
4
4
10
10
11
112
012
112
1112
112
13
11113
14
14
1
1
F
A
35
all
0 ?
10
?
20 ?
30 ?
40
Number
Graduated ___ Withdrew
1:1
Transfered
?
Enrolled
dgscrdm6
?
31
4
06
Kinesiology
Chemistry
-
r.
History
E
Computing Sd.
.
Cz
Math. & Stats.
Education
Physics
Psychology
Economics
Biological Sci.
2
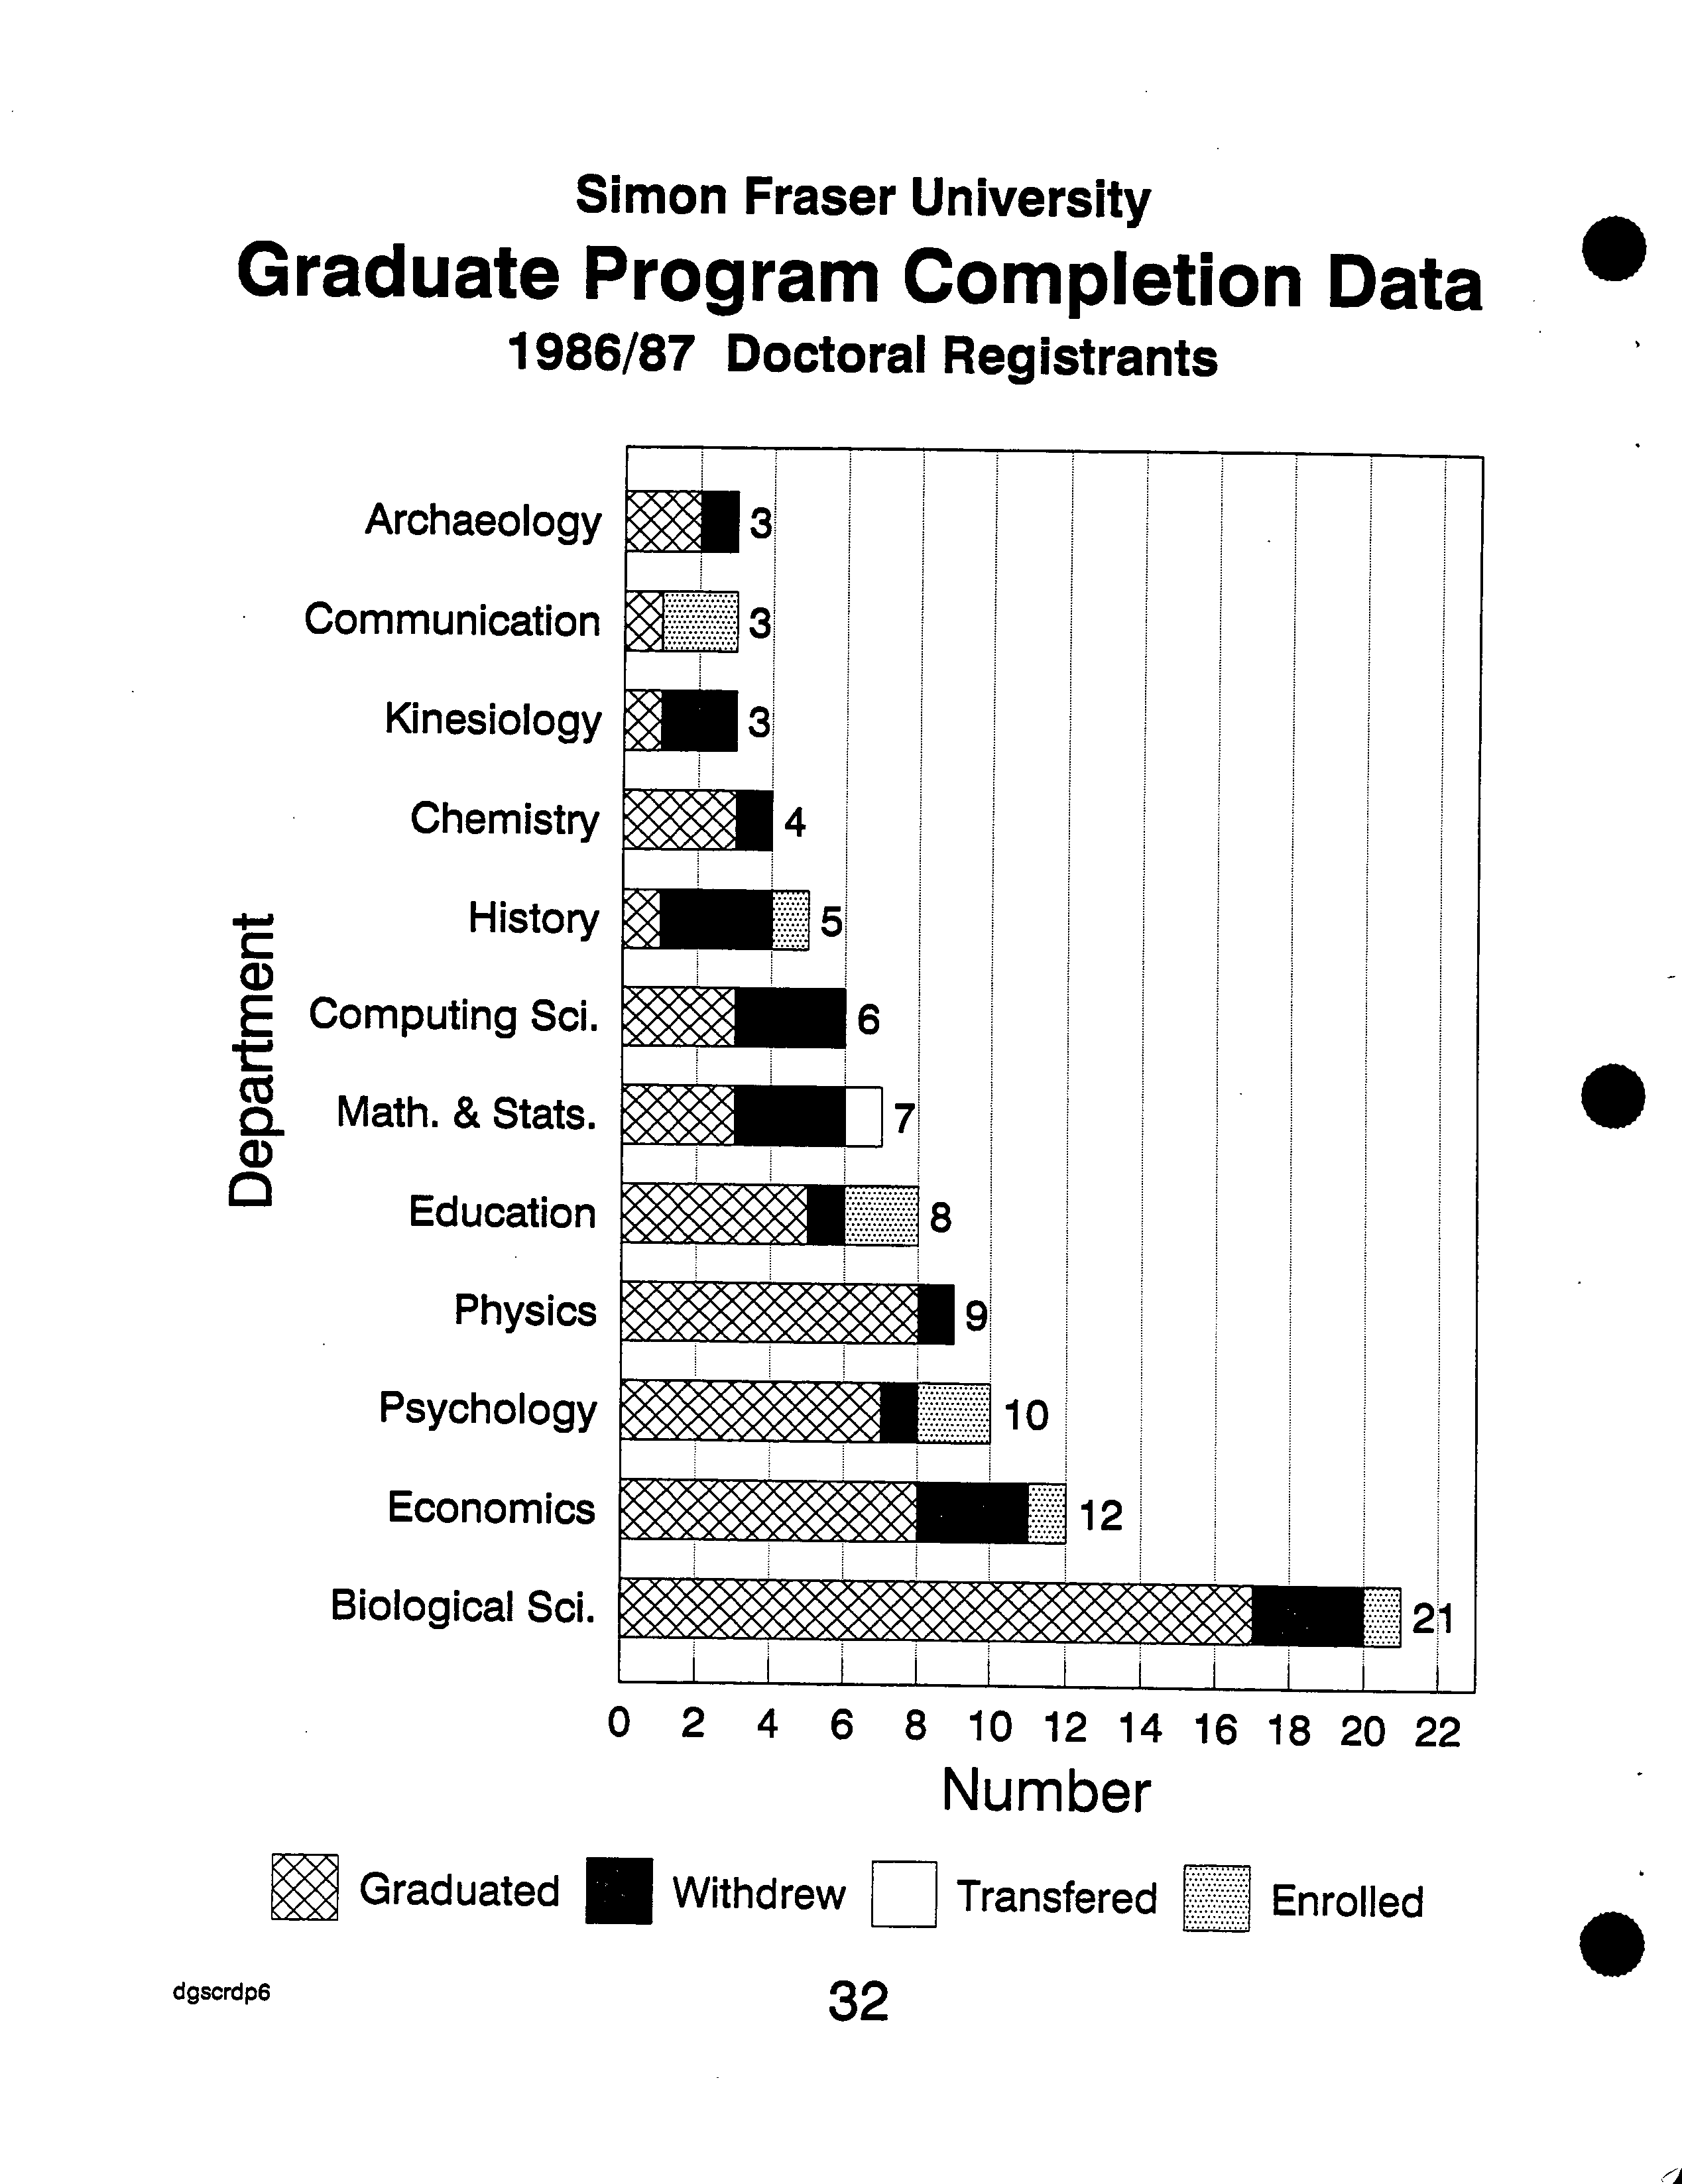
Simon Fraser University
Graduate Program Completion Data
1986/87 Doctoral Registrants
Archaeology
?
3
Communication
o
2 4 6 8 10 12 14 16 18 20 22
Number
Graduated ___ Withdrew
1:1
Transfered ?
Enrolled
dgscrdp6 ?
32
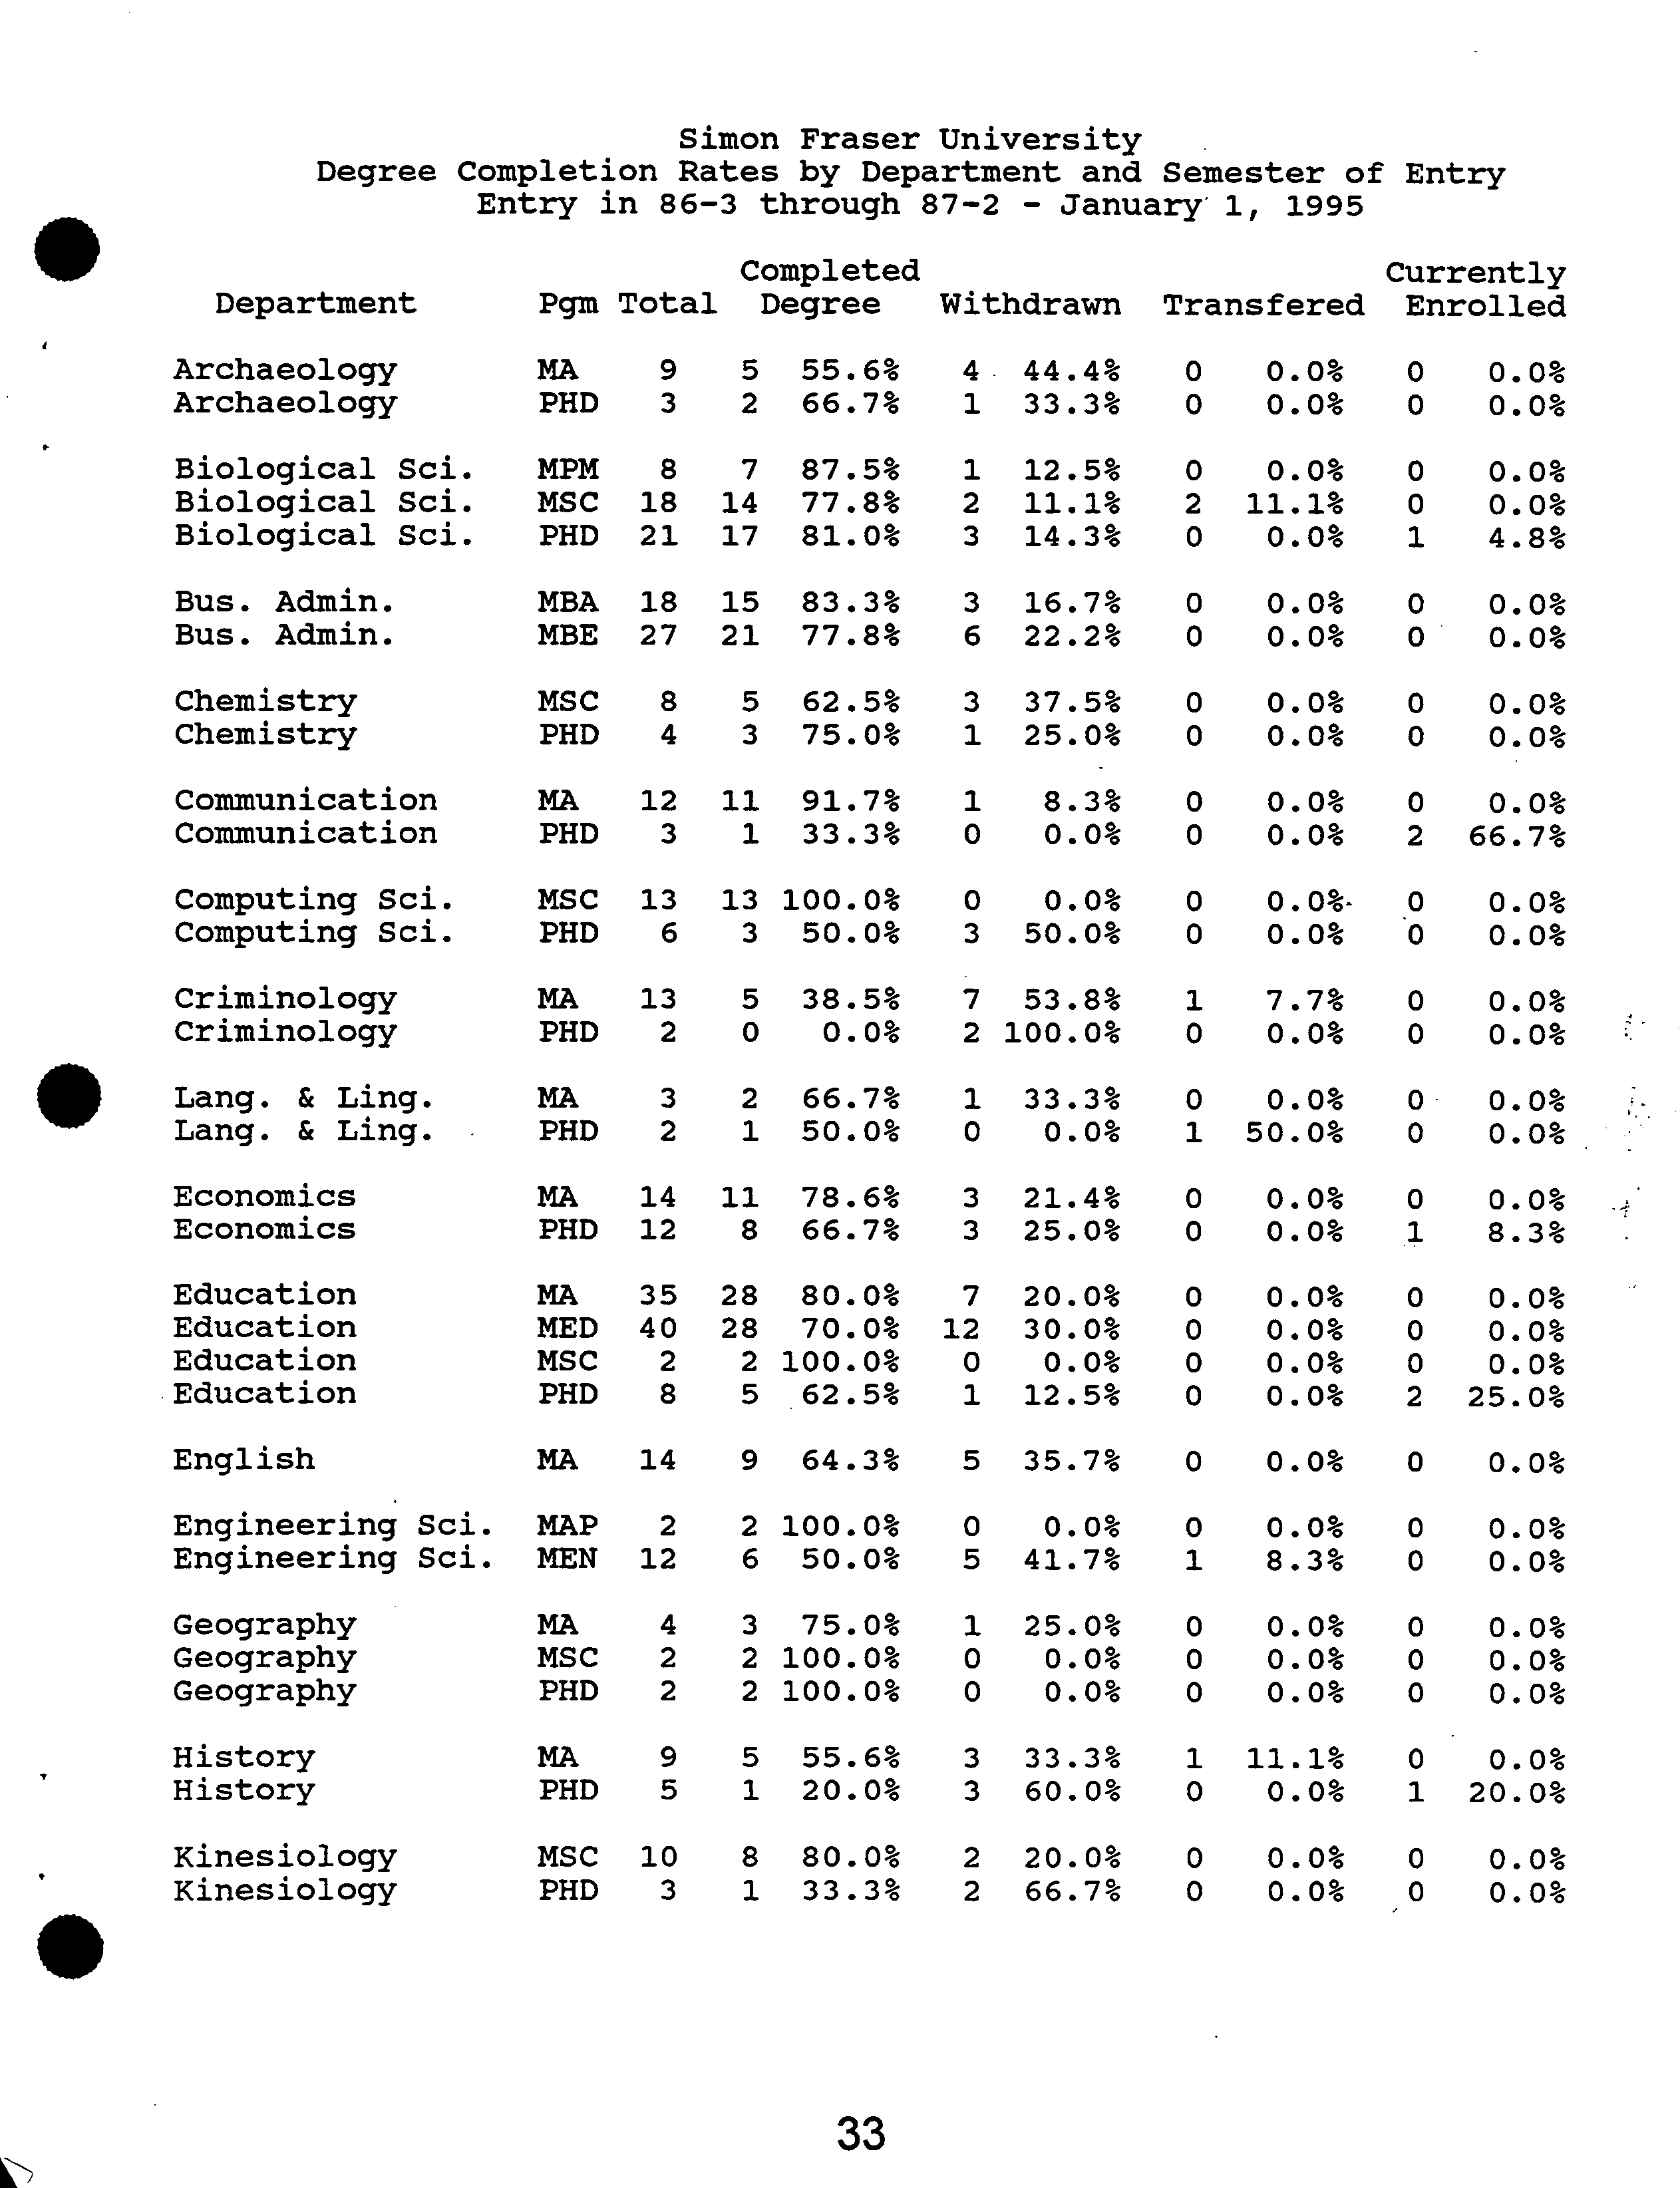
Simon
Fraser University
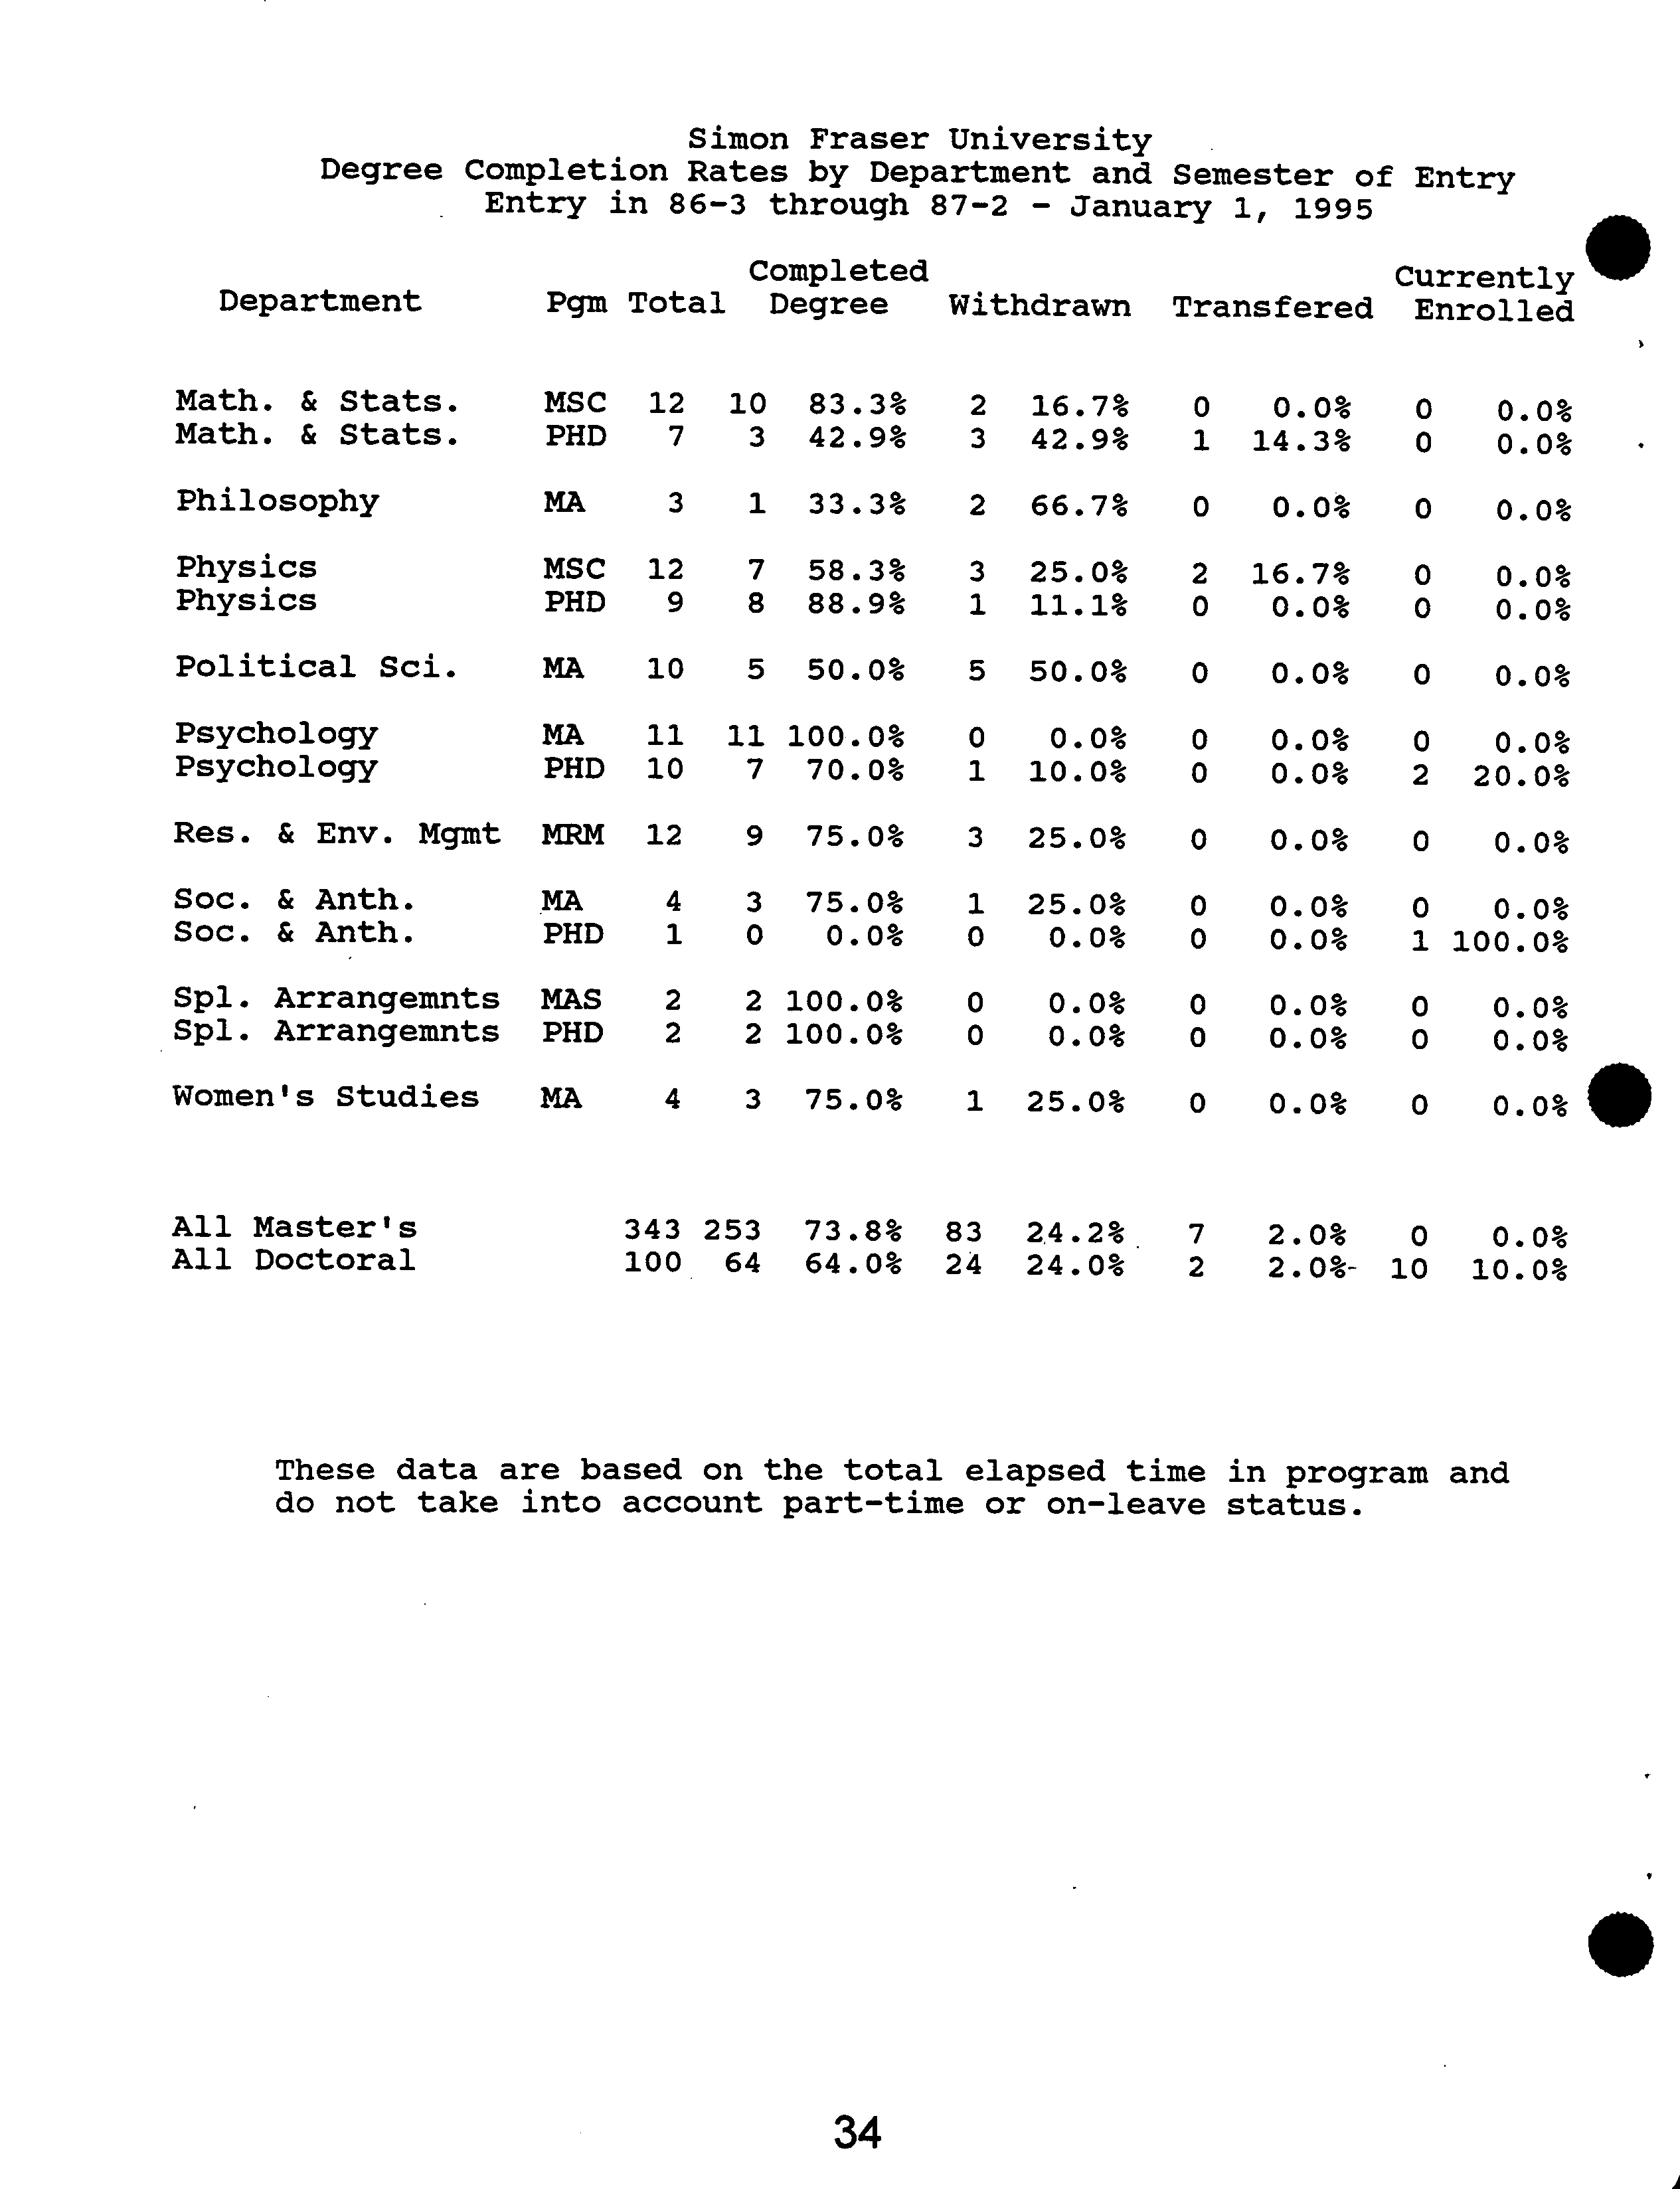
Degree Completion Rates
by Department
and Semester of
Entry
Entry in 86-3
through 87-2
- January
1, ?
1995
Completed
Currently
Department
Pgm Total
Degree
Withdrawn
Trans fered
Enrolled
Archaeology
MA 9 5 55.6%
4.
44.4% 0
0.0%
0
0.0%
Archaeology
PHD 3
2
66.7%
1 33.3%
0 0.0%
0
0.0%
Biological Sci. MPM
8 7 87.5% 1
12.5% 0
0.0% 0
0.0%
Biological Sci.
MSC 18
14 77.8% 2
11.1% 2 11.1%
0
0.0%
Biological Sci.
PHD 21 17
81.0% 3 14.3%
0 0.0%
1
4.8%
Bus. Admin.
MBA 18 15
83.3% 3 16.7% 0
0.0%
0
0.0%
Bus. Admin.
MBE
27
21 77.8%
6 22.2%
0 0.0% 0
0.0%
Chemistry
MSC 8
5 62.5% 3 37.5%
0 0.0%
0
0.0%
Chemistry
PHD 4
3 75.0% 1 25.0%
0 0.0%
0
0.0%
Communication
MA 12
11 91.7% 1
8.3% 0
0.0% 0
0.0%
Communication
PHD 3
1
33.3% 0 0.0%
0
0.0% 2
66.7%
Computing Sci. MSC 13 13
100.0%
0
0.0%
0 0.0%- 0
0.0%
Computing Sci.
PHD 6 3
50.0% 3
50.0%
0
0.0% 0
0.0%
Criminology
MA 13
5 38.5% 7
53.8%
1 7.7% 0
0.0%
Criminology
PHD 2 0
0.0% 2
100.0%
0
0.0% 0
0.0%
Lang. & Ling. MA
3 2 66.7%
1 33.3%
0 0.0%
0
0.0%
Lang. ?
& Ling. ?
. PHD
2 1
50.0% 0 0.0%
1 50.0%
0
0.0%
Economics
MA 14
11 78.6% 3
21.4% 0
0.0%
0
0.0%
Economics
PHD 12
8 66.7% 3
25.0%
0 0.0%
1
8.3%
Education
MA
35 28 80.0%
7
20.0% 0
0.0% 0
0.0%
Education
MED 40 28
70.0% 12
30.0%
0 0.0%
0
0.0%
Education
MSC
2 2
100.0% 0
0.0%
0
0.0% 0
0.0%
Education
PHD 8
5 62.5%
1 12.5%
0
0.0%
2
25.0%
English
MA 14
9 64.3% 5
35.7%
0 0.0% 0
0.0%
Engineering Sci.
MAP 2
2 100.0% 0
0.0%
0 0.0% 0
0.0%
Engineering Sci. MEN
12 6
50.0%
5
41.7%
1 8.3% 0
0.0%
Geography
MA 4 3
75.0%
1 25.0%
0 0.0% 0
0.0%
Geography
MSC
2 2 100.0%
0
0.0% 0 0.0%
0
0.0%
Geography
PHD 2
2 100.0%
0 0.0%
0 0.0% 0
0.0%
History
MA 9 5
55.6%
3
33.3%
1
11.1% 0
0.0%
History
PHD 5
1 20.0%
3 60.0%
0 0.0%
1
20.0%
Kinesiology
MSC 10
8 80.0% 2 20.0%
0 0.0%
0
0.0%
Kinesiology
PHD 3
1
33.3%
2 66.7% 0 0.0%
0
0.0%
33
Simon Fraser University
Degree CompletionEntry
in 86-3
Rates
throughby
Department
87-2
- Januaryand
Semester
1,
?
1995
of
Entry
Completed
Currently
0
Department
Pgm
Total
Degree
Withdrawn
Transfered
Enrolled
Math.
Math.
&
&
Stats.Stats.
MSCPHD
12
7
10
3
42.9%83.3%
2
3
42.9%16.7%
].
0
14.3%0.0%
0
0
0.0%
0.0%
Philosophy
MA
3
1
33.3%
2
66.7%
0
0.0%
0
0.0%
PhysicsPhysics
MSCPHD 12
9
87
88.9%58.3%
3
1
25.0%11.1%
20
16.7%0.0%
00
0.0%
0.0%
Political Sci.
MA
10
5
50.0%
5
50.0%
0
0.0%
0
0.0%
PsychologyPsychology
MA
PHD
1110
11
7
100.0%70.0%
01
10.0%0.0%
0
0
0.0%0.0%
2
0
20.0%
0.0%
Res. & Env. Mgmt
MRN 12
9
75.0%
3
25.0%
0
0.0%
0
0.0%
Soc.
Soc.
&
& Anth.Anth.
MA
PHD
4
1
3
0
75.0%0.0%
01
25.0%0.0%
00
0.0%0.0%
10
100.0%
0.0%
Spl.
Spi.
ArrangemntsArrangemnts
MAS
PHD
22
2
2
100.0%100.0%
00
0.0%0.0%
00
0.0%0.0%
00
0.0%
0.0%
Women's Studies
MA
4 3
75.0%
1
25.0%
0
0.0%
0
0.0%
All
All
Master'sDoctoral
??
100
343 253
64 64.0%
73.8%
24
83
24.0%
24.2%
??
27
??
2.0%-
2.0% ?
10
0 ?
10.0%
0.0%
These data are based on the total elapsed time in program and
do not take into account part-time or on-leave status.
34
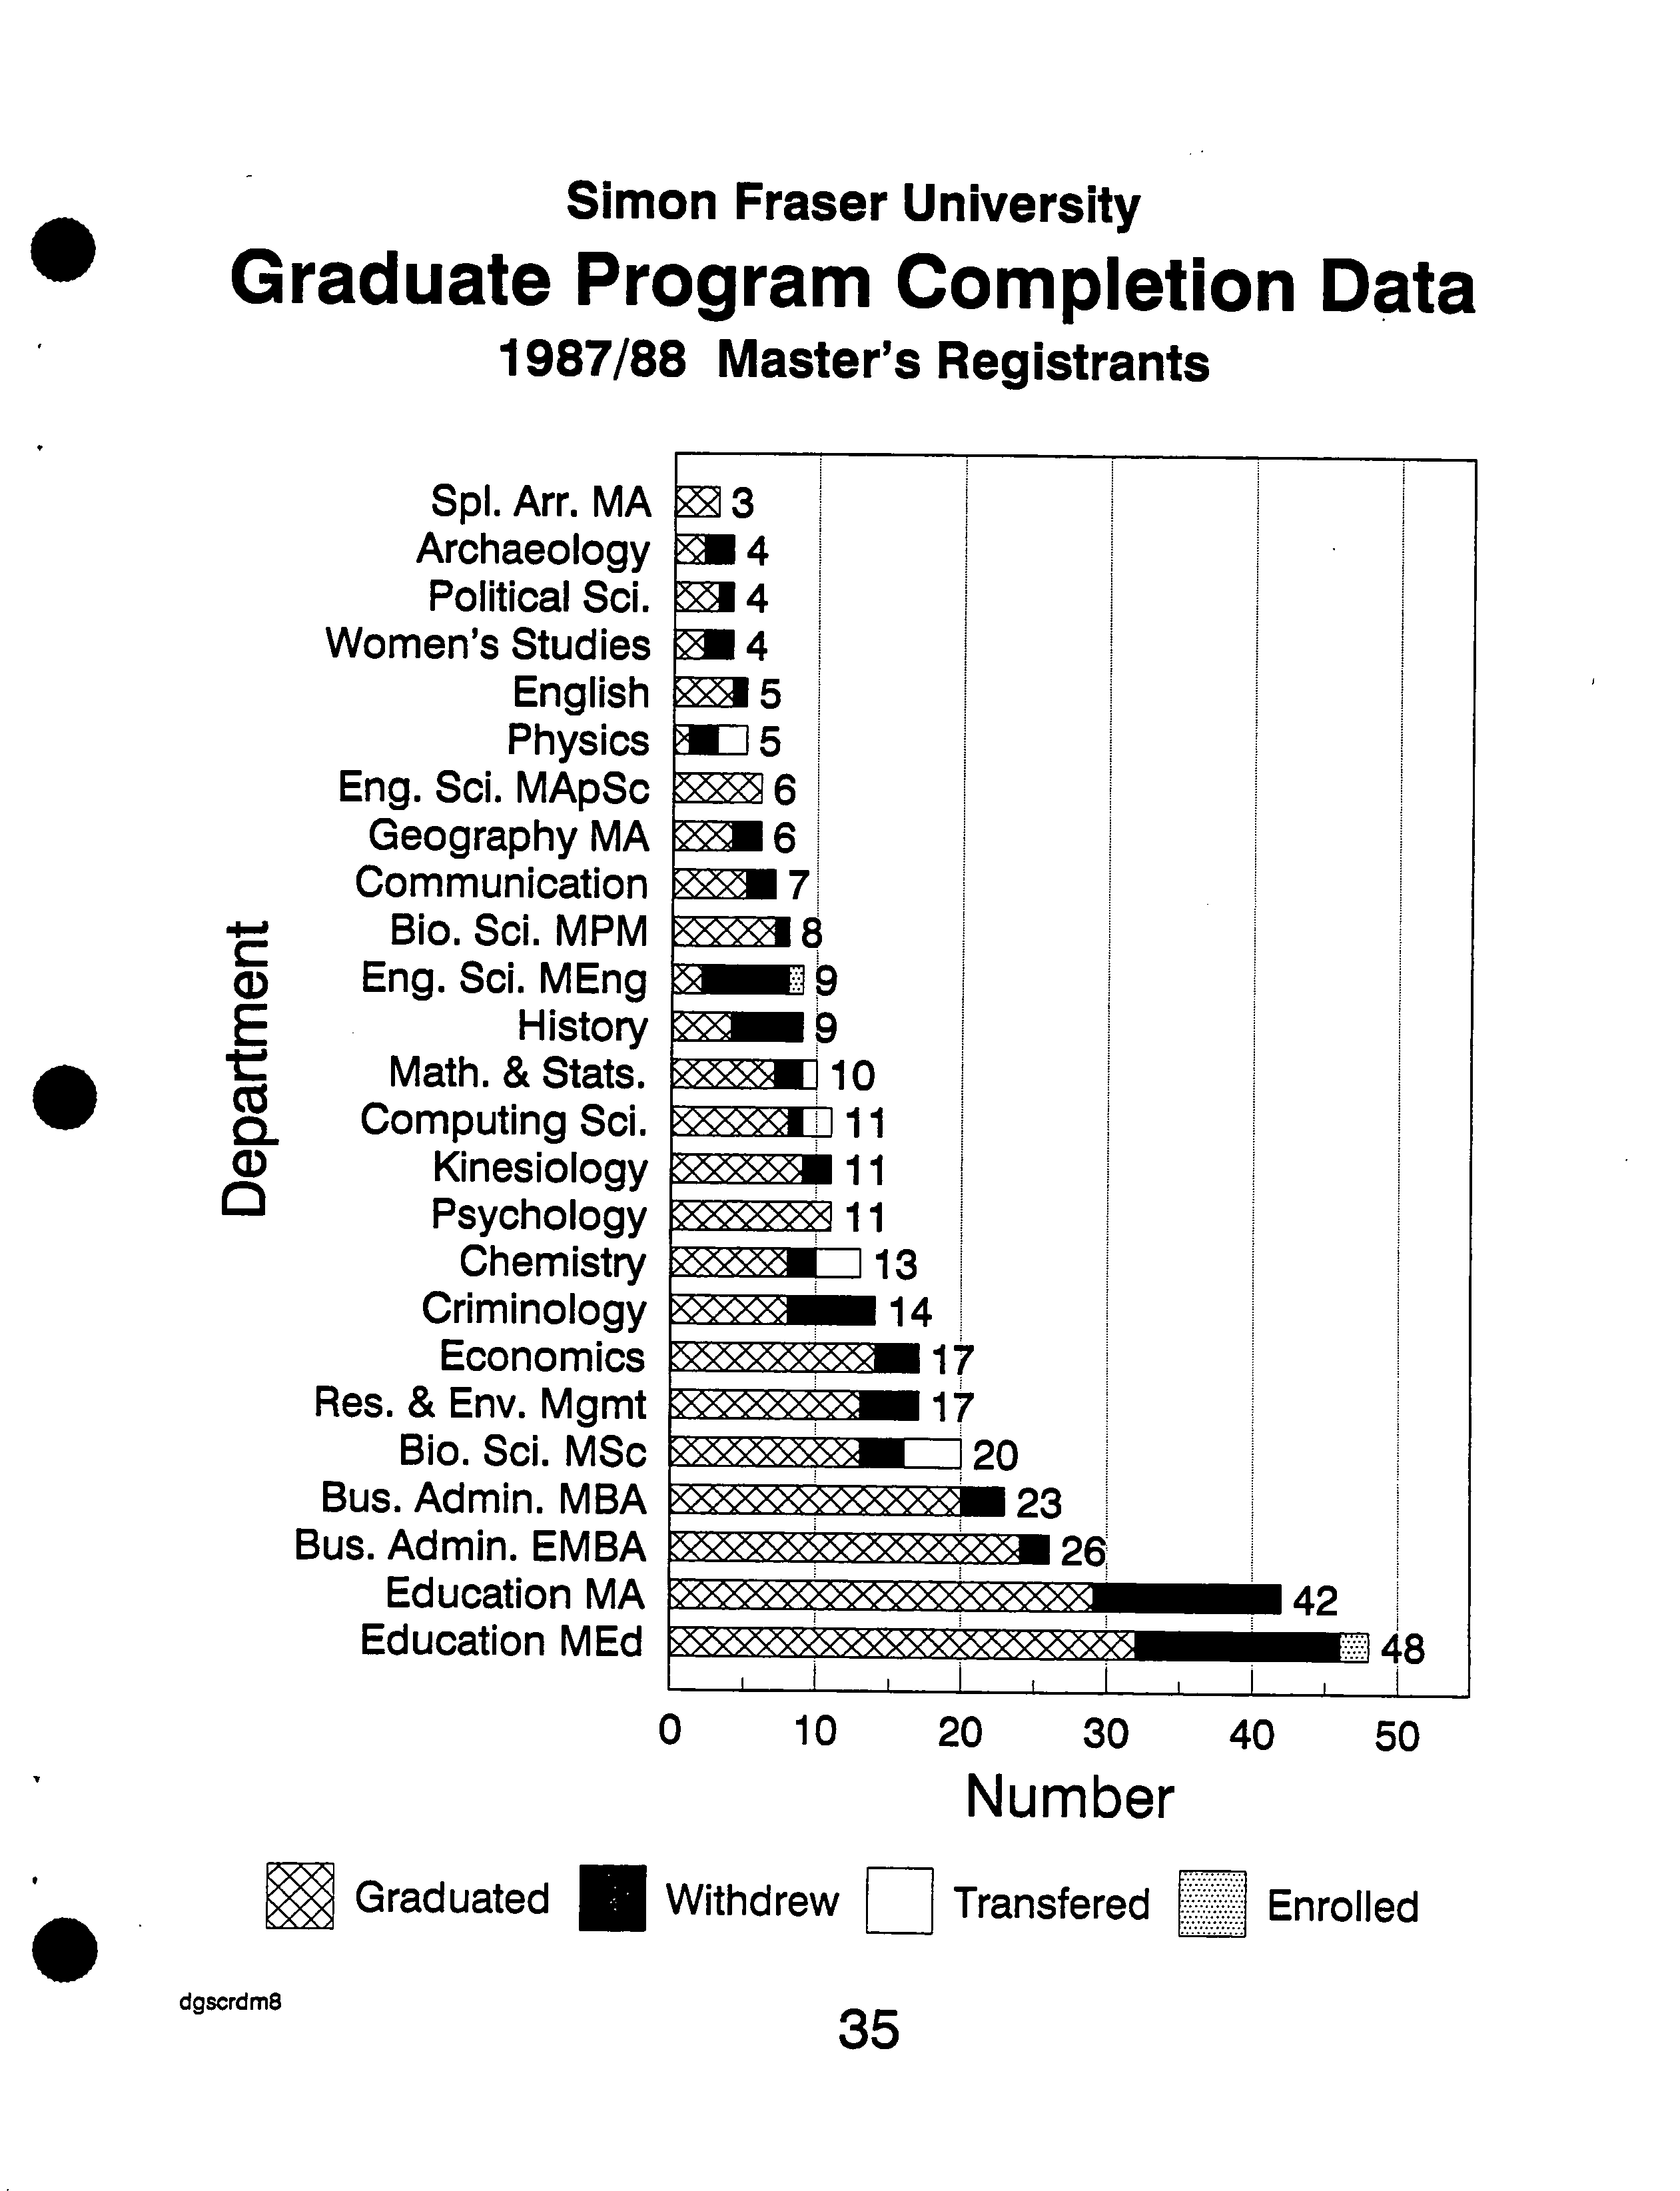
Simon Fraser University
• Graduate Program Completion Data
1987/88 Master's Registrants
Spi. Arr. MA
?
Archaeology?
Political Sci.
?
Women's Studies
?
English ?
Physics ?
Eng. Sci. MApSc?
Geography MA?
Communication?
Bio. Sd. MPM
?
Eng. Sci. MEng
E ?
History
t
?
Math. &Stats.
Cz
Computing Sci.
W ?
Kinesiology
Psychology
Chemistry
Criminology
Economics
Res. & Env. Mgmt
Bio. Sd. MSc
Bus. Admin. MBA
Bus. Admin. EMBA
Education MA
Education MEd
3
14
14
14
15
15
16
-7
10
11
11
11
?
1J13
•14
1
1
S
42
0 ?
10
?
20 ?
30 ?
40 ?
50
Number
Graduated ___ Withdrew
1:1
Transfered
?
Enrolled
dgscrdms
?
35
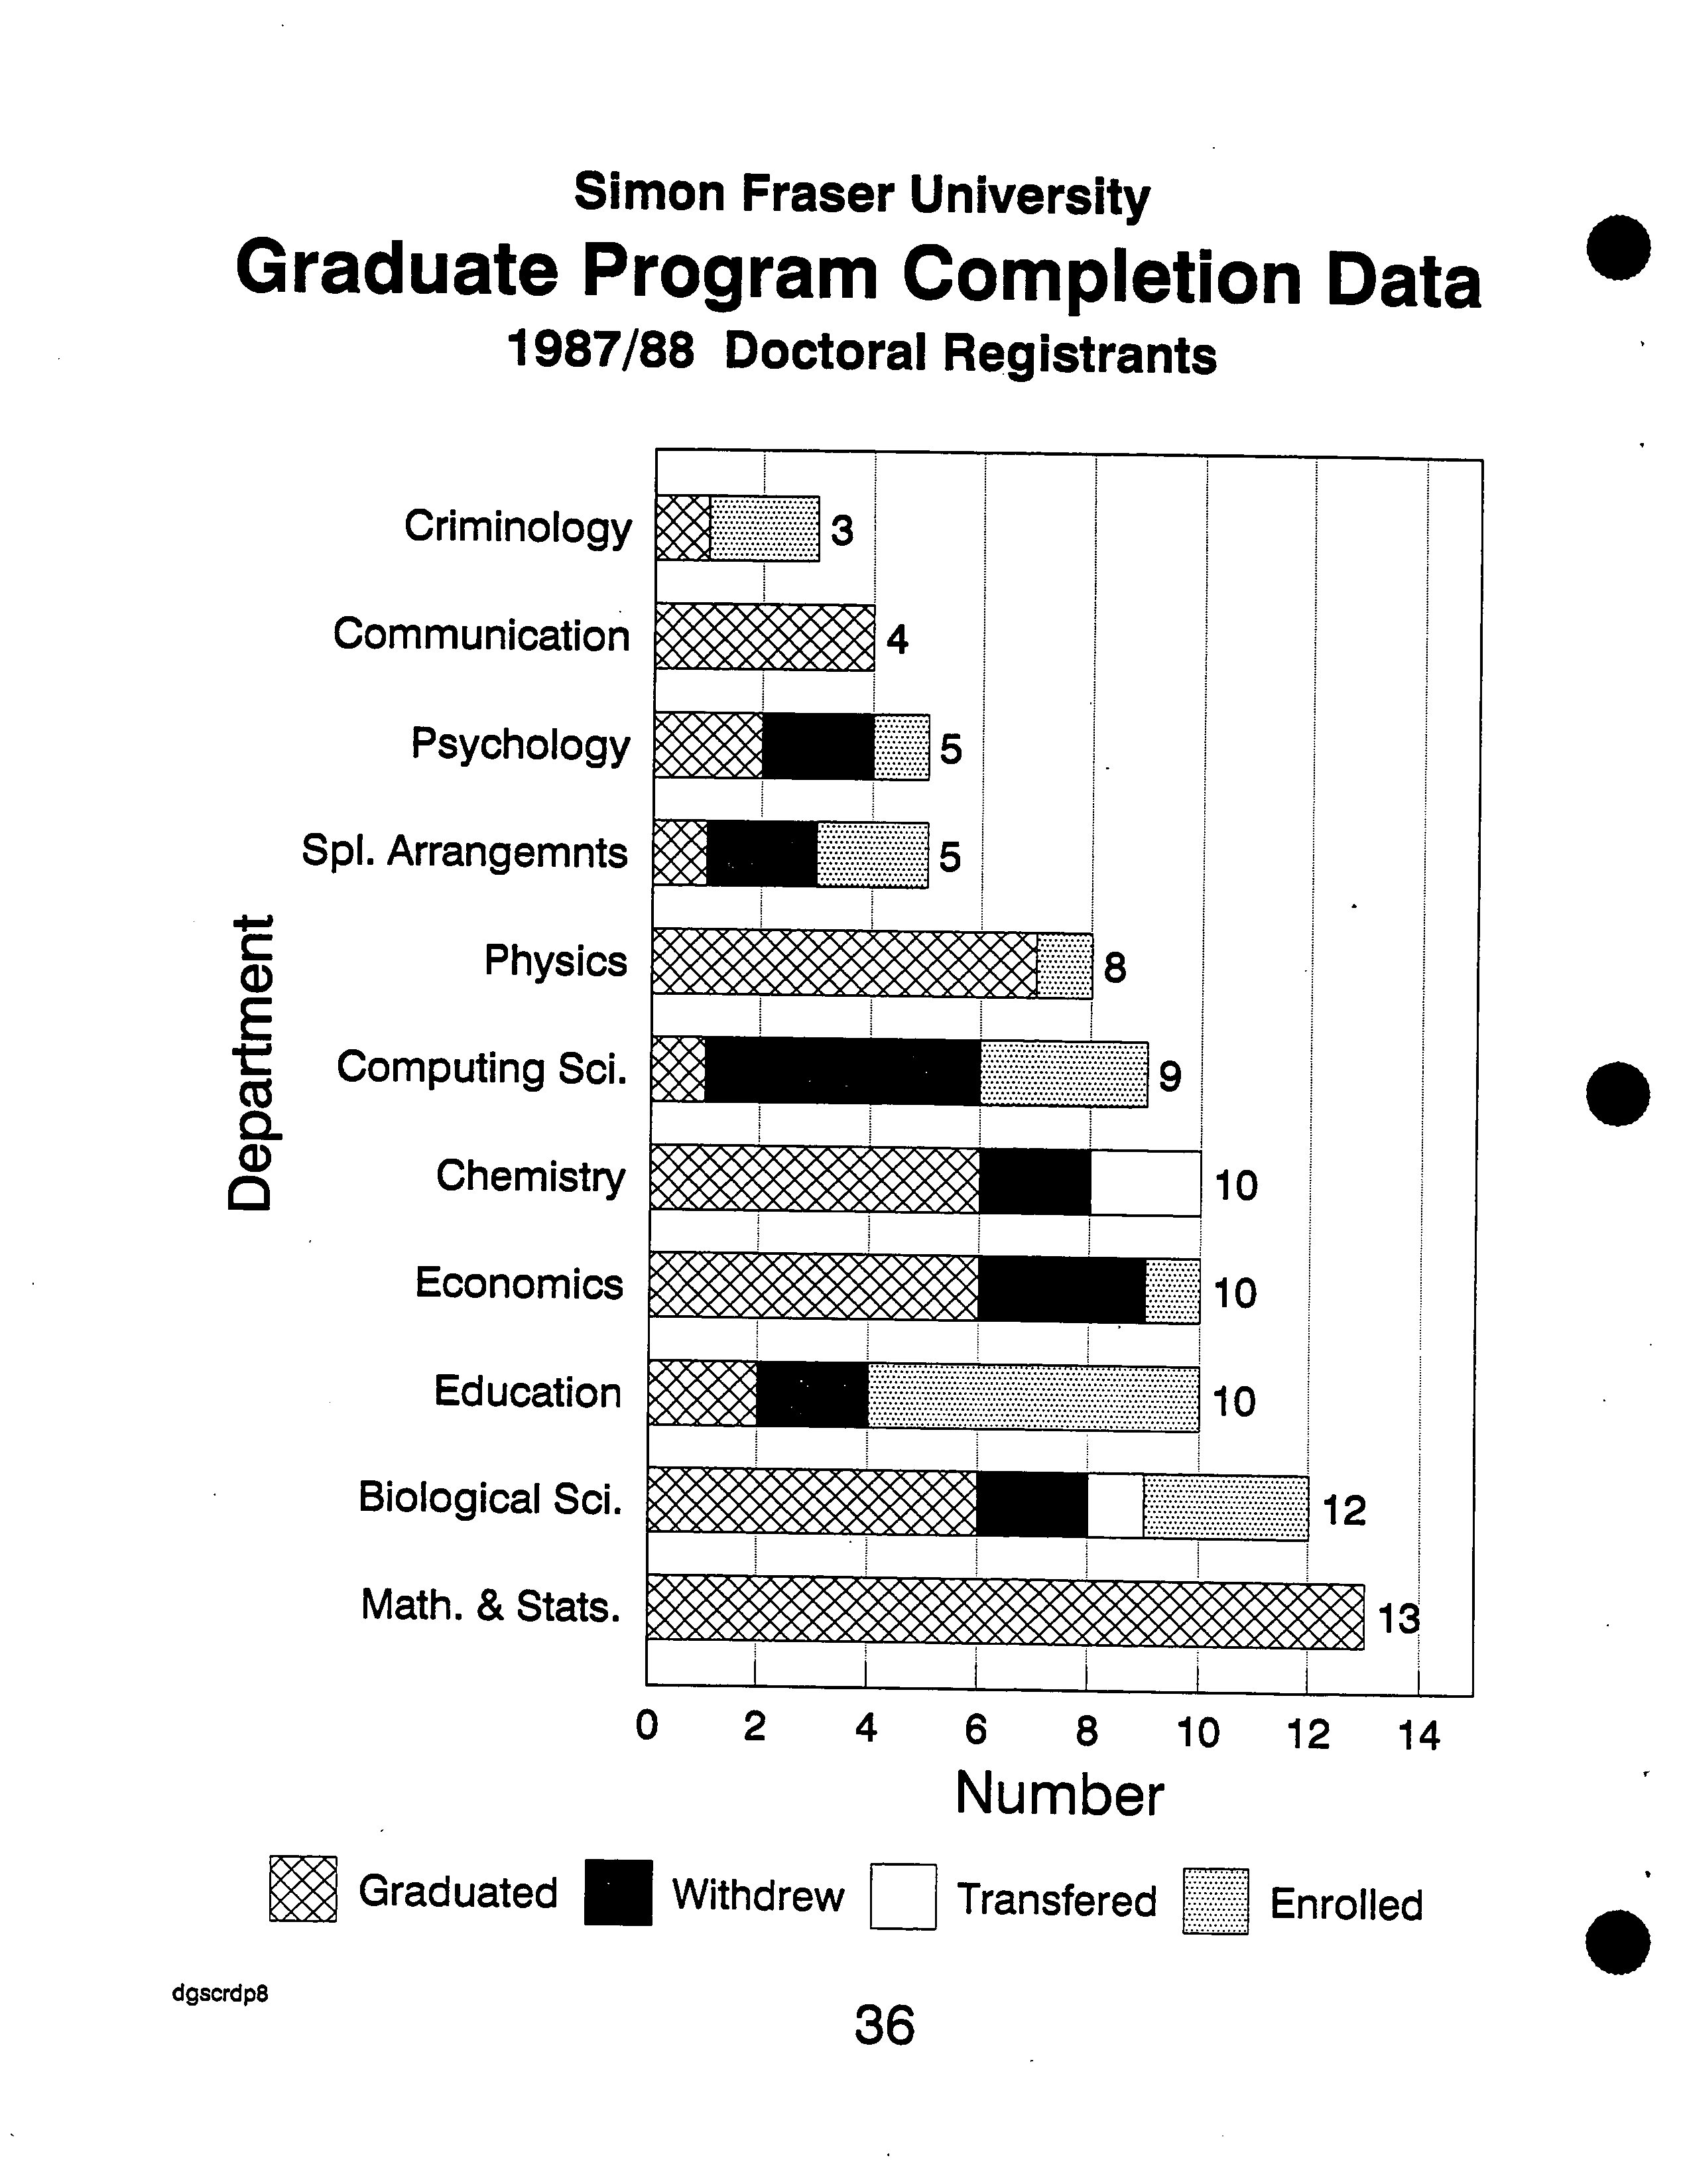
Simon Fraser University
Graduate Program Completion Data
1987/88 Doctoral Registrants
0 ?
2
?
4 ?
6 ?
8 ?
10 12 14
Number
Graduated ___ Withdrew
1:1
Transfered
?
Enrolled
dgscrdps ?
36
Criminology
Communication
Psychology
Spi. Arrangemnts
CD
Physics
E
Cz
Computing Sci.
CL
Chemistry
Economics
Education
Biological Sci.
Math. & Stats.
A
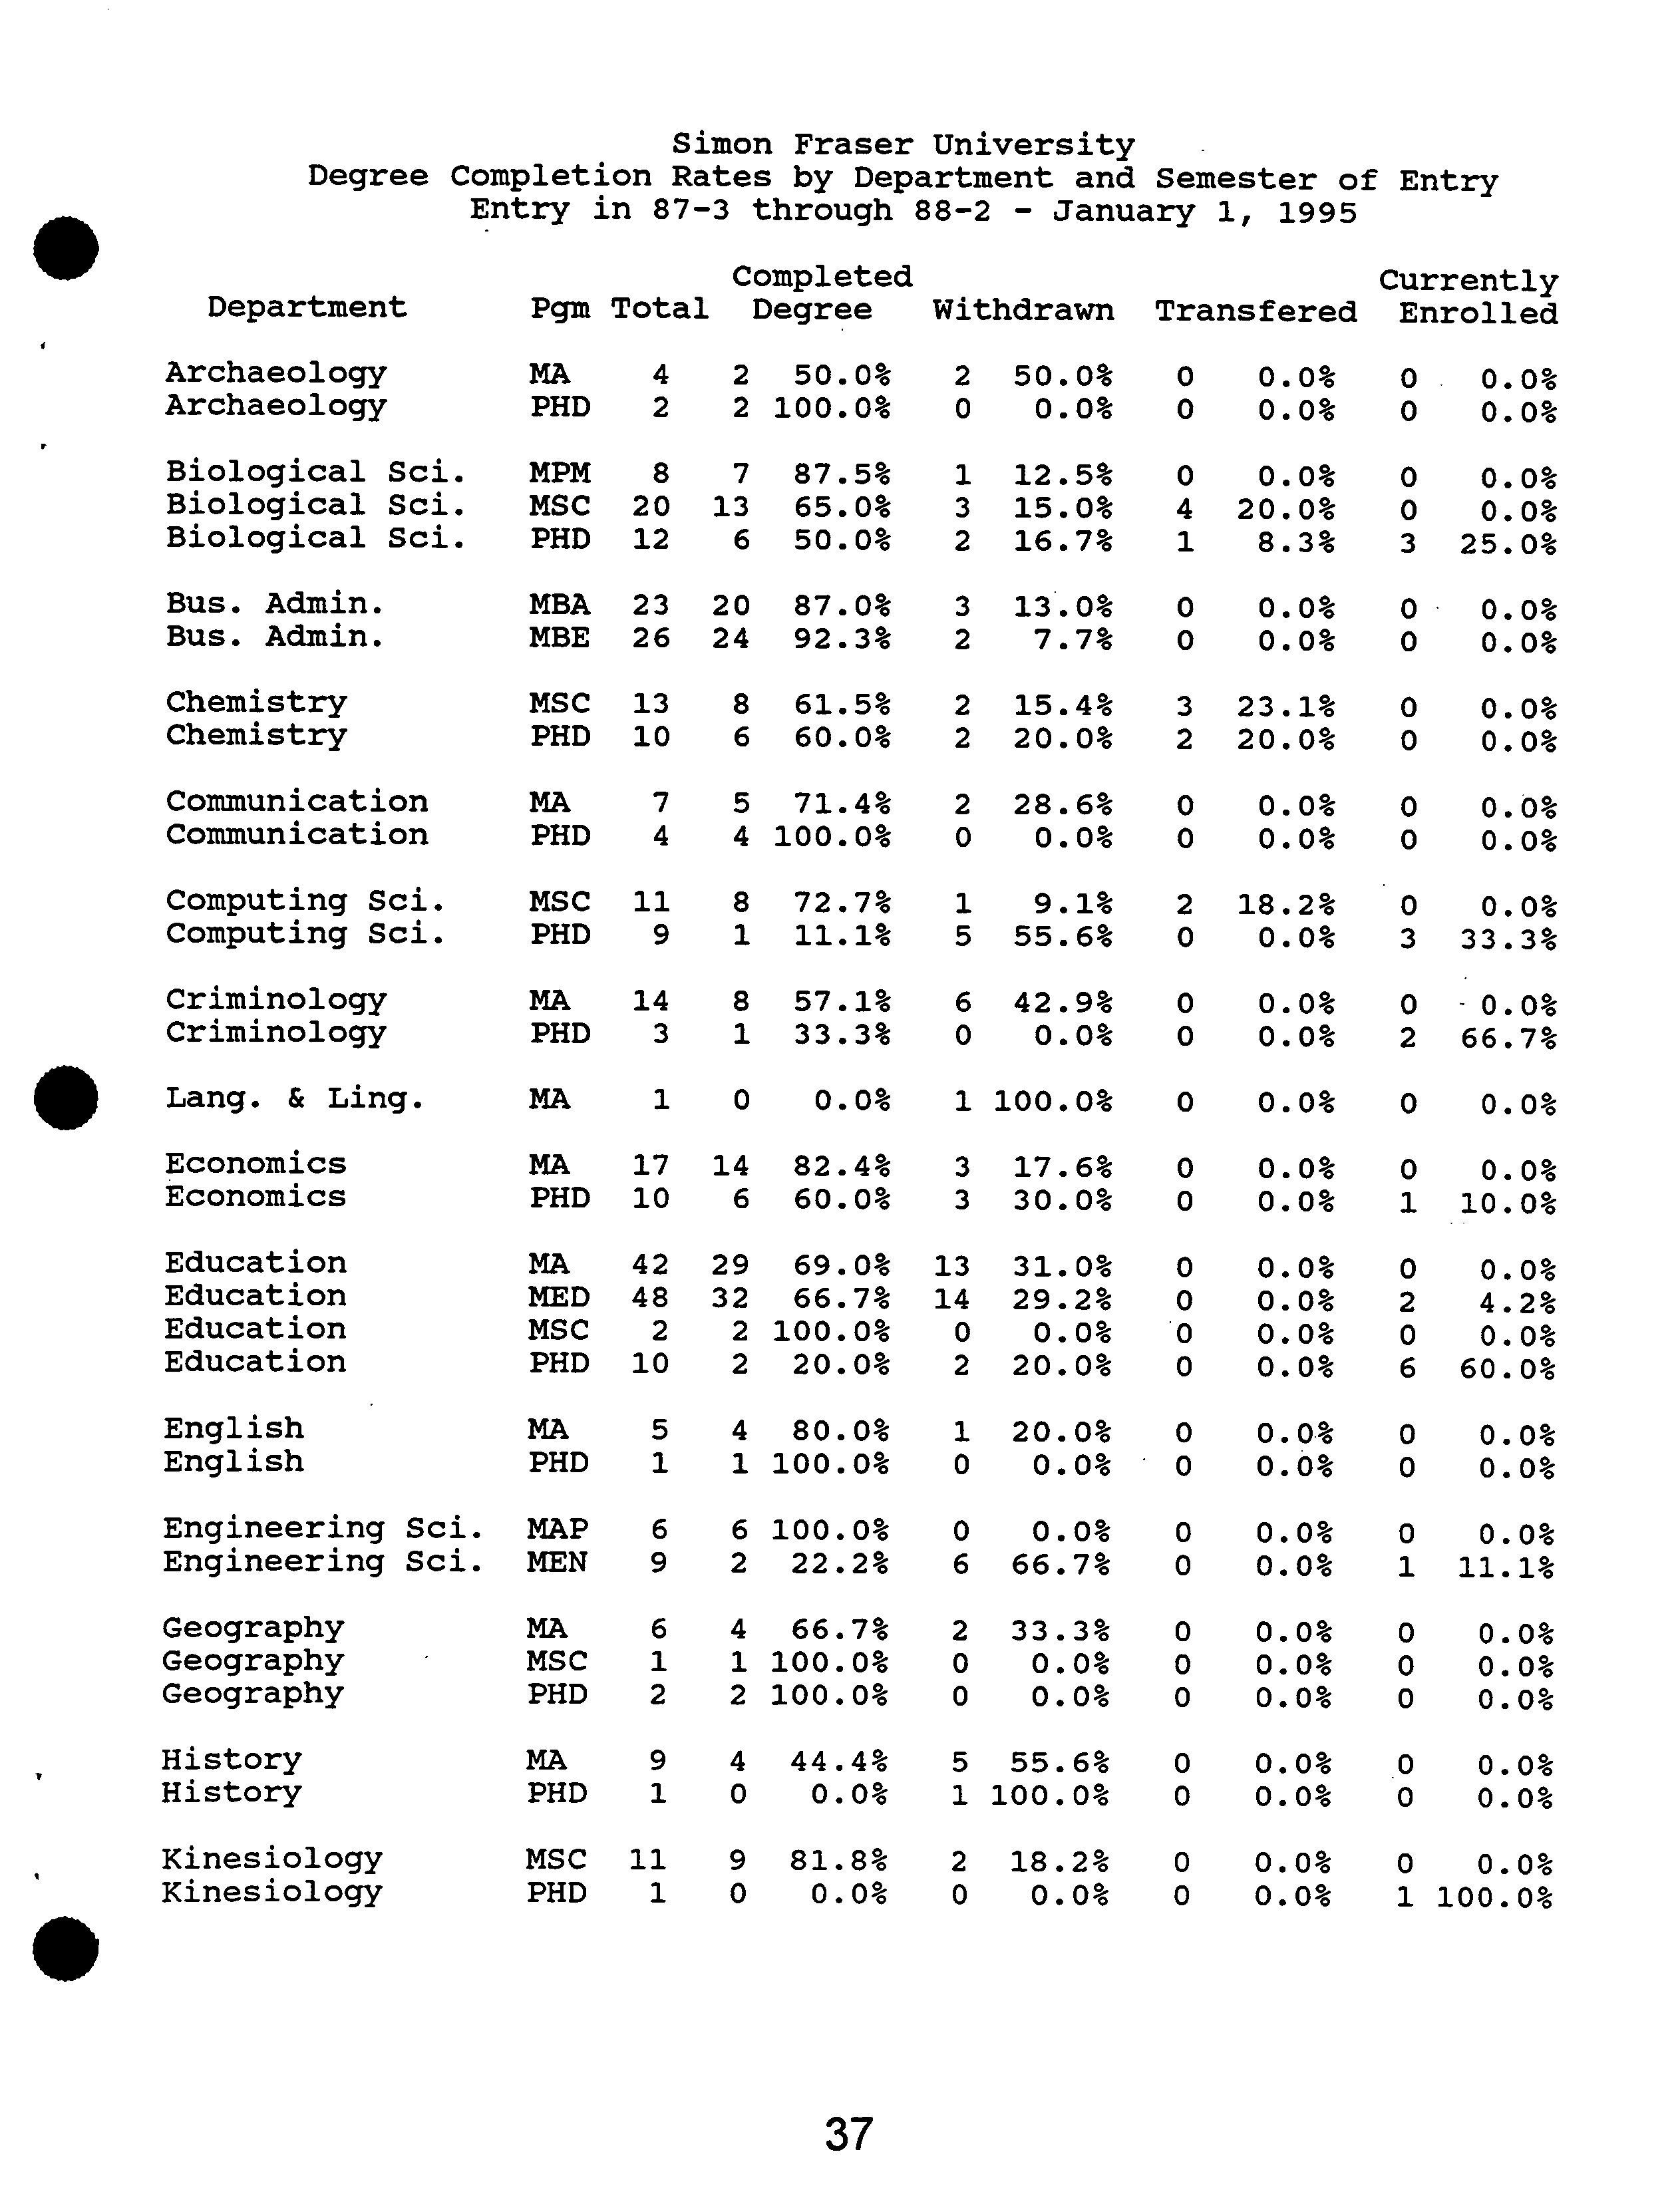
Simon Fraser
University
Degree Completion
Rates
by Department
and
Semester of
Entry
.
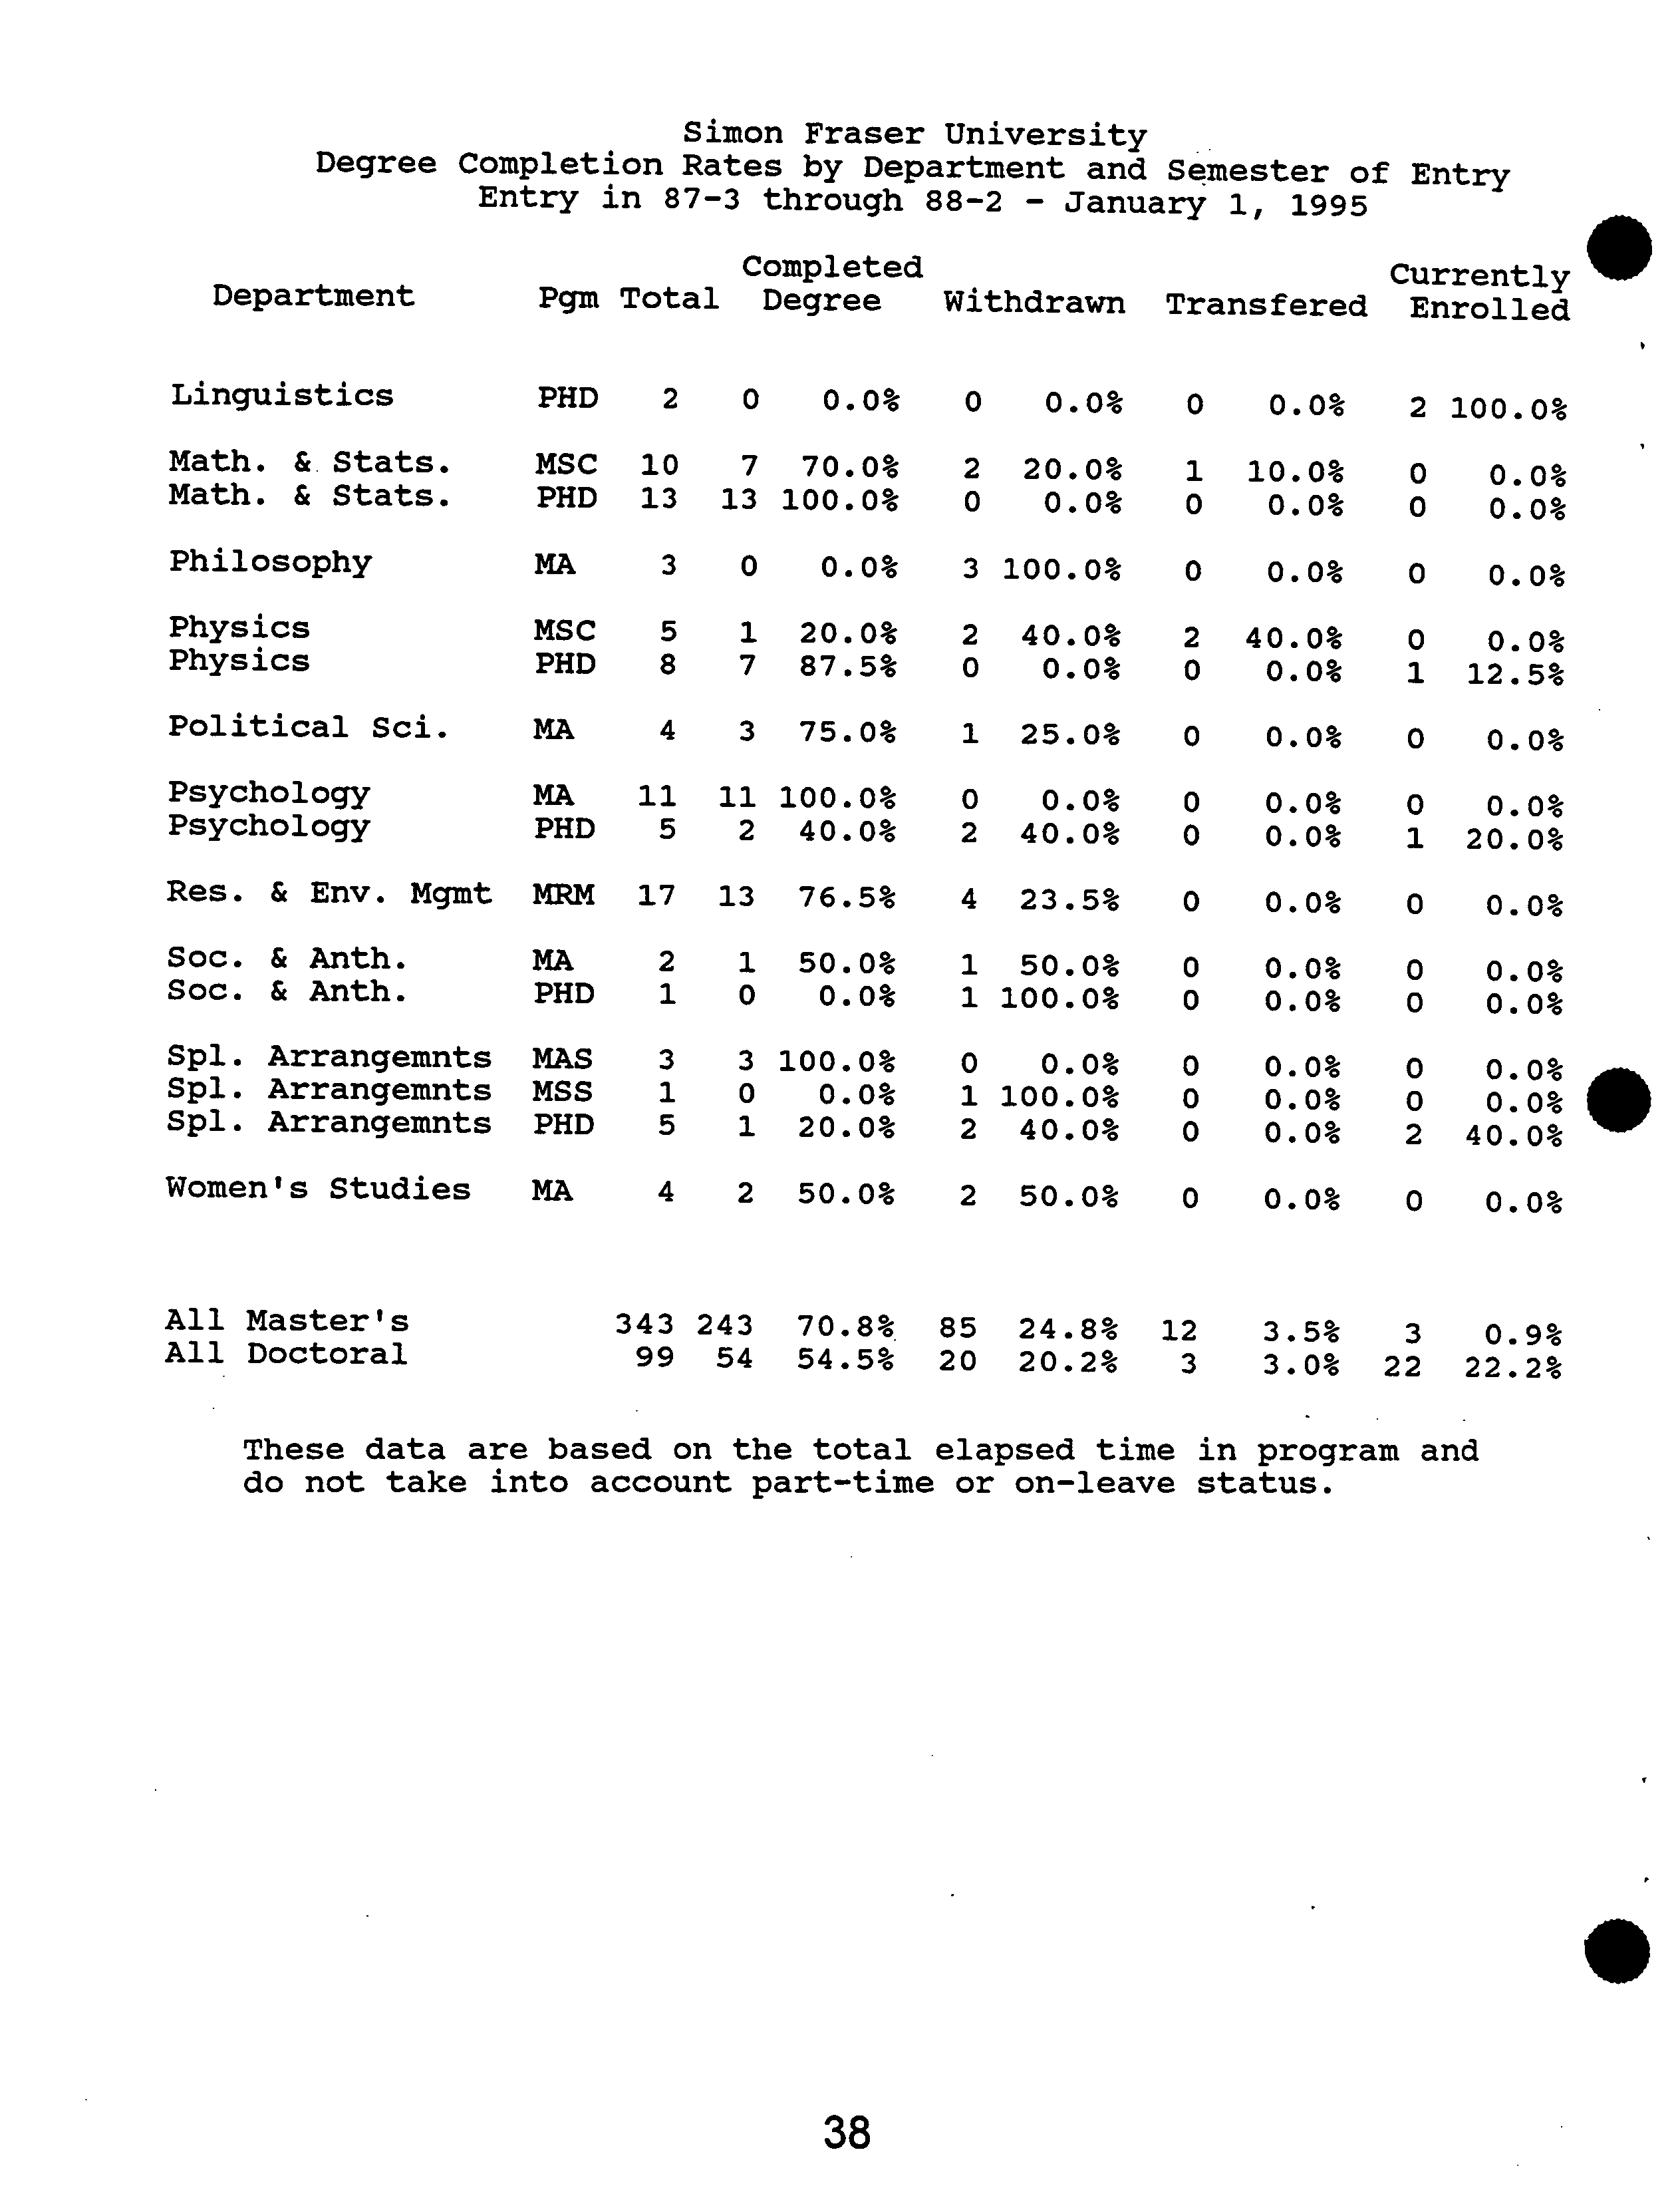
Entry in 87-3
through 88-2
- January
1,
?
1995
Completed
Currently
Department
Pgm
Total
Degree
Withdrawn
Transfered
Enrolled
Archaeology
MA
4
2
50.0%
2 50.0%
0
0.0%
0
0.0%
Archaeology
PHD
2 2
100.0%
0 0.0%
0
0.0%
0
0.0%
Biological Sci.
MPH 8
7
87.5%
]. 12.5%
0
0.0%
0
0.0%
Biological Sci.
MSC
20 13
65.0%
3
15.0%
4
20.0%
0
0.0%
Biological Sci.
PHD
12
6
50.0%
2 16.7%
1
8.3%
3
25.0%
Bus. Admin.
MBA
23
20
87.0% 3
13.0%
0
0.0%
0
0.0%
BUS.
Admin.
MBE
26
24
92.3%
2 7.7%
0
0.0%
0
0.0%
Chemistry
MSC
13
8
61.5%
2 15.4%
3
23.1%
0
0.0%
Chemistry
PHD
10 6
60.0%
2
20.0%
2
20.0%
0
0.0%
Communication
MA 7
5
71.4%
2
28.6%
0 0.0%
0
0.0%
Communication
PHD 4
4
100.0%
0
0.0%
0
0.0%
0
0.0%
Computing Sci.
MSC 11
8
72.7%
1
9.1%
2 18.2%
0
0.0%
Computing Sci.
PHD
9
1 11.1%
5
55.6%
0
0.0%
3
33.3%
Criminology
MA
14
8 57.1%
6
42.9%
0
0.0%
0
- 0.0%
Criminology
PHD
3
1
33.3%
0 0.0%
0
00%
2
66.7%
Lang. & Ling.
MA
1 0
0.0%
1 100.0%
0
0.0%
0
0.0%
Economics
MA
17
14
82.4%
3
17.6%
0
0.0%
0
0.0%
Economics
PHD
10 6
60.0%
3
30.0%
0
0.0%
1
10.0%
Education
MA 42
29
69.0%
13
31.0%
0
0.0%
0
0.0%
Education
MED
48
32
66.7% 14
29.2%
0
0.0%
2
4.2%
Education
MSC
2 2
100.0%
0
0.0%
. 0
0.0%
0
0.0%
Education
PHD
10
2
20.0%
2
20.0%
0
0.0%
6
60.0%
English
MA
5
4
80.0%
1
20.0%
0
0.0%
0
0.0%
English
PHD
1
1 100.0%
0
0.0%
0
0.0%
0
0.0%
Engineering Sci.
MAP
6
6
100.0%
0
0.0%
0
0.0%
0
0.0%
Engineering Sci.
MEN
9 2
22.2%
6
66.7%
0
0.0%
1
11.1%
Geography
MA
6
4
66.7%
2 33.3%
0
0.0%
0
0.0%
Geography
MSC
1
1
100.0%
0
0.0%
0
0.0%
0
0.0%
Geography
PHD
2
2 100.0%
0
0.0%
0
0.0%
0
0.0%
History
MA
9
4 44.4%
5 55.6%
0
0.0%
0
0.0%
History
PHD 1
0
0.0%
1 100.0%
0 0.0%
0
0.0%
Kinesiology
MSC 11
9 81.8%
2
18.2% 0
0.0%
0
0.0%
Kinesiology
PHD
1
0
0.0%
0
0.0% 0
0.0%
1
100.0%
37
Simon Fraser University
Degree Completion
Entry in 87-3
Rates
through
by Department
88-2 - January
and Semester
1, 1995
of Entry
?
Completed ?
Currently
Department ?
Pgm Total Degree Withdrawn Transfered Enrolled
Linguistics
PHD
2
0
0.0%
0
0.0%
0
0.0%
2
100.0%
Math.
Math.
&
& Stats.Stats.
MSC
PHD
13
10
13
7
100.0%70.0%
20
20.0%0.0%
01
10.0%0.0%
0
0
0.0%
0.0%
Philosophy
MA
3
0
0.0%
3
100.0%
0
0.0%
0
0.0%
PhysicsPhysics
MSC
PHD
8
5
71
87.5%20.0%
2
0
40.0%0.0%
0
2
40.0%0.0%
10
12.5%
0.0%
Political Sci.
MA
4
3
75.0%
1
25.0%
0
0.0%
0
0.0%
PsychologyPsychology
MA
PHD
11
5
11
2
100.0%40.0%
2
0
40.0%0.0%
0
0
0.0%0.0%
01
20.0%
0.0%
Res. & Env. Mgint
MRN 17
13
76.5%
4
23.5%
0
0.0%
0
0.0%
Soc.
Soc.
&
& Anth.Anth.
MA
PHD
2
1
1
0
50.0%0.0%
11
100.0%50.0%
00
0.0%0.0%
00
0.0%
0.0%
Spi.
Spi.
Spi.
ArrangemntsArrangemntsArrangemnts
MAS
MSS
PHD
5
3
1
30
1
100.0%20.0%0.0%
2
1
0
100.0%40.0%0.0%
000
0.0%0.0%0.0%
200
40.0%
00%
0..0%
Women's Studies
MA
4
2
50.0%
2
50.0%
0
0.0%
0
0.0%
All
All DoctoralMaster's ??
343
99 54
243
54.5%
70.8%
20
85
20.2%
24.8%
?
12
3
??
3.0%
3.5% ?
22
3 ?
22.2%
0.9%
These data are based on the total elapsed time in program and
do not take into account part-time or on-leave status.
iEII
12
E:12
112
13
14
SM
___
14
1 15
18
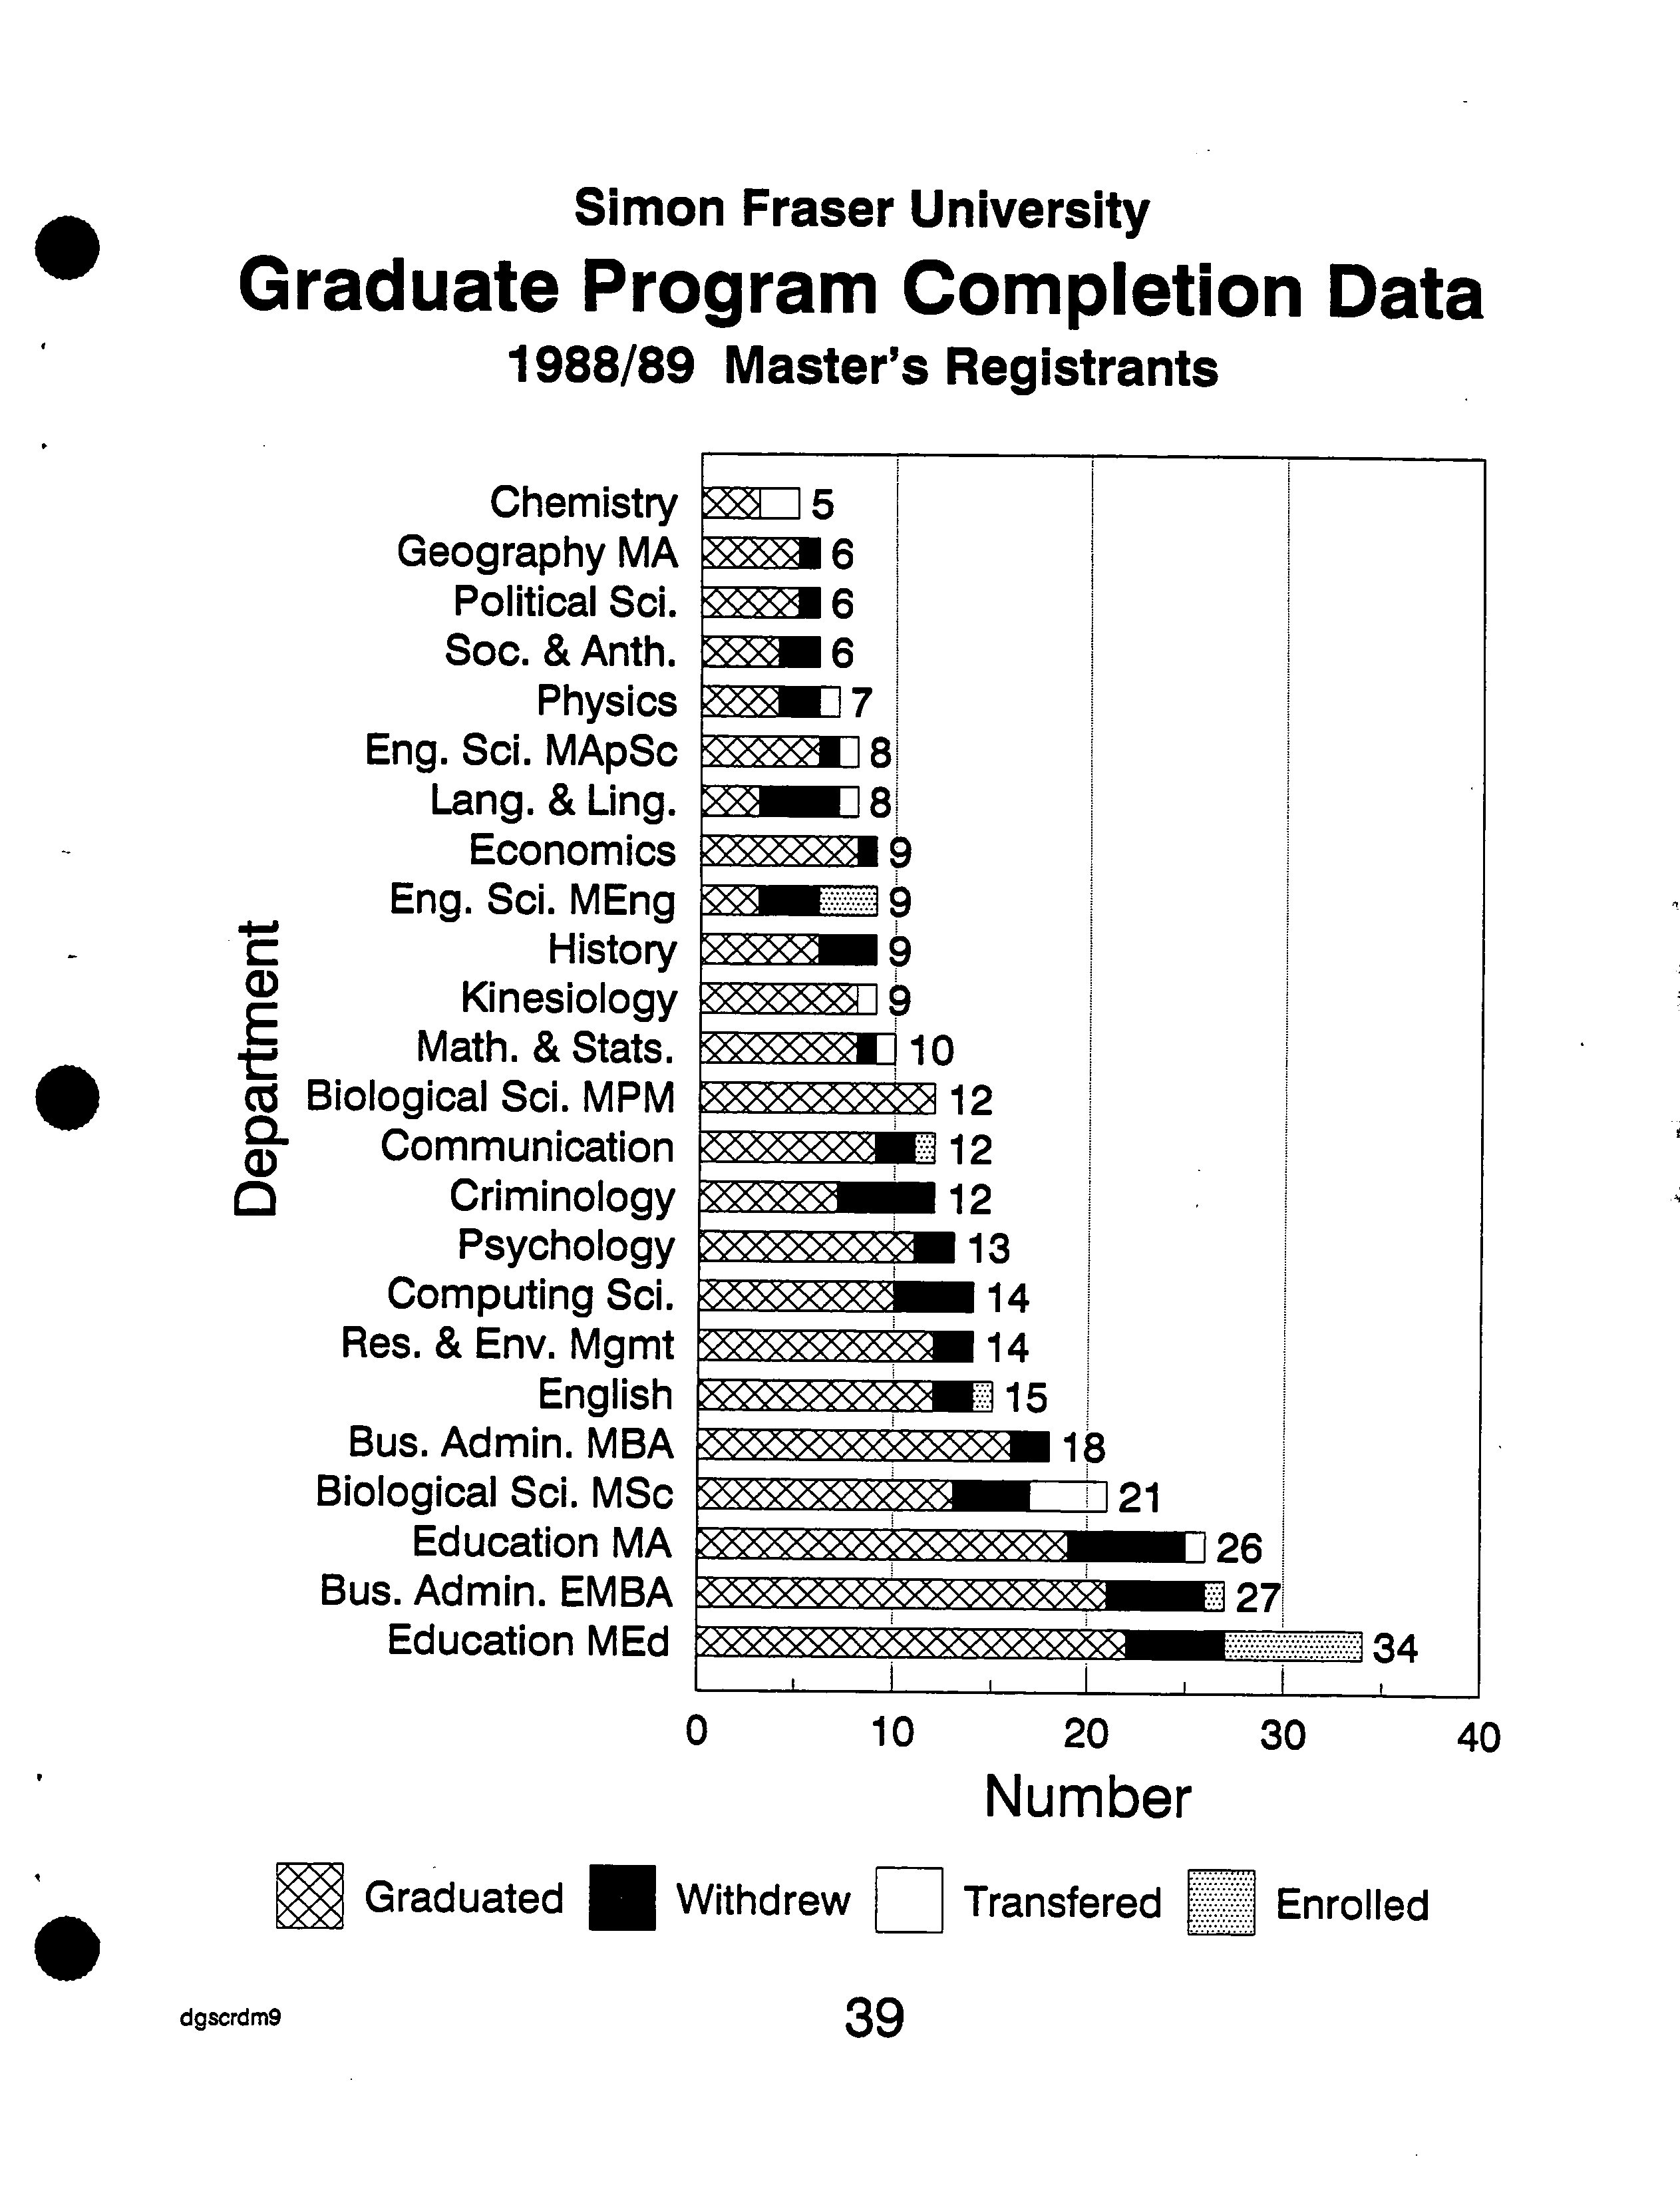
Simon Fraser University
Graduate Program Completion Data
1988/89 Master's Registrants
1]
Chemistry
Geography MA
Political Sd.
Soc. & Anth.
Physics
Eng. Sd. MApSc
Lang. & Ling.
Economics
Eng. Sd. MEng
History
Kinesiology
Math. & Stats.
co
Biological Sci. MPM
CL
?
Communication
Criminology
Psychology
Computing Sci.
Res. & Env. Mgmt
English
Bus. Admin. MBA
Biological Sci. MSc
Education MA
Bus. Admin. EMBA
Education MEd
5
16
16
16
1117
1118
0 ?
10
?
20 ?
30
?
IN
Number
Graduated ___ Withdrew
1:1
Transfered
?
Enrolled
dgscrdm9
?
39
Simon Fraser University
Graduate Program Completion Data
1988/89 Doctoral Registrants
is
0 ?
2 ?
4
?
6 ?
8
?
10 12 14 16
Number
Graduated
0
Withdrew
1:1
Transfered
Enrolled
dgscrdp9
40
I
Criminology
Geography
Spi. Arrangemnts
Kinesiology
Communication
History
CD
E
Physics
cz
CL
Chemistry
a)
Computing Sd.
Math. & Stats.
Economics
Education
Psychology
Biological Sd.
Simon Fraser
University
Degree Completion
Rates
by Department
and
Semester of
Entry
Entry
in 88-3
through
89-2
- January
1, ?
1995
Completed
Currently
Department
Pgm Total
Degree
Withdrawn
Transfered
Enrolled
ArchaeologyArchaeology
MA
PHD
2
1
1
1
100.0%50.0%
01
50.0%0.0%
00
0.0%0.0%
0
0
0.0%
0.0%
Biological
Biological
Biological
Sci.Sci.
Sd.
MSCMPM
PHD
21
1412
1213
7
100.0%50.0%61.9%
4
2
0
19.0%14.3%0.0%
4
01
19.0%7.1%0.0%
400
28.6%
0.0%
0.0%
Bus.Admiri.Bus.
Admin.
MBEMBA
2718 2116
77.8%88.9%
5
2
11.1%18.5%
00
0.0%0.0%
1
0
3.7%
0.0%
ChemistryChemistry
MSC
PHD
5
6
3
0
60.0%0.0%
0
3
50.0%0.0%
2
0
40.0%0.0%
3
0
50.0%
0.0%
CommunicationCommunication
MAPHD
12
5
91
20.0%75.0%
2
0
16.7%0.0%
0
0
0.0%0.0%
41
80.0%
8.3%
Computing
Computing
Sci.Sci.
MSCPHD
14
6
10
3
71.4%50.0%
4
2
28.6%33.3%
0
0
0.0%0.0%
01
16.7%
0.0%
CriminologyCriminology
MA
PHD
12
3
7
1
58.3%33.3%
5
1
41.7%33.3%
00
0.0%0.0%
1
0
33.3%
0.0%
W
Lang.
Lang.
&
& Ling.Ling.
MA
PHD
8
2
-
?
1
3
50.0%37.5%
4
1
50.0%50.0%
1
0
12.5%0.0%
00
0.0%
0.0%
EconomicsEconomics
MA
PHD
79
81
88.9%14.3%
3
1
42.9%11.1%
00
0.0%0.0%
3
0
42.9%
0.0%
EducationEducationEducationEducation
MSCMEDMAPHD
26
34
71
2219
40
57.1%73.1%64.7%0.0%
5
006
23.1%14.7%0.0%
0.0%
00
11
14.3%0.0%0.0%3.8%
7
201
100.0%
20.6%
28.6%
0.0%
EnglishEnglish
MA
PHD
15
2
12
0
80.0%0.0%
2
0
13.3%0.0%
00
0.0%0.0%
2
1
100.0%
6.7%
Engineering
Engineering
Sci.Sci.
MAPMEN
9
8
3
6
75.0%33.3%
1
3
33.3%12.5%
10
12.5%0.0%
3
0
33.3%
0.0%
GeographyGeographyGeography
MA
MSCPHD
23
6
22
5
100.0%83.3%66.7%
00
1
16.7%0.0%0.0%
00
0
0.0%0.0%0.0%
10
0
33.3%
0.0%
0.0%
HistoryHistory
MA
PHD 5
9
16 20.0%66.7%
1
3
20.0%33.3%
00
0.0%0.0%
3
0
60.0%
0.0%
KinesiologyKinesiology
MSCPHD
9
4
28 50.0%88.9%
0
0
0.0%0.0%
0
1
11.1%0.0%
2
0
50.0%
0.0%
41
Simon Fraser
University
Degree CompletionEntry
in 88-3Rates
throughby
Department
89-2
- Januaryand
Semester
1, ?
1995
of Entry
Completed
Currently
Department
Pgm
Total
Degree
Withdrawn
Transfered
Enrolled
Math.
Math.
&
& Stats.Stats.
MSCPHD
10
6
84
80.0%66.7%
01
10.0%0.0%
01
10.0%0.0%
20
33.3%
0.0%
Philosophy
MA.
1
1
100.0%
0
0.0%
0
0.0%
0
0.0%
PhysicsPhysics
MSCPHD
75
44
80.0%57.1%
2
1
20.0%28.6%
0
1
14.3%0.0%
00
0.0%
0.0%
Political Sci.
MA,
6
5
83.3%
1
16.7%
0
0.0%
0
0.0%
PsychologyPsychology
MA
PHD
13
8
11
2
25.0%84.6%
2
0
15.4%0.0%
00
0.0%0.0%
60
75.0%
0.0%
Res. & Env. Mgmt
MRN
14
12
85.7%
2
14.3%
0
0.0%
0
0.0%
Soc.
Soc.
&
&Anth.
Anth.
MA
PHD
1
6
40
66.7%0.0%
2
1100.0%
33.3%
0
0
0.0%0.0%
00
0.0%
0.0%
Spi.
Spi.
ArrangemntsArrangemnts
MAS
PHD
33
1
3
100.0%33.3%
00
0.0%0.0%
0
0
0.0%0.0%
2
0
66.7%
0.0%
Women's Studies
MA
1
1
100.0%
0
0.0%
0
0.0%
0
0.0%
All
All
DoctoralMaster's
32088
235
35
73.4%39.8%
5915
18.4%17.0%
12
2
2.3%3.8%
3614
40.9%
4.4%
These data are based on the total elapsed time in program and
do not take into account part-time or on:--leave status.
42
Simon Fraser University
Master's Program Withdrawals
Fall 1985- Fall 1994 Part
.
Contemp. Arts
Biological Sci. MPM
Bus. Admin.
Kinesiology
Psychology
Engineering Sd.
E
Bus. Admin. EMBA
Cz
Geography MSc
8'
Bus. Admin. MBA
?
Computing Sci.
?
Education MSc?
Biological Sci. MSc?
Math. & Stats.
?
Res. & Env. Mgmt
?
Physics ?
Biological Sd. MAq
IE
8
10
PIP,
r ?
v
15
15
16
21
22
0 ?
10
?
20
Fraction
of Withdrawals (%)
University
Average: 23%
•
dgswdrl
?
43
Simon Fraser University
Master's Program Withdrawals
Fall 1985 - Fall 1994 Part 'U
?
Economics
?
22
?
Chemistry
?
23
?
Communication
?
124
?
Geography MA
?
24
Education MEd
Education MA
Cz
?
English
?
30
C)
?
Archaeology
?
31
Political Sd.
History
Soc. & Anth.
Criminology
Women's Studies
Philosophy
?
Eng. Sci. MEng
?
70
I
S
o
10 20 30 40 50 60 70 80
Fraction of Withdrawals (%)
University Average: 23%
dgswdr2 ?
44
45
Simon Fraser University
Doctoral Program Withdrawals
Fall 1985- Fall 1994
o
10 20 30 40 50 60 70 80 90
Fraction of Withdrawals (%)
University Average: 31%
•
.
Physics
Math. & Stats.
Chemistry
Biological Sd.
Psychology
Archaeology
Communication
E
Education
cz
Geography
Kinestology
Lang. & Ling.
Spi. Arrangemnts
English
Economics
Criminology
Computing Sd.
Soc. & Anth.
History
Engineering Sci.
.
Simon Fraser University Completion Statistics
All
Students since Fall
1985
Report
Dated:
January 1,
1995
Active
Total
W/D
Department
Pgm
Now
Degree
Trf
W/D
Completed
Rate
(%)
ArchaeologyArchaeology
PHD
MA
2312
3417
00
15
5
2249
23
31
Biological
Biological
Biological
Biological
Sci.Sci.Sci.Sci.
MSCMAQMPMPHD
74
33
15
62
100
93
86
13
26
3
11
2628
84
12215495
18
21
22
18
8
Bus.
Bus.
Bus. Admin.Admin.Admin.
MBWMBEMBA
121
7096
26318845
0
00
40
32
5
220303
50
10
13
15
ChemistryChemistry
MSC
PHD
2641
4945
15
6
1913
8364
23
20
CommunicationCommunication
PHD
MA
41
33
76
13
01
24
4
101
17
24
24
Computing,
Computing Sci.
Sci.
MSCPHD
4339
131
20
5
3
2524
16048
52
15
Contemp. Arts
MFA
12
14
0
0
14
0
CriminologyCriminology
PHD
MA
20
38
75
6
0
3
49
6
127
12
50
39
EconomicsEconomics
PHD
MA
4836
142
44
2
0
40
39
18285
46
22
EducationEducationEducationEducation
MEDMSC
PHD
MA
122180
63
34
239307
2028
41
11
107
12
97
4
41534041
25
29
29
26
16
Engineering
Engineering
Engineering
Sci.Sci.
Sd.
MENMAP
PHD
223946
1264
1
411
31
9
9
447711
82
70
12
EnglishEnglish
'PHD
MA
2333
92
9
0
1
39
7
13216
44
30
French
MA
1
0
0
0
0
N/A
GeographyGeographyGeography
MSC
PHD'
MA
142418
223419
100
11
9
3
23
3145
29
24
13
HistoryHistory
PHD
MA
1230
59
8
0
1
1136
9619
58
38
• .continued...
46
Simon Fraser University
Completion Statistics
All Students since
Fall
1985
.
Report Dated: January
1,
1995
Active
Total
W/D
Department
Pgm
Now
Degree
Trf
W/D
Completed
Rate (%)
KinesiologyKinesiology
MSC
PHD
2227
1762
80
9
9
26
79
11
35
Lang.
Lang.
&
& Ling.Ling.
PHD
MA
00
24
7
1
3
13
5
40
13
38
33
Liberal Studies
MAL
65
0
0
12
12
100
LinguisticsLinguistics
PHD
MA
16
7
00
00
0
0
00
N/A
N/A
Math.
Math.
&
& Stats.Stats.
MSC
PHD
27
33
9040
2
3
2210
115
52
19
19
PhilosophyPhilosophy
PHD
MA
14
1
13
0
00
12
0
25
0
N/A
48
PhysicsPhysics
MSCPHD
2334
4843
15
0
17
7
8050
21
14
•
Political Sci.
MA
44
40
0
23
63
37
PsychologyPsychology
PHD
MA
7040
5585
01
1511
9770
21
11
Res.
Res.
&
& Env.
Env.
MgmtMgmt
MRM
PHD
75
3
123
0
01
30
0
154
0
N/A
19
Soc.
Soc.
&
& Anth.Anth.
PHD
MA
10
33
24
9
00
1510
3919
53
38
Sp. & Lat. Am. S
MA
12
0
0
1
1
100
Spi.
Spi.
Spi.
Spi. ArrangeinritsArrangemritsArrangeinntsArrangemnts
MPBMSS
MAS
PHS
28
10
1
1917
22
0000
12
201
19
31
2
3
39
11
33
0
Women's Studies
MA
16
14
0
12
26
46
TotalsTotalsTotals
??
DoctoralMasters
All 21461546
600
3102
2606
496
116
1997
1039234805
42573508749
23
31
24
Active Now = headcount
enrolment
in
the most recent semester.
Degree = number of
degrees
completed.
Trf = number of
students
who
transferred to
a different
.
degree program
without completing the first.
W/D = number of
students
who
withdrew without completing
a
degree
W/D Rate = ratio of W/D to
Total Completed.
47
25 16.3%
oral Entrance 5 3.3%
Entrance 10 6.5%
Simon Fraser University
Distribution of S.F.U. Awards
Fall 1994
?
11
Master'sGF 66 43.1%
Doctoral GF 47 30.7%
Total One-Semester Awards = 152
?
Full Time Enrolments: Master's = 1
9
257 Ph.D. = 557
.
dgsawl
48
.
.
0