S.96-21
SIMON FRASER UNIVERSITY
OFFICE OF THE VICE-PRESIDENT, ACADEMIC
?
MEMORANDUM
To: ?
Senate
From: ?
D. Gagan, Chair
Senate Committee on Academic Planhing
Subject ?
International Student Intake Targets for 1996/97
Date: ?
February 12, 1996
The Senate Committee on Enrollment Management and Planning and the Senate
Committee on Academic Planning have recommended the following motion for
consideration by Senate. Documentation is attached which provides more background
information.
Motion:
"That Senate approve and recommend approval to the Board of Governors to
limit the number of international students admitted into undergraduate
programs at SF0 in 1996/97 to a maximum of 7% of all admissions."
S
SCAP 96-6
SIMON FRASER UNIVERSITY
MEMORANDUM
TO: Senate Committee on
?
FROM: Walter J
.
Wattamaniuk
Academic Planning ?
Director, Analytical Studies
Secretary to SCEMP
RE: International Student Intake
?
DATE: February 1, 1996
Targets for 1996/97
Each year the Senate Committee on Enrollment Management and Planning
(SCEMP) is required to make a recommendation to SCAP on the maximum
number of international students to be admitted into undergraduate programs for
the next calendar year.
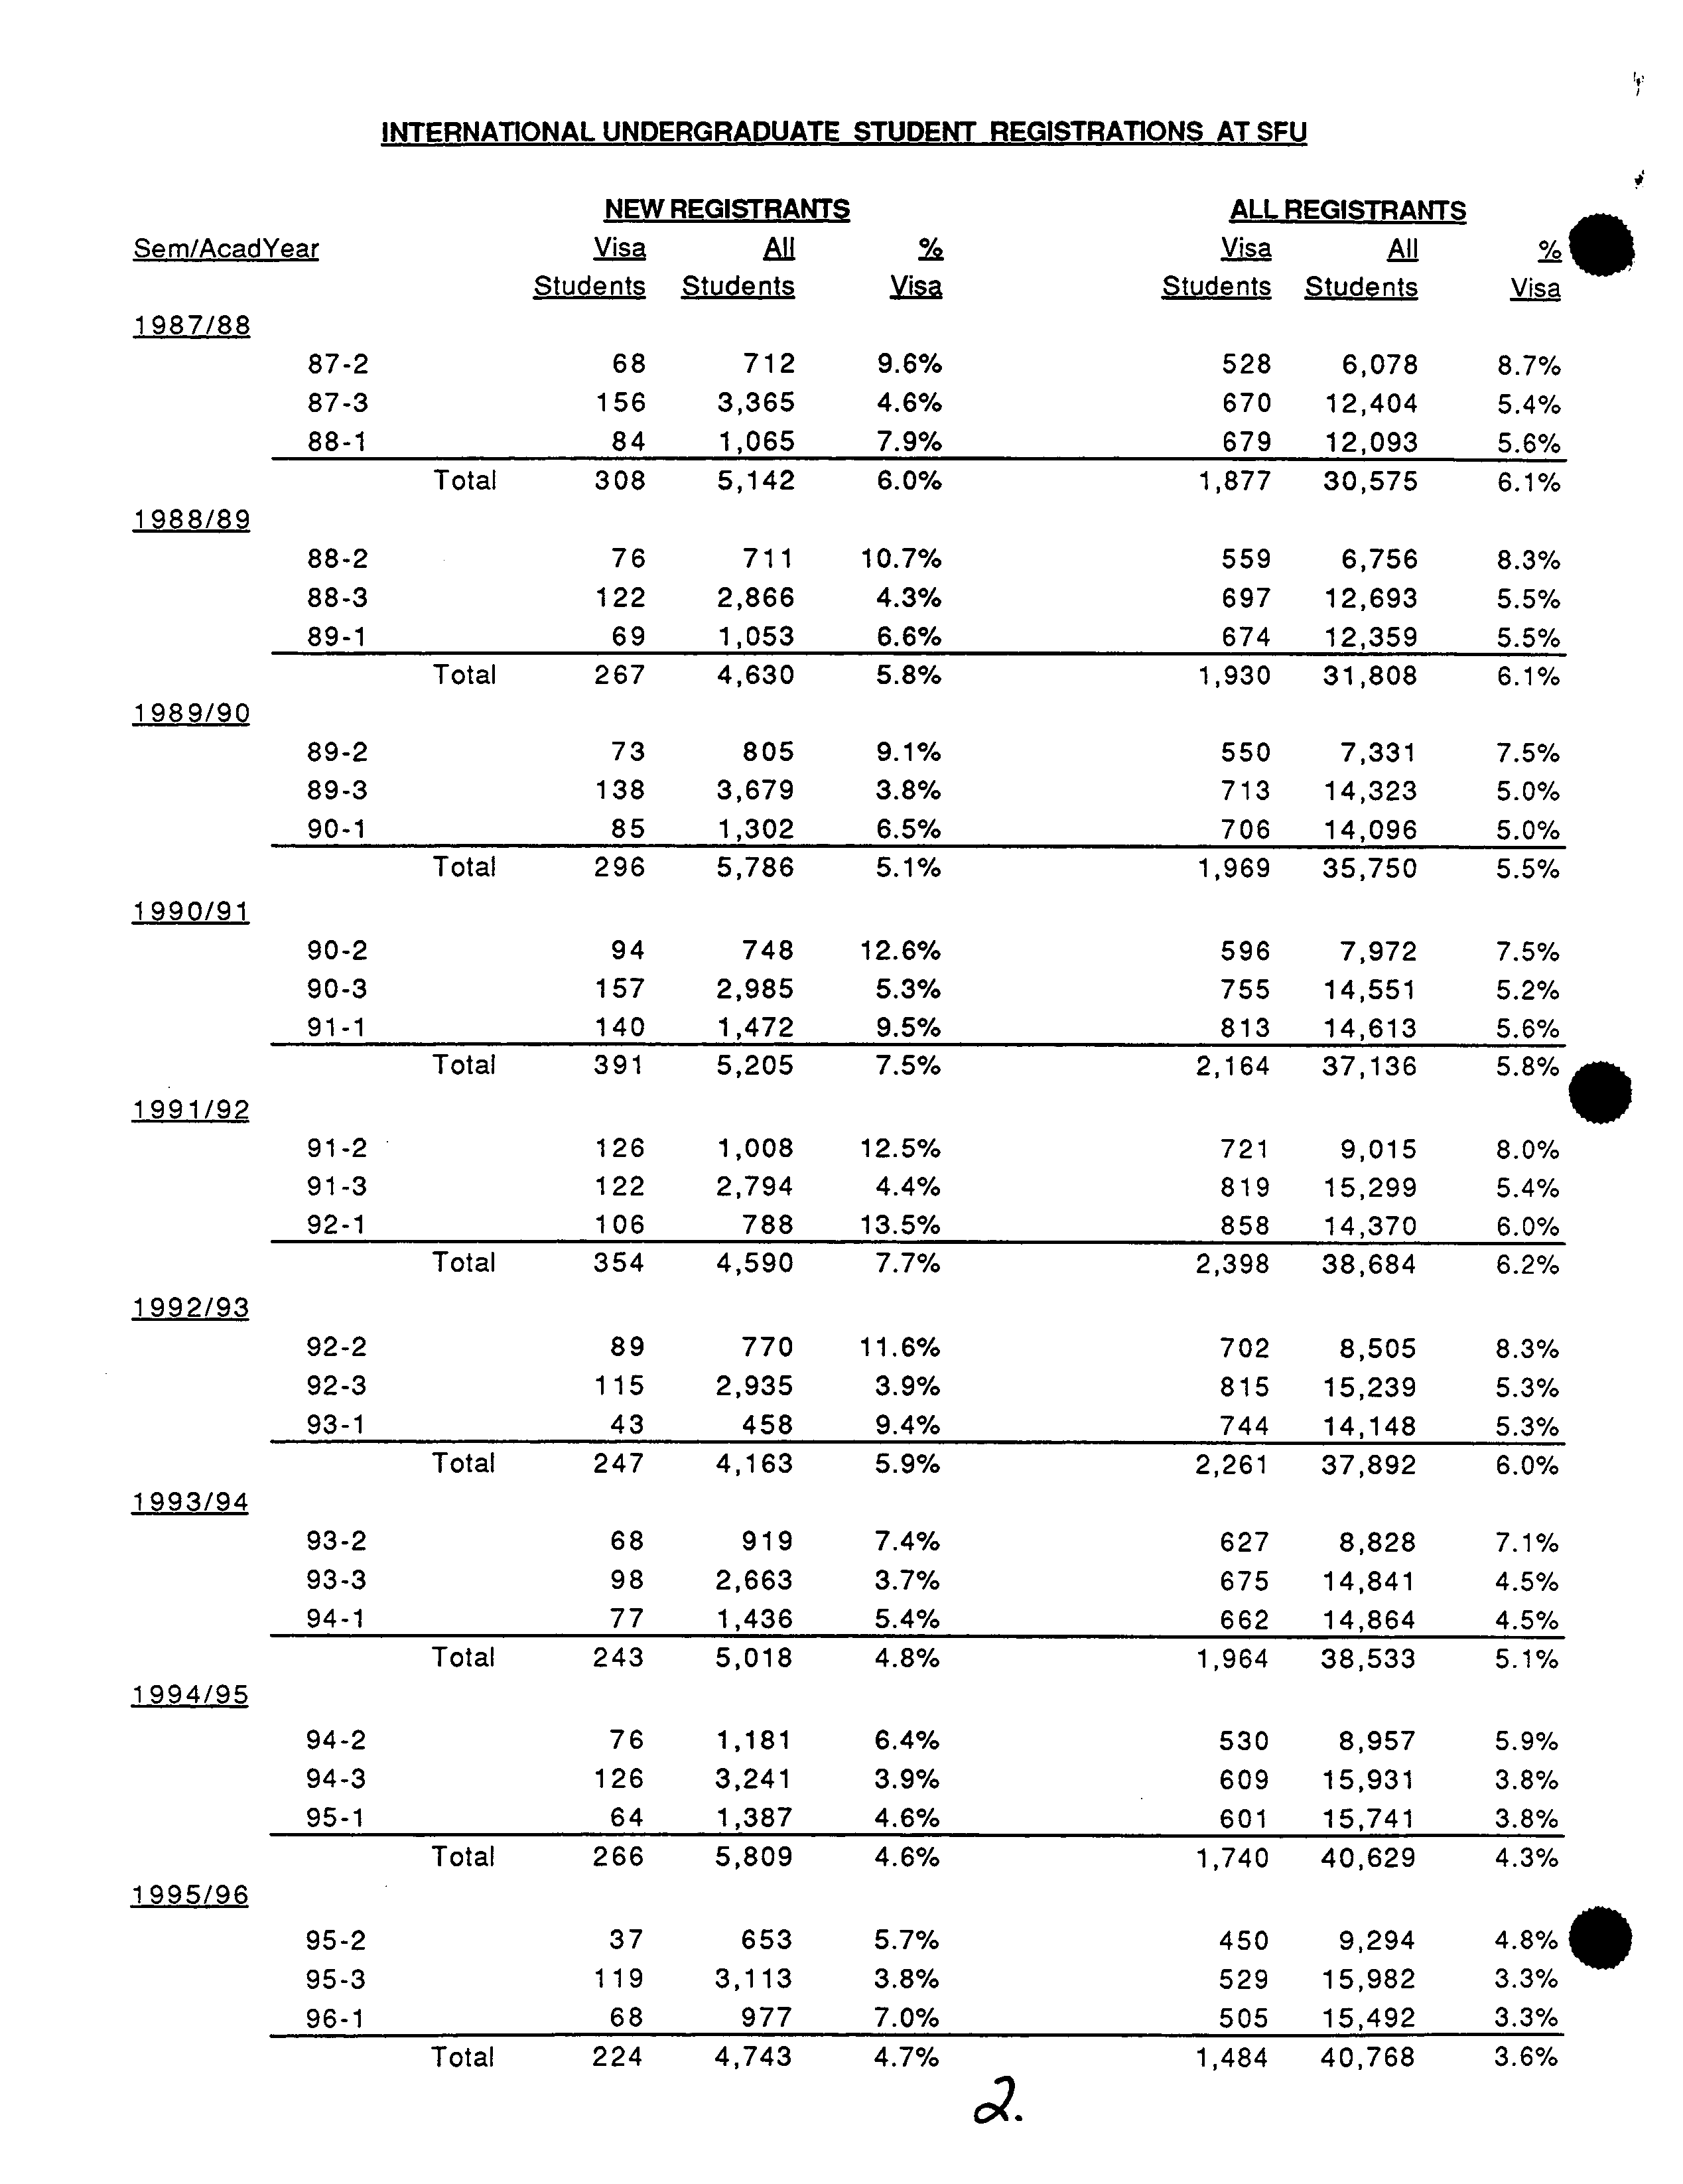
For 1995/96, Senate stipulated that the intake of new international students was not
to exceed 7% of all admissions. The actual intake was 4.7 % of all admissions.
Documentation is attached which provides more background information.
SCEMP met on January 24, 1996 and agreed that no change was required to last
year's policy. The following motion has been prepared for SCAP's approval.
Motion
"That SCAP approve and recommend approval to Senate and the Board to
limit the number of international students admitted into undergraduate
programs at SFU in 1996/97 to a maximum of 7% of all admissions."
Attach.
9
INTERNATIONAL UNDERGRADUATE STUDENT REGISTRATIONS AT SFU
Sem/AcadYea
NEW REGISTRANTS
Visa ?
Aff
YA
ALL REGISTRANTS
Visa ?
All
%
Students Students
Visa
Students
Students
Visa
1987/88
87-2
68
712
9.6%
528
6,078
8.7%
87-3
156
3,365
4.6%
670
12,404
5.4%
88-1
84
1,065
7.9%
679
12,093
5.6%
Total
?
308
5,142
6.0%
1,877 30,575
6.1%
1988/89
88-2
76
711
10.7%
559
6,756
8.3%
88-3
122
2,866
4.3%
697
12,693
5.5%
89-1
69
1,053
6.6%
674
12,359
5.5%
Total
267
4,630
5.8%
1,930
31,808
6.1%
1989/90
89-2
73
805
9.1%
550
7,331
7.5%
89-3
138
3,679
3.8%
713
14,323
5.0%
90-1
85
1,302
6.5%
706
14,096
5.0%
Total
296
5,786
5.1%
1,969
35,750
5.5%
1990/91
90-2
94
748
12.6%
596
7,972
7.5%
90-3
157
2,985
5.3%
755
14,551
5.2%
91-1
140
1,472
9.5%
813
14,613
5.6%
Total
391
5,205
7.5%
2,164
37,136
5.8%
1991/92
91-2
126
1,008
12.5%
721
9,015
8.0%
91-3
122
2,794
4.4%
819
15,299
5.4%
92-1
106
788
13.5%
858
14,370
6.0%
Total
354
4,590
7.7%
2,398
38,684
6.2%
1992/93
92-2
89
770
11.6%
702
8,505
8.3%
92-3
115
2,935
3.9%
815
15,239
5.3%
93-1
43
458
9.4%
744
14,148
5.3%
Total
247
4,163
5.9%
2,261
37,892
6.0%
1993/94
93-2
68
919
7.4%
627
8,828
7.1%
93-3
98
2,663
3.7%
675
14,841
4.5%
94-1
77
1,436
5.4%
662
14,864
4.5%
Total
243
5,018
4.8%
1,964
38,533
5.1%
1994/95
94-2
76
1,181
6.4%
530
8,957
5.9%
94-3
126
3,241
3.9%
609
15,931
3.8%
95-1
64
1,387
4.6%
601
15,741
3.8%
Total
266
5,809
4.6%
1,740
40,629
4.3%
1995/96
95-2
37
653
5.7%
450
9,294
4.8%
95-3
119
3,113
3.8%
529
15,982
3.3%
96-1
68
977
7.0%
505
15,492
3.3%
Total
224
4,743
4.7%
1,484
40,768
3.6%
a?.
250 -
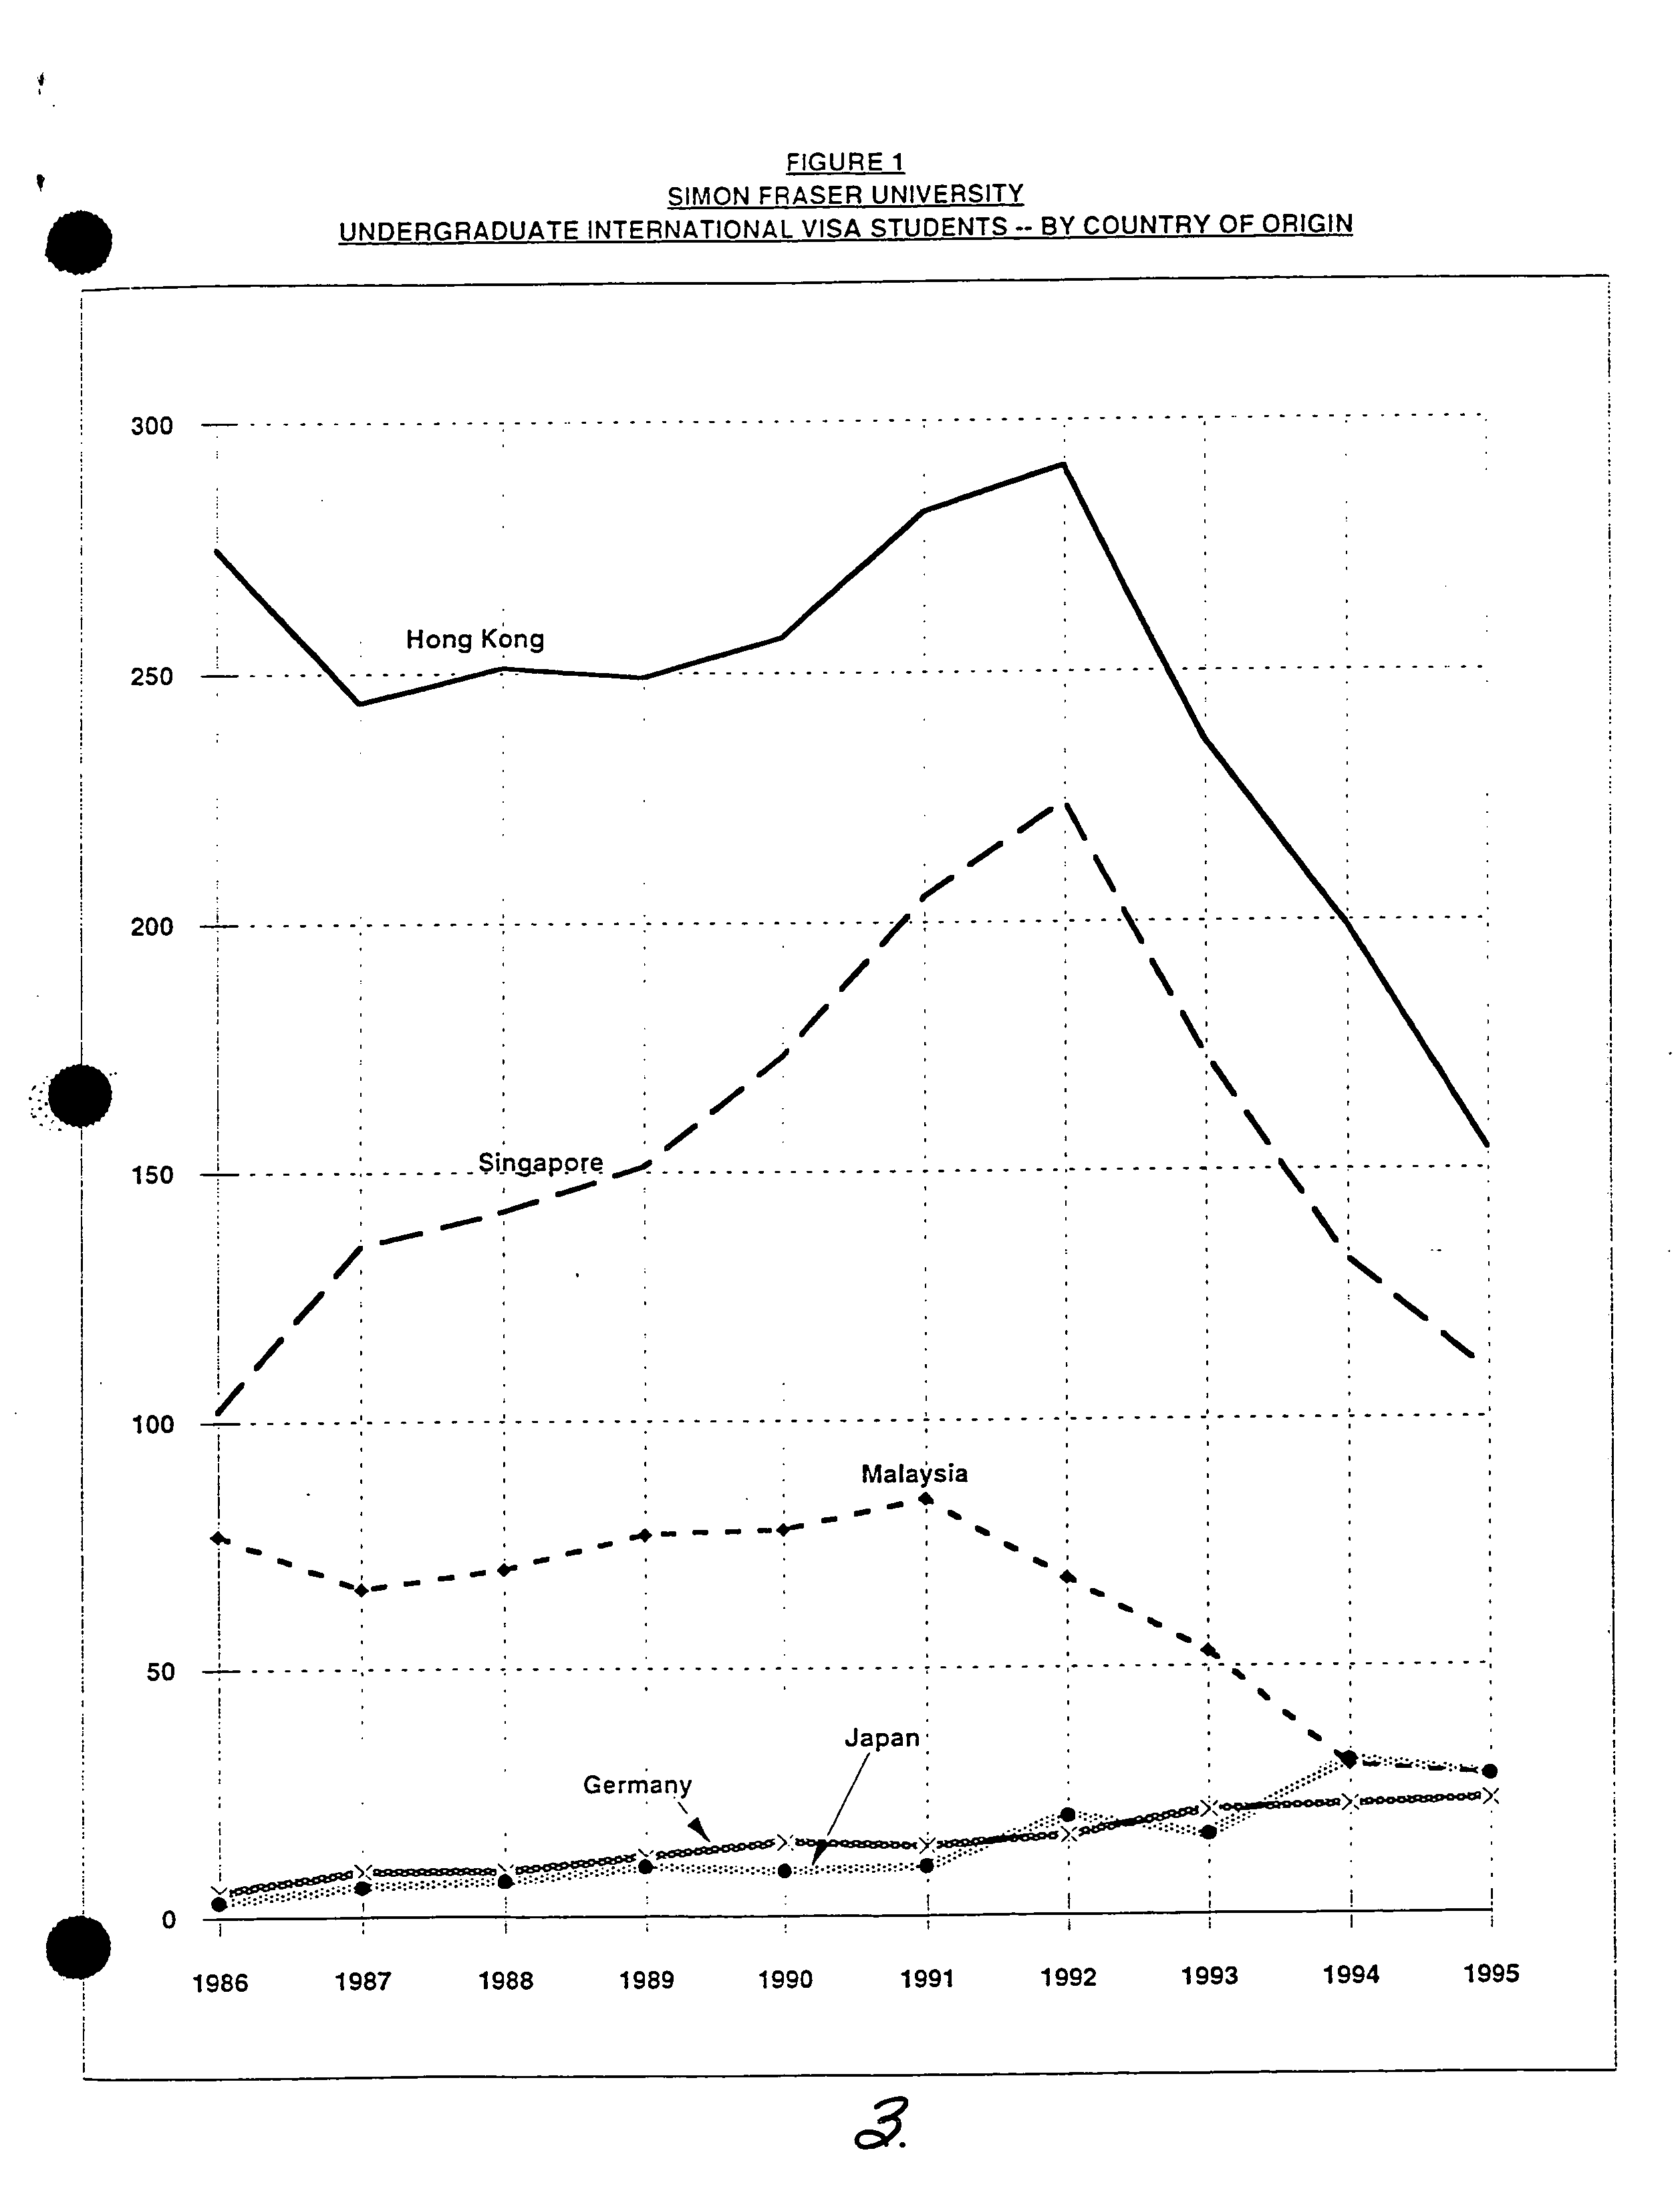
FIGURE 1 ?
SIMON FRASER UNIVERSITY
?
UNDERGRADUATE INTERNATIONAL VISA STUDENTS -- BY COUNTRY OF ORIGIN
300-
150-4--
---------------
Sin.gappe._-
----------------
----------
-------------
---------
I100–
------
----------
---------------------
--------------------------------
Malaysia
I
-
50
-
Japan:
Germany
SX
0
1986
1987
1988 ?
1989 ?
1990
?
1991
1992 ?
1993
1994
1995
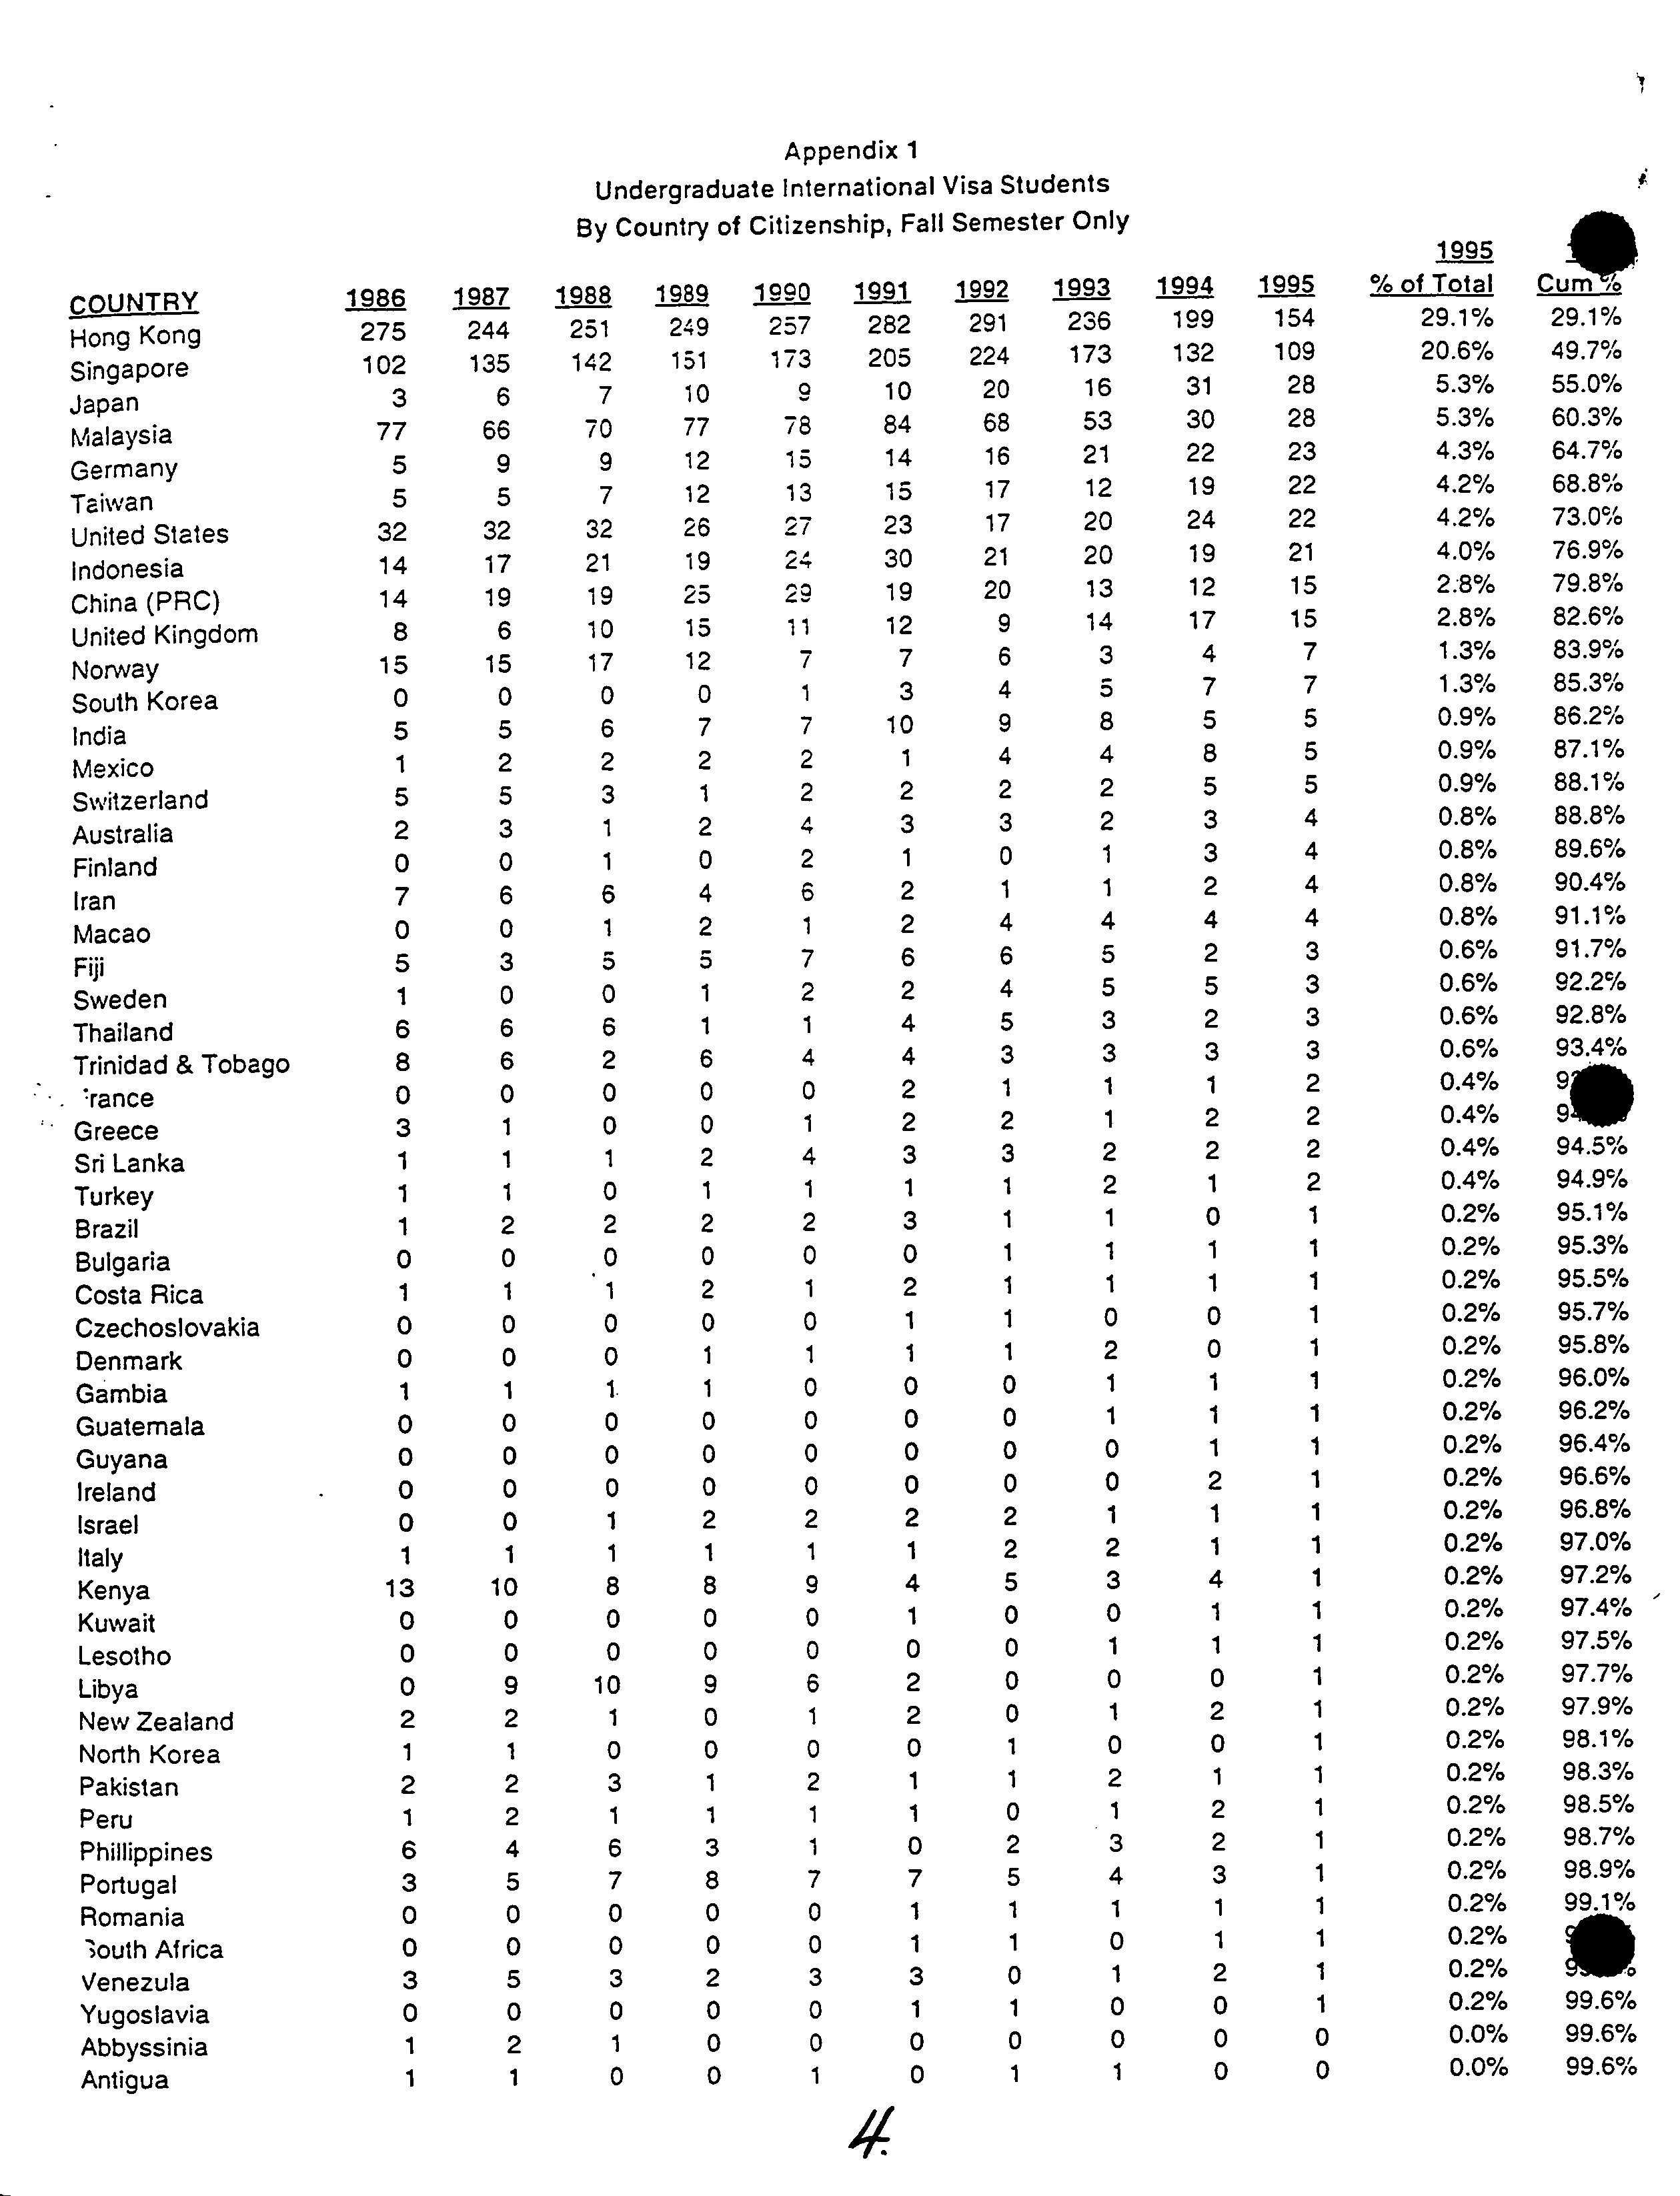
Appendix 1
Undergraduate International Visa Students
By Country of Citizenship, Fall Semester Only
1995
COUNTRY
1986
1981
19
1989
i20
1
99 1
19
i
%
of Total
Cum
Hong Kong
275
244
251
249
257
282
291
236
199
154
29.1%
29.1%
Singapore
102
135
142
151
173
205
224
173
132
109
20.6%
49.7%
3
6
7
10
9
10
20
16
31
28
5.3%
55.0%
Japan
Malaysia
77
66
70
77
78
84
68
53
30
28
5.3%
60.3%
Germany
5
9
9
12
15
14
16
21
22
23
4.3%
64.7%
Taiwan
5
5
7
12
13
15
17
12
19
22
4.2%
68.8%
United States
32
32
32
26
27
23
17
20
24
22
4.2%
73.00%
Indonesia
14
17
21
19
24
30
21
20
19
21
4.0%
76.9%
China (PRC)
14
19
19
25
29
19
20
13
12
15
2.8%
79.8%
United Kingdom
8
6
10
15
11
12
9
14
17
15
2.8%
82.6%
Norway
15
15
17
12
7
7
6
3
4
7
1.3%
83.9%
South Korea
0
0
0
0
1
3
4
5
7
7
1.3%
85.3%
India
5
5
6
7
7
10
9
8
5
5
0.9%
86.2%
Mexico
1
2
2
2
2
1
4
4
8
5
0.9%
87.1%
Switzerland
5
5
3
1
2
2
2
2
5
5
0.9%
88.1%
Australia
2
3
1
2
4
3
3
2
3
4
0.8%
88.8%
Finland
0
0
1
0
2
1
0
1
3
4
0.8%
89.6%
Iran
7
6
6
4
6
2
1
1
2
4
0.8%
90.4%
Macao
0
0
1
2
1
2
4
4
4
4
0.8%
91.10/0
Fiji
5
3
5
5
7
6
6
5
2
3
0.6%
91.7%
Sweden
1
0
0
1
2
2
4
5
5
3
0.6%
92.2%
Thailand
6
6
6
1
1
4
5
3
2
3
0.6%
92.8%
Trinidad & Tobago
8
6
2
6
4
4
3
3
3
3
0.6%
93.4%
• rance
0
0
0
0
0
2
1
1
1
2
0.4%
9
Greece
3
1
0
0
1
2
2
1
2
2
0.4%
9
Sri Lanka
1
1
1
2
4
3
3
2
2
2
0.4%
94.5%
Turkey
1
1
0
1
1
1
1
2
1
2
0.4%
94.9%
Brazil
1
2
2
2
2
3
1
1
0
1
0.2%
95.1%
Bulgaria
0
0
0
0
0
0
1
1
1
1
0.2%
95.3%
Costa Rica
1
1
1
2
1
2
1
1
1
1
0.2%
95.5%
Czechoslovakia
0
0
0
0
0
1
1
0
0
1
0.2%
95.7%
Denmark
0
0
0
1
1
1
1
2
0
1
0.2%
95.8%
Gambia
1
1
1.
1
0
0
0
1
1
1
0.2%
96.0%
Guatemala
0
0
0
0
0
0
0
1
1
1
0.2%
96.2%
Guyana
0
0
0
0
0
0
0
0
1
1
0.2%
96.4%
Ireland
0
0
0
0
0
0
0
0
2
1
0.2%
96.6%
Israel
0
0
1
2
2
2
2
1
1
1
0.2%
96.8%
Italy
1
1
1
1
1
1
2
2
1
1
0.2%
97.0%
Kenya
13
10
8
8
9
4
5
3
4
1
0.2%
97.2%
Kuwait
0
0
0
0
0
1
0
0
1
1
0.2%
97.4%
Lesotho
0
0
0
0
0
0
0
1
1
1
0.2%
97.5%
Libya
0
9
10
9
6
2
0
0
0
1
0.2%
97.7%
New Zealand
2
2
1
0
1
2
0
1
2
1
0.2%
97.9%
North Korea
1
1
0
0
0
0
1
0
0
1
0.2%
98.1%
Pakistan
2
2
3
1
2
1
1
2
1
1
0.2%
98.3%
Peru
1
2
1
1
1
1
0
1
2
1
0.2%
98.5%
Phillippines
6
4
6
3
1
0
2
3
2
1
0.2%
98.7%
Portugal
3
5
7
8
7
7
5
4
3
1
0.2%
98.9%
Romania
0
0
0
0
0
1
1
1
1
1
0.2%
99.1%
outh Africa
0
0
0
0
0
1
1
0
1
1
0.2%
Venezula
3
5
3
2
3
3
0
1
2
1
0.2%
Yugoslavia
0
0
0
0
0
1
1
0
0
1
0.2%
99.6%
Abbyssinia
1
2
1
0
0
0
0
0
0
0
0.0%
99.6%
Antigua
1
1
0
0
1
0
1
1
0
0
0.0%
99.6%
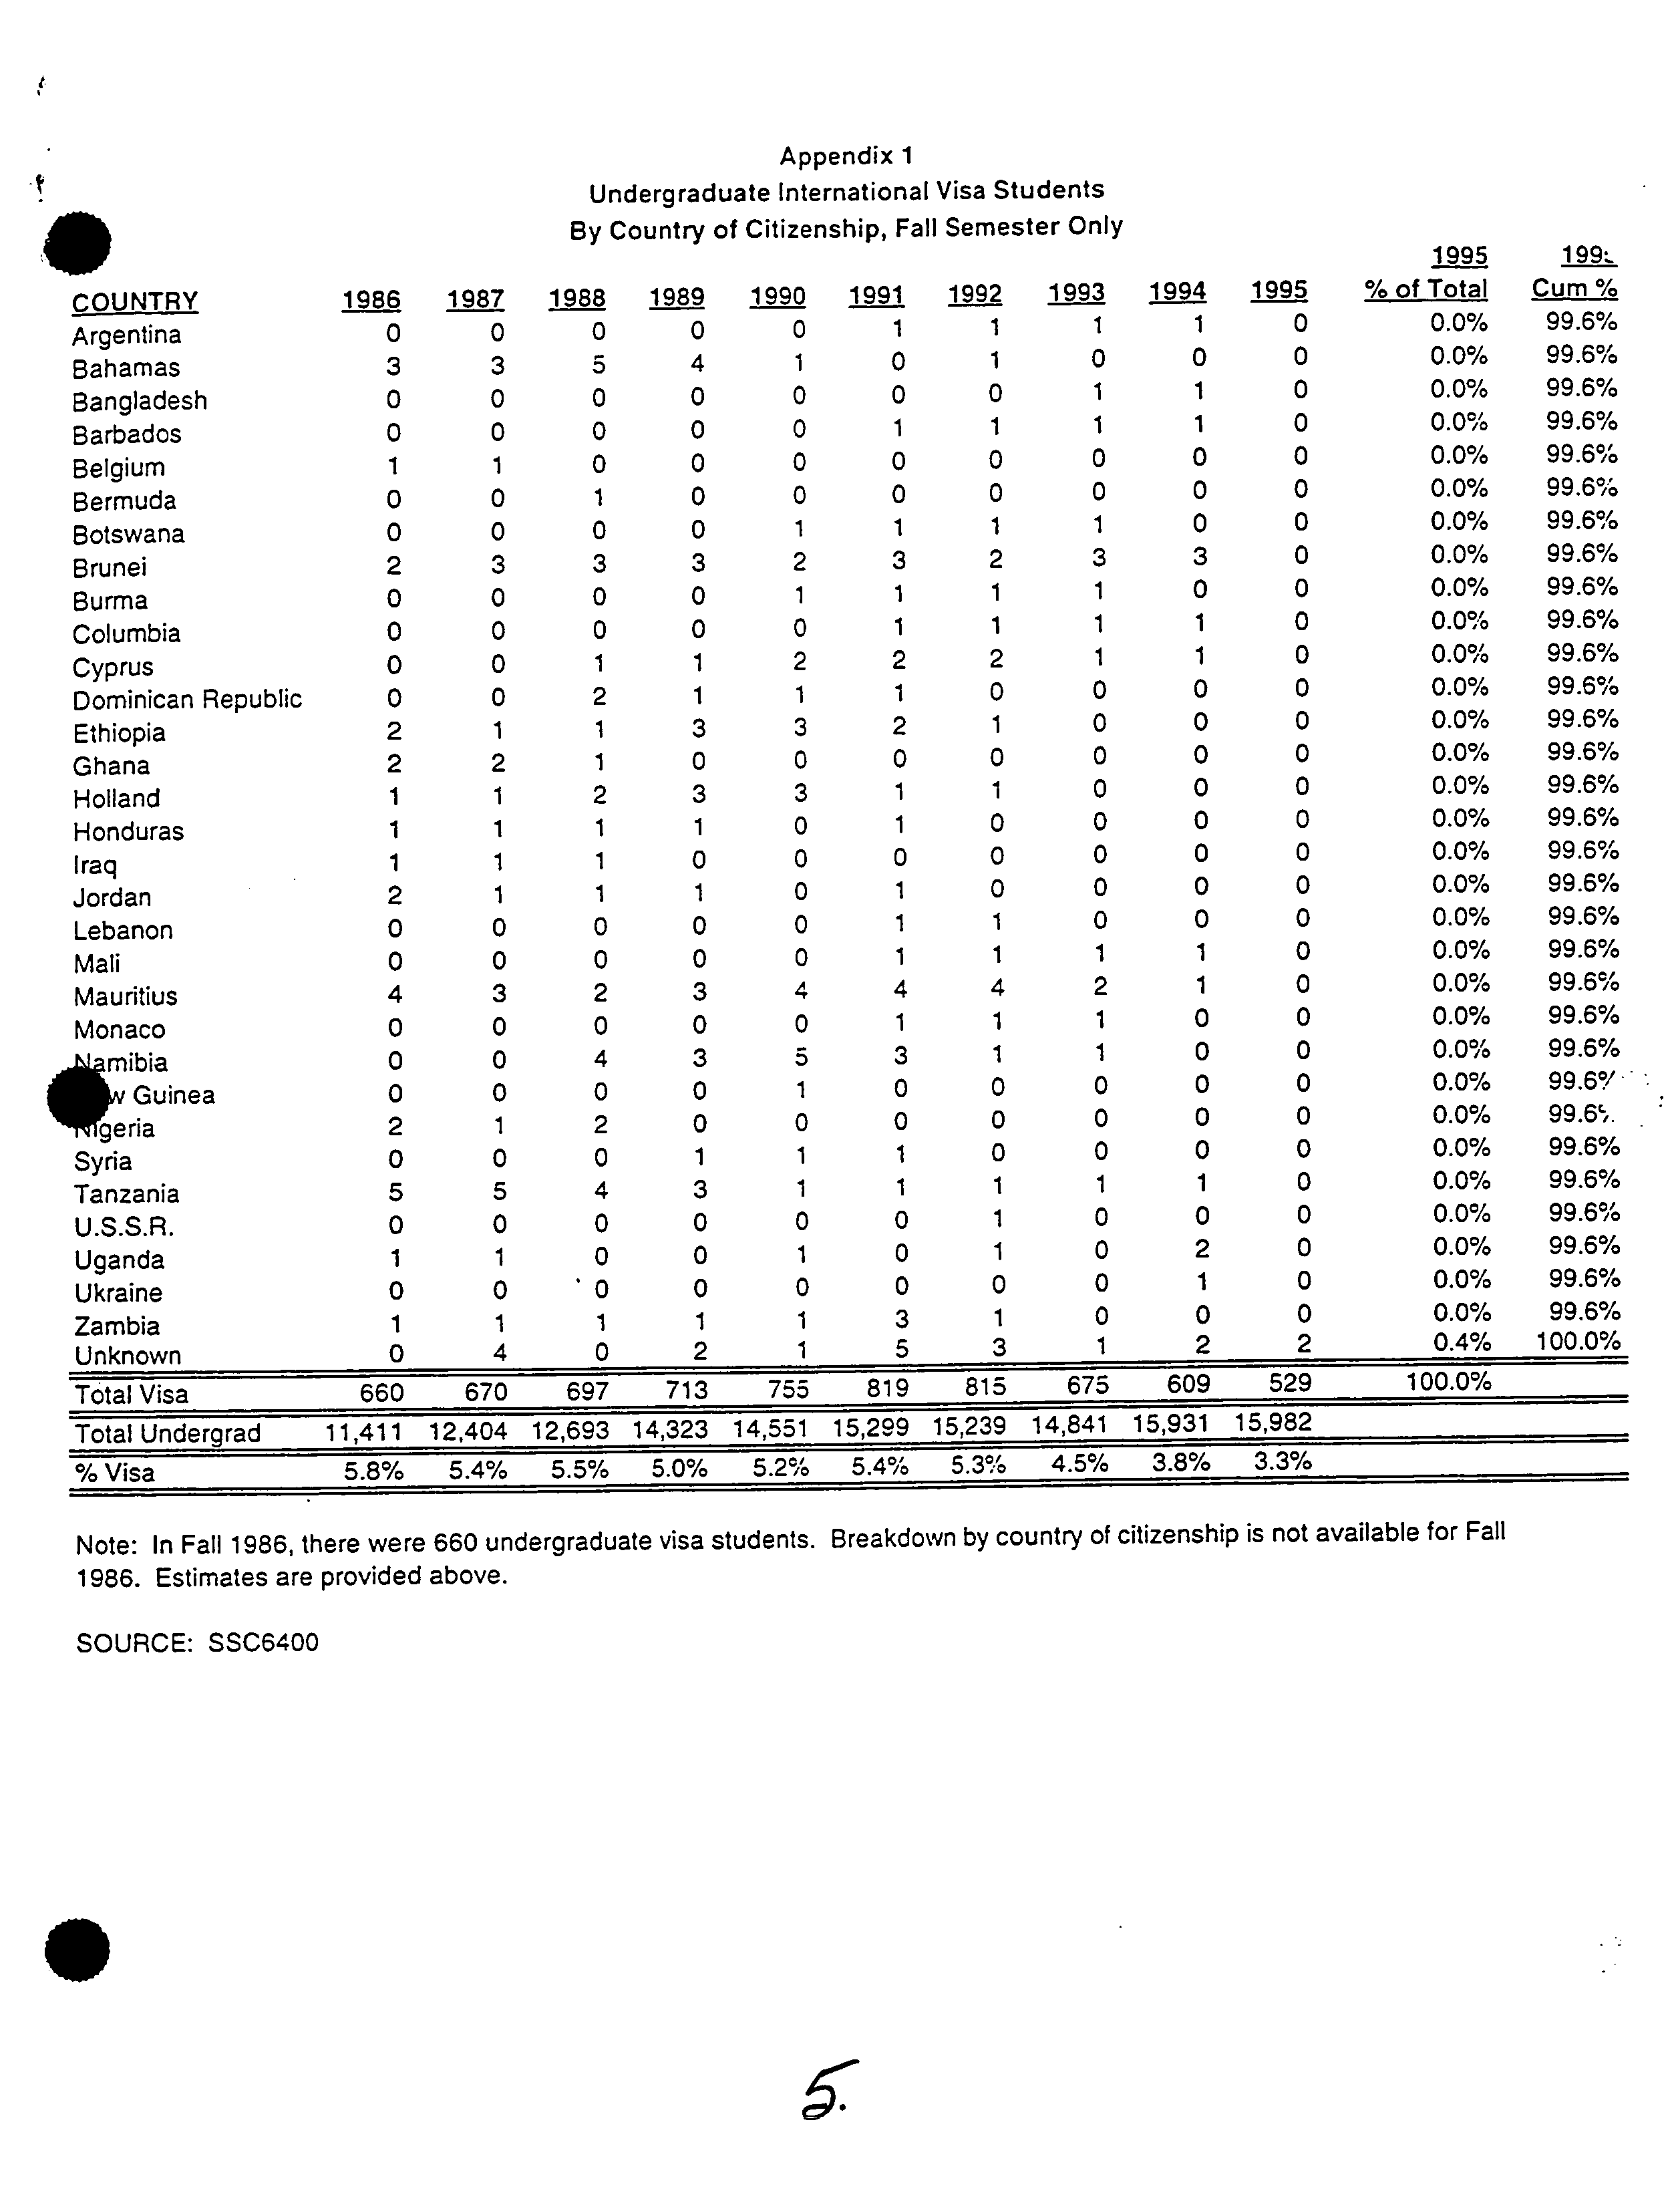
Appendix 1
Undergraduate International Visa Students
.
By Country of Citizenship, Fall Semester Only
1995
199:.
COUNTRY
1986
1987
1988
1989
1990
1991
1992
1993
1994
1995
%ofTotal
Cum%
Argentina
0
0
0
0
0
1
1
1
1
0
0.0%
99.6%
Bahamas
3
3
5
4
1
0
1
0
0
0
0.0%
99.6%
Bangladesh
0
0
0
0
0
0
0
1
1
0
0.0%
99.6%
Barbados
0
0
0
0
0
1
1
1
1
0
0.0%
99.6%
Belgium
1
1
0
0
0
0
0
0
0
0
0.0%
99.6%
Bermuda
0
0
1
0
0
0
0
0
0
0
0.0%
99.60NO
Botswana
0
0
0
0
1
1
1
1
0
0
0.0%
99.6%
Brunei
2
3
3
3
2
3
2
3
3
0
0.0%
99.6%
Burma
0
0
0
0
1
1
1
1
0
0
0.0%
99.6%
Columbia
0
0
0
0
0
1
1
1
1
0
0.0%
99.6%
Cyprus
0
0
1
1
2
2
2
1
1
0
0.0%
99.6%
Dominican Republic
0
0
2
1
1
1
0
0
0
0
0.0%
99.6%
Ethiopia
2
1
1
3
3
2
1
0
0
0
0.0%
99.6%
Ghana
2
2
1
0
0
0
0
0
0
0
0.0%
99.6%
Holland
1
1
2
3
3
1
1
0
0
0
0.0%
99.6%
Honduras
1
1
1
1
0
1
0
0
0
0
0.0%
99.6%
Iraq
1
1
1
0
0
0
0
0
0
0
0.0%
99.6%
Jordan
2
1
1
1
0
1
0
0
0
0
0.0%
99.6%
Lebanon
0
0
0
0
0
1
1
0
0
0
0.0%
99.6%
Mali
0
0
0
0
0
1
1
1
1
0
0.0%
99.6%
Mauritius
4
3
2
3
4
4
4
2
1
0
0.0%
99.6%
Monaco
0
0
0
0
0
1
1
1
0
0
0.0%
99.6%
mibia
0
0
4
3
5
3
1
1
0
0
0.0%
99.6%
v Guinea
0
0
0
0
1
0
0
0
0
0
0.0%
99.6°'•
eria
2
1
2
0
0
0
0
0
0
0
0.0%
99.6.
Syria
0
0
0
1
1
1
0
0
0
0
0.0%
99.6%
Tanzania
5
5
4
3
1
1
1
1
1
0
0.0%
99.6%
U.S.S.R.
0
0
0
0
0
0
1
0
0
0
0.0%
99.6%
Uganda
1
1
0
0
1
0
1
0
2
0
0.0%
99.6%
Ukraine
0
0
0
0
0
0
0
0
1
0
0.0%
99.6%
Zambia
1
1
1
1
1
3
1
0
0
0
0.0%
99.6%
Unknown
0
4
0
2
1
5
3
1
2
2
0.4%
100.0%
Total Visa
660
670
697
713
755
819
815
675
609
529
100.0%
Total Undergrad
11,411
12,404
12,693
14,323
14,551
15,299
15,239
14,841
15,931
15,982
%Visa
5.8%
5.4%
5.5%
5.0%
5.2%
5.4%
5.3%
4.5%
3.8%
3.3%
Note: In Fall 1986, there were 660 undergraduate visa students. Breakdown by country of citizenship is not available for Fall
1986. Estimates are provided above.
SOURCE: SSC6400
.
I