S.97-26
SIMON FRASER UNIVERSITY
OFFICE OF TIlE VICE-PRESIDENT, ACADEMIC
?
MEMORANDUM
To: ?
Senate
From: ?
D. Gagan, Chair
Senate Committee on Academic Planning
Subject: ?
International Student Intake Targets
Date: ?
February 11, 1997
The Senate Committee on Enrollment Management and Planning and the Senate
Committee oft Academic Planning have recommended the following motion for
consideration by Senate. Documentation is attached which provides more background
information.
. ?
Motion:
"That Senate approve and recommend approval to the Board of Governors
to limit the number of international students, excluding exchange students,
admitted into undergraduate programs at SF0 in the academic years 1997/98,
1998/99 and 1999/2000 to a maximum of 7% of
all
admissions."
S
0
S
SCA1' 97 - 10
SIMON FRASER UNIVERSITY
?
MEMORANDUM
TO:
Senate Committee on
?
FROM: Walter J. Wattamaniuk
Academic Planning ?
Director, Analytical Studies
Secretary to SCEMP
RE: International Student Intake
?
DATE: January 29th, 1997
Targets for 1997/98
Each year the Senate Committee on Enrollment Management and Planning
(SCEMP) is required to make a recommendation to SCAP on the maximum number
of international students to be admitted into undergraduate programs for the next
calendar year.
For 1996/97, Senate stipulated that the intake of new international students was not
to exceed 7% of all admissions. The actual intake was 5.6 % of all admissions.
Documentation is attached which provides more background information.
SCEMP met on January 22, 1997 and agreed that no change was required to last
year's policy. The following motion has been prepared for SCAP's approval.
Motion
"That SCAP approve and recommend approval to Senate and the Board to
limit the number of international students admitted into undergraduate
programs at SFU in 1997/98 to a maximum of 7% of all admissions."
Attach.
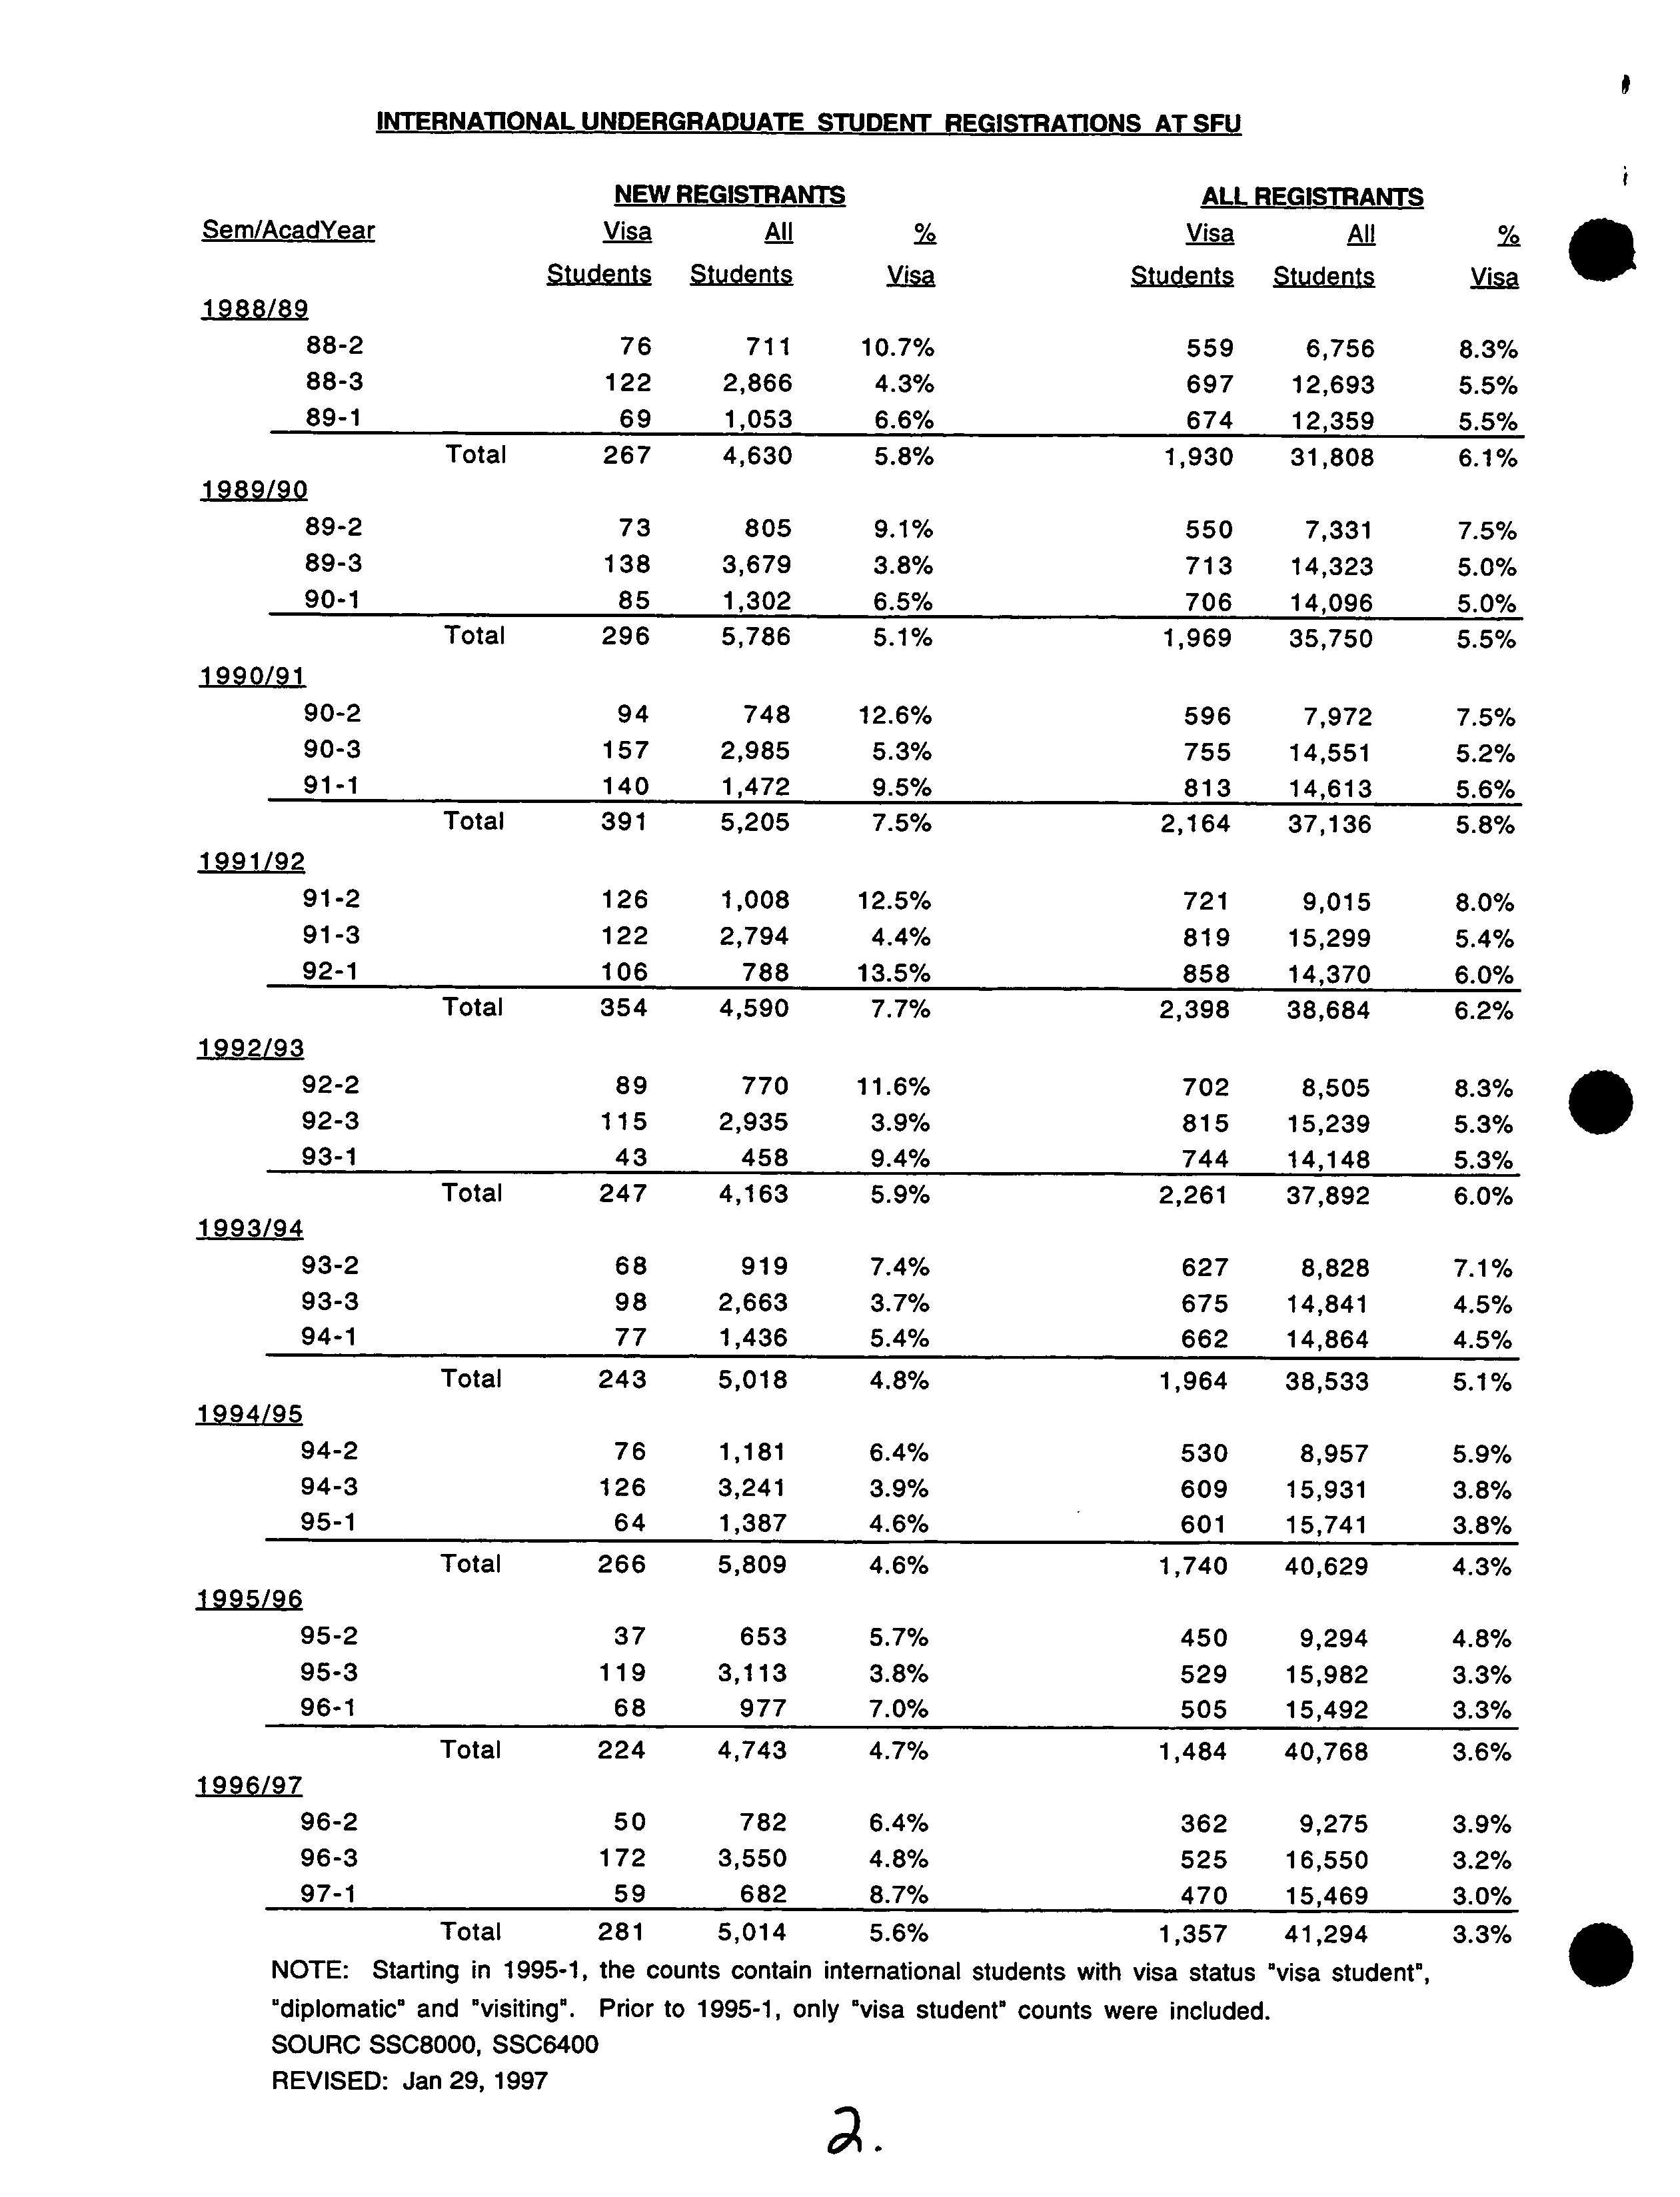
INTERNATIONAL UNDERGRADUATE STUDENT REGISTRATIONS AT SFLJ
NEW REGISTRANTS
ALL REGISTRANTS
Sem/AcadYear
Visa
All
Y2
Visa
All
Students
Students
Students
Students
Vi
sa
1988/89
88-2
76
711
10.7%
559
6,756
8.3%
88-3
122
2,866
4.3%
697
12,693
5.5%
89-1
69
1,053
6.6%
674
12,359
5.5%
1989/90
Total
267
4,630
5.8%
1,930
31,808
6.1%
89-2
73
805
9.1%
550
7,331
7.5%
89-3
138
3,679
3.8%
713
14,323
5.0%
90-1
85
1,302
6.5%
706
14,096
5.0%
Total
296
5,786
5.1%
1,969
35,750
5.5%
1990/91
90-2
94
748
12.6%
596
7,972
7.5%
90-3
157
2,985
5.3%
755
14,551
5.2%
91-1
140
1,472
9.5%
813
14,613
5.6%
Total
391
5,205
7.5%
2,164
37,136
5.8%
1991/92
91-2
126
1,008
12.5%
721
9,015
8.0%
91-3
122
2,794
4.4%
819
15,299
5.4%
92-1
106
788
13.5%
858
14,370
6.0%
Total
354
4,590
7.7%
2,398
38,684
6.2%
1992/93
92-2
89
770
11.6%
702
8,505
8.3%
92-3
115
2,935
3.9%
815
15,239
5.3%
93-1
43
458
9.4%
744
14,148
5.3%
Total
247
4,163
5.9%
2,261
37,892
6.0%
1993/94
93-2
68
919
7.4%
627
8,828
7.1%
93-3
98
2,663
3.7%
675
14,841
4.5%
94-1
77
1,436
5.4%
662
14,864
4.5%
Total
243
5,018
4.8%
1,964
38,533
5.1%
1994/95
94-2
76
1,181
6.4%
530
8,957
5.9%
94-3
126
3,241
3.9%
609
15,931
3.8%
95-1
64
1,387
4.6%
601
15,741
3.8%
Total
1995/96
266
5,809
4.6%
1,740
40,629
4.3%
95-2
37
653
5.7%
450
9,294
4.8%
95-3
119
3,113
3.8%
529
15,982
3.3%
96-1
68
977
7.0%
505
15,492
3.3%
Total
224
4,743
4.7%
1,484
40,768
3.6%
1996/97
96-2
96-3
97-1
50 ?
782 ?
6.4% ?
362
172 ?
3,550 ?
4.8% ?
525
59 ?
682 ?
8.7% ?
470
9,275
16,550
15,469
3.9%
3.2%
3.0%
Total
281 ?
5,014 ?
5.6%
?
1,357 41,294
3.3%
NOTE: ?
Starting in 1995-1, the counts contain international students with visa status
?
visa student,
"diplomatic" and "visiting".
Prior to 1995-1, only "visa student" counts were included.
SOURC SSC8000, SSC6400
REVISED: Jan 29, 1997
SIMON FRASER UNIVERSITY
?
OFFICE OF ANALYTICAL STUDIES
?
MEMORANDUM
TO:
See Distribution List
?
FROM: Joanne Heslop, Analyst
SUBJECT:
Visa Students, Fall 1996
?
DATE: October 24, 1996
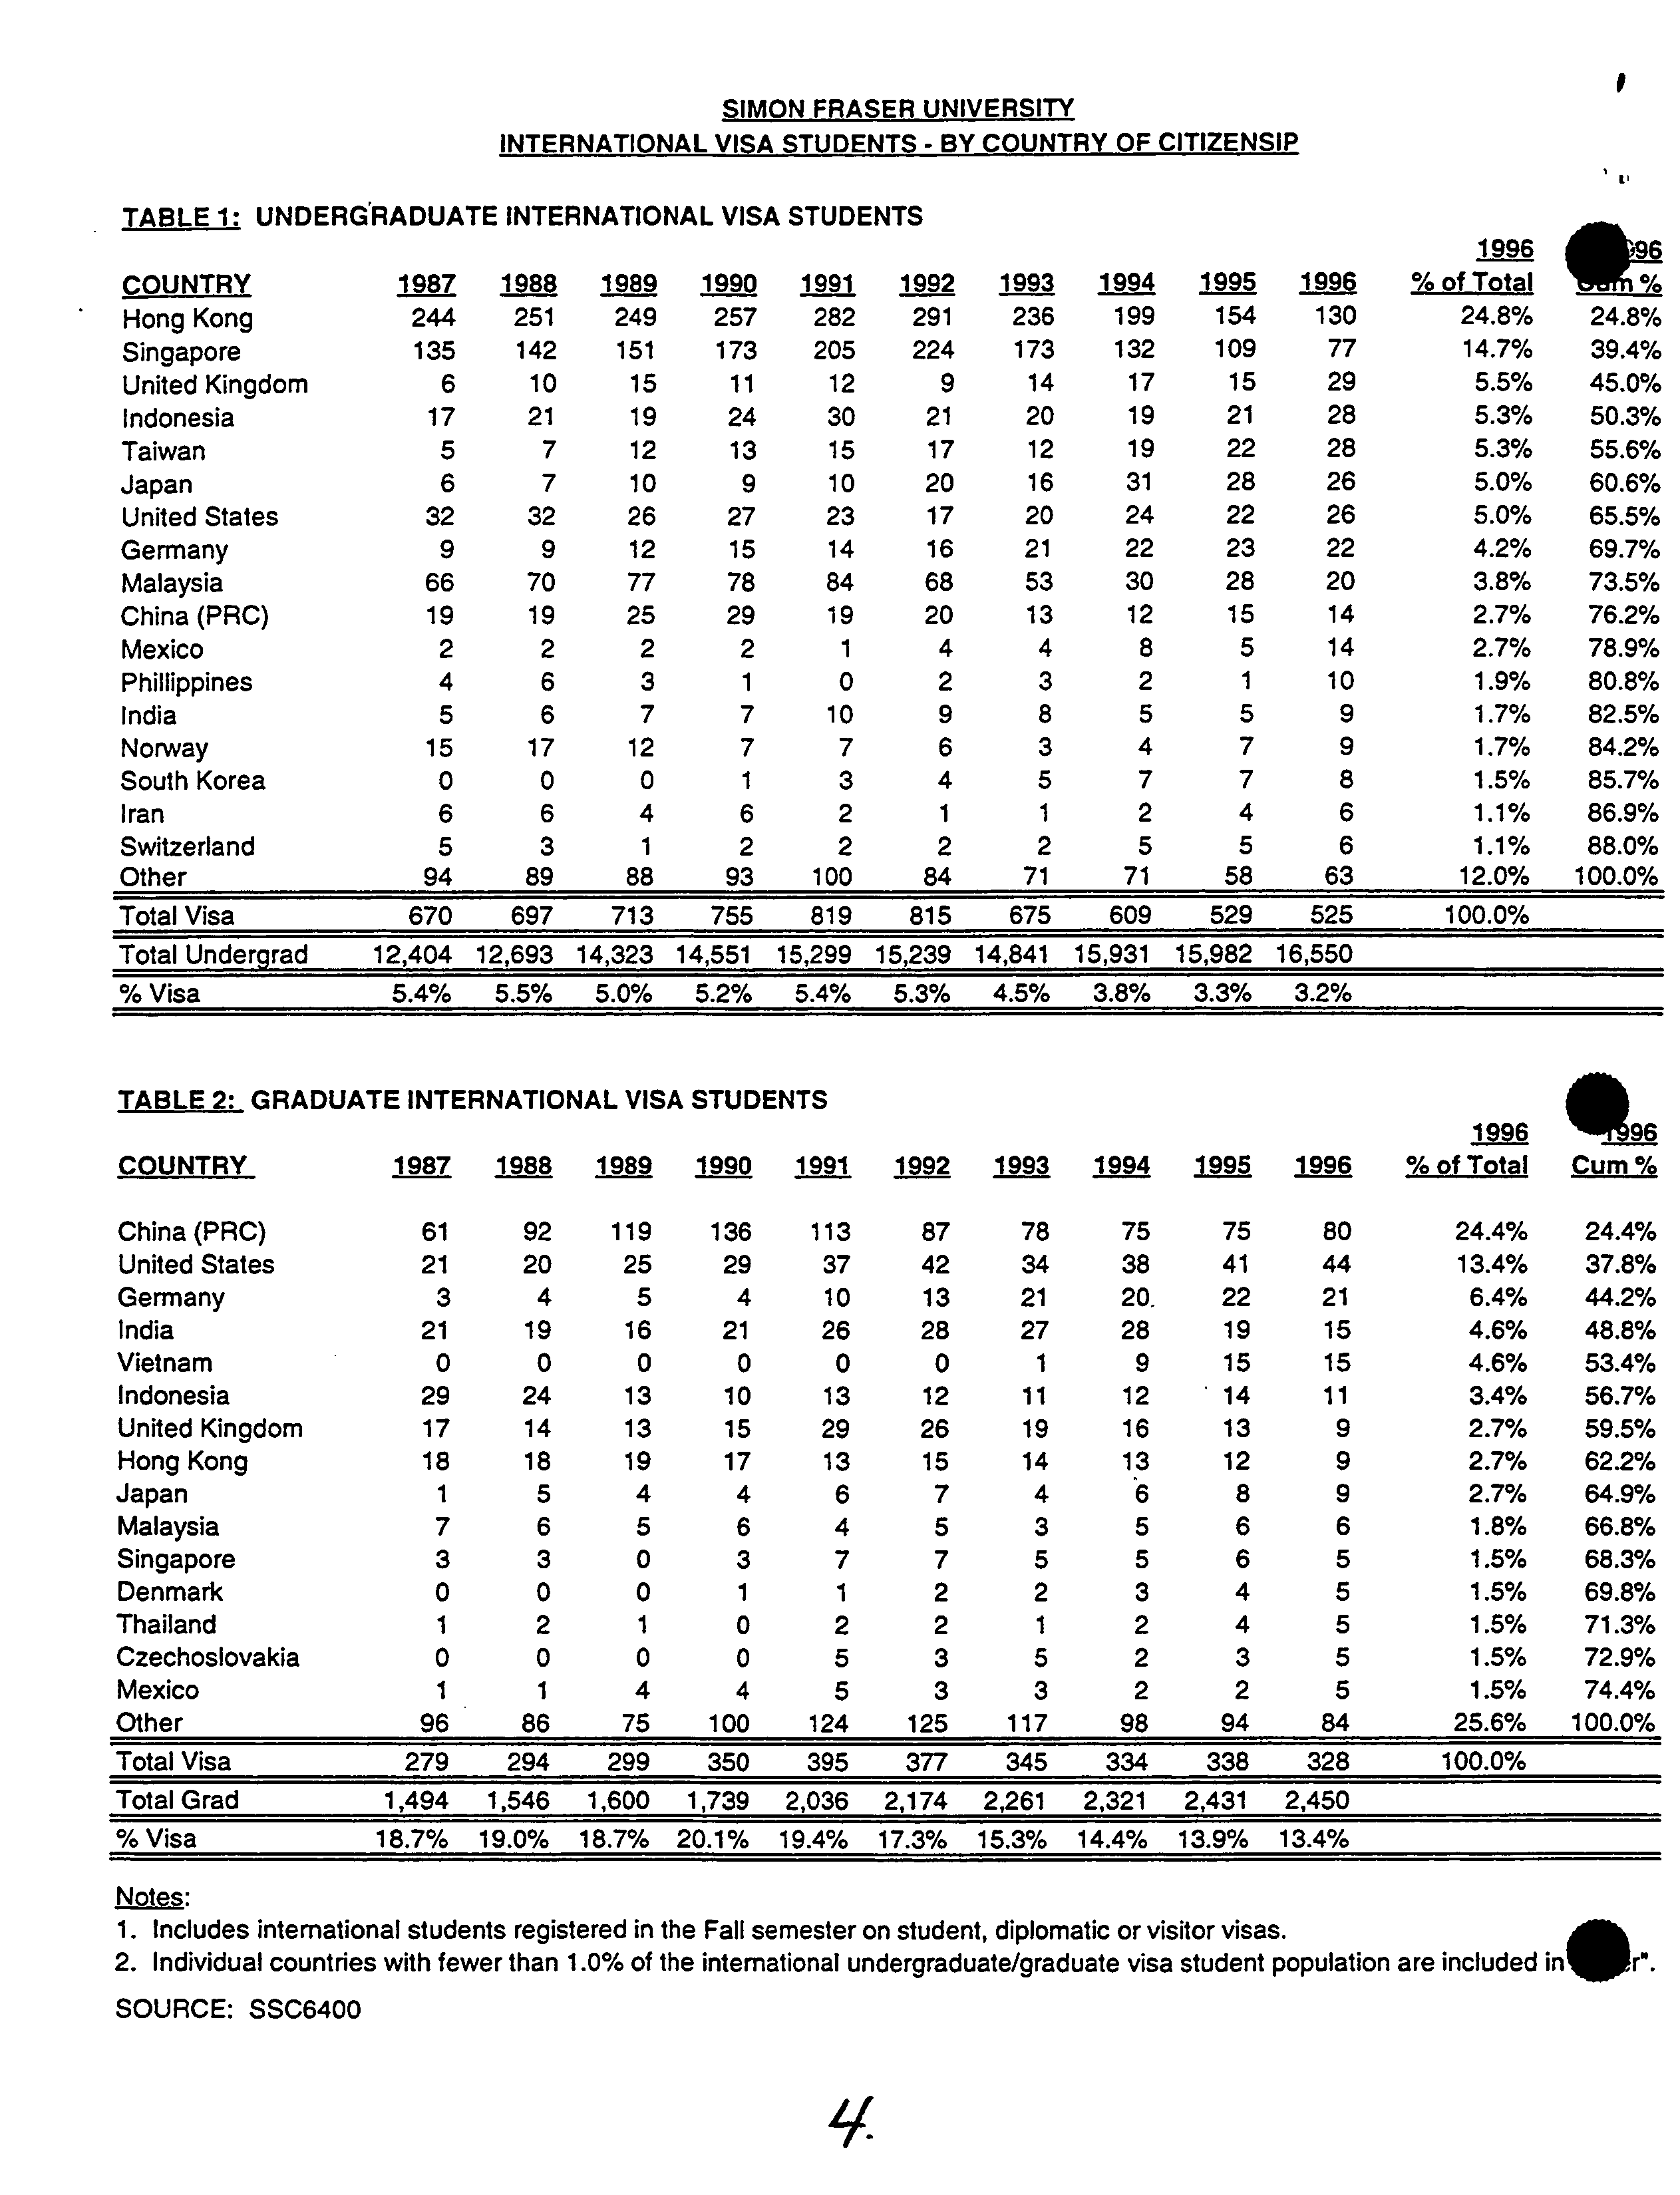
Enclosed is the Fall 1996 report on visa students at Simon Fraser University. This
report includes international students on student, diplomatic and visitor visas. Note
that countries which currently represent at least 1.0% of the international student
population are shown in this report. All other countries are included under 'other'.
At the under
g
raduate level, 525 visa students registered at SFU this Fall. This
represents 3.2% of the undergraduate student population and a 0.8% decrease over
last Fall. Approximately 40% of the undergraduate international student population
comes from two countries: Hong Kong (24.8%) and Singapore (14.7%).
Approximately 57% of all undergraduate visa students studying at SFU were originally
admitted to SFU from a B.C. secondary or post-secondary institution.
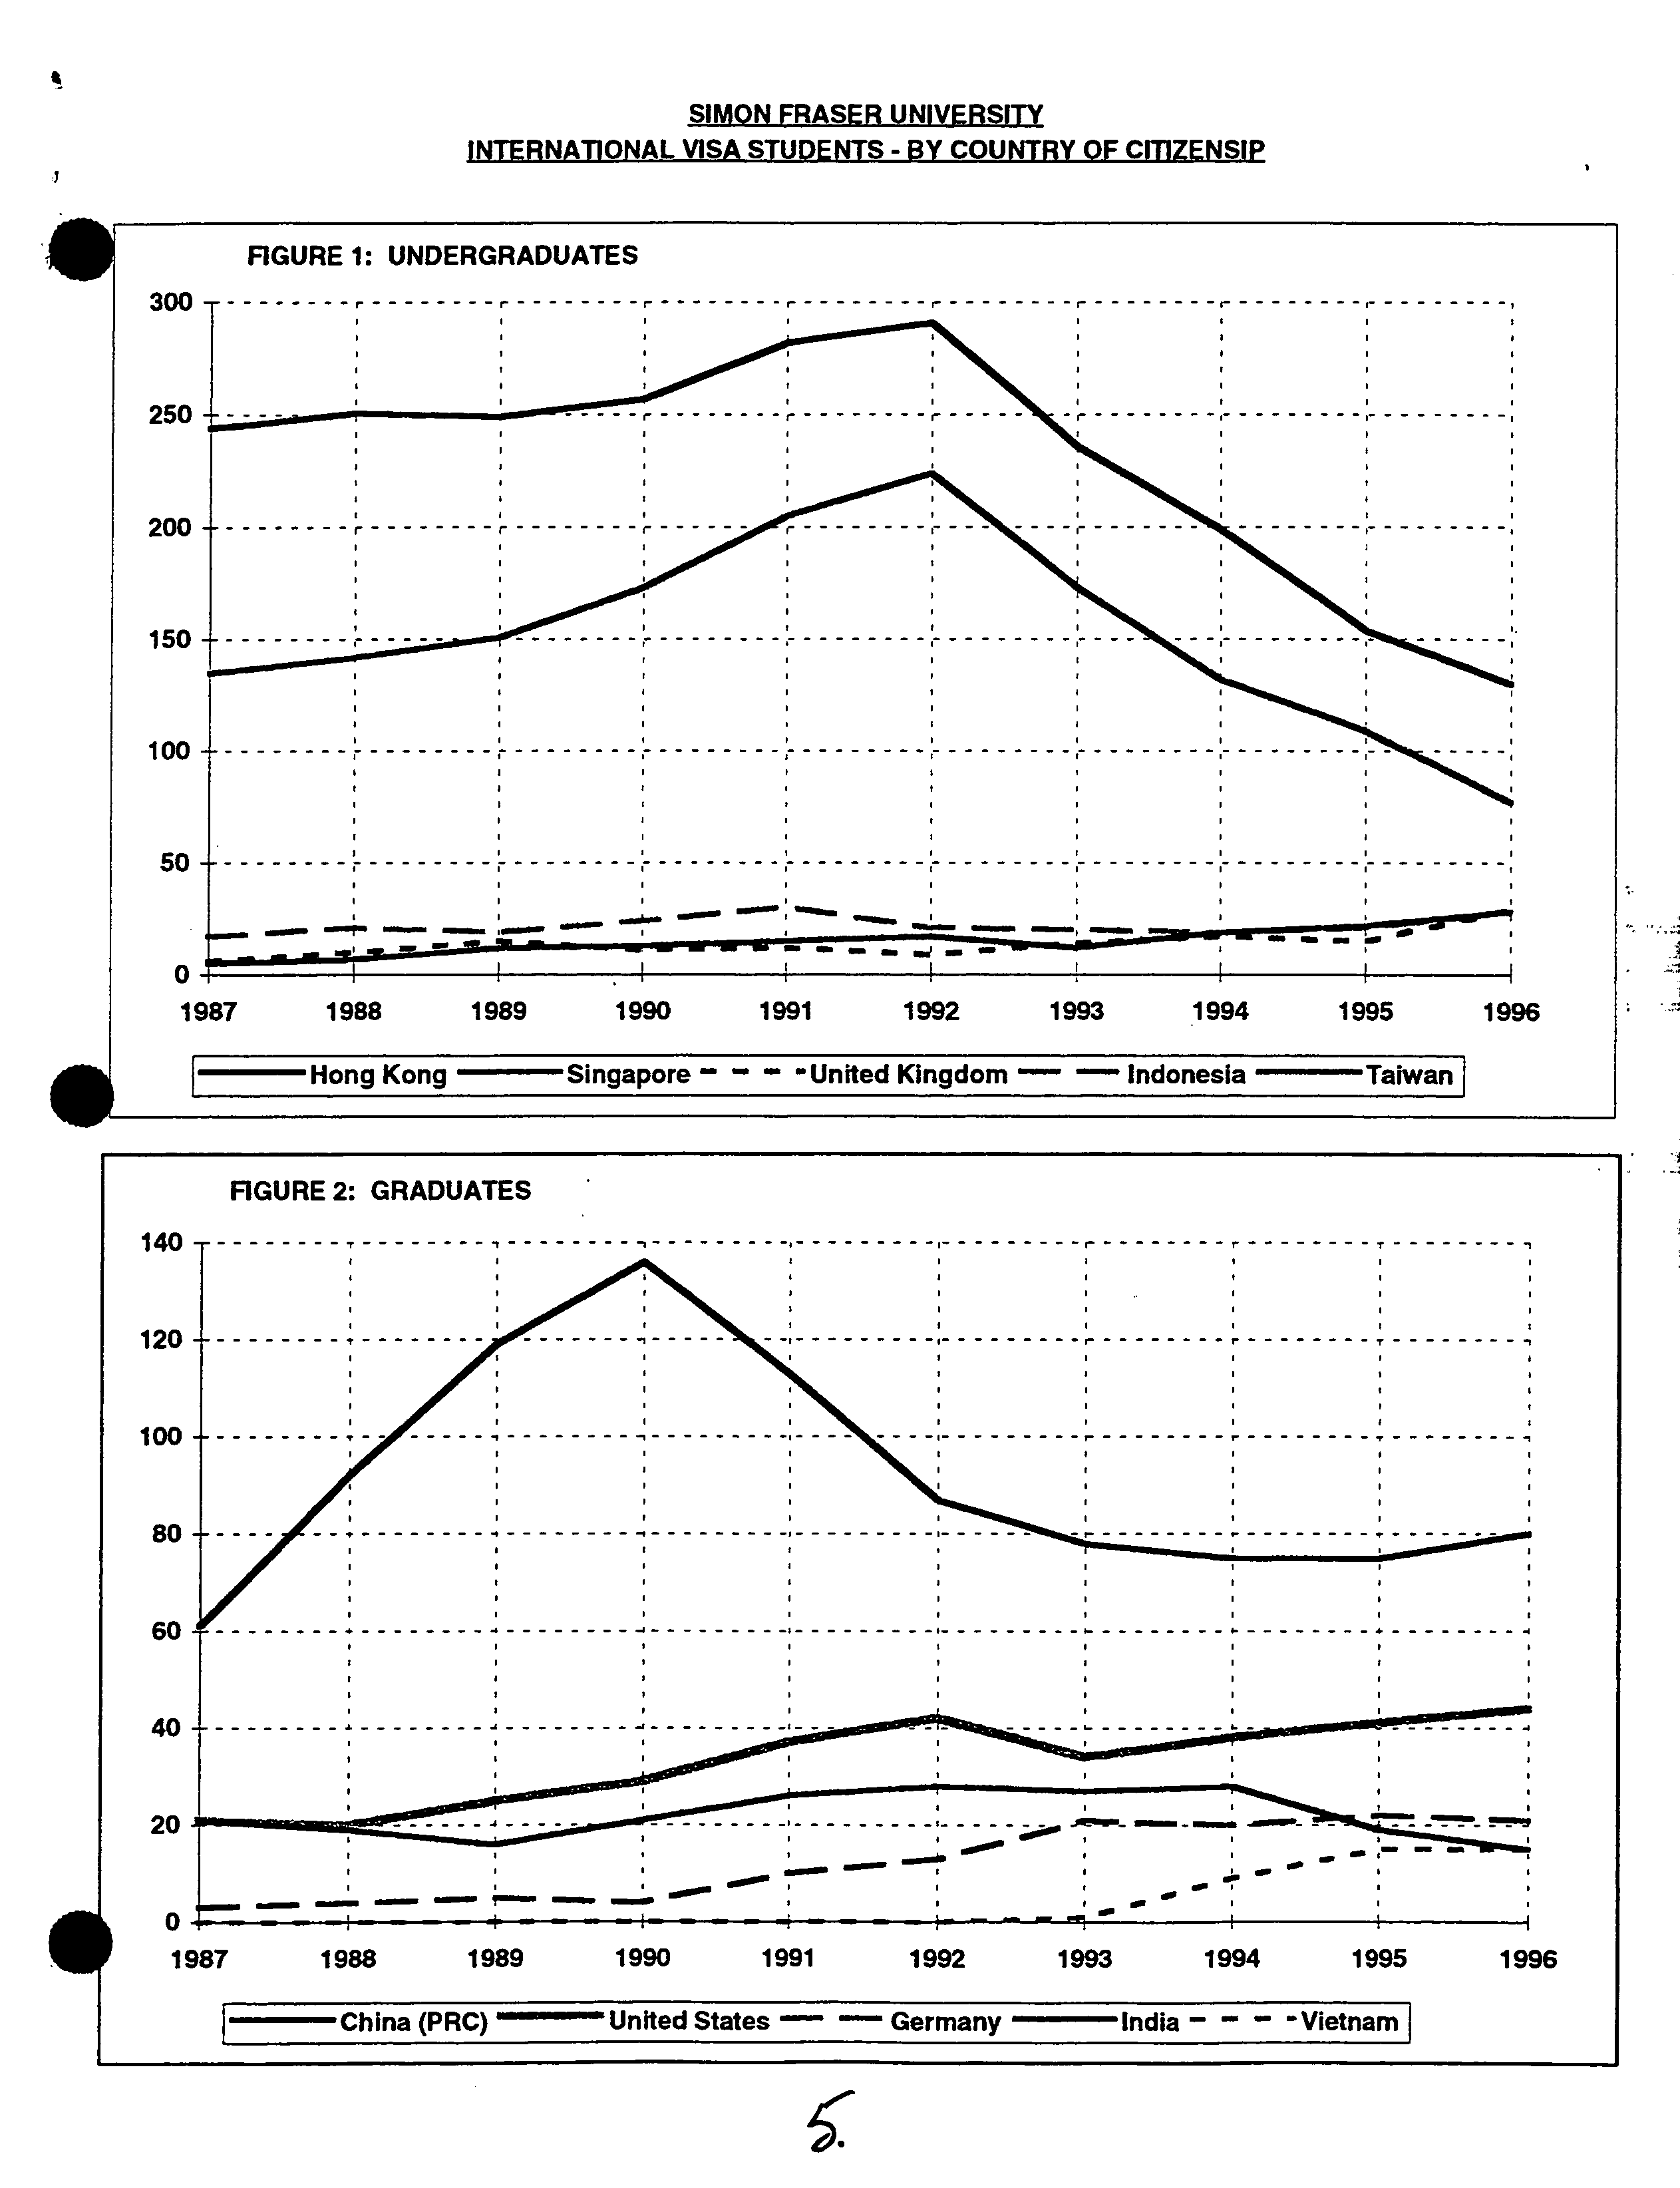
In looking at the top five countries, Singapore and Hong Kong show decreases of 29%
and 16% over last Fall. Three countries show increases: United Kingdom (93%),
• ?
Indonesia (33%), and Taiwan (27%). See Figure 1 for the ten year trend in these top
five countries.
At the graduate level, 328 visa students registered at SFU, a 3.0% decrease over last
Fall. Graduate visa students make up 13.4% of the graduate population.
Approximately 38% of the international graduate student population comes from two
countries: The People's Republic of China (24.4%) and the United States (13.4%).
Refer to Figure 2 for the ten year trend of international graduate students for the current
top five countries.
Please contact me at 4525 if there are any questions pertaining to the enclosed
Enclosure
Distribution List:
?
John Stubbs, President
David Gagan, Vice-President, Academic
Roger Ward, Vice-President, Finance and Administration
Gregg MacDonald, Executive Director, External Relations
Joe Knockaert, Director, International Cooperation
Ron Heath, Registrar and Dean of Student Services
Judith Osborne, Associate Vice-President, Academic
. ?
Bruce Clayman, Dean of Graduate Studies
Randall Martin, Director, International Education
Kathy Heinrich, Academic Planning, Special Assistant
Walt Wattamaniuk, Director, Analytical Studies
3.
SIMON FRASER UNIVERSITY
?
INTERNATIONAL VISA STUDENTS - BY COUNTRY OF CITIZENSIP
TABLE
1:
UNDERGRADUATE
INTERNATIONAL VISA STUDENTS
6
COUNTRY
197
1..9
1989
j•.Q
1
99
1
1992
1993
14
1995
j
%
of Total
Hong Kong
244
251
249
257
282
291
236
199
154
130
24.8%
24.8%
Singapore
135
142
151
173
205
224
173
132
109
77
14.7%
39.4%
United Kingdom
6
10
15
11
12
9
14
17
15
29
5.5%
45.0%
Indonesia
17
21
19
24
30
21
20
19
21
28
5.3%
50.3%
Taiwan
5
7
12
13
15
17
12
19
22
28
5.3%
55.6%
Japan
6
7
10
9
10
20
16
31
28
26
5.0%
60.6%
United States
32
32
26
27
23
17
20
24
22
26
5.0%
65.5%
Germany
9
9
12
15
14
16
21
22
23
22
4.2%
69.7%
Malaysia
66
70
77
78
84
68
53
30
28
20
3.8%
73.5%
China (PRC)
19
19
25
29
19
20
13
12
15
14
2.7%
76.2%
Mexico
2
2
2
2
1
4
4
8
5
14
2.7%
78.9%
Phillippines
4
6
3
1
0
2
3
2
1
10
1.9%
80.8%
India
5
6
7
7
10
9
8
5
5
9
1.7%
82.5%
Norway
15
17
12
7
7
6
3
4
7
9
1.7%
84.2%
South Korea
0
0
0
1
3
4
5
7
7
8
1.5%
85.7%
Iran
6
6
4
6
2
1
1
2
4
6
1.1%
86.9%
Switzerland
5
3
1
2
2
2
2
5
5
6
1.1%
88.0%
Other
94
89
88
93
100
84
71
71
58
63
12.0%
100.0%
Total Visa
670
697
713
755
819
815
675
609
529
525
100.0%
Total Undergrad
12,404 12,693 14,323 14,551 15,299
15,239
14,841
15,931 15,982 16,550
% Visa
5.4%
5.5%
5.0%
5.2%
5.4%
5.3%
4.5%
3.8%
3.3%
3.2%
TABLE 2: GRADUATE INTERNATIONAL VISA STUDENTS
COUNTRY ?
17 12
?
1989
iQ
ii 12 ?
12 ?
14
1995
i
%of Total Cum%
China (PRC)
61
92
119
136
113
87
78
75
75
80
24.4%
24.4%
United States
21
20
25
29
37
42
34
38
41
44
13.4%
37.8%
Germany
3
4
5
4
10
13
21
20,
22
21
6.4%
44.2%
India
21
19
16
21
26
28
27
28
19
15
4.6%
48.8%
Vietnam
0
0
0
0
0
0
1
9
15
15
4.6%
53.40/6
Indonesia
29
24
13
10
13
12
11
12
14
11
3.4%
56.7%
United Kingdom
17
14
13
15
29
26
19
16
13
9
2.7%
59.5%
Hong Kong
18
18
19
17
13
15
14
13
12
9
2.7%
62.2%
Japan
1
5
4
4
6
7
4
6
8
9
2.7%
64.9%
Malaysia
7
6
5
6
4
5
3
5
6
6
1.8%
66.8%
Singapore
3
3
0
3
7
7
5
5
6
5
1.5%
68.3%
Denmark
0
0
0
1
1
2
2
3
4
5
1.5%
69.8%
Thailand
1
2
1
0
2
2
1
2
4
5
1.5%
71.3%
Czechoslovakia
0
0
0
0
5
3
5
2
3
5
1.5%
72.9%
Mexico
1
1
4
4
5
3
3
2
2
5
1.5%
74.4%
Other
96
86
75
100
124
125
117
98
94
84
25.6%
100.0%
Total Visa
279
294
299
350
395
377
345
334
338
328
100.0%
Total Grad
1,494
1,546
1,600
1,739
2,036
2,174
2,261
2,321
2,431
2,450
% Visa
18.7%
19.0%
18.7%
20.1% 19.4% 17.3% 15.3% 14.4% 13.9%
13.4%
Notes:
1.
Includes international students registered in the Fall semester on student, diplomatic or visitor visas.
2.
Individual countries with fewer than 1.0% of the international undergraduate/graduate visa student population are included in
?
r".
SOURCE: SSC6400
4<
INTERNATIONAL VISA STUDENTS - BY COUNTRY OF CITIZENSIP
FIGURE 1: UNDERGRADUATES
300
?
- - ---'-
?
- -
?
- - - - -
? - - - - ?
-
1987 ?
1988
?
1989 ?
1990 ?
1991 ?
1992 ?
1993 ?
1994 ?
1995
?
1996
Hong Kong ?
Singapore - - - United Kingdom - - Indonesia
?
Taiwan
FIGURE 2: GRADUATES
140
0_
1987 ?
1988
?
1989
?
1990 ?
1991 ?
1992 ?
1993 ?
1994 ?
1995 ?
1996
China (PRC) ?
United States - - Germany
?
India - -
?
Vietnam
6.0,