S.98-95
0, ?
SIMON FRASER UNIVERSITY
OFFICE OF TIlE VICE-PRESIDENT, ACADEMIC ?
MEMORANDUM
To: ?
Senate
;
"
From: ?
D. Gagan, Chair
Senate Committee on Academic P1=9
Subject: ?
Diverse Qualifications Admission Policy
(SCAP Reference: SCAP 98-60)
Date: ?
November 5, 1998
Action undertaken by the Senate Committee on Academic Planning gives rise to
the following motion:
Motion:
"that Senate approve as set forth in S.98
-95 ,
that the Diverse
Qualifications Admission Policy be extended by five years to
Fall semester 2004, with a review to occur in 2003."
is
SCAP 98
-60
Memo ?
Simon Fraser University
To: ?
SCAP
From: J
.
Osborne, Chair DQAC ?
-
Date: ?
1998 10 27
ISubiect Diverse Qualifications Admission Policy
?
I
In April 1996, Senate passed the following motion, approving this policy for a three year
trial period.
Moved that Senate approve and recommend to the Board of Governors as set forth in S.96-28, the
proposed policy on undergraduate admissions, for a trial period from Spring Semester 1997 until Fall
Semester 1999, with review by SCAP with report to Senate to occur in Summer Semester 1998 before
the policy, as described in the attached paper 'Diverse Qualifications Undergraduate Admission Policy'
continues, and that an appropriate committee be established for the adjudication of this policy.
The Senate established the Diverse Qualification Adjudication Committee (DQAC) to
implement the policy.
On 30 September 1998, DQAC reviewed the academic performance of all 165 students who
had been admitted under this policy in the previous five semesters, 97-1 to 98-2. An analysis
•
?
prepared by J Heslop, Analytical Studies, was the basis of this review. DQAC compared
these DQ admits with a control group, which consisted of an equal number of students
admitted at the margin on their academic records alone. DQAC concluded that the results
were encouraging. For the policy to be clearly successful, the academic performances of DQ
admits should be no worse than those of the students whom they displaced, assuming that
the other attributes of the DQ group were superior to those of the displaced group. The
control group in this review closely approximated the displaced group.
DQAC noted that the policy had been implemented conservatively and at very low effort
and cost. The policy allowed for the selection of up to 10% of new students, but the actual
proportion was under 3%. Overall, there were insufficient data to draw firm conclusions
about the success of the policy.
DQAC passed the following motion:
"DQAC recommends to SCAP that the Diverse Qualifications Admission Policy be
extended by five years to Fall semester 2004, with a review to occur in 2003."
DQAC made no recommendation on the decision of the Faculty of Science to opt out of the
DQ process. Members noted that several DQ admits entered Science before that decision
became effective. In addition, students may select a Primary and an Alternate faculty,
allowing an applicant whose primary interest is natural science to be admitted under DQAP,
if s/he enters via another faculty and subsequently transfers to Science.
DQAC regrets that this material was not submitted for SCAP's review in Summer 1998, as
directed, but felt that the additional data collected in 98-2 were valuable. A decision on
continuing this policy is needed before the 1999/2000 Calendar is published.
DQAC Report to SCAP
?
19981021
Summary of analysis
This summarizes J. Heslop's analysis. The full version is available on request from N.
Heath, Admissions.
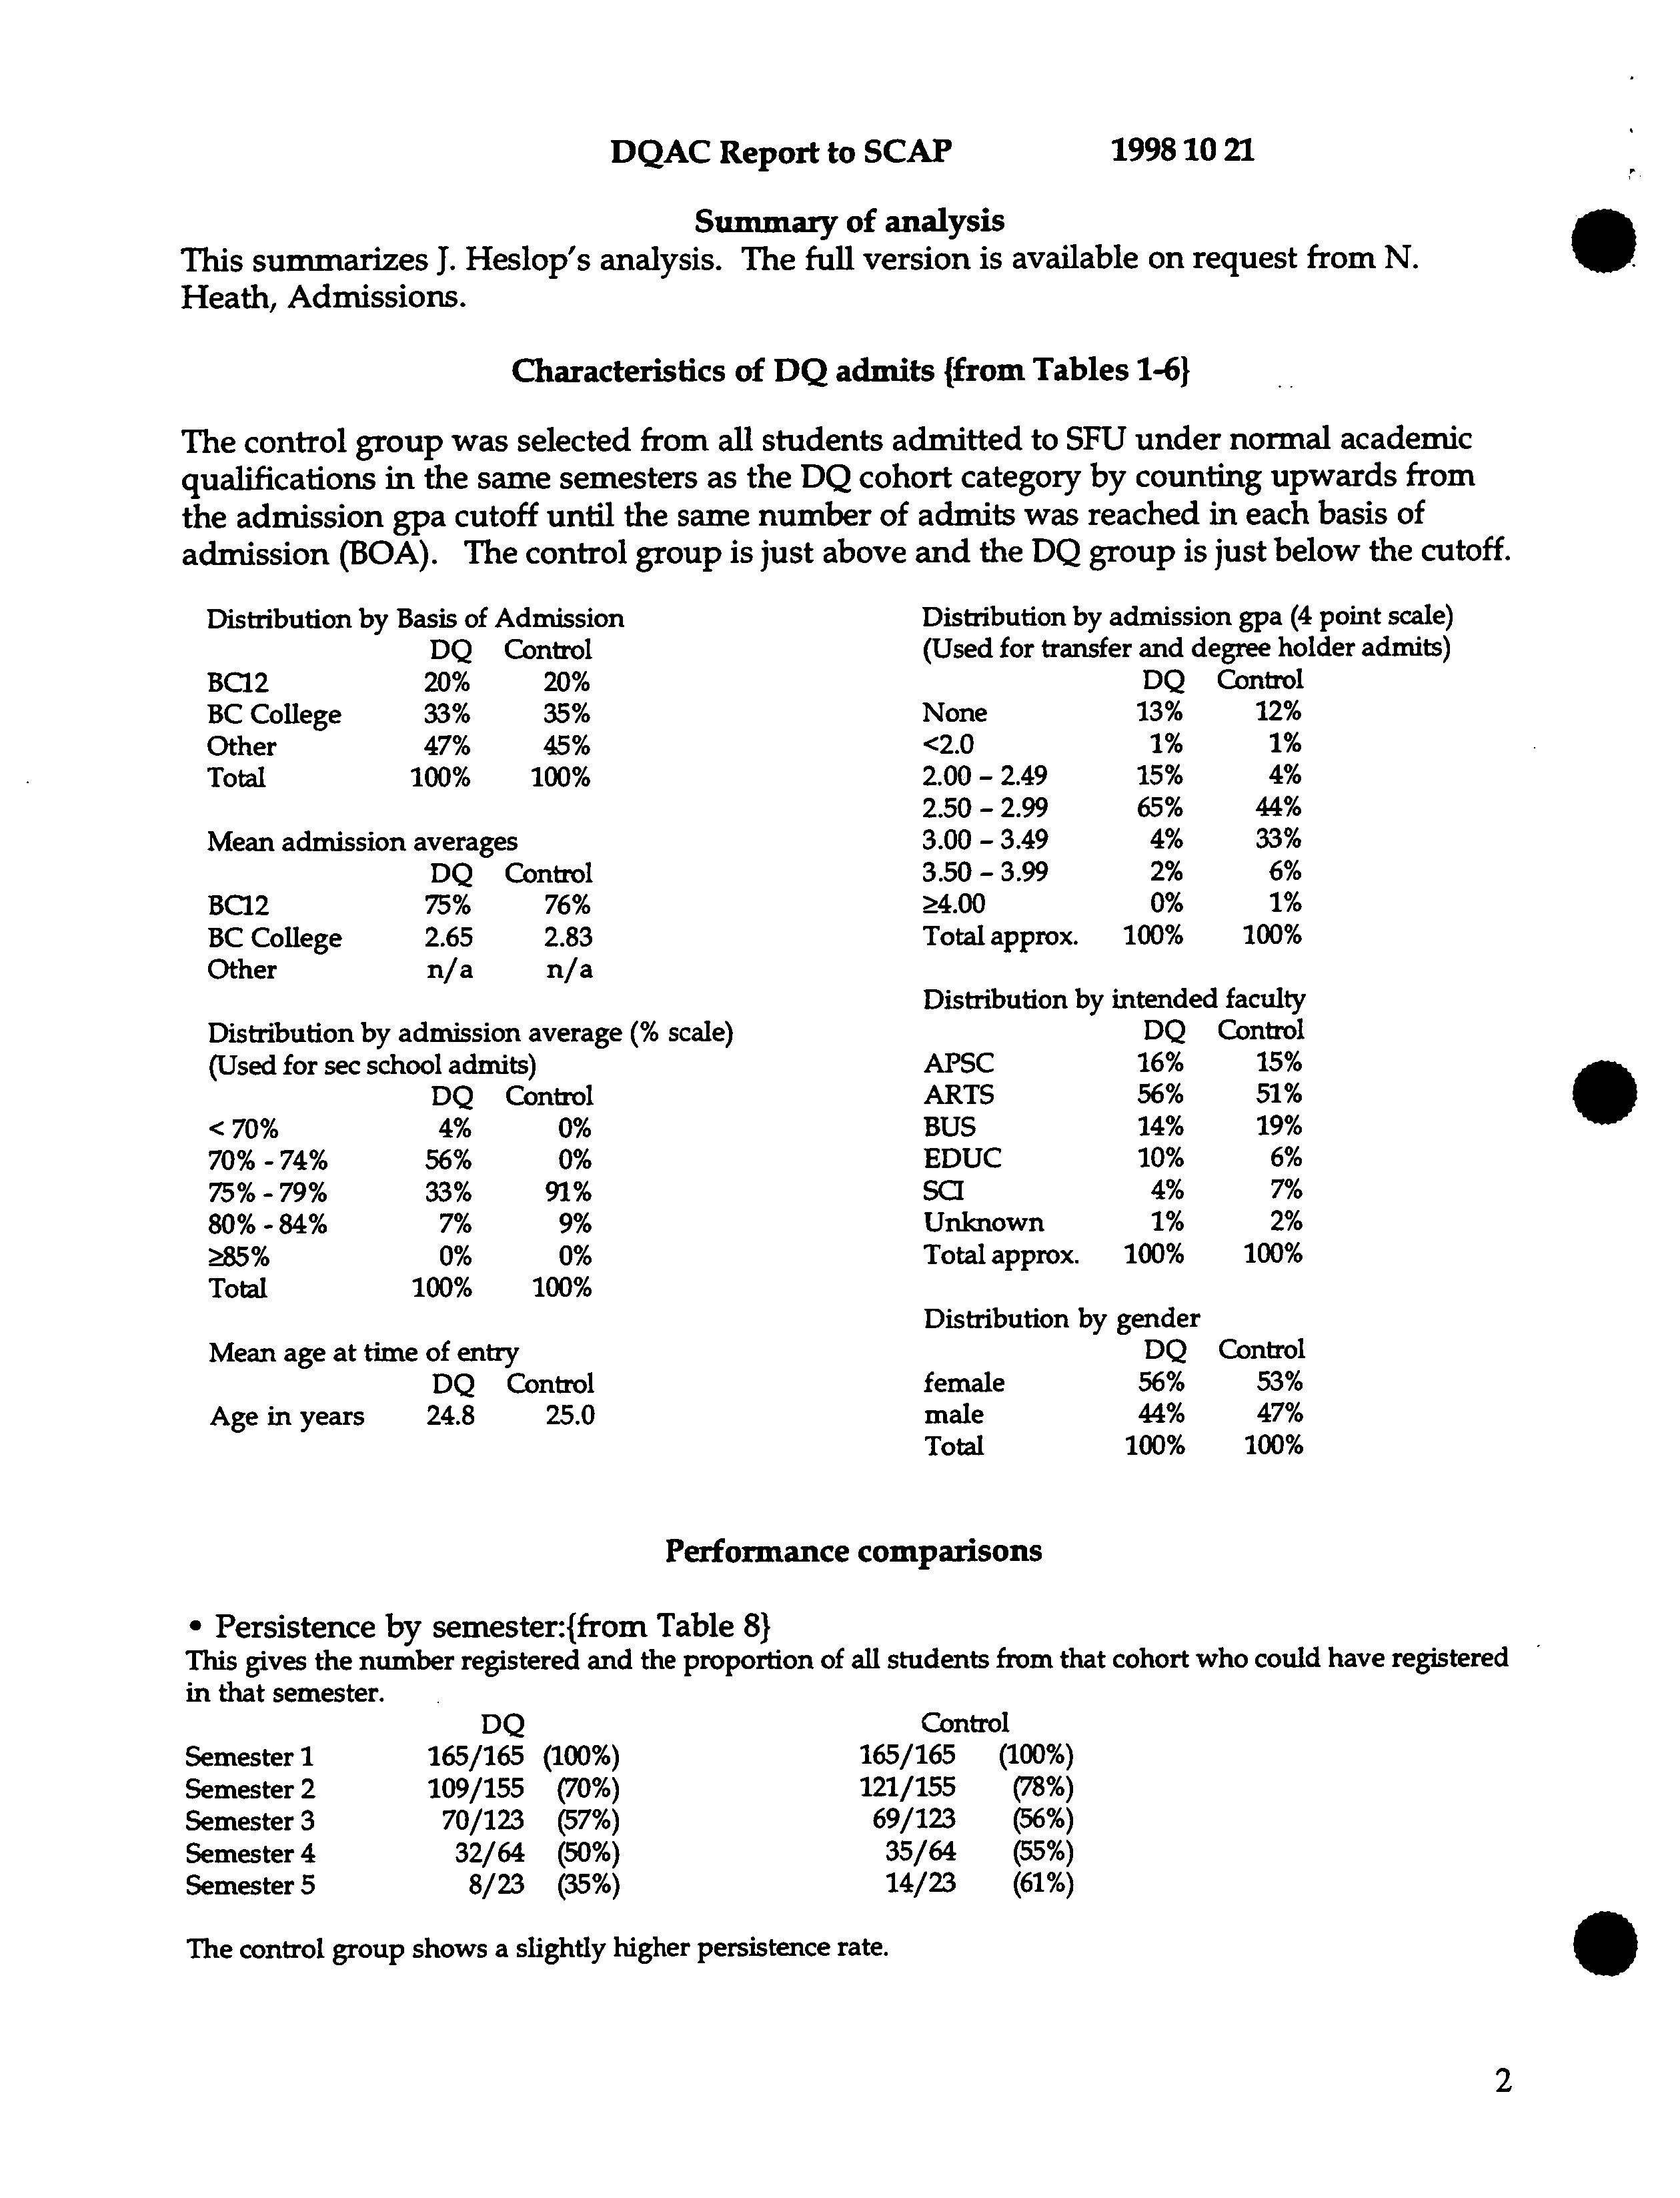
Characteristics of DQ admits (from Tables 1-61
The control group was selected from all students admitted to SFU under normal academic
qualifications in the same semesters as the DQ cohort category by counting upwards from
the admission gpa cutoff until the same number of admits was reached in each basis of
admission (BOA). The control group is just above and the DQ group is just below the cutoff.
Distribution by Basis of Admission
Distribution by admission gpa (4 point scale)
DQ
Control
(Used for transfer and degree
holder admits)
BC12 ?
20%
20%
DQ
Control
BC College ?
33%
35%
None
13%
12%
Other
?
47%
45%
<2.0
1%
1%
Total ?
100% 100%
2.00-2.49
15%
4%
2.50
- 2.99
65%
44%
Mean admission averages
3.00-3.49
4%
33%
DQ
Control
3.50-3.99
2%
6%
BC12
?
75%
76%
24.00
0%
1%
BC College ?
2.65
2.83
Total approx. 100%
100%
Other
?
n/a n/a
Distribution by intended faculty
Distribution by admission average (% scale)
DQ
Control
(Used for sec school admits)
APSC
16%
15%
DQ
Control
ARTS
56%
51%
<70%
?
4%
0%
BUS
14%
19%
70% - 74% ?
56%
0%
EDUC
10%
6%
75%-79%
?
33%
91%
SCI
4%
7%
80%-84% ?
7%
9%
Unknown
1%
2%
a5%
?
0%
0%
Total approx. 100%
100%
Total ?
100% 100%
Distribution by gender
Mean age at time of entry
DQ Control
DQ
Control
female
56%
53%
Age in years
?
24.8
25.0
male
44%
47%
Total
100%
100%
Performance comparisons
•
Persistence by semester:{from Table 8)
This gives the number registered and the proportion
of all students from that cohort who could have registered
in that semester.
DQ
Control
Semester 1
?
165/165 (100%)
165/165
(100%)
Semester 2 ?
109/155 ?
(70%)
121/155
(78%)
Semester 3 ?
70/123
?
(57%)
69/123 (56%)
Semester 4
?
32/64
?
(50%)
35/64 (55%)
Semester 5 ?
8/23 ?
(35%)
14/23 (61%)
The control group shows a slightly higher persistence rate.
DQAC Report to
SCAF
19981021
.
?
•
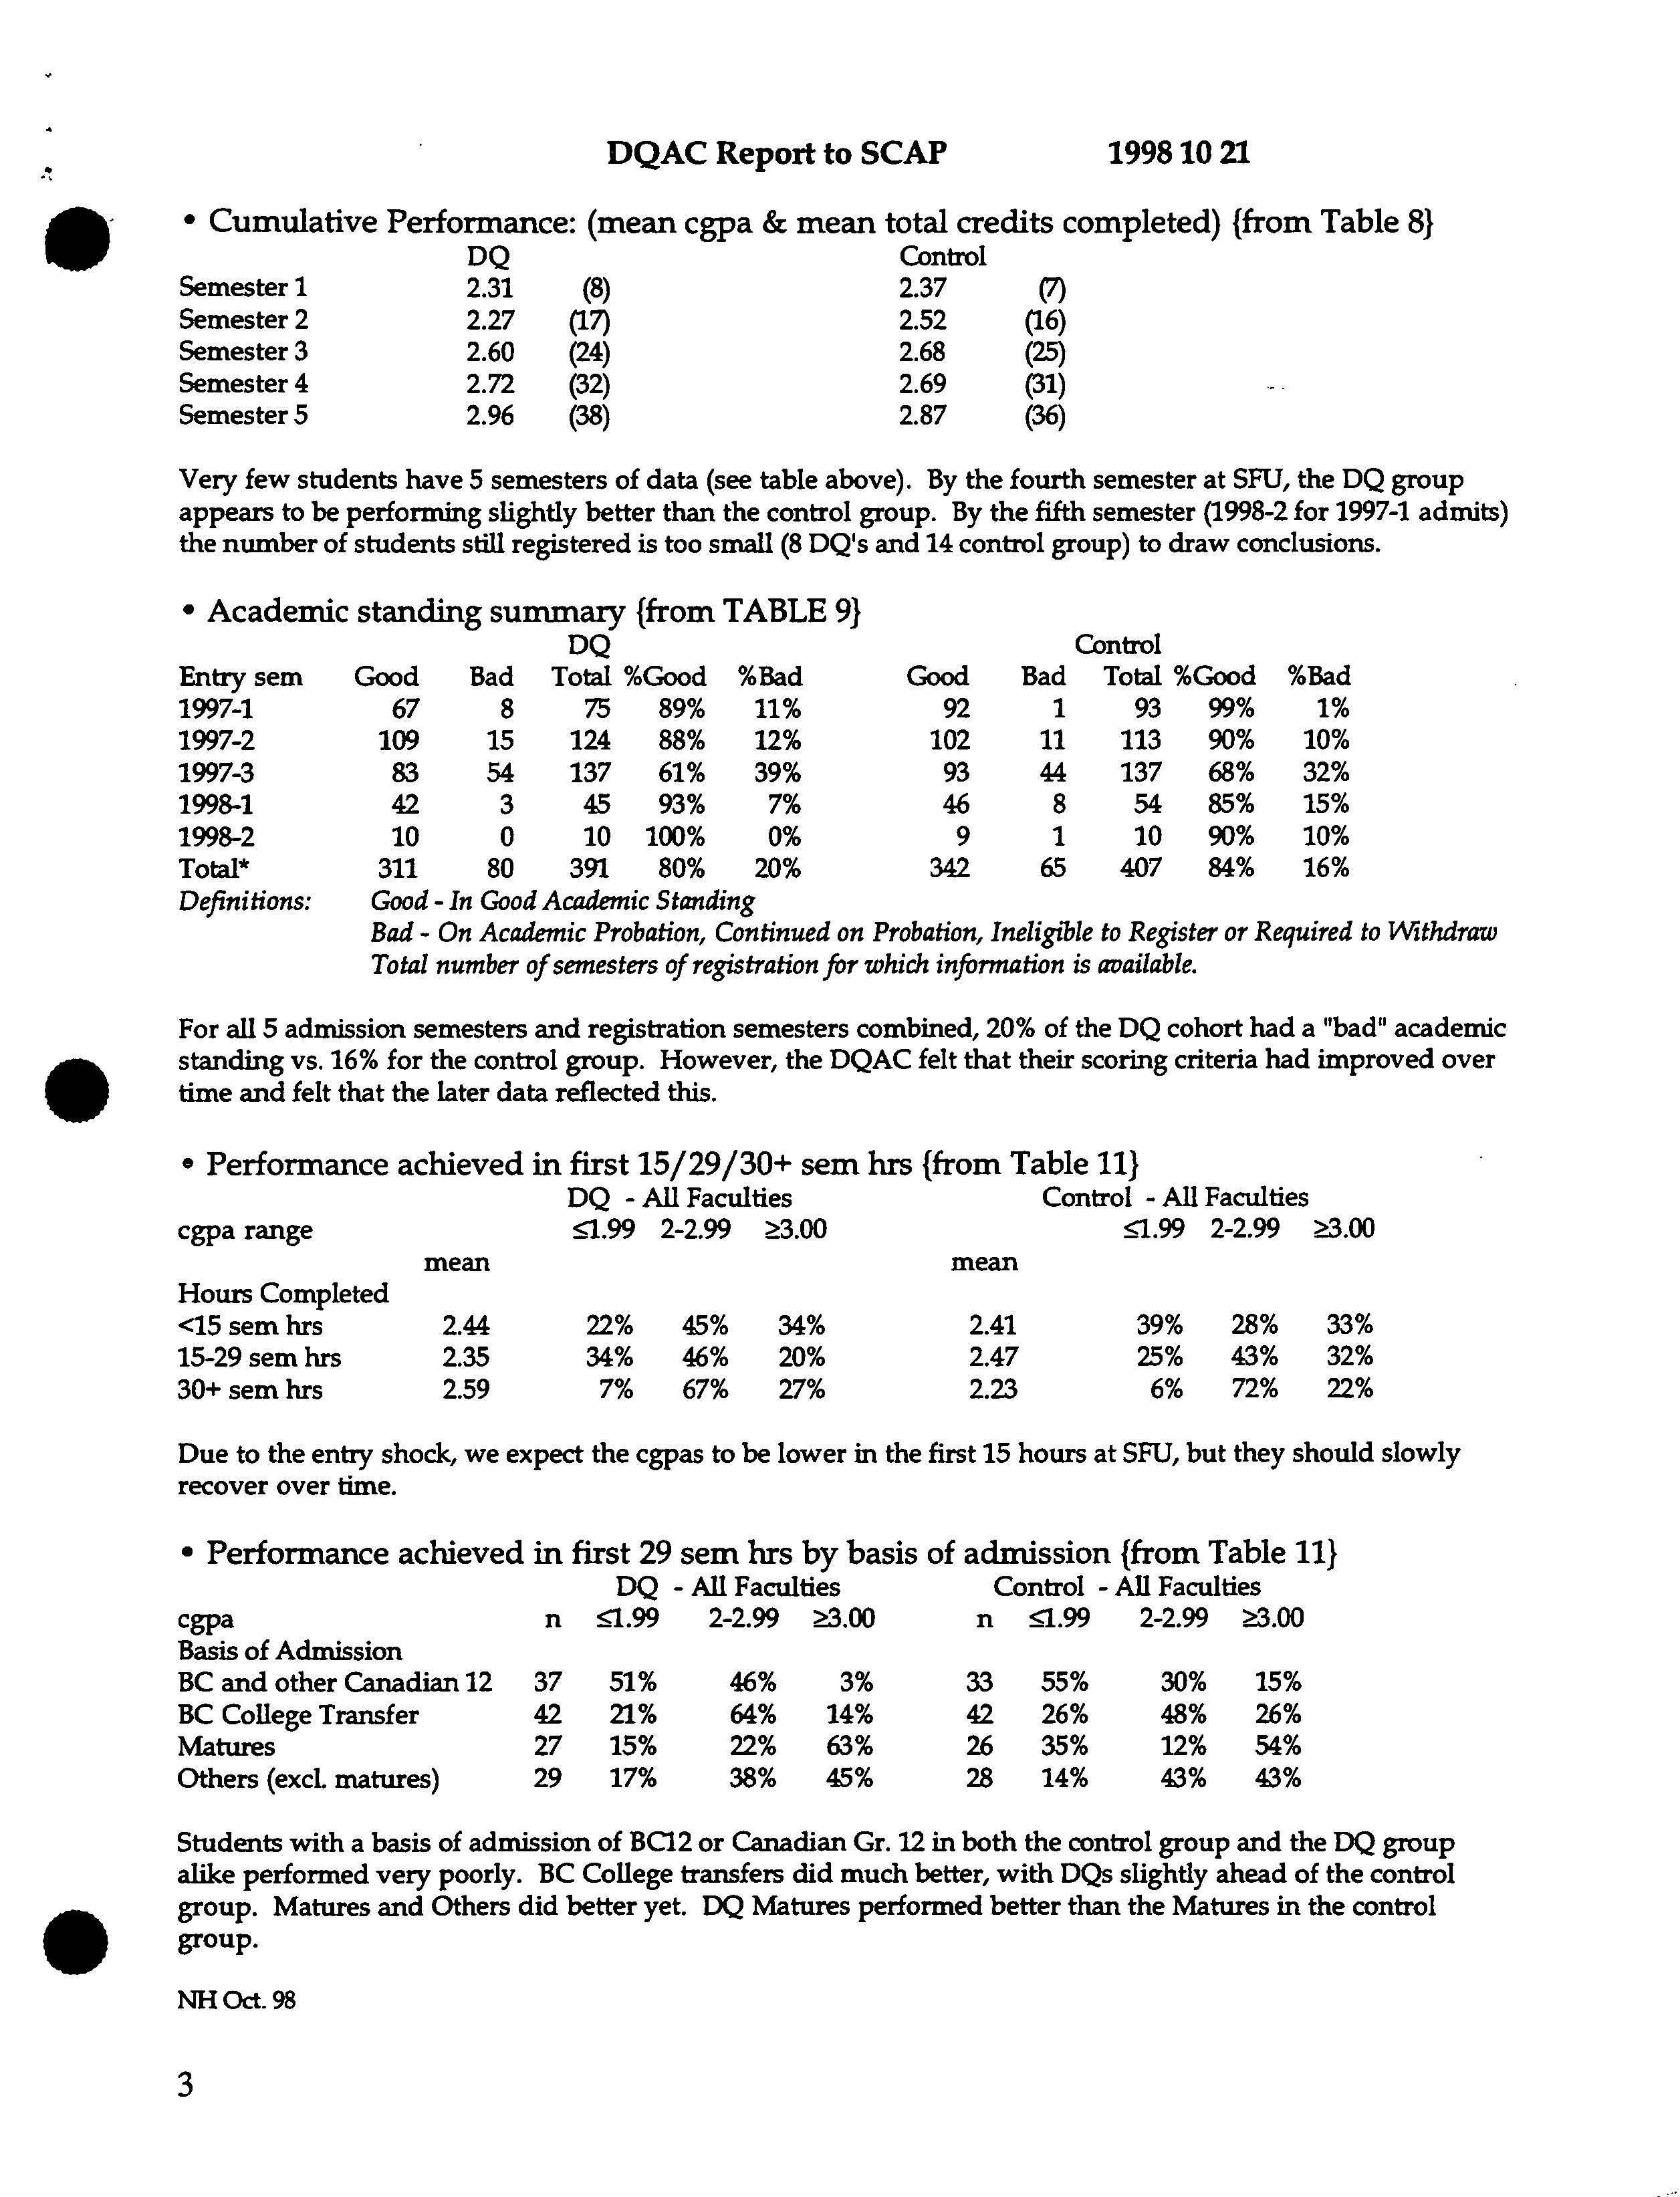
Cumulative
Performance: (mean cgpa &
mean total credits completed) (from Table 8}
DQ
Control
Semester 1
2.31
(8) ?
2.37
(7)
Semester 2
2.27 (17) ?
2.52
(16)
Semester 3
2.60
(24) ?
2.68
(25)
Semester 4
2.72
(32) ?
2.69
(31)
Semester 5
2.96 (38) ?
2.87
(36)
Very few students have 5 semesters of data (see table above). By the fourth semester at SFU, the DQ group
appears to be performing slightly
better
than the control group. By the fifth semester (1998-2 for 1997-1 admits)
the
number
of
students still
registered is too
small
(8 DQ's
and
14 control group) to draw conclusions.
Academic standing summary (from TABLE 9)
DQ
Control
Entry sem
Good ?
Bad ?
Total %Good ?
%Bad
Good
Bad Total %Good %Bad
1997-1
67 ?
8 ?
75 ?
89% ?
11%
92
1
93
99% 1%
1997-2
109
?
15
?
124 ?
88% ?
12%
102 11 113 90%
10%
1997-3
83 ?
54 ?
137 ?
61% ?
39%
93 44 137 68% 32%
1998-1
42
?
3
?
45
?
93%
?
7%
46 8
54 85% 15%
1998-2
10 ?
0 ?
10 ?
100% ?
0%
9 1 10 90% 10%
Total*
311 ?
80 ?
391 ?
80%
?
20%
342 65
407
84% 16%
Definitions:
Good -
In Good
Academic
Standing
Bad -
On Academic Probation, Continued on Probation, Ineligible to Register or Required
to
Withdraw
Total number of
semesters
of registration
for
which information is available.
For all 5 admission
semesters and
registration semesters combined, 20% of the DQ cohort
had a
'bad'
academic
• ?
standing
vs. 16% for the control group. However, the DQAC felt
that
their scoring criteria
had
improved over
time and
felt
that
the later data reflected this.
Performance achieved in first 15/29/30+ sem hrs (from Table 111
DQ - All Faculties
Control - All Faculties
cgpa range
—<1.99
2-2.99
^3.00
—<.99
2-2.99
^3.00
mean
mean
Hours Completed
<15 sem
hrs
2.44
22%
45%
34%
2.41
39%
28%
33%
15-29 sem hrs
2.35
34%
46%
20%
2.47
25%
43%
32%
30+ sem
hrs
2.59
7%
67%
27%
2.23
6%
72%
22%
Due to the entry shock, we expect the
cgpas
to be lower in the
first
15
hours at SFU, but they
should
slowly
recover over time.
• Performance achieved in first 29 sem
hrs
by basis of admission (from Table 111
DQ -
All
Faculties
?
Control -
All Faculties
cgpa ?
n —<1.99 ?
2-2.99 ^!3.00 ?
n —<1.99 ?
2-2.99 ^3.00 ?
Basis
of
Admission
BC
and
other
Canadian
12 37 51% ?
46% ?
3% ?
33 55% ?
30%
15%
BC
College
Transfer ?
42 21% ?
64%
14% ?
42
26% ?
48% 26%
Matures ?
27 15% ?
22% 63% ?
26 35% ?
12% 54%
Others
(excl.
matures) ?
29 17% ?
38% 45%
?
28
14% ?
43% 43%
Students
with a basis
of admission of
BC12
or
Canadian
Gr.
12 in both
the
control
group and
the
DQ group
alike performed very
poorly. BC College
transfers did much better,
with DQs slightly
ahead
of the control
group. Matures and
Others
did
better yet.
DQ Matures performed better than
the
Matures in
the control
group.
NH Oct. 98
3