For Information
?
SIMON FRASER UNIVERSITY
?
S.98-29
iI
b
Senate Graduate Studies Committee
1997 REPORT TO SENATE
The Dean of Graduate Studies is responsible for the general supervision of graduate work at the
University. This report outlines the position of graduate studies at Simon Fraser University,
describes some changes made in 1997 and makes suggestions of future directions. It is very clear
that the future will not merely be an extrapolation of the past. Reductions in Provincial funding
for at least the next two fiscal years will put serious pressure on all the University's programs. In
addition, the three-year planning process which is now underway and the government's increased
emphasis on accountability has prompted critical examination of all we are doing.
In January 1994, the combination of the positions of Dean of Graduate Studies and Vice-
President, Research was formalized by the President and Board of Governors and re-established
the position of Associate Dean of Graduate Studies. The Associate Dean has primary
S
responsibility for matters related to individual student and individual programs, and chairs the
Senate Graduate Awards Adjudication Committee and the Assessment Committee for New
Graduate Programs. The Dean is responsible for policy matters and external relations, sits on
Senate and chairs the Senate Graduate Studies Committee. In fall 1997, Dr. Jack Martin of the
Faculty of Education was appointed to a three-year term as Associate Dean, on my
recommendation.
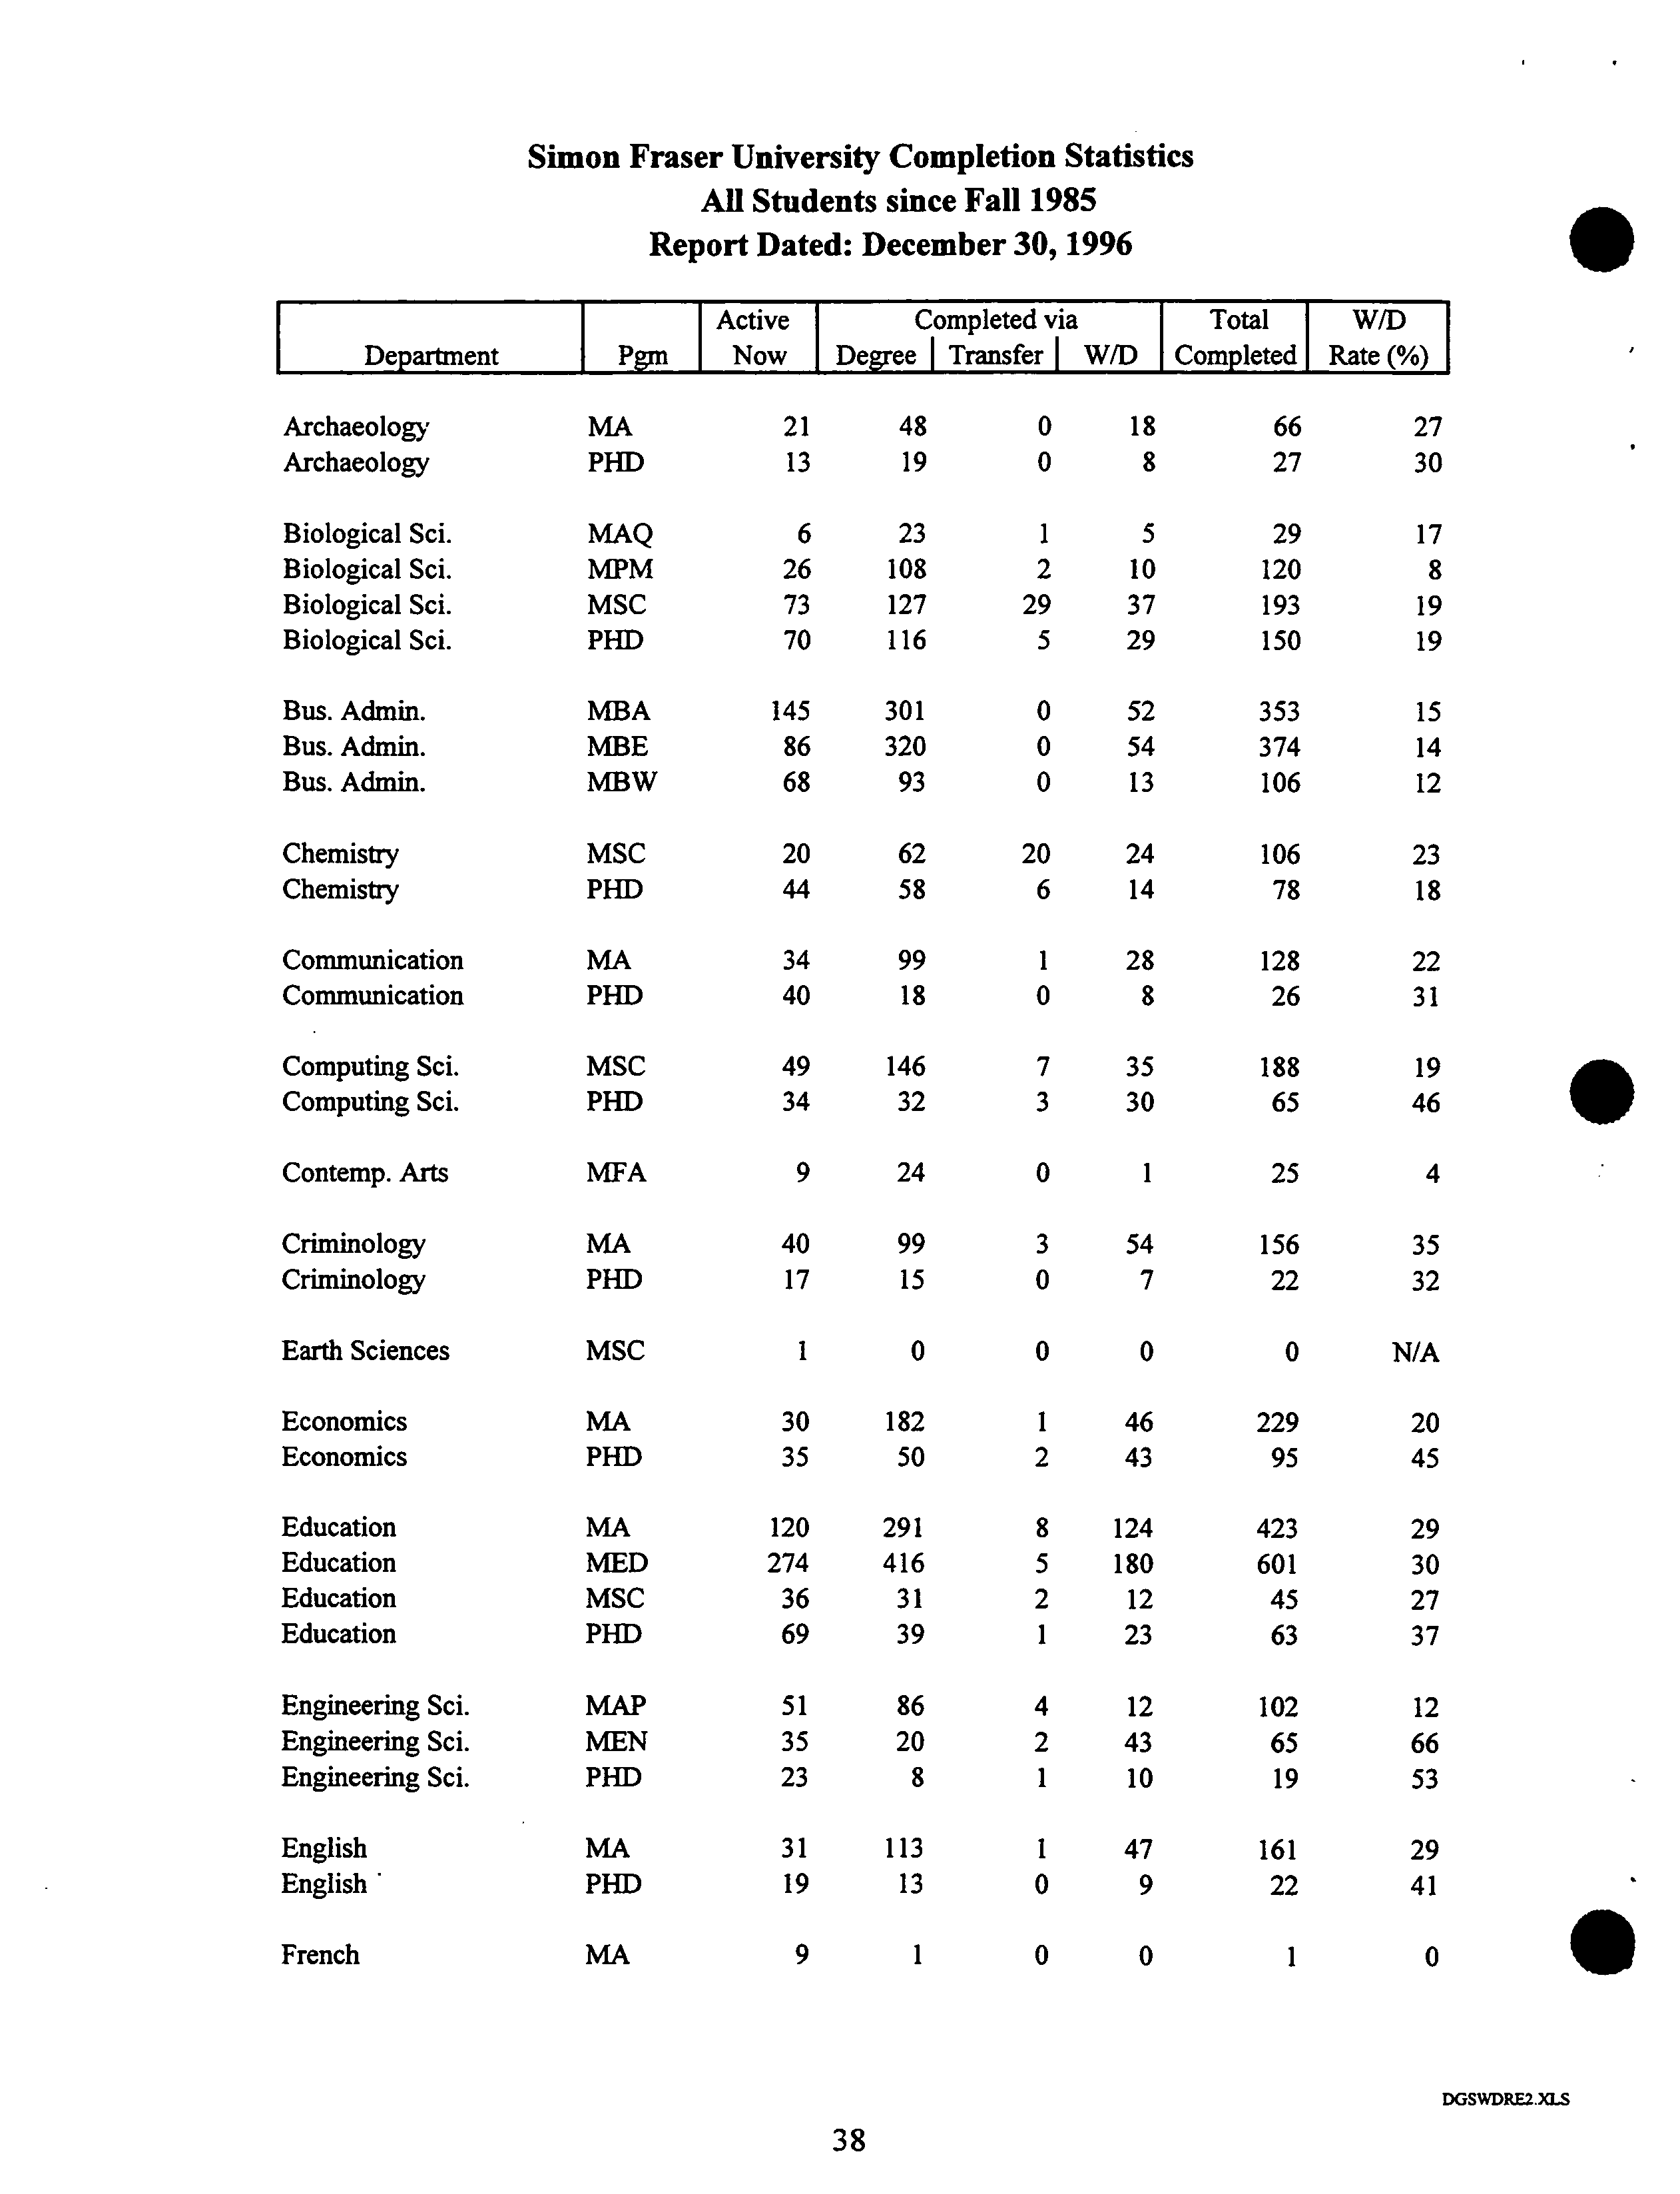
The January 1997 edition of the S.F.U. Graduate Studies Fact Book describes, in quantitative
terms, the graduate student body in Fall 1996 and provides some retrospective data on completion
rates. It is the sixth edition, designed to complement information in the Simon Fraser University
Fact Book, produced by the Office of Analytical Studies. Copies are available for perusal from
the Secretary of Senate. The Fact Book has moved to biennial production due to budget
shortfalls, workload pressures and the fact that the cumulative data change rather slowly.
L Enrolments and Degrees
The first section of the Graduate Studies Fact Book shows the recent history of graduate
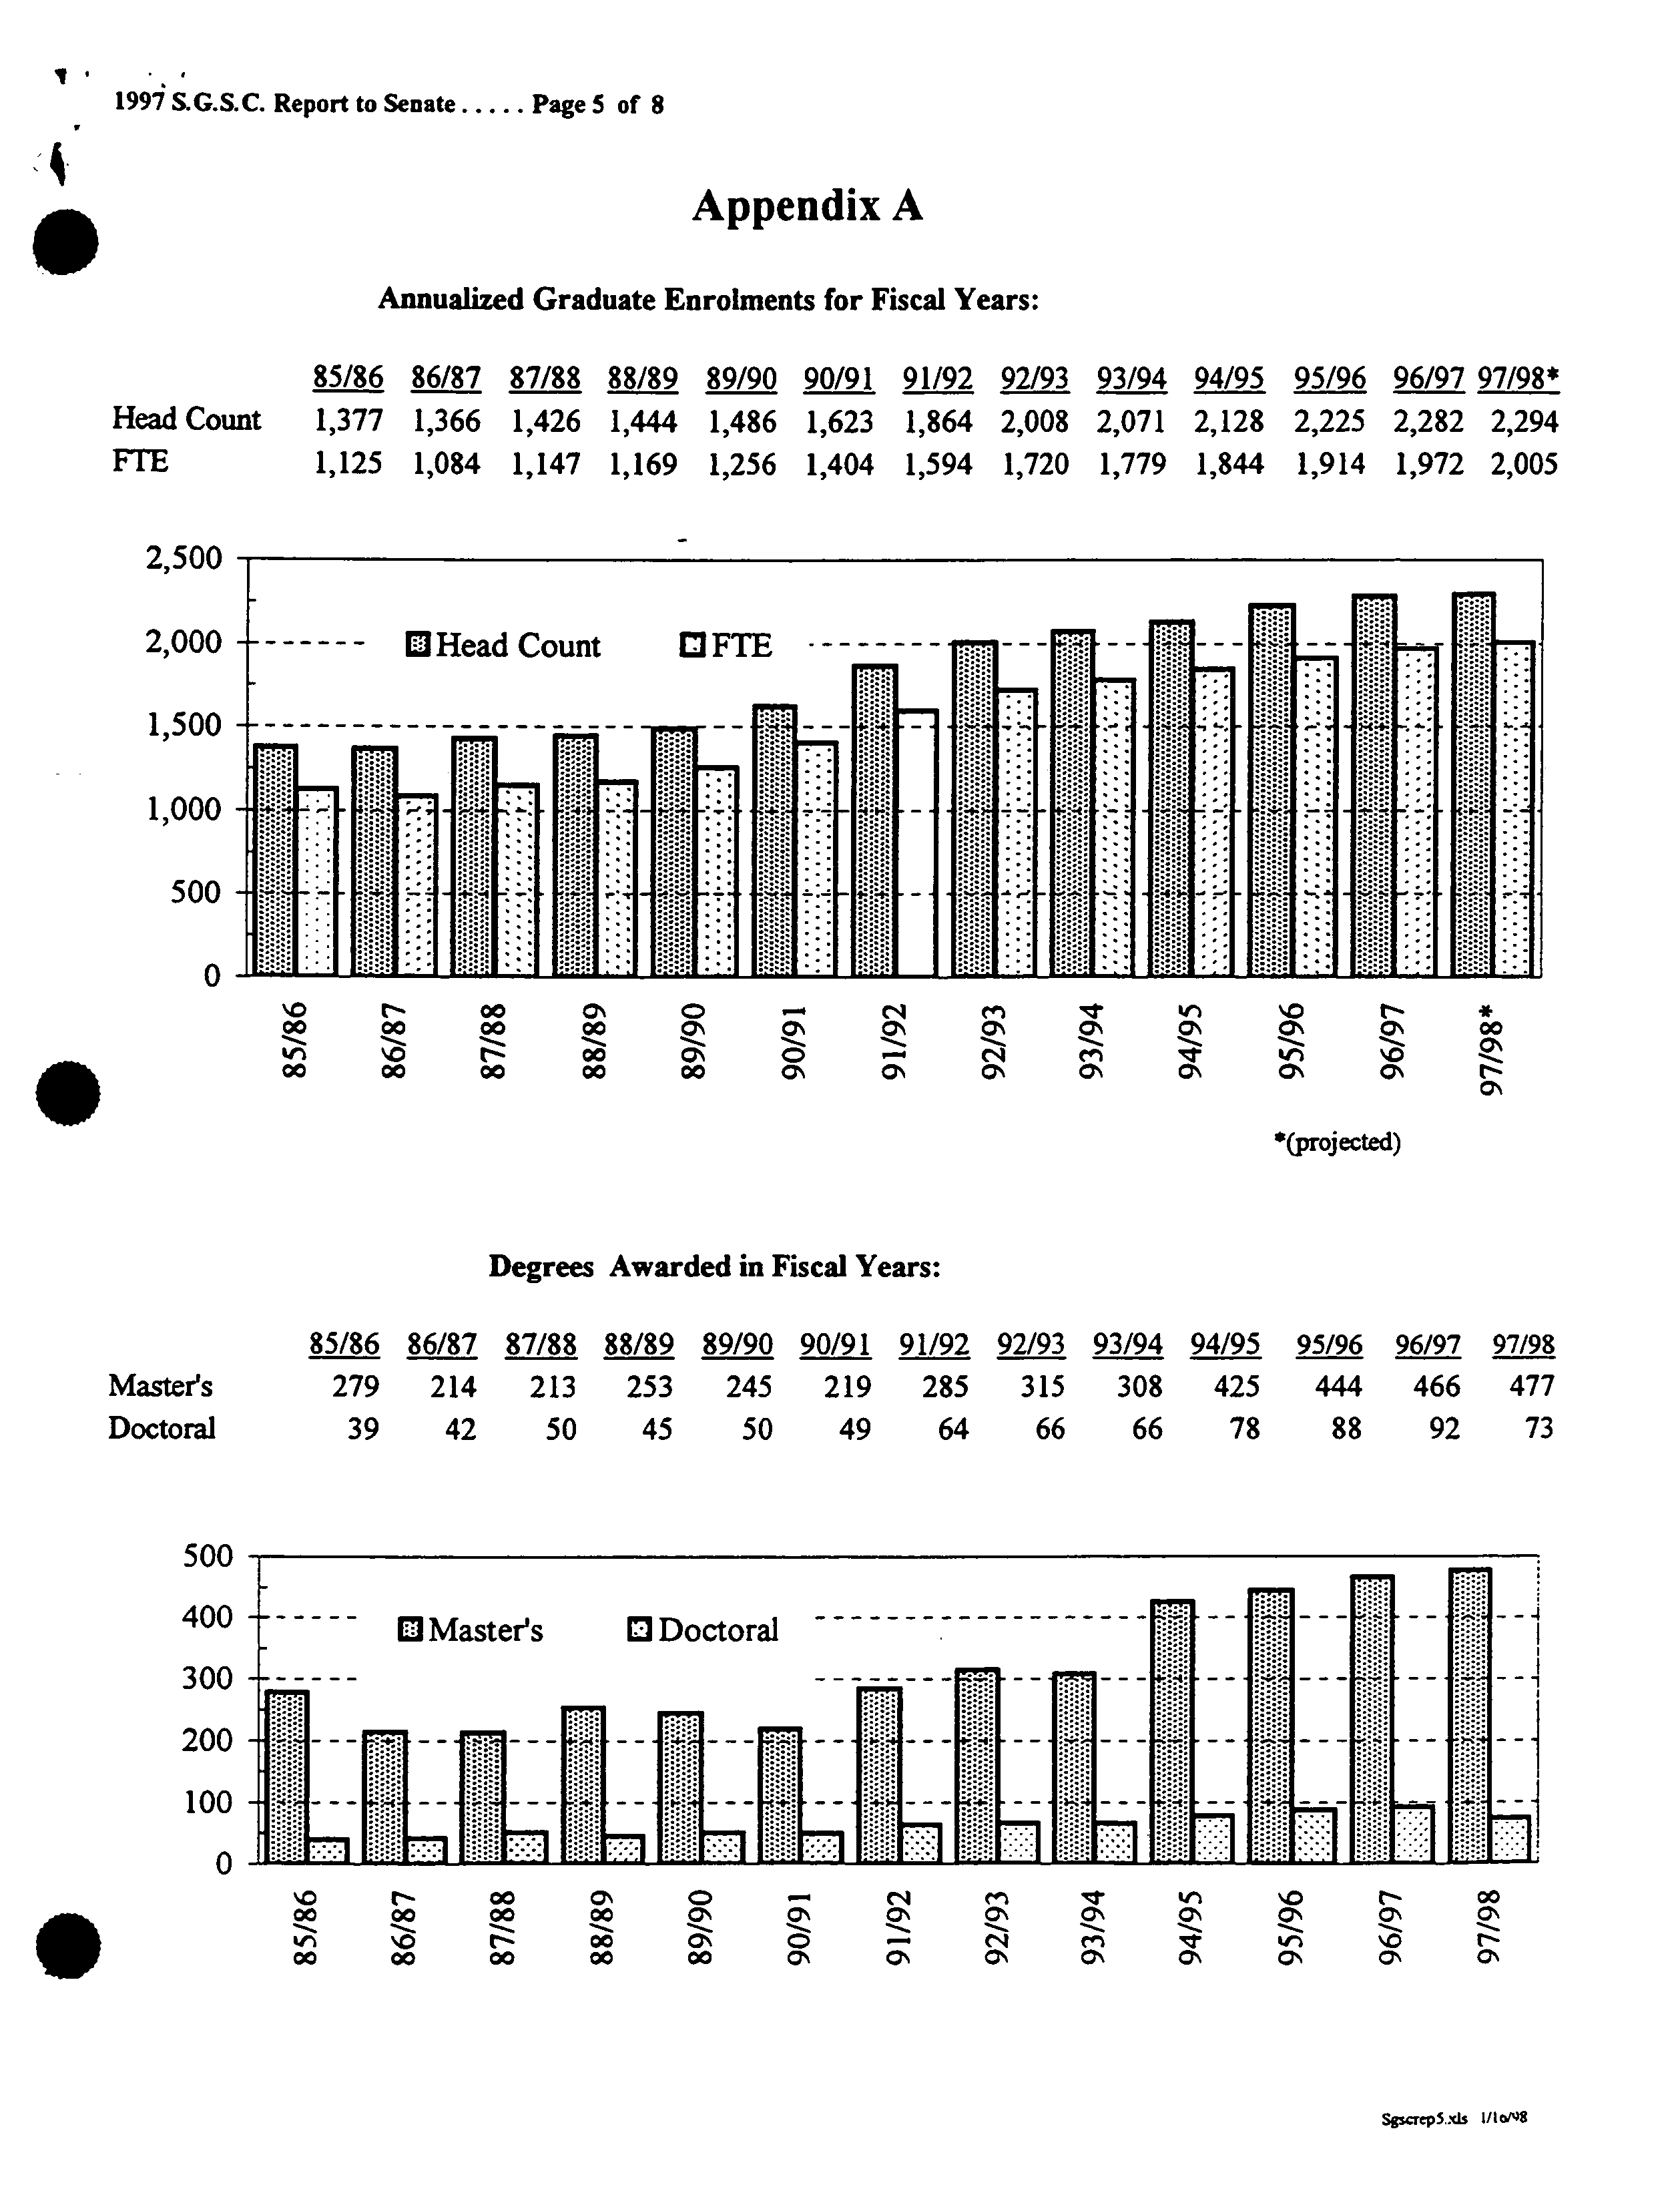
enrolments and degrees granted; a brief version is attached to this report as Appendix A. The
FTh enrolment figures should be treated with caution on two grounds. Prior to the Fall 1989,
they were determined through a reporting process which was subject to considerable variation
between departments. Starting in the Fall 1989, a new, rigorous definition of Part-Time status
was adopted; this was primarily responsible for the change in the (Head Count)IFTE ratio
between 88/89 and 89/90. The official recognition of Part-Time status and the introduction of a
S
reduced semester tuition fee for Part-Time students were major advances in improving the
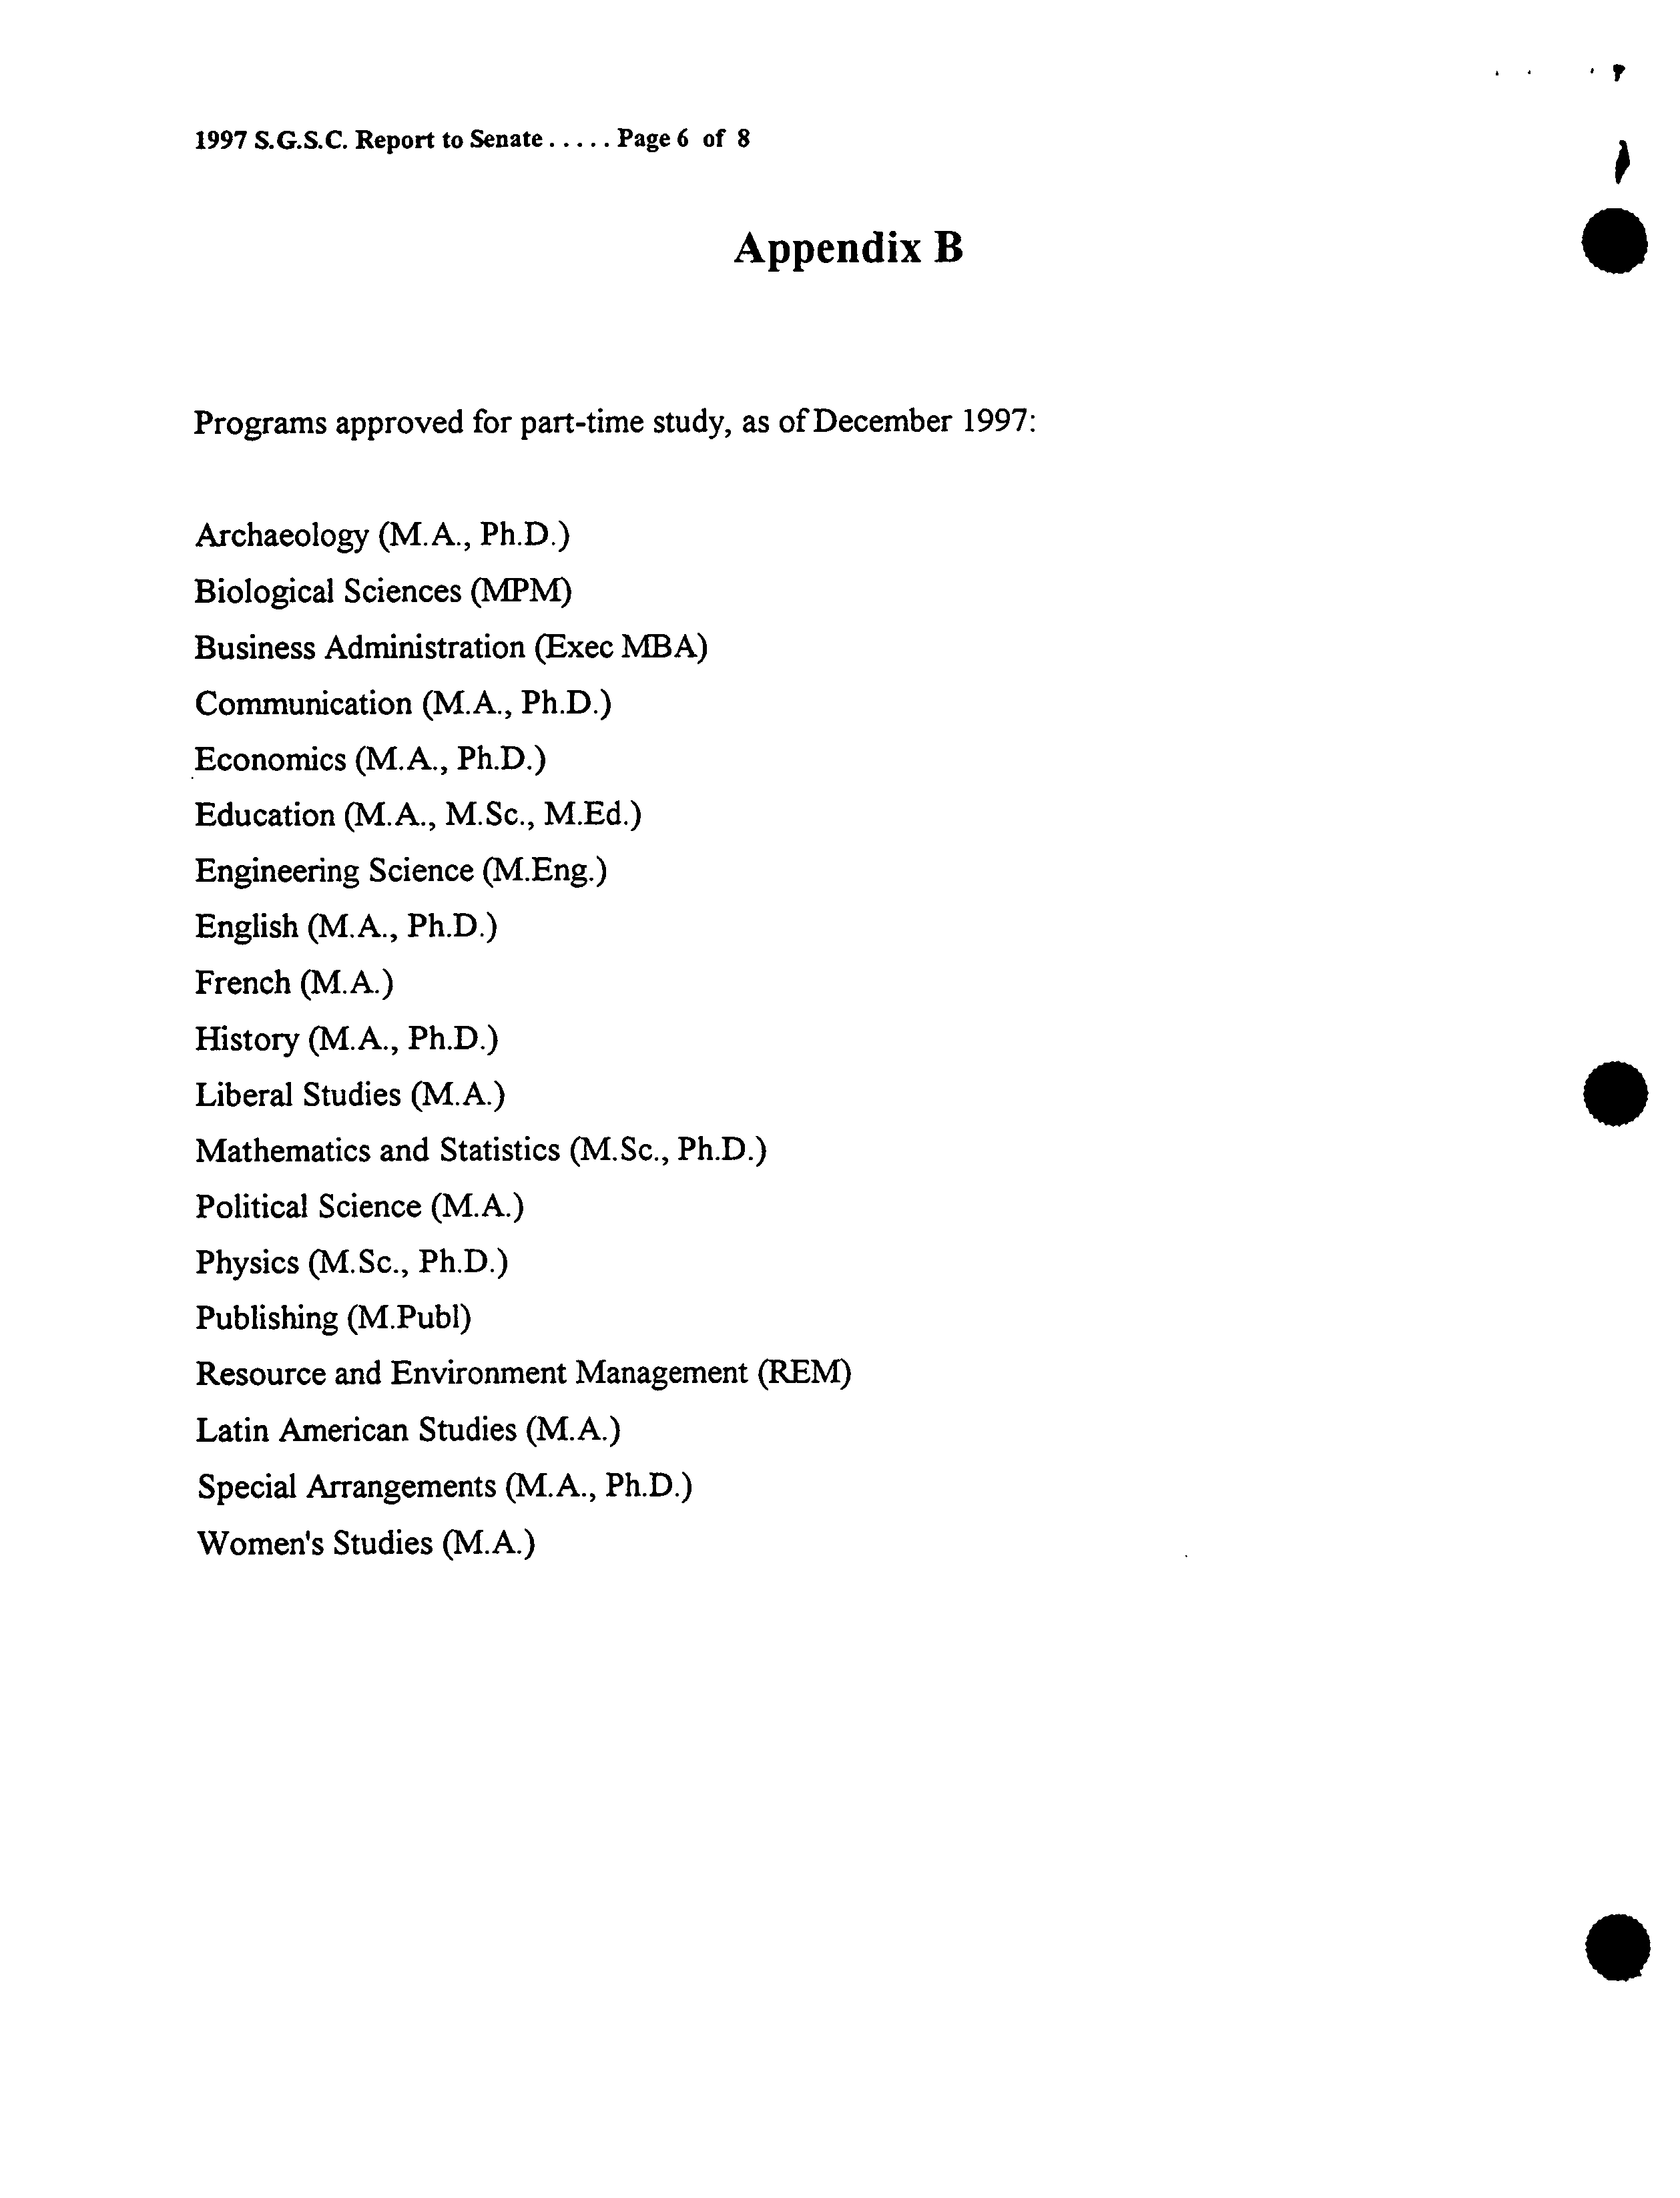
accessibility of our graduate programs. Programs currently approved for Part-Time study are
listed in Appendix B.
12-Feb-98 SENAT.98.DCC
1997 S.G.S.C. Report to Senate
?
. Page 2 of 8
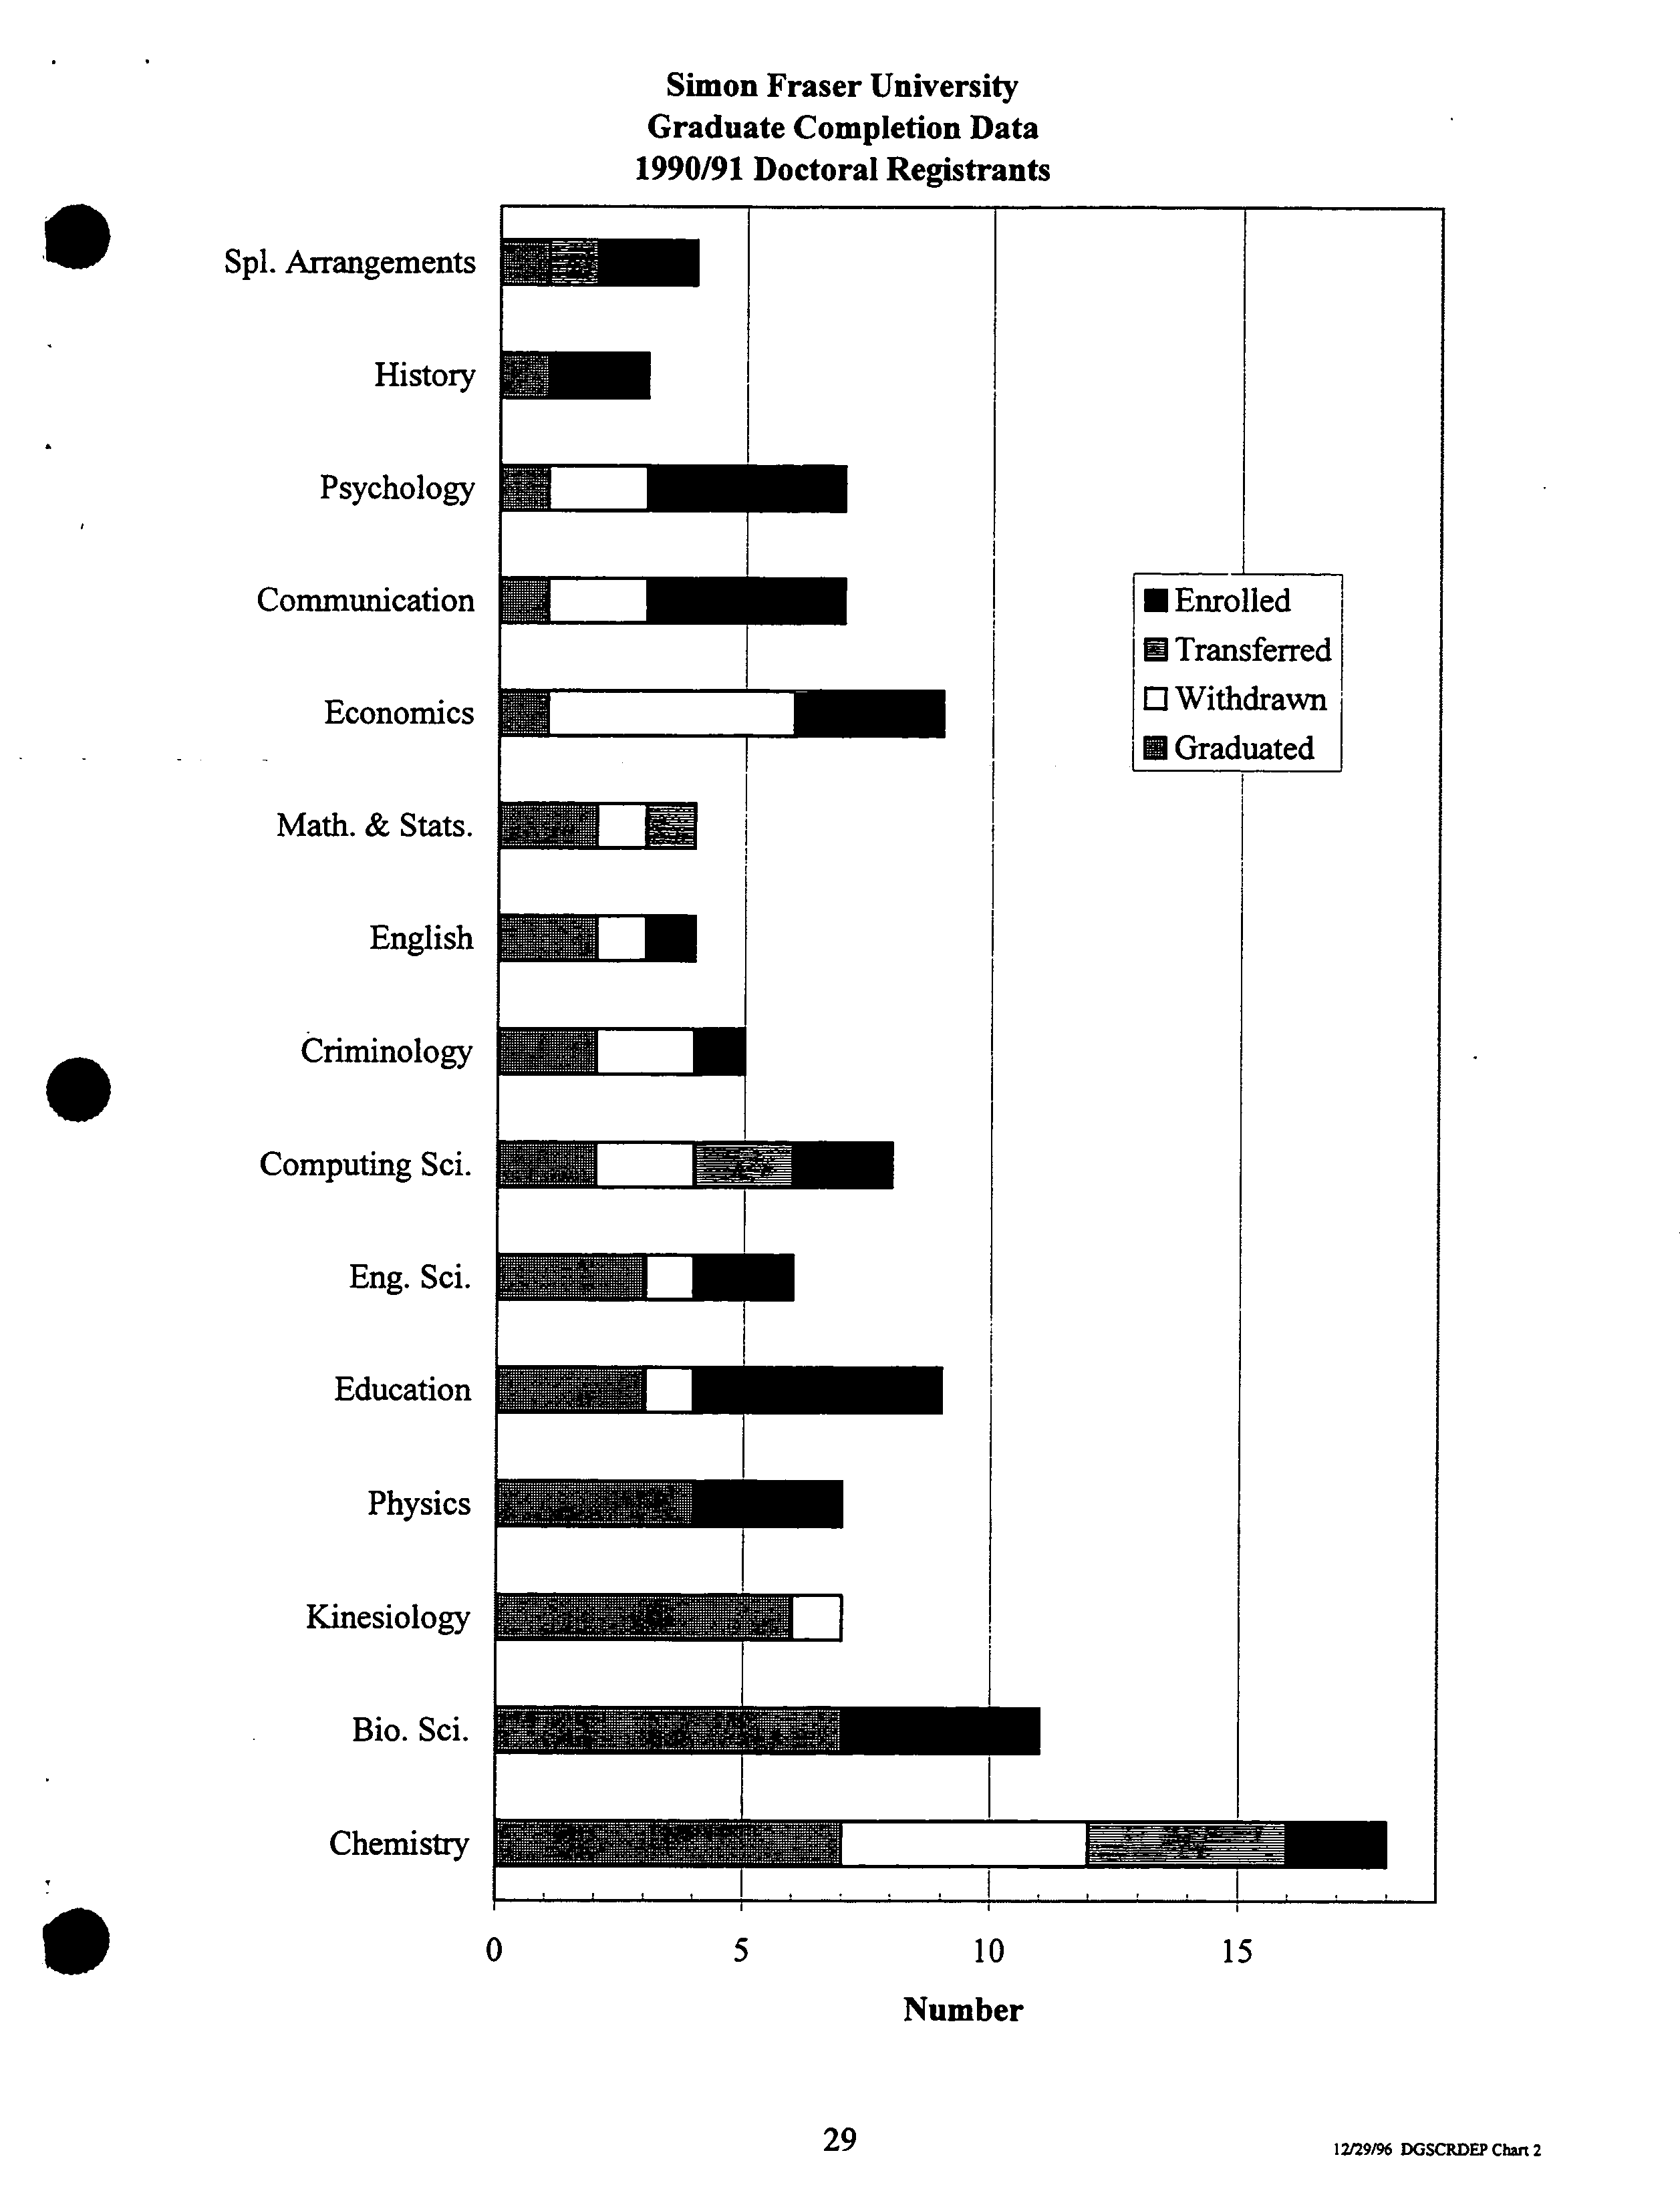
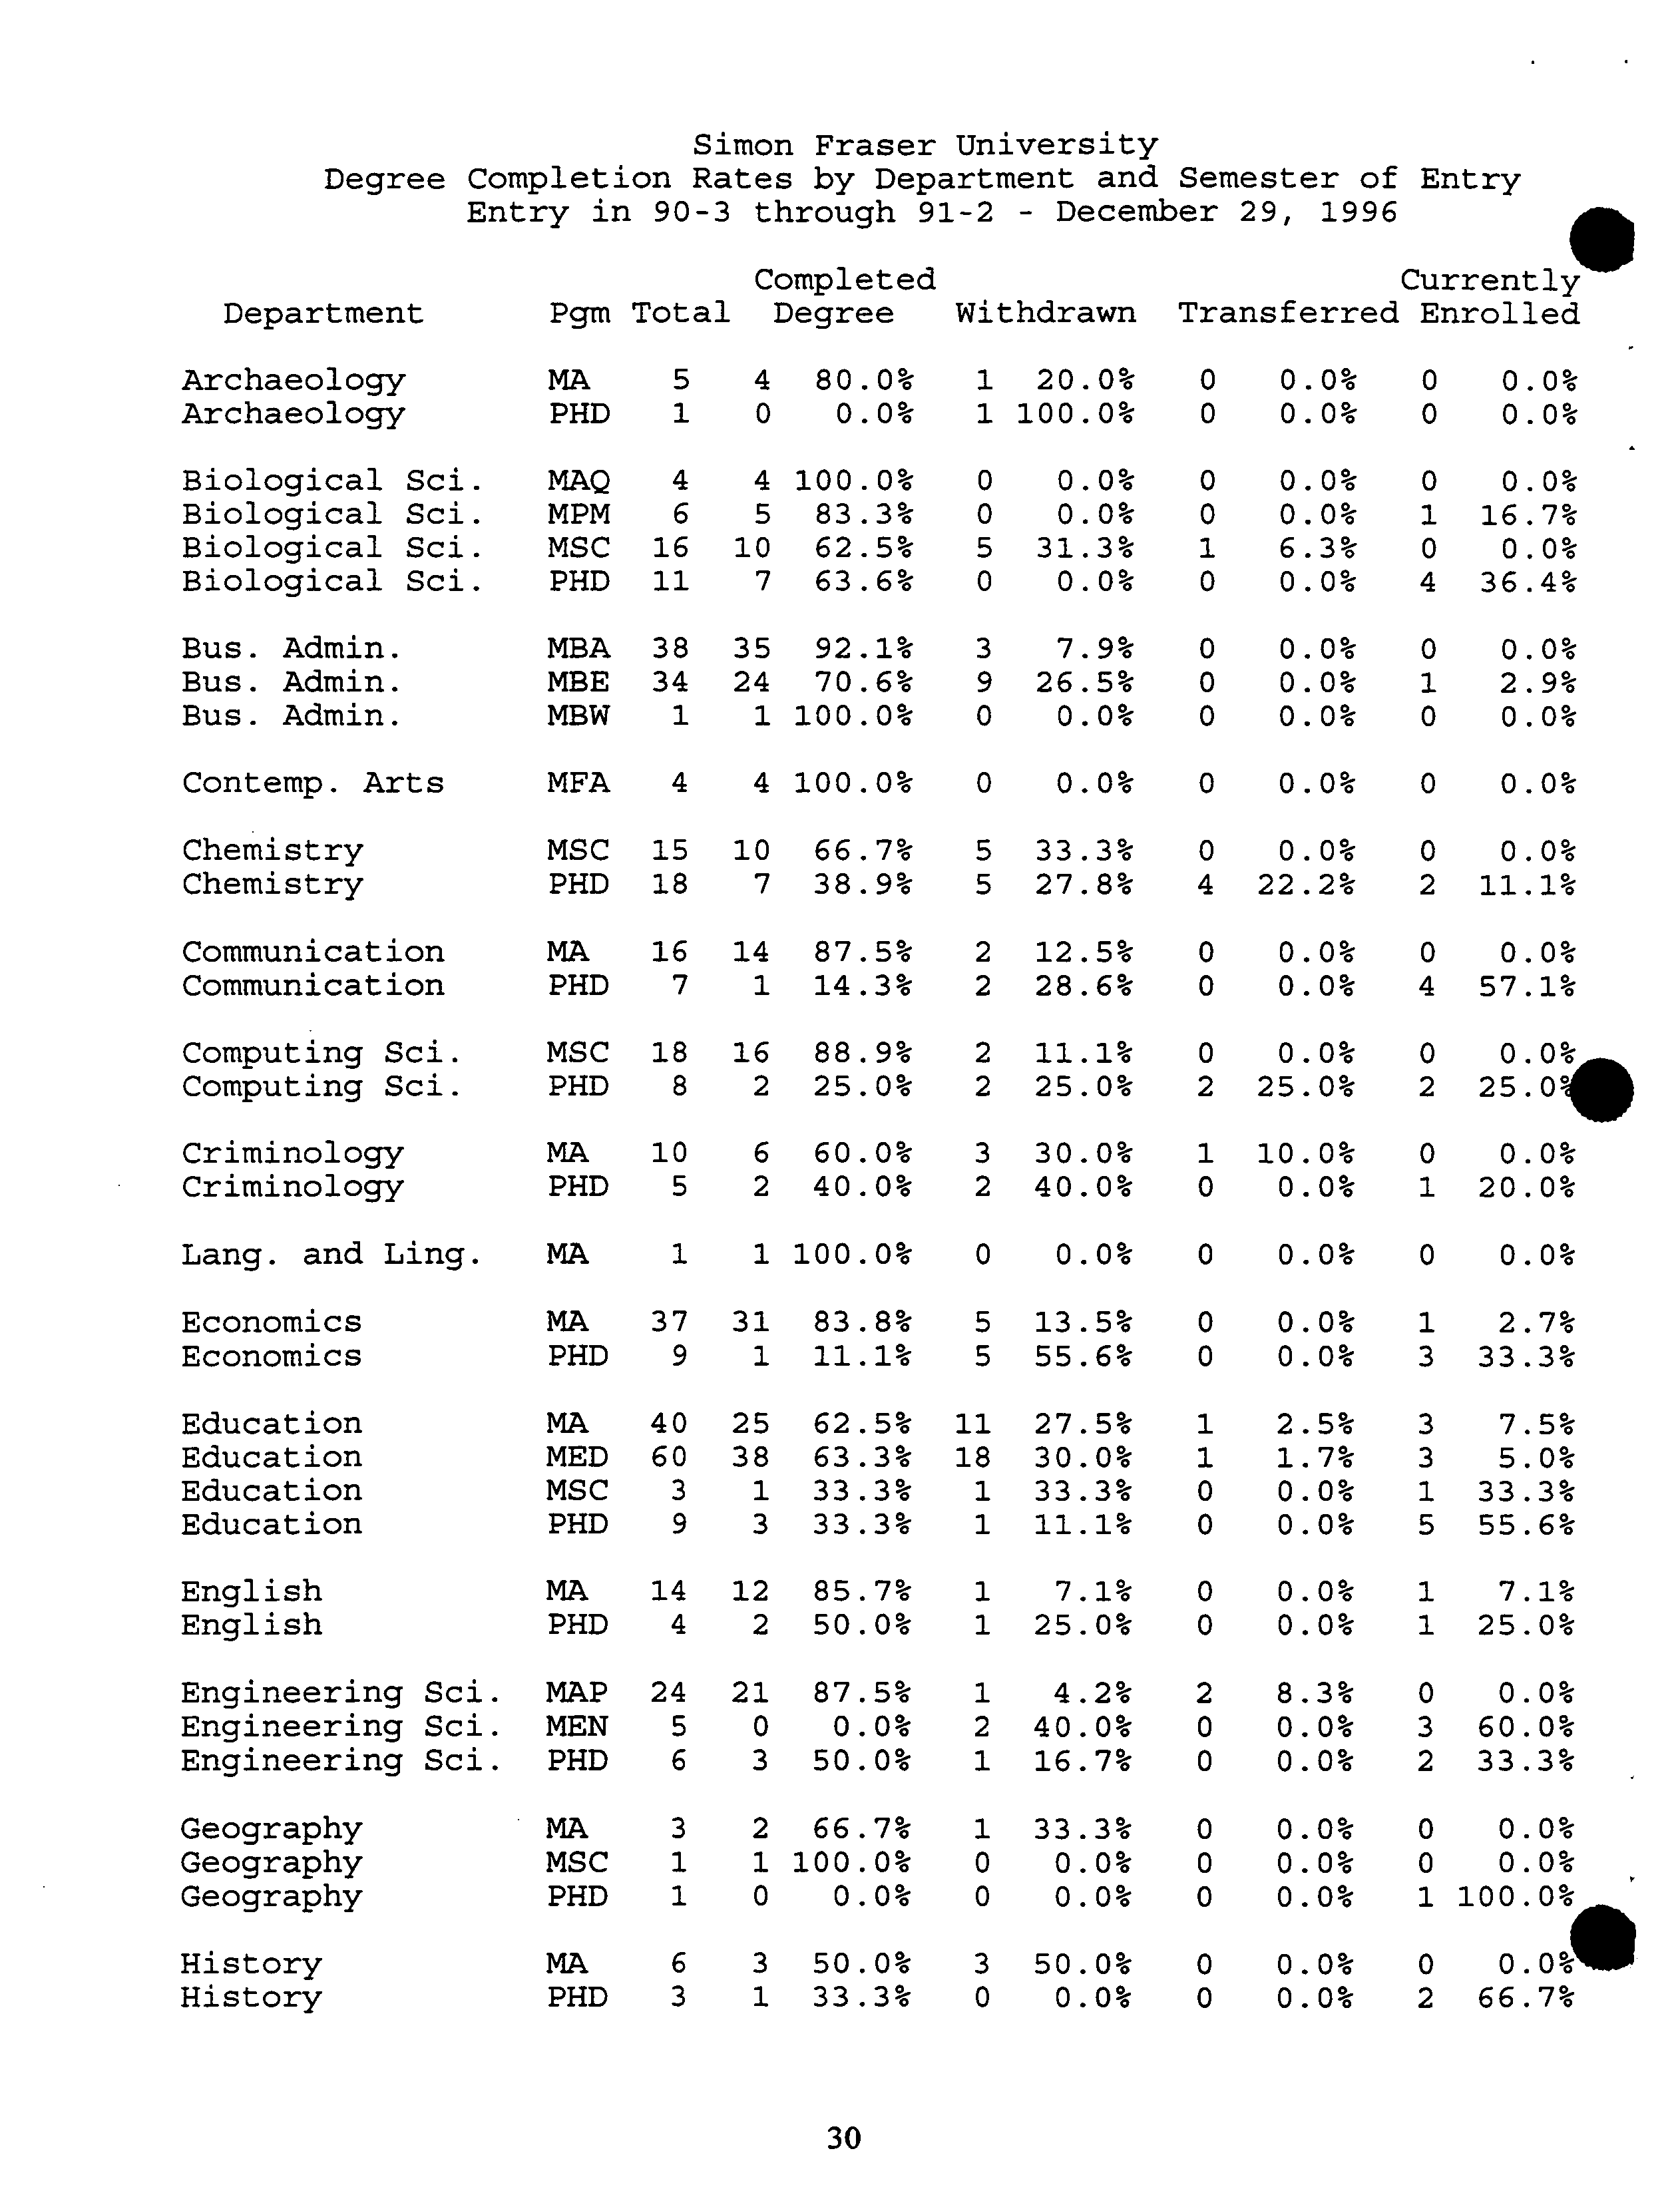
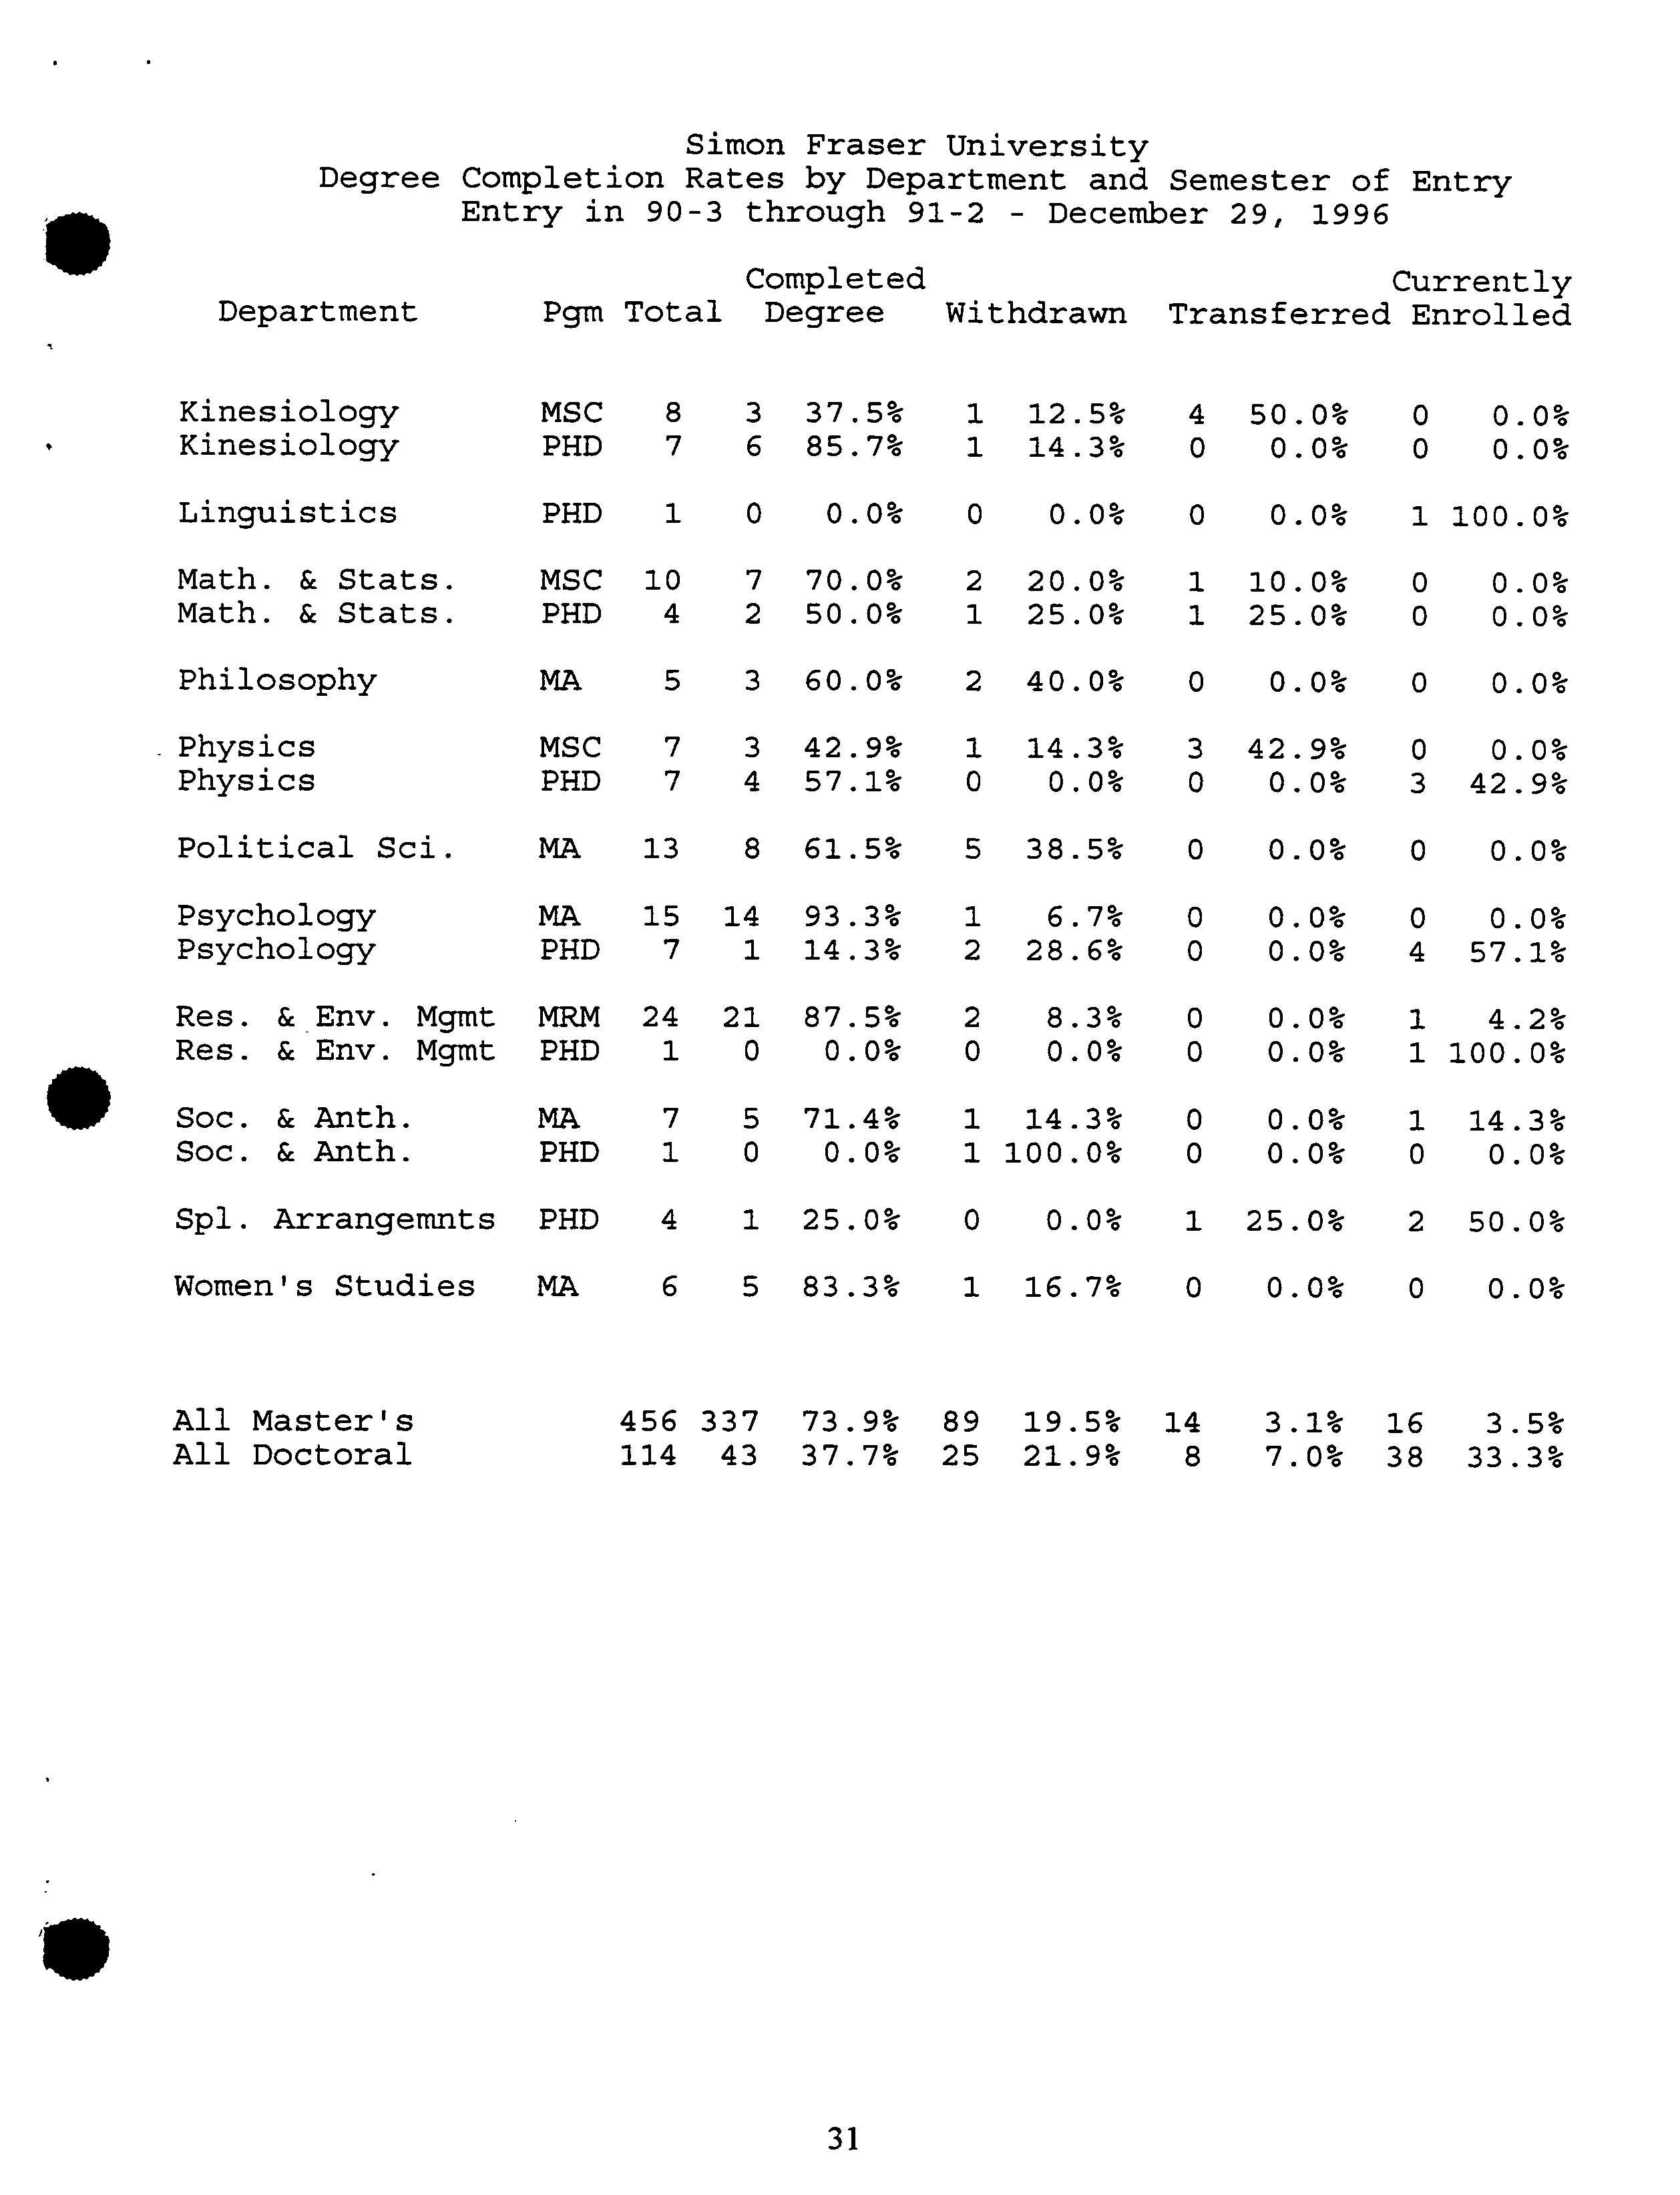
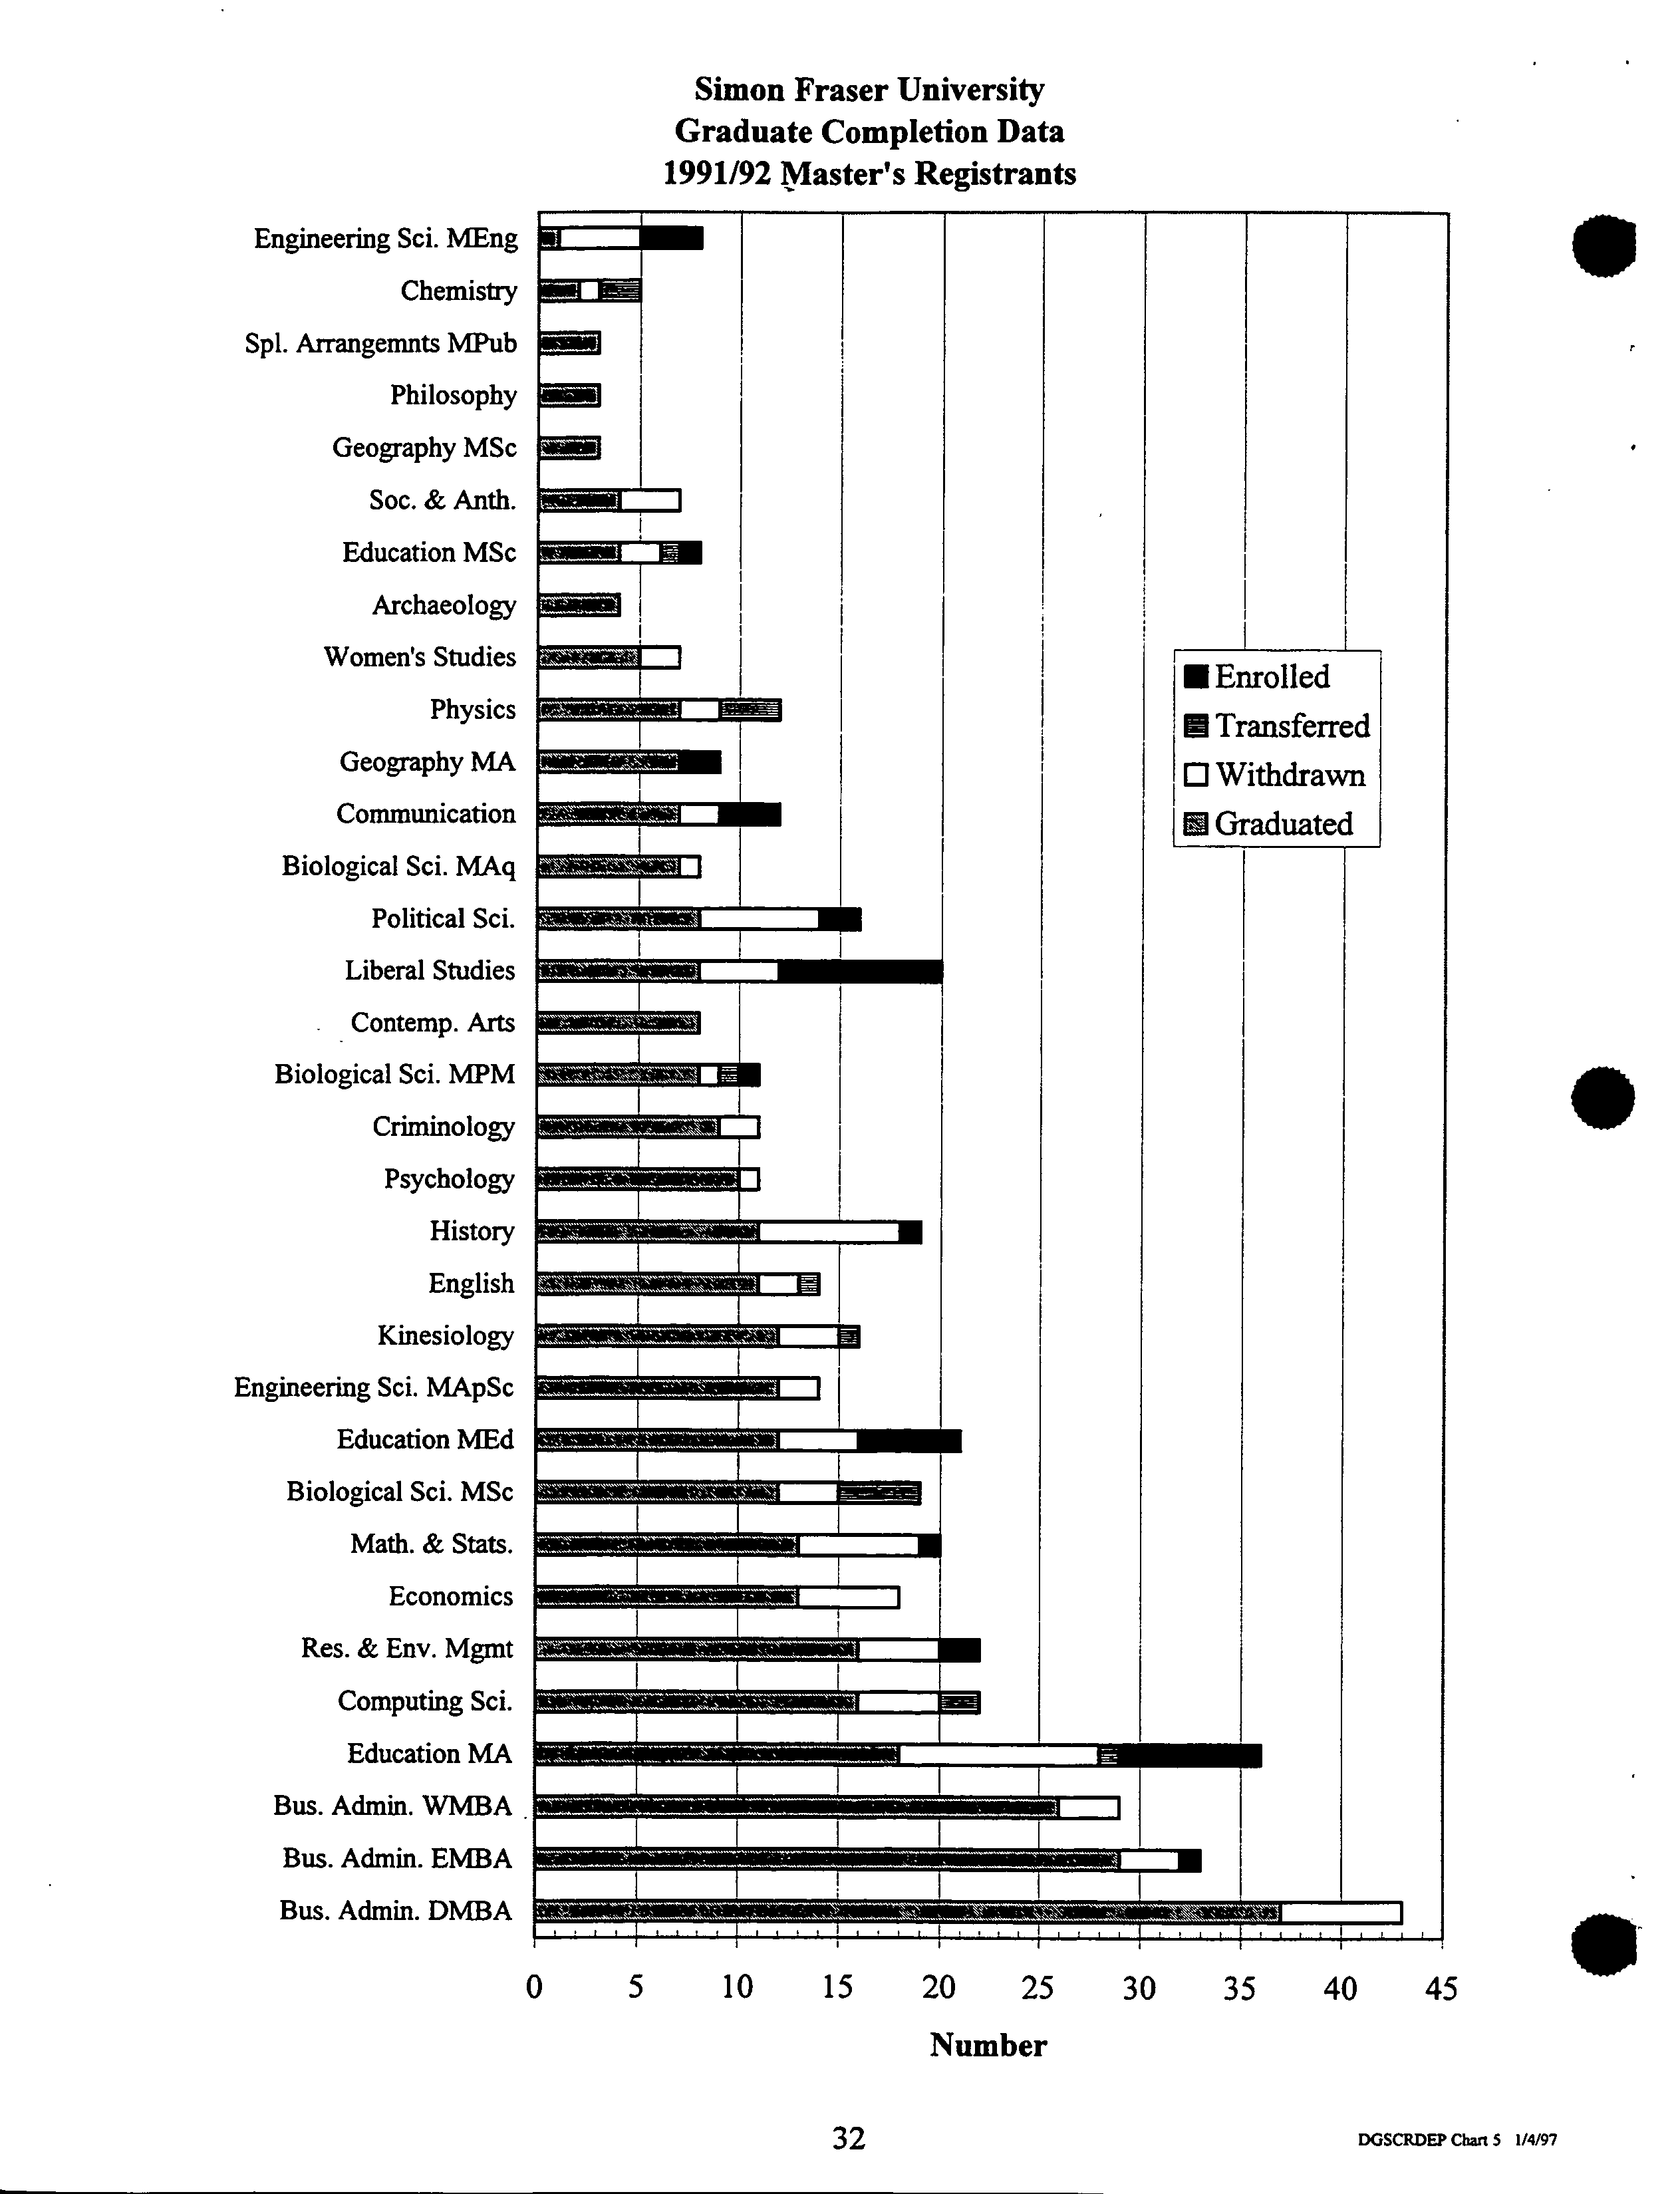
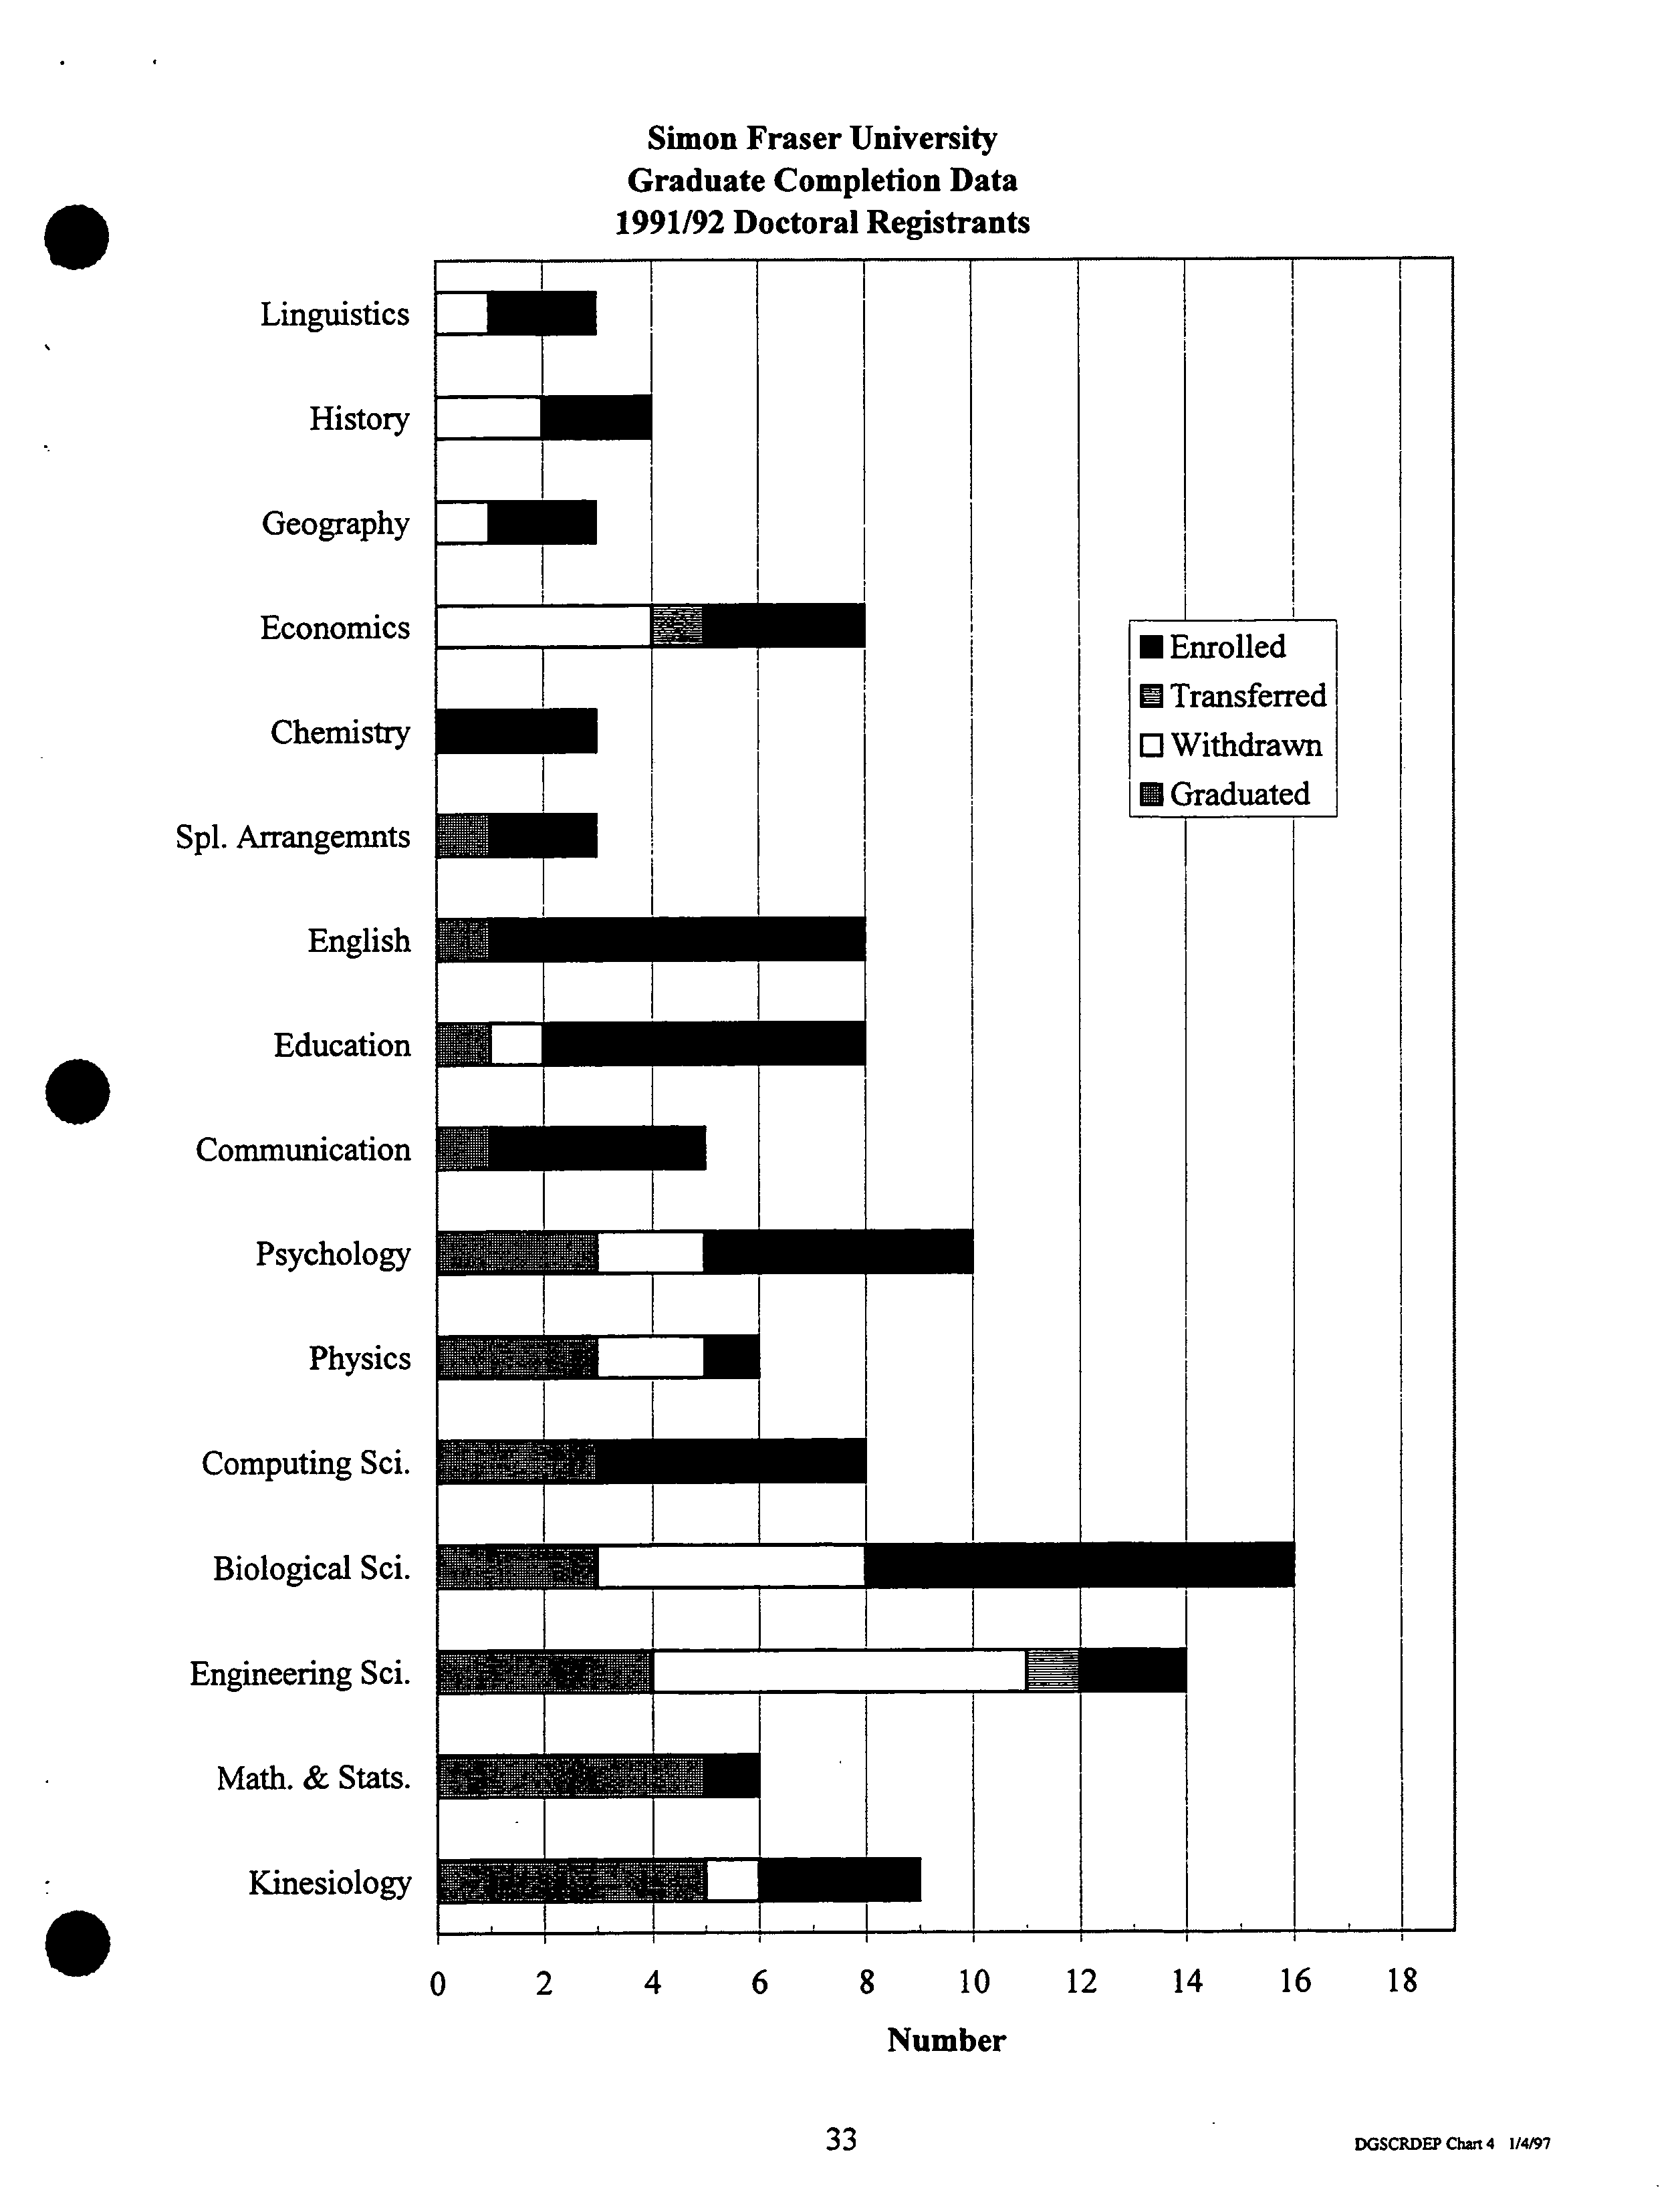
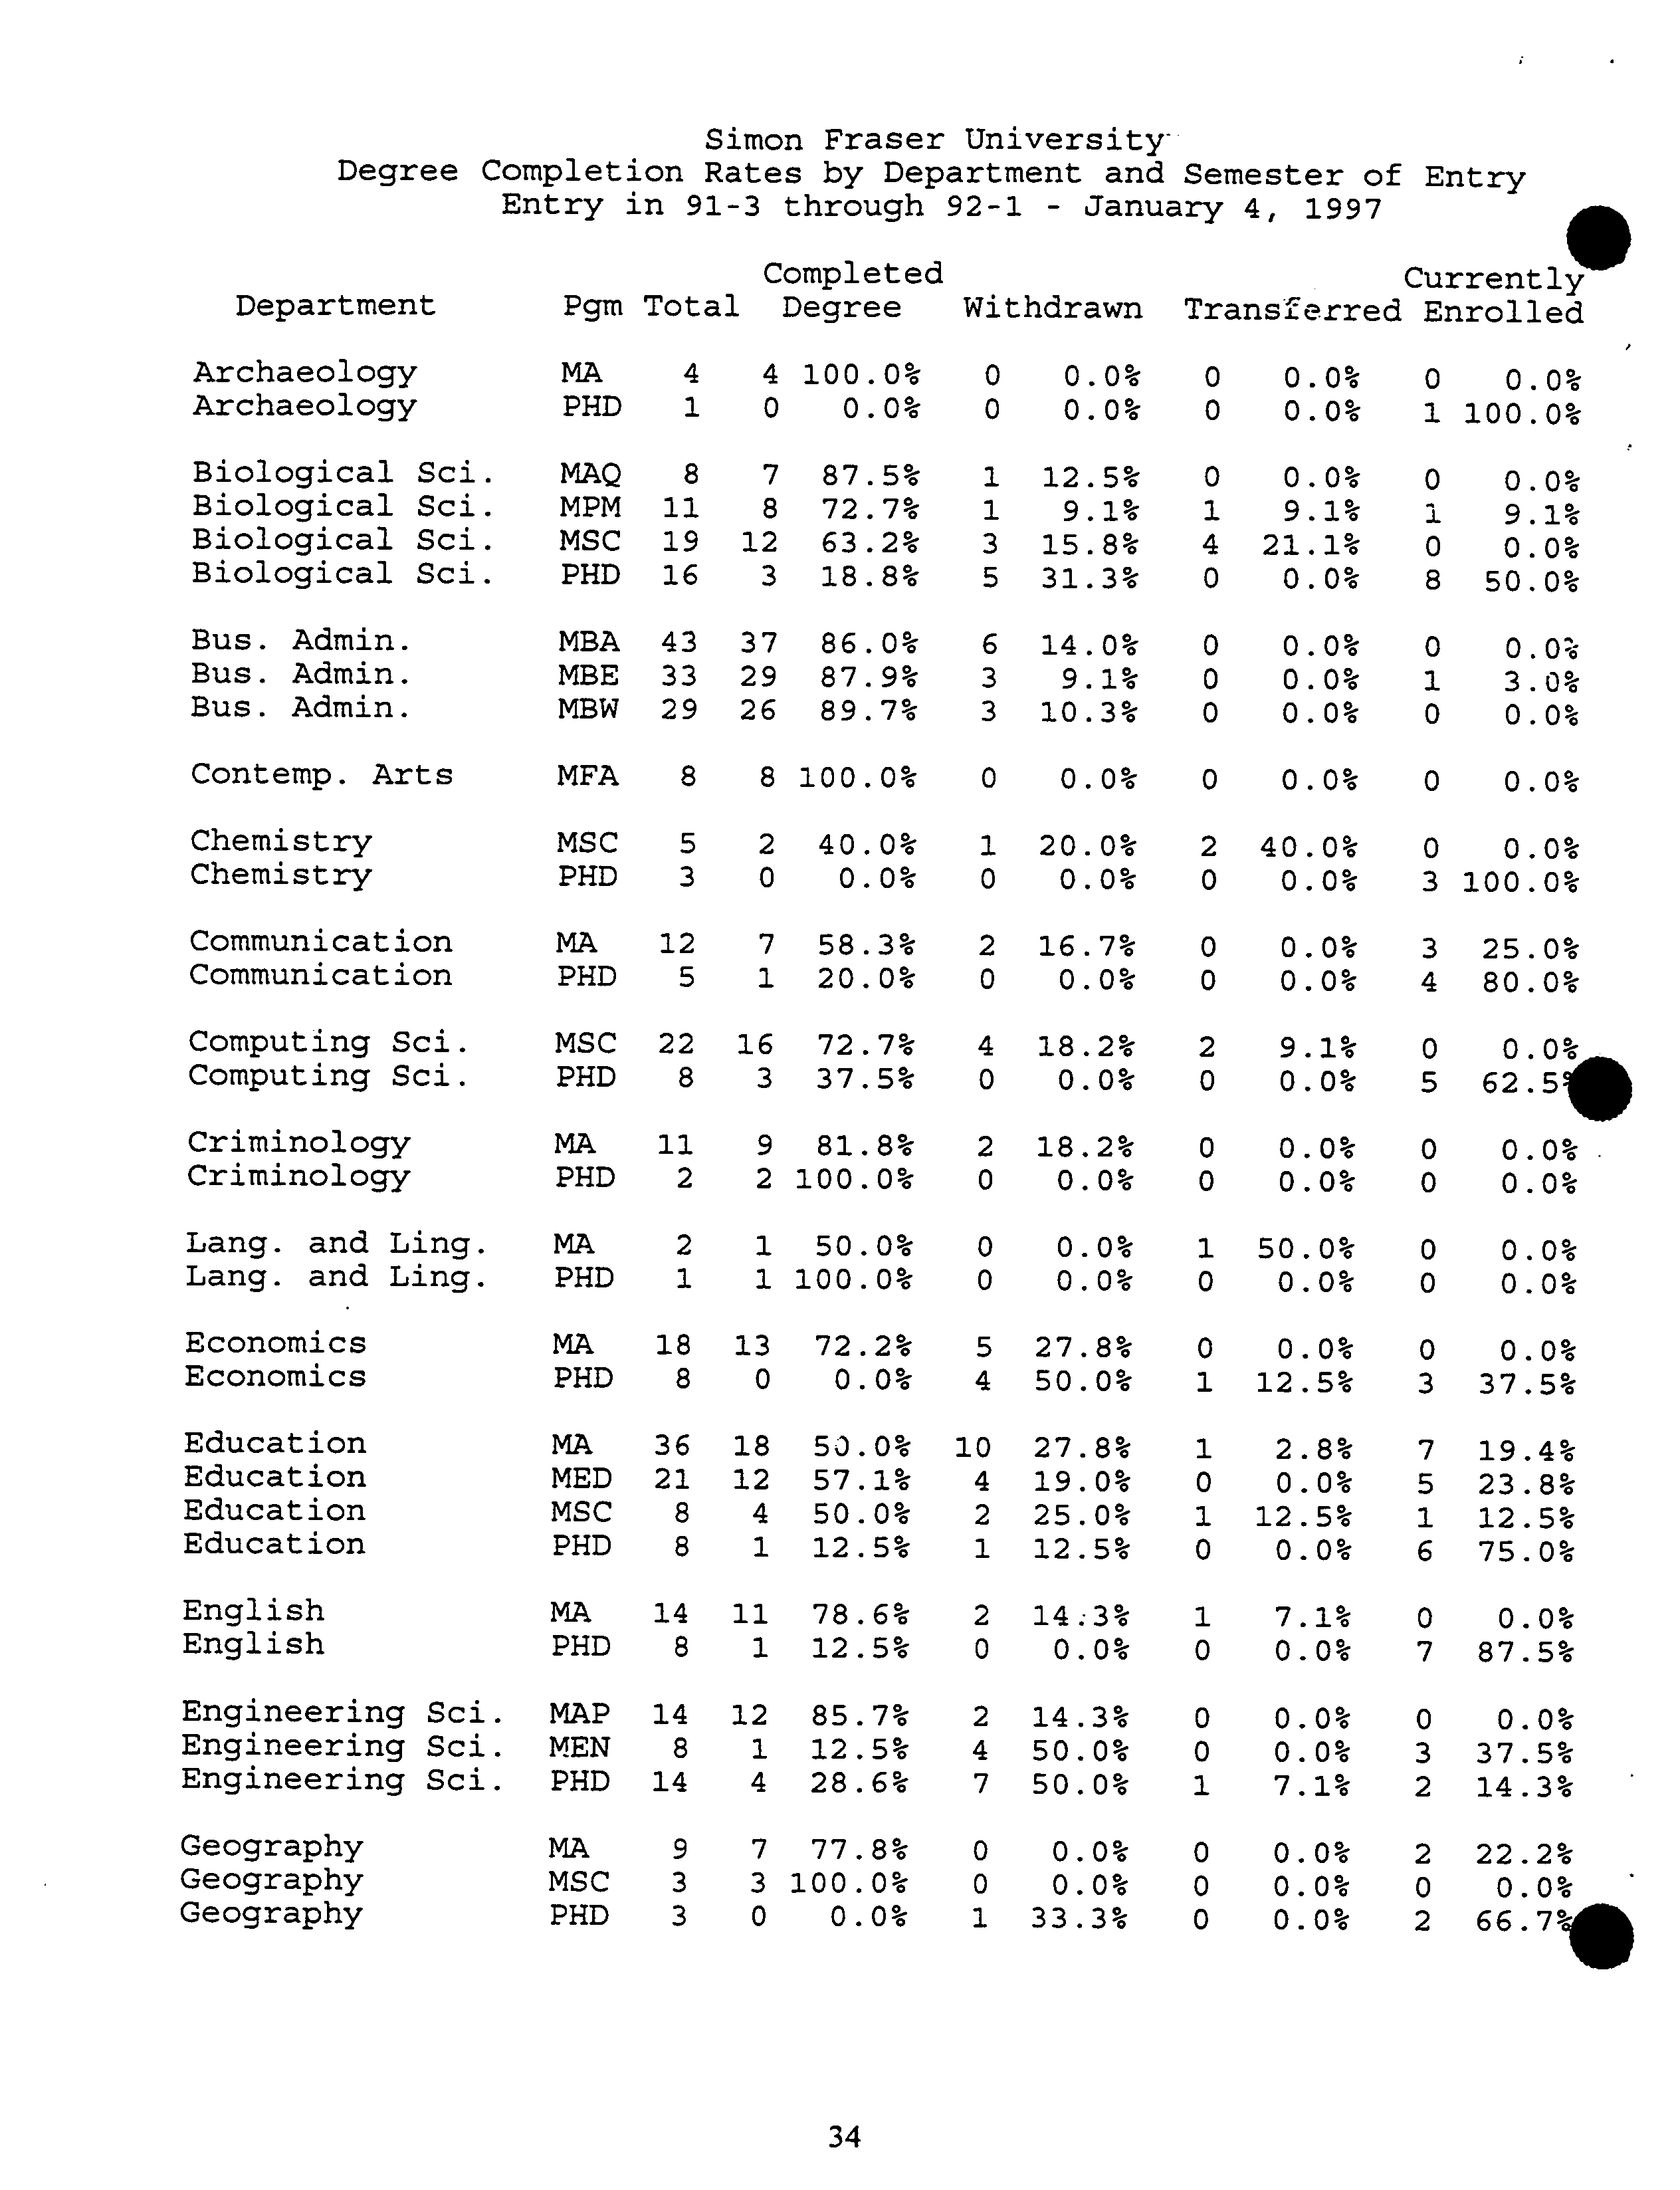
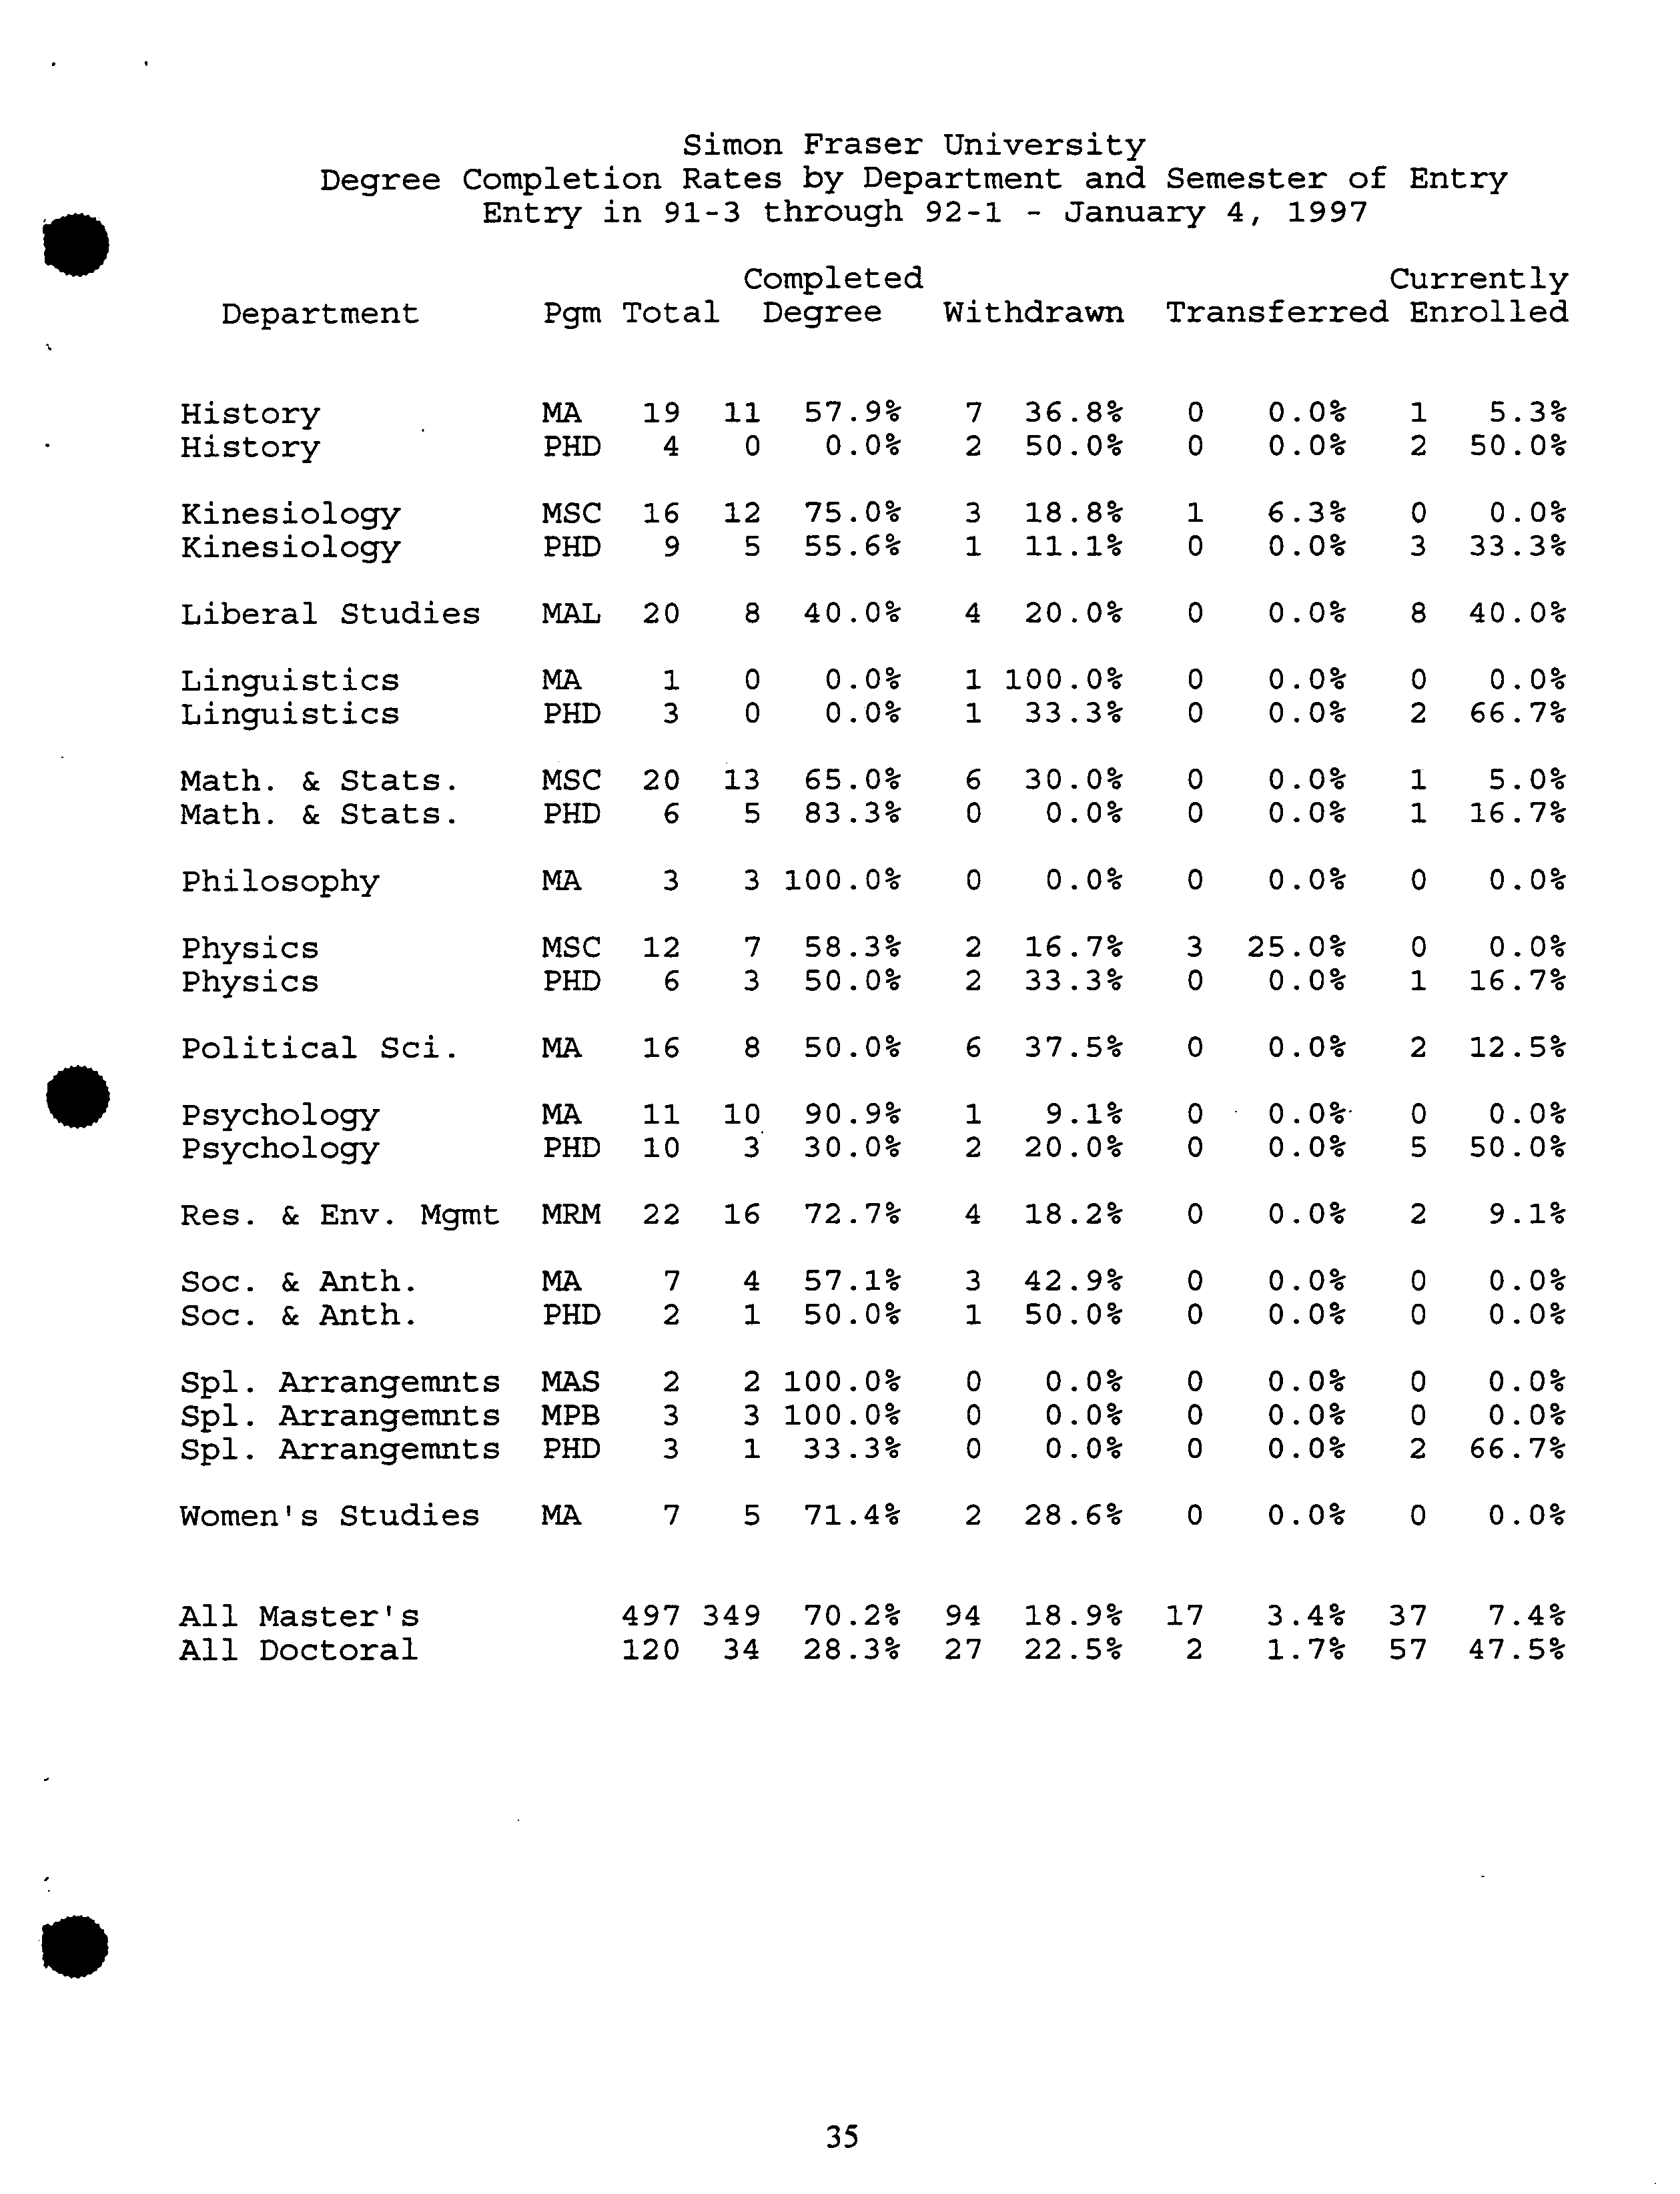
IL Degree Completion/Withdrawal
Degree completion times are presented in the Graduate Studies Fact Book. It should be noted
that these data do not take into account the possibility that a student may have been enrolled Part-
Time for all or part of the program and thus overstate completion times, especially for programs
with large numbers of Part-Time students.
Although a trend to longer completion times has been arrested and Master's degree completion
times reduced, I remain concerned by what appear in many cases to be excessive times for degree
completion. When resources are limited, it is especially important that they be used effectively
and efficiently. I am actively encouraging departments to ensure both that their degree
requirements are realistic and that their students make satisfactory progress, as required by Senate
regulations, toward meeting those requirements. To this end, in early 1996, I requested reports
from all
departments on the status of each of their students, with respect to the currency of
progress reports. I am pleased to report that most students in most departments have current
completion reports on file. Departments found not to be in full compliance have been urged to
improve their practices.
I am also pressing for timely appointment of supervisory committees. In establishing the
Graduate Studies Database, I encountered many students who had been here for several years, yet
apparently had no supervisory committees. This situation has largely been remedied; regularly,
reminders about 'delinquent' students are sent to departments by my office; a minor flood of
committee recommendations typically follows. Information on supervision is forwarded to the
Office of the Vice-President, Academic for inclusion in the annual CV update process.
The Graduate Studies Handbook, first published in 1991 and updated annually through 1997,
contains guidelines for supervisors and students that (if followed) should improve prospects for
expeditious degree completion. I have provided Graduate Program Chairs with samples of forms
used at SFU and elsewhere for reporting on student progress. The Handbook is now available on
SFU' s WWW site http://www.sfu.ca/dean-gradstudies/gradhandbk/
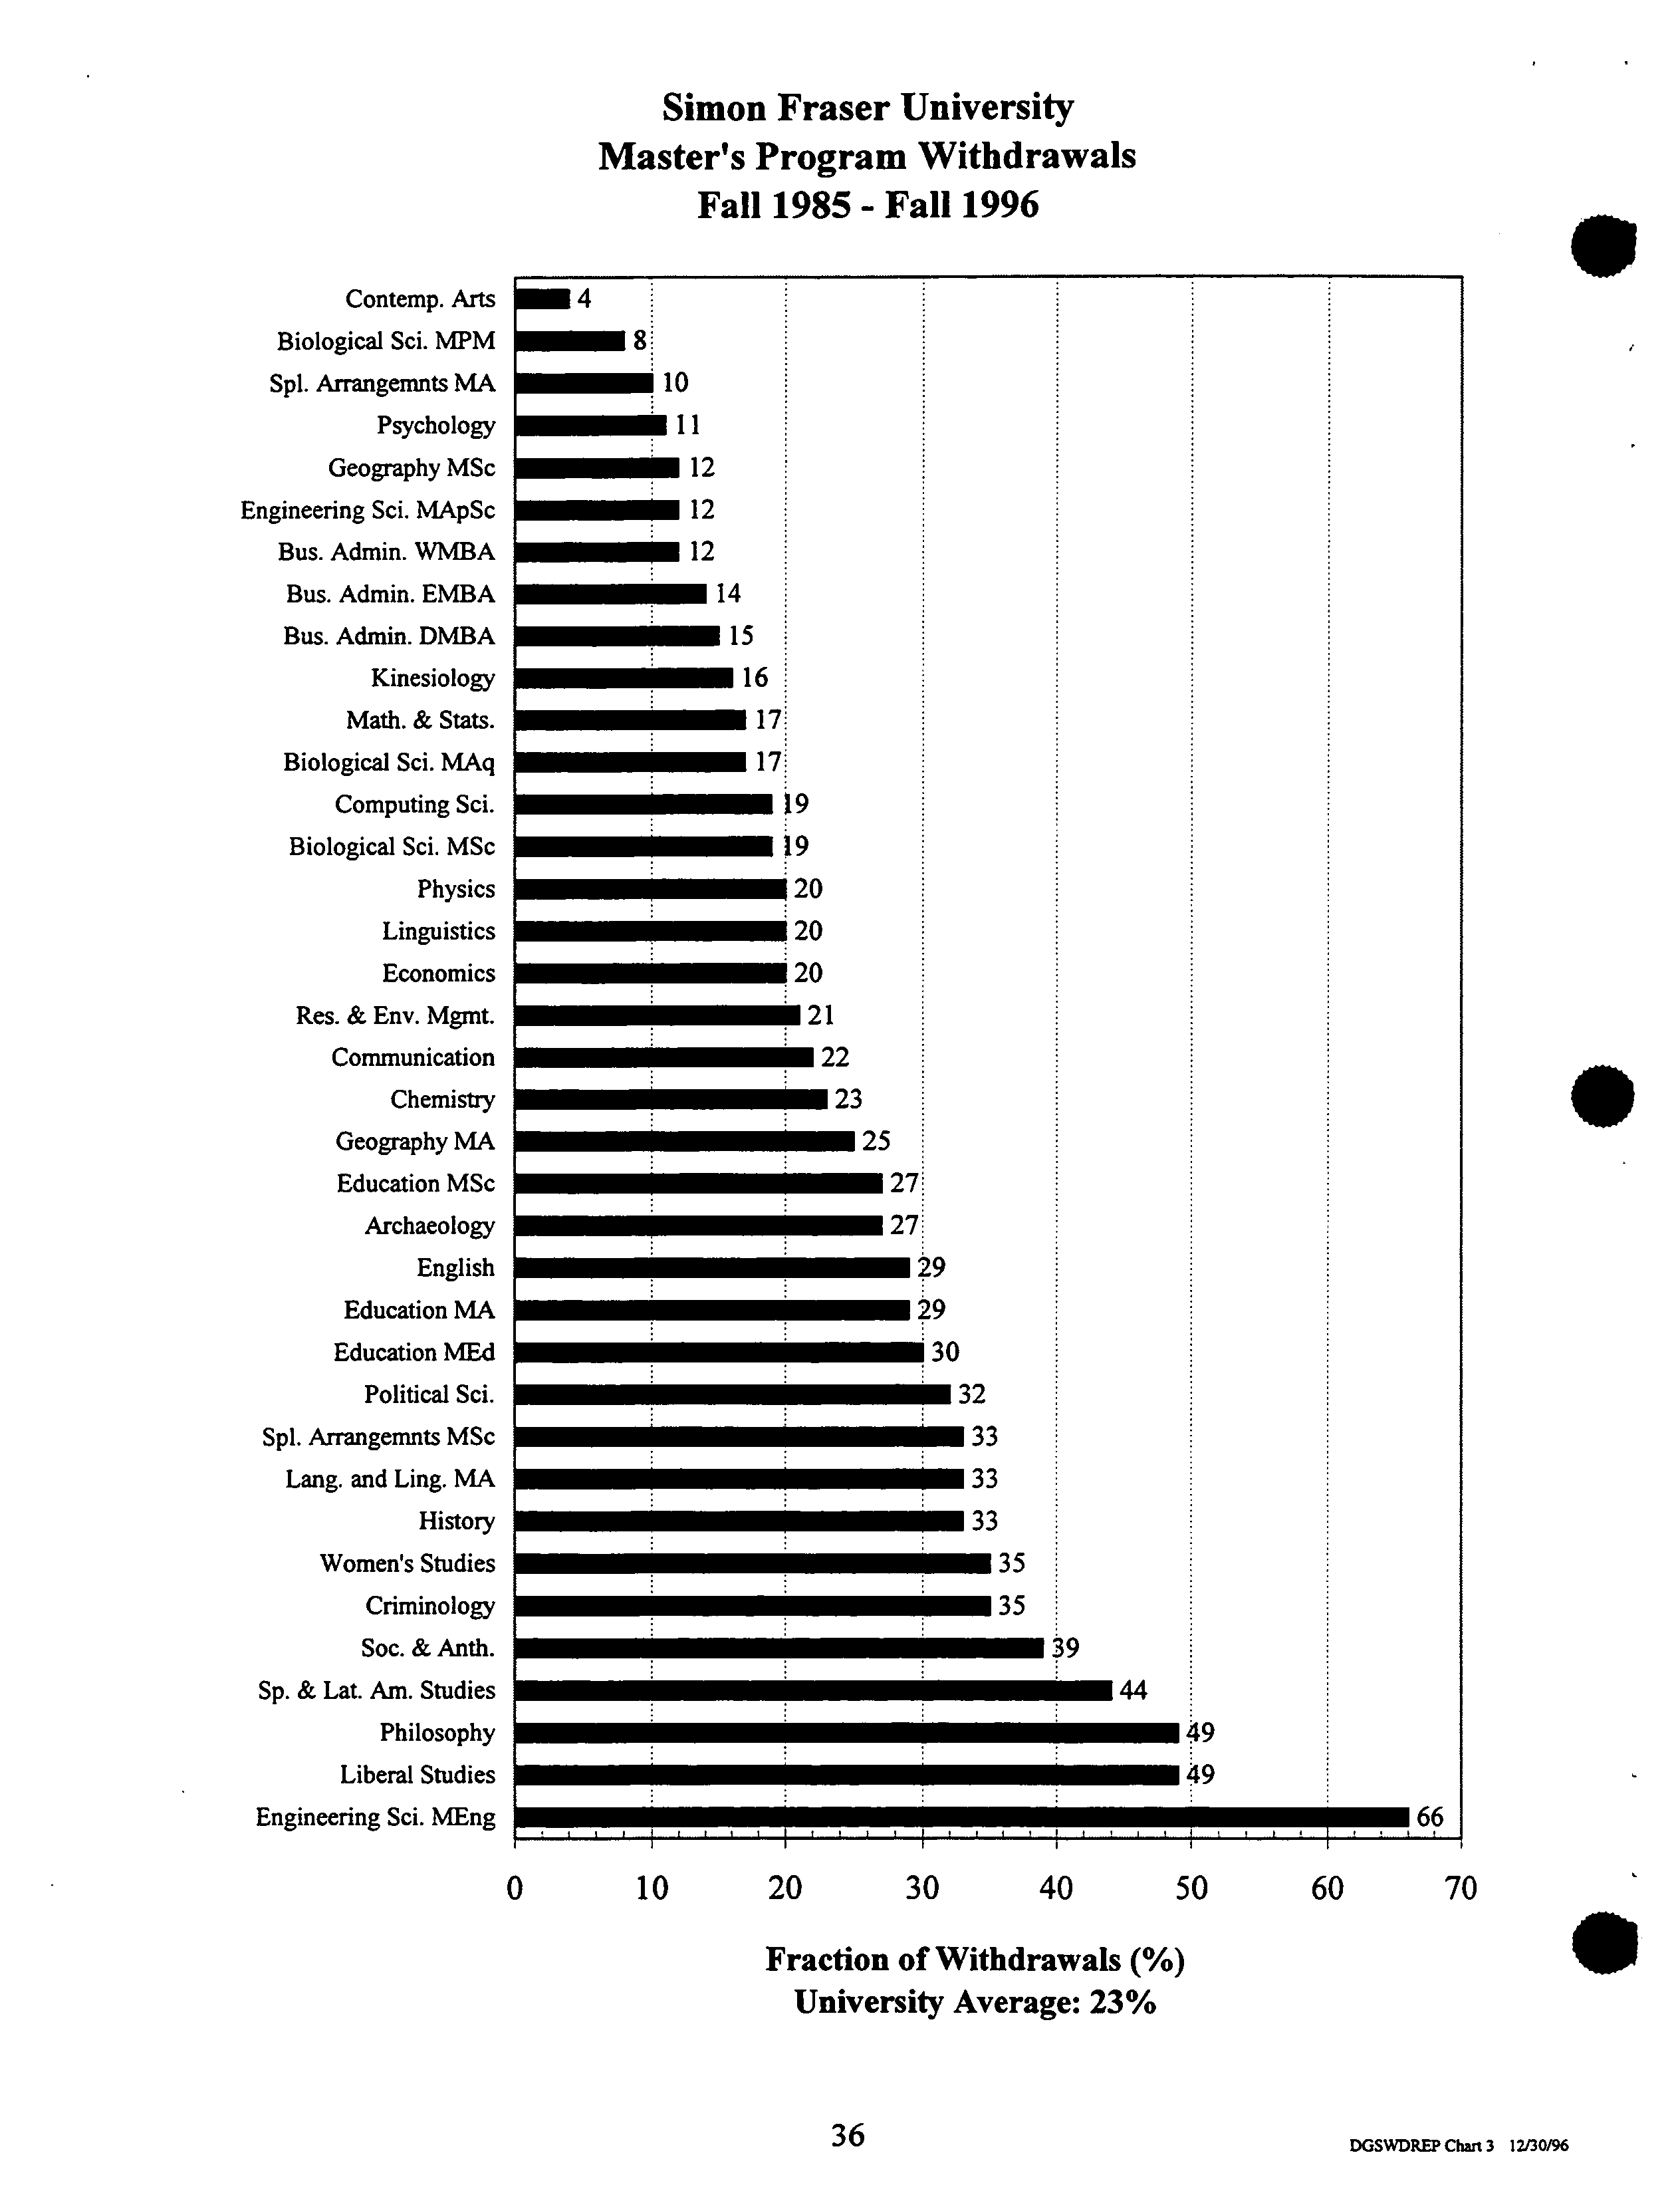
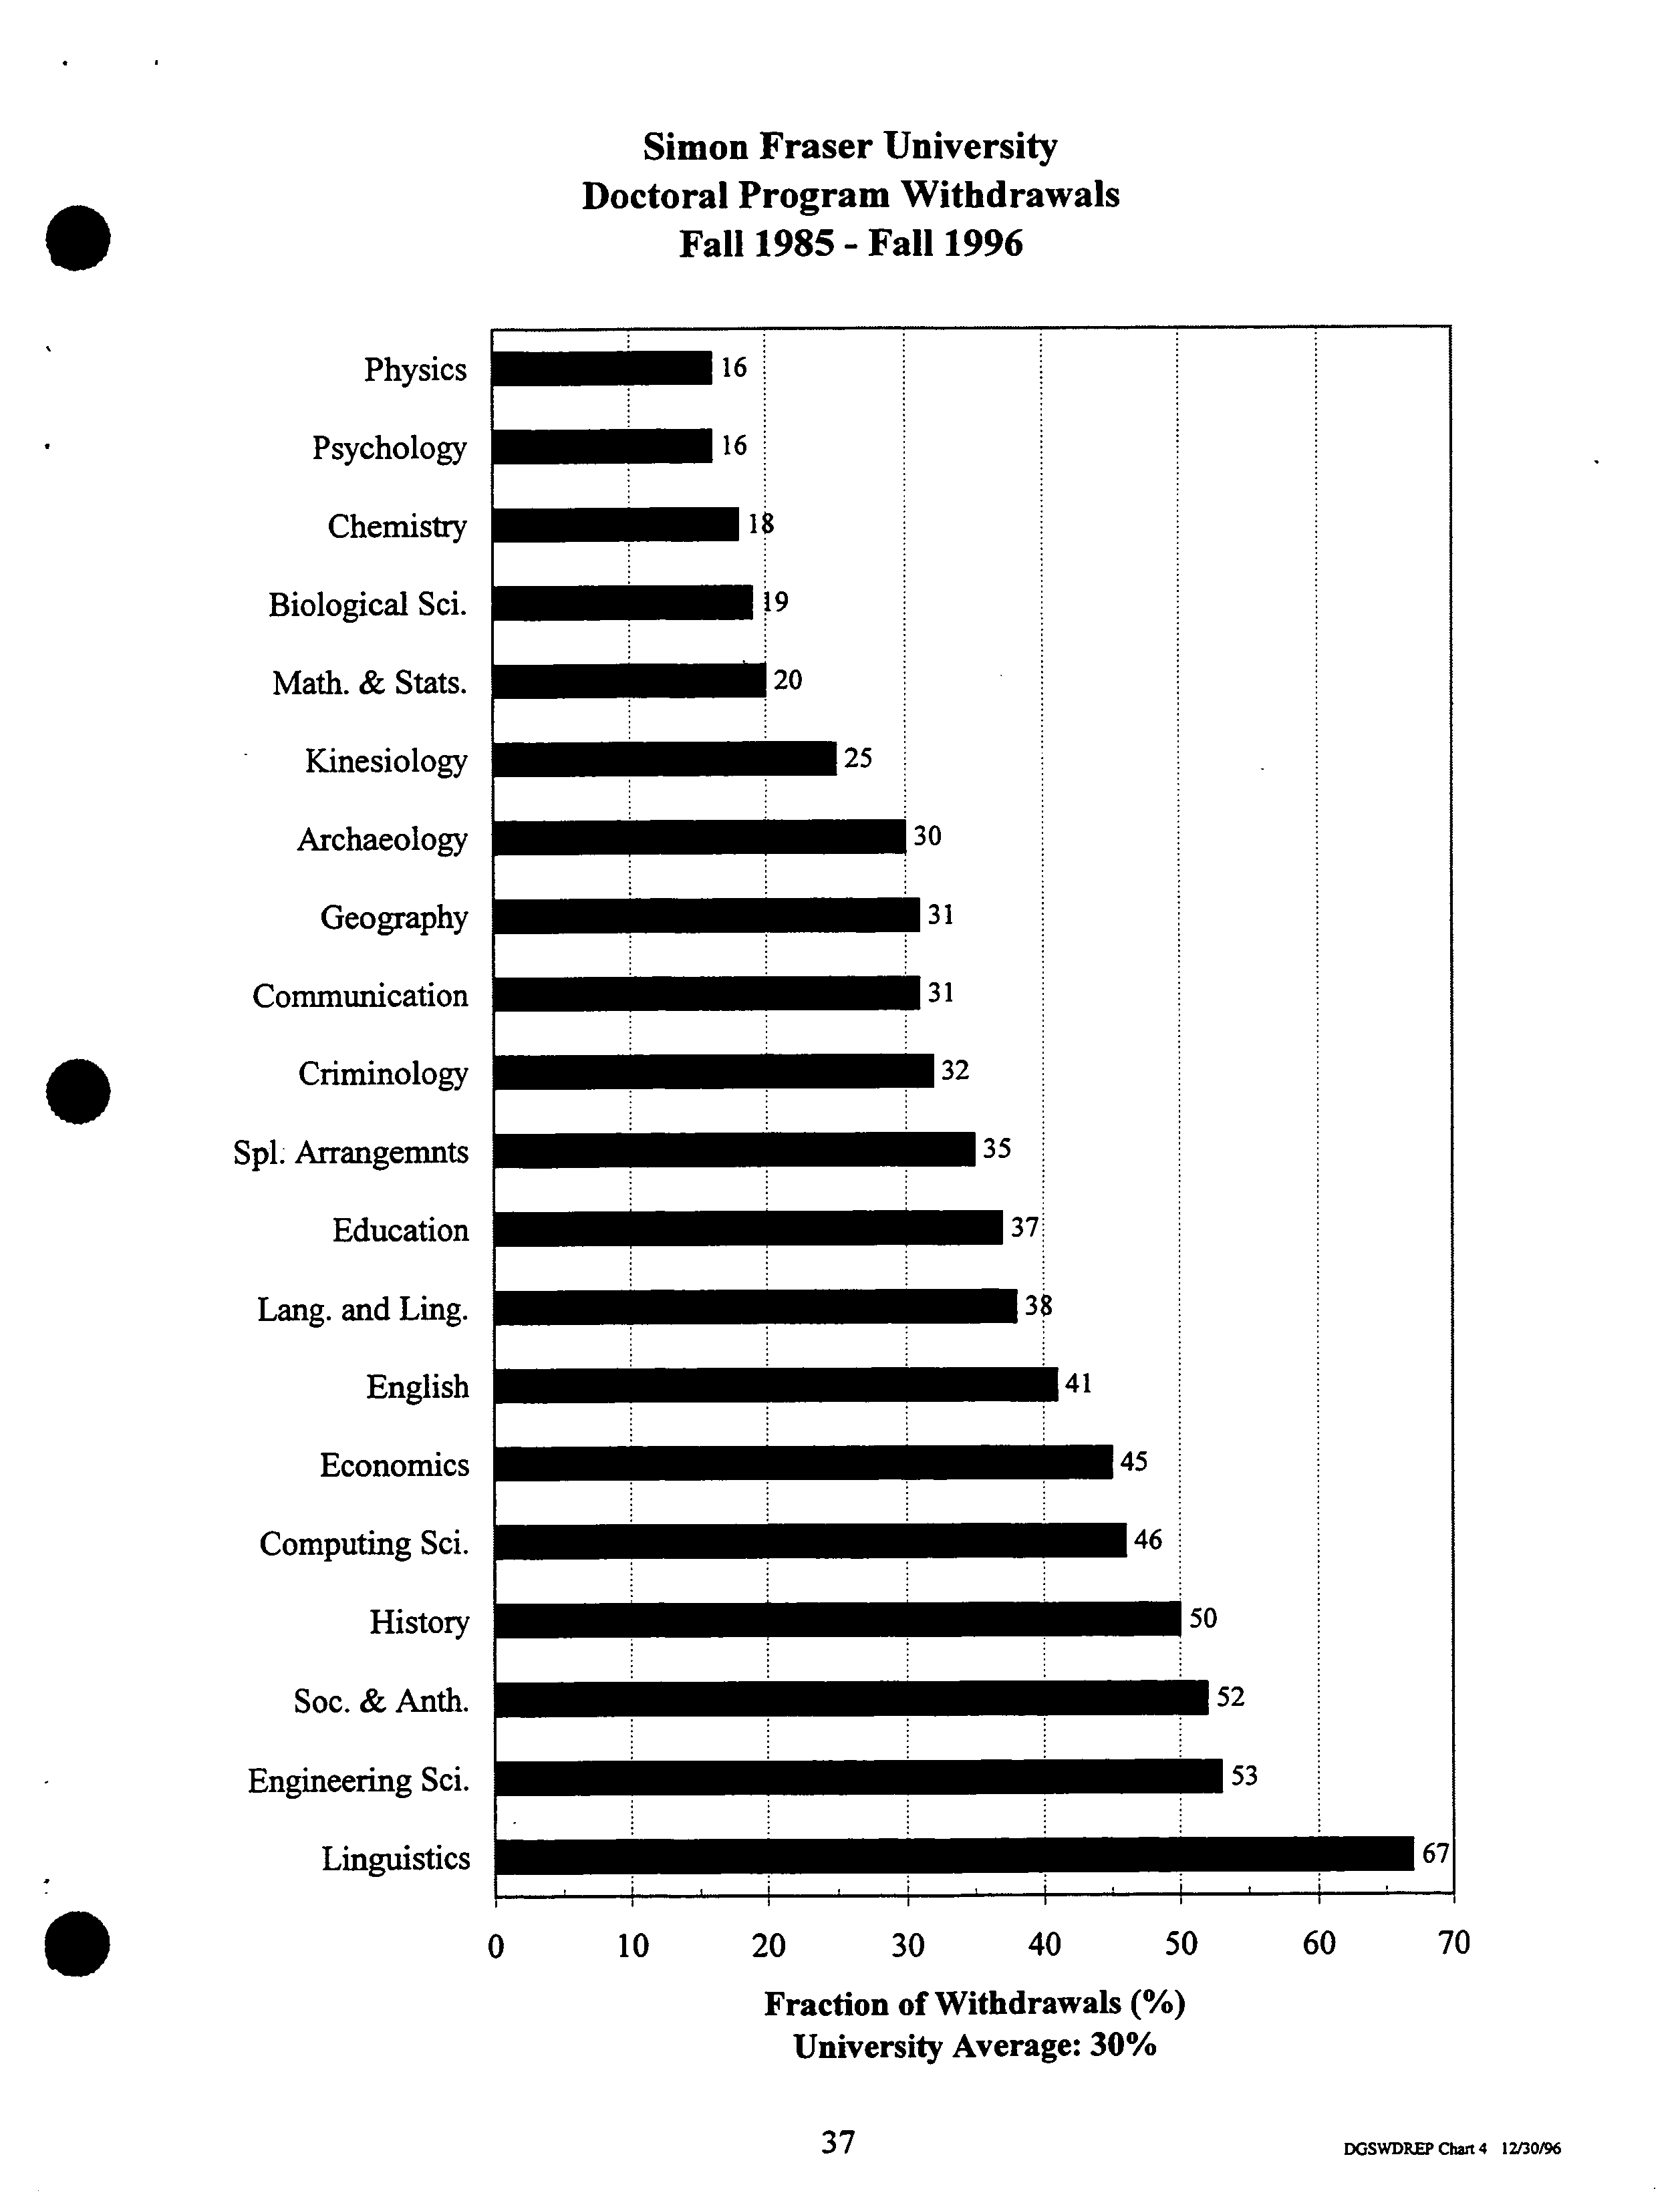
Withdrawal rates are also presented in the Graduate Studies Fact Book. There are tremendous
variations in rates between programs. The overall rates for the University as a whole are in line
with the results of similar studies performed in the U.S. and with a similar study performed by the
Canadian Association for Graduate Studies.
Nonetheless, I am very concerned about low completion rates in some of our graduate programs.
Withdrawal may be due to any one of or a combination of factors including: lack of ability, lack of
motivation, lack of financial resources, health problems, and deficiencies in the graduate programs
and/or their implementation. As of January 1, 1993, I have instituted an exit questionnaire to
gather information about many aspects of our graduate programs from students who successfully
complete their degrees and from those who withdraw. Because of the need for confidentiality, the
results are analyzed only statistically, once enough students respond; analysis of the second data-
set is now underway, as is data obtained from similar questionnaires sent to students who
withdrew from their programs without completing the degree. Unfortunately, return rates from
students who withdrew are very low. Delivery methods other than mail are being explored.
Another serious concern is the 'climate' that graduate students experience at SFU. To learn more
and to attempt to identify the most pressing problems, I am instituting a major study. This was
1997 S.G.S.C. Report to Senate ?
. Page 3 of 8
based in part on the study recently completed at UBC. A task force, under the leadership of Dr.
Ellen Gee, with representation from the SFSS/GIC and TSSU, has been working on the survey
and a report should be complete by the time this report is presented to Senate.
M. Grades
The Graduate Studies Fact Book gives information on the S.F.U. graduate grades of the end of
the Summer 1996 semester; it excludes students who had not yet taken an S.F.U. graduate
course. Data were taken from the Registrar's data files and incorporated into and processed
within the Graduate Studies Database system.
There is a tremendous range in the grade distributions among departments that may stem from
two causes: (1) differences in grading practices and (2) differences in the abilities of students. I
believe that, most likely, it is a mixture of these with the former a larger contributor than the
latter. This range is one of the reasons that I moved away from interdepartmental comparisons of
- - CGPA in the ranking of applicants for S.F.U. graduate scholarships.
1V. Special Arrangements
The Senate Graduate Studies Committee serves as the Graduate Program Committee of students
enrolled under Special Arrangements. Special Arrangements provide opportunities for students
who are 'exceptionally able' to pursue graduate programs of their own design, outside the
existing departmental boundaries. Dr. Martin and I have given special attention to these students.
With the goal of ensuring their satisfactory progress, we have brought all their supervisory
. ?
committees into compliance with Senate's regulations and require up-to-date progress reports as a
?
condition of registration. The response of students and supervisors has been excellent.
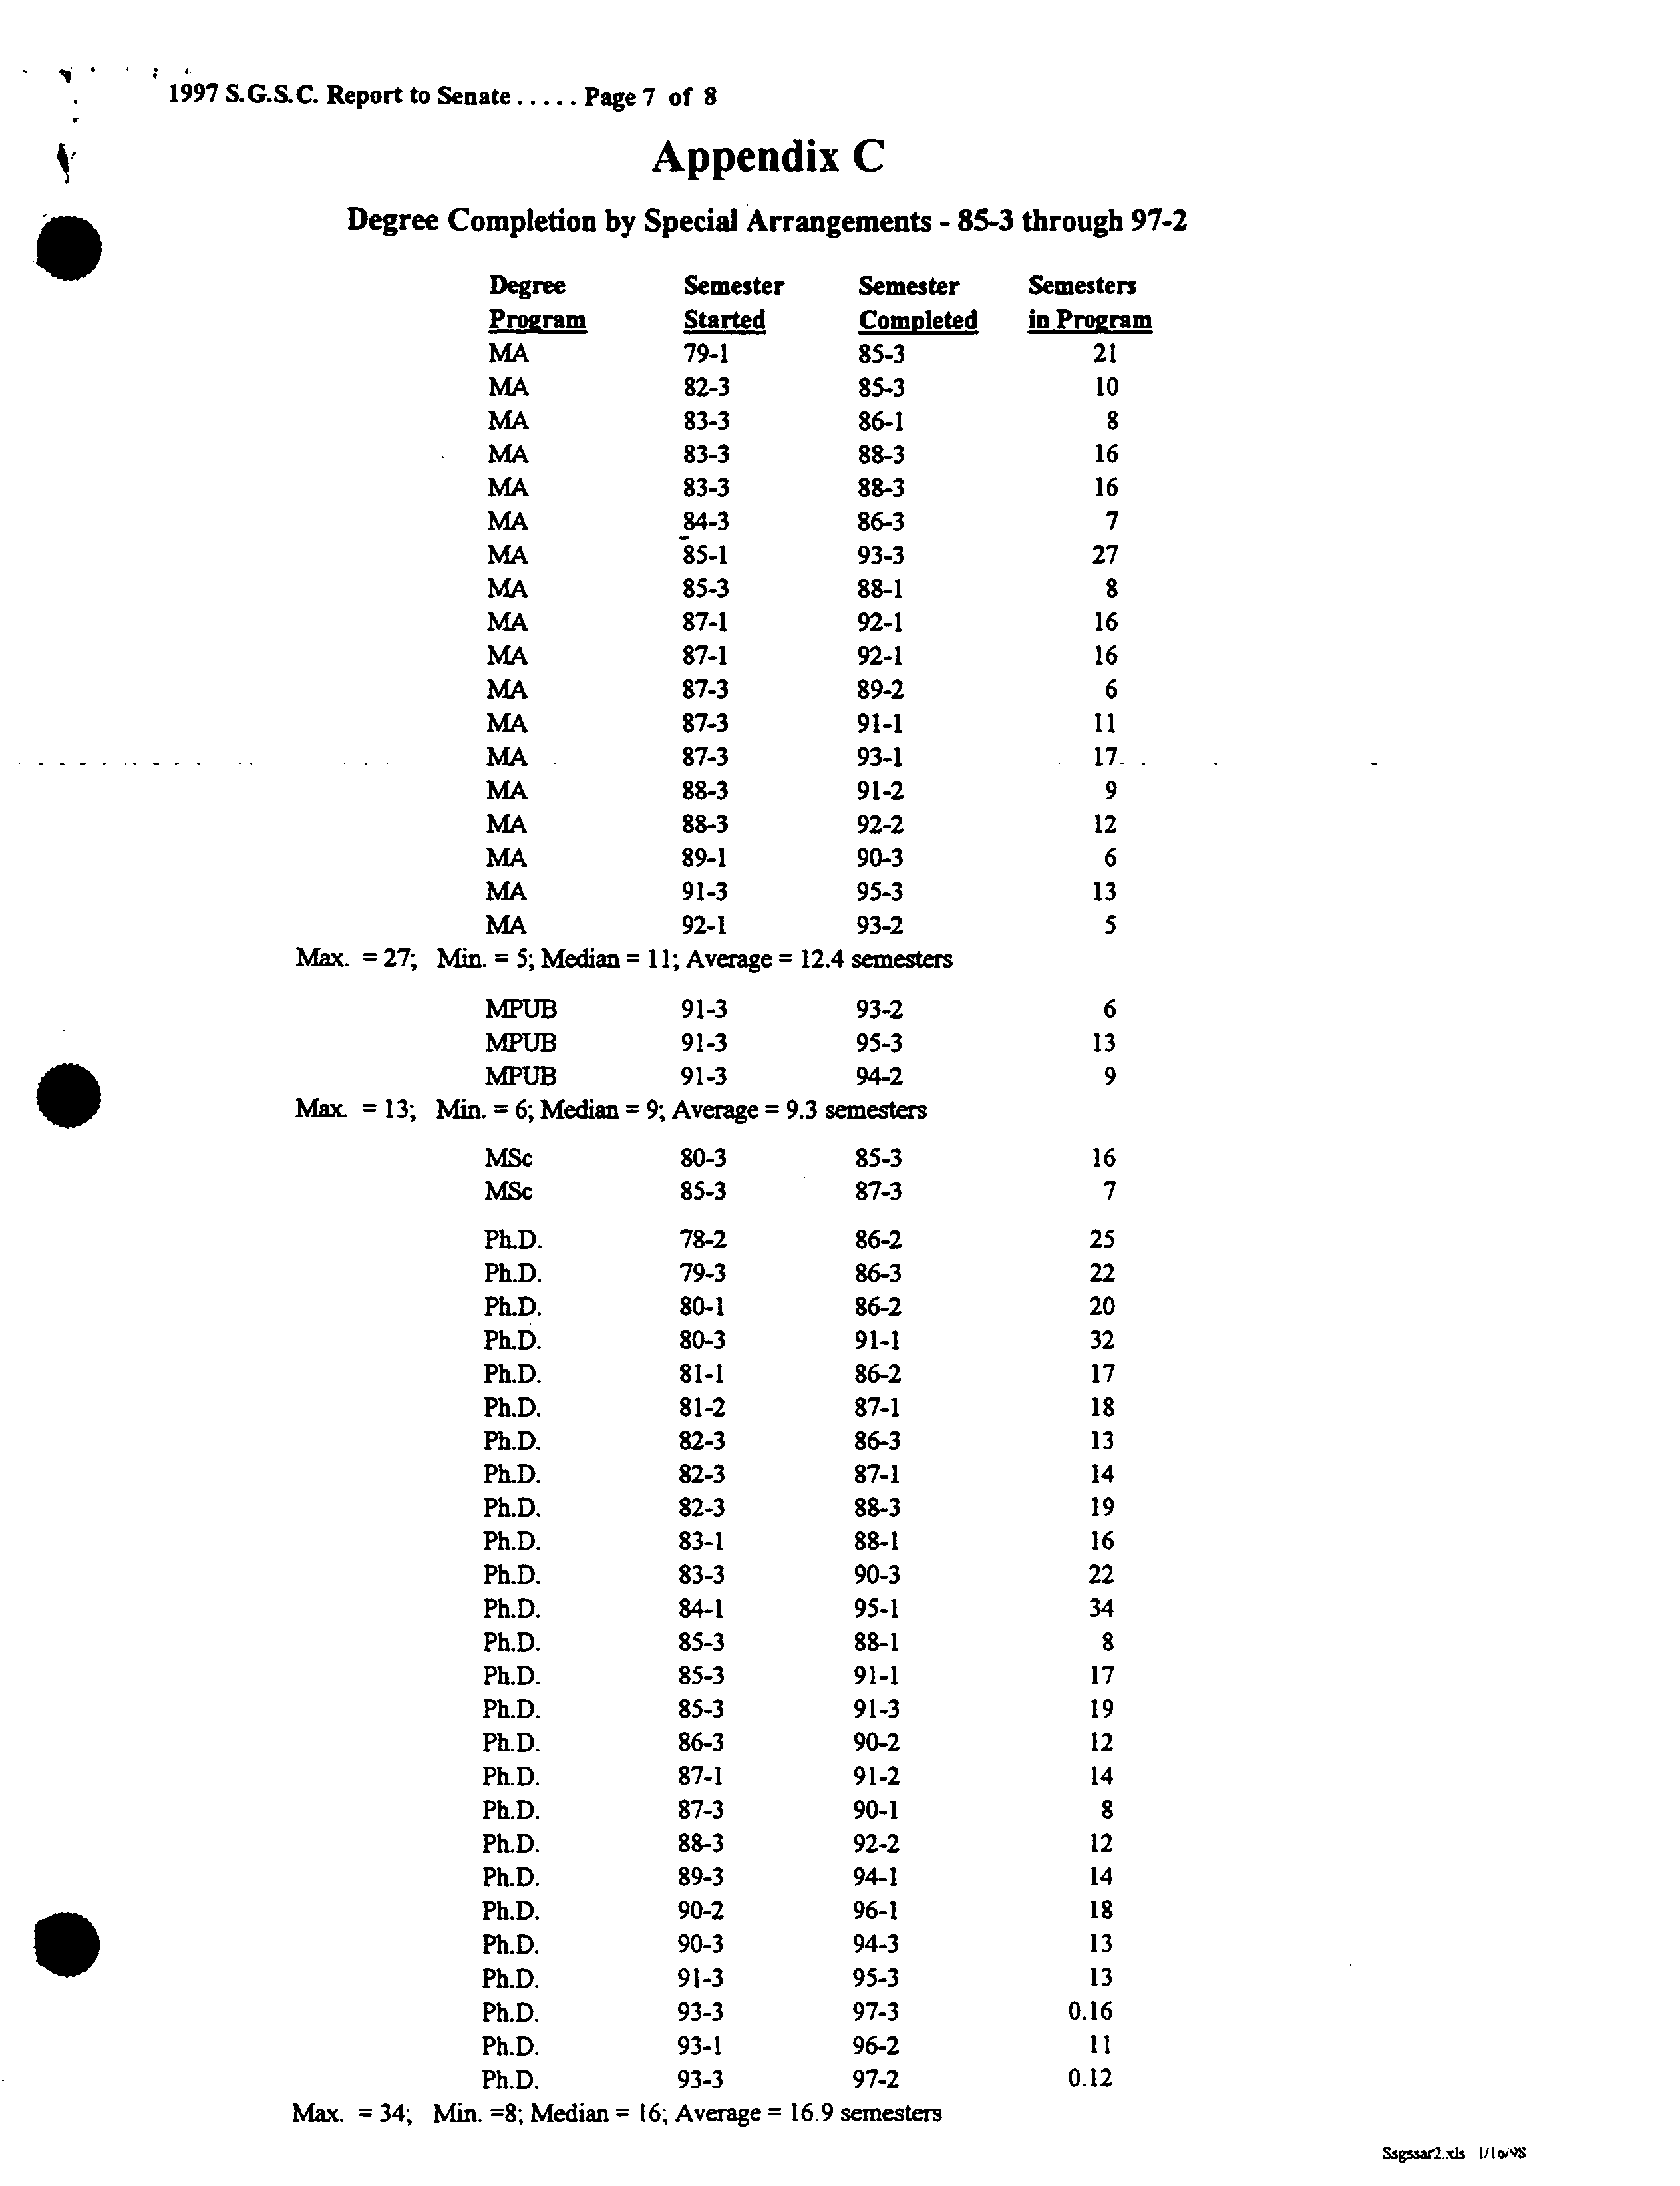
I am pleased to report that the defences of theses completed under Special Arrangements, which
Dr. Martin chairs, have all been quite successful. Historically, Special Arrangements has been a
high risk area; students either succeed or fail spectacularly. The number of students enrolled have
remained roughly constant around 20 - 30. Degree completion has been highly variable; see
Appendix C and the table below (degrees completed in each year):
1981 4 ?
1984 6 ?
1987 7 ?
1990 2 ?
1993 3 ?
1996 3
1982 2
?
1985 2 ?
1988 4
?
1991 6 ?
1994 3 ?
1997 2
1983 1 ?
1986 6 ?
1989 3
?
1992 4 ?
1995 2
Some other students have dropped out and others encountered health problems. By the steps
outlined above and by continued rigorous adherence to the criteria for entrance into Special
Arrangements, we hope to improve the success rate. We have also moved to an annual admission
cycle and have decided to reject incomplete applications in an effort to reduce the very heavy
workload presented by these applications.
V. Administration
In September 1993, a graduate application fee was introduced. The fee is currently $55.
Revenues are directed to General University Revenues and to- my- office in- the proportion of
30:70. Most of the funds directed to my office are transferred to departments to assist in meeting
the costs of recruiting, processing of the applications, and student travel for research and
9 ?
conference attendance.
1997 S.G.S.C. Report to Senate
?
. Page 4 of 8
In view of current and anticipated financial difficulties, it will be essential to make the most
effective use of our limited resources. To this end, I have instituted a review of administrative
procedures, in both the academic and scholarships areas, with the goal of eliminating approvals
and other administrative actions that may had been of value at one point in the history of the-
university, but are no longer necessary. Examples may be the approval of examining committees
by Faculty Graduate Studies Committees and the provision of official transcripts with all
applications for scholarships. It has been necessary to reduce the number of in-person
examinations of doctoral theses by making
in absentia
examination the preferred option..
VI.
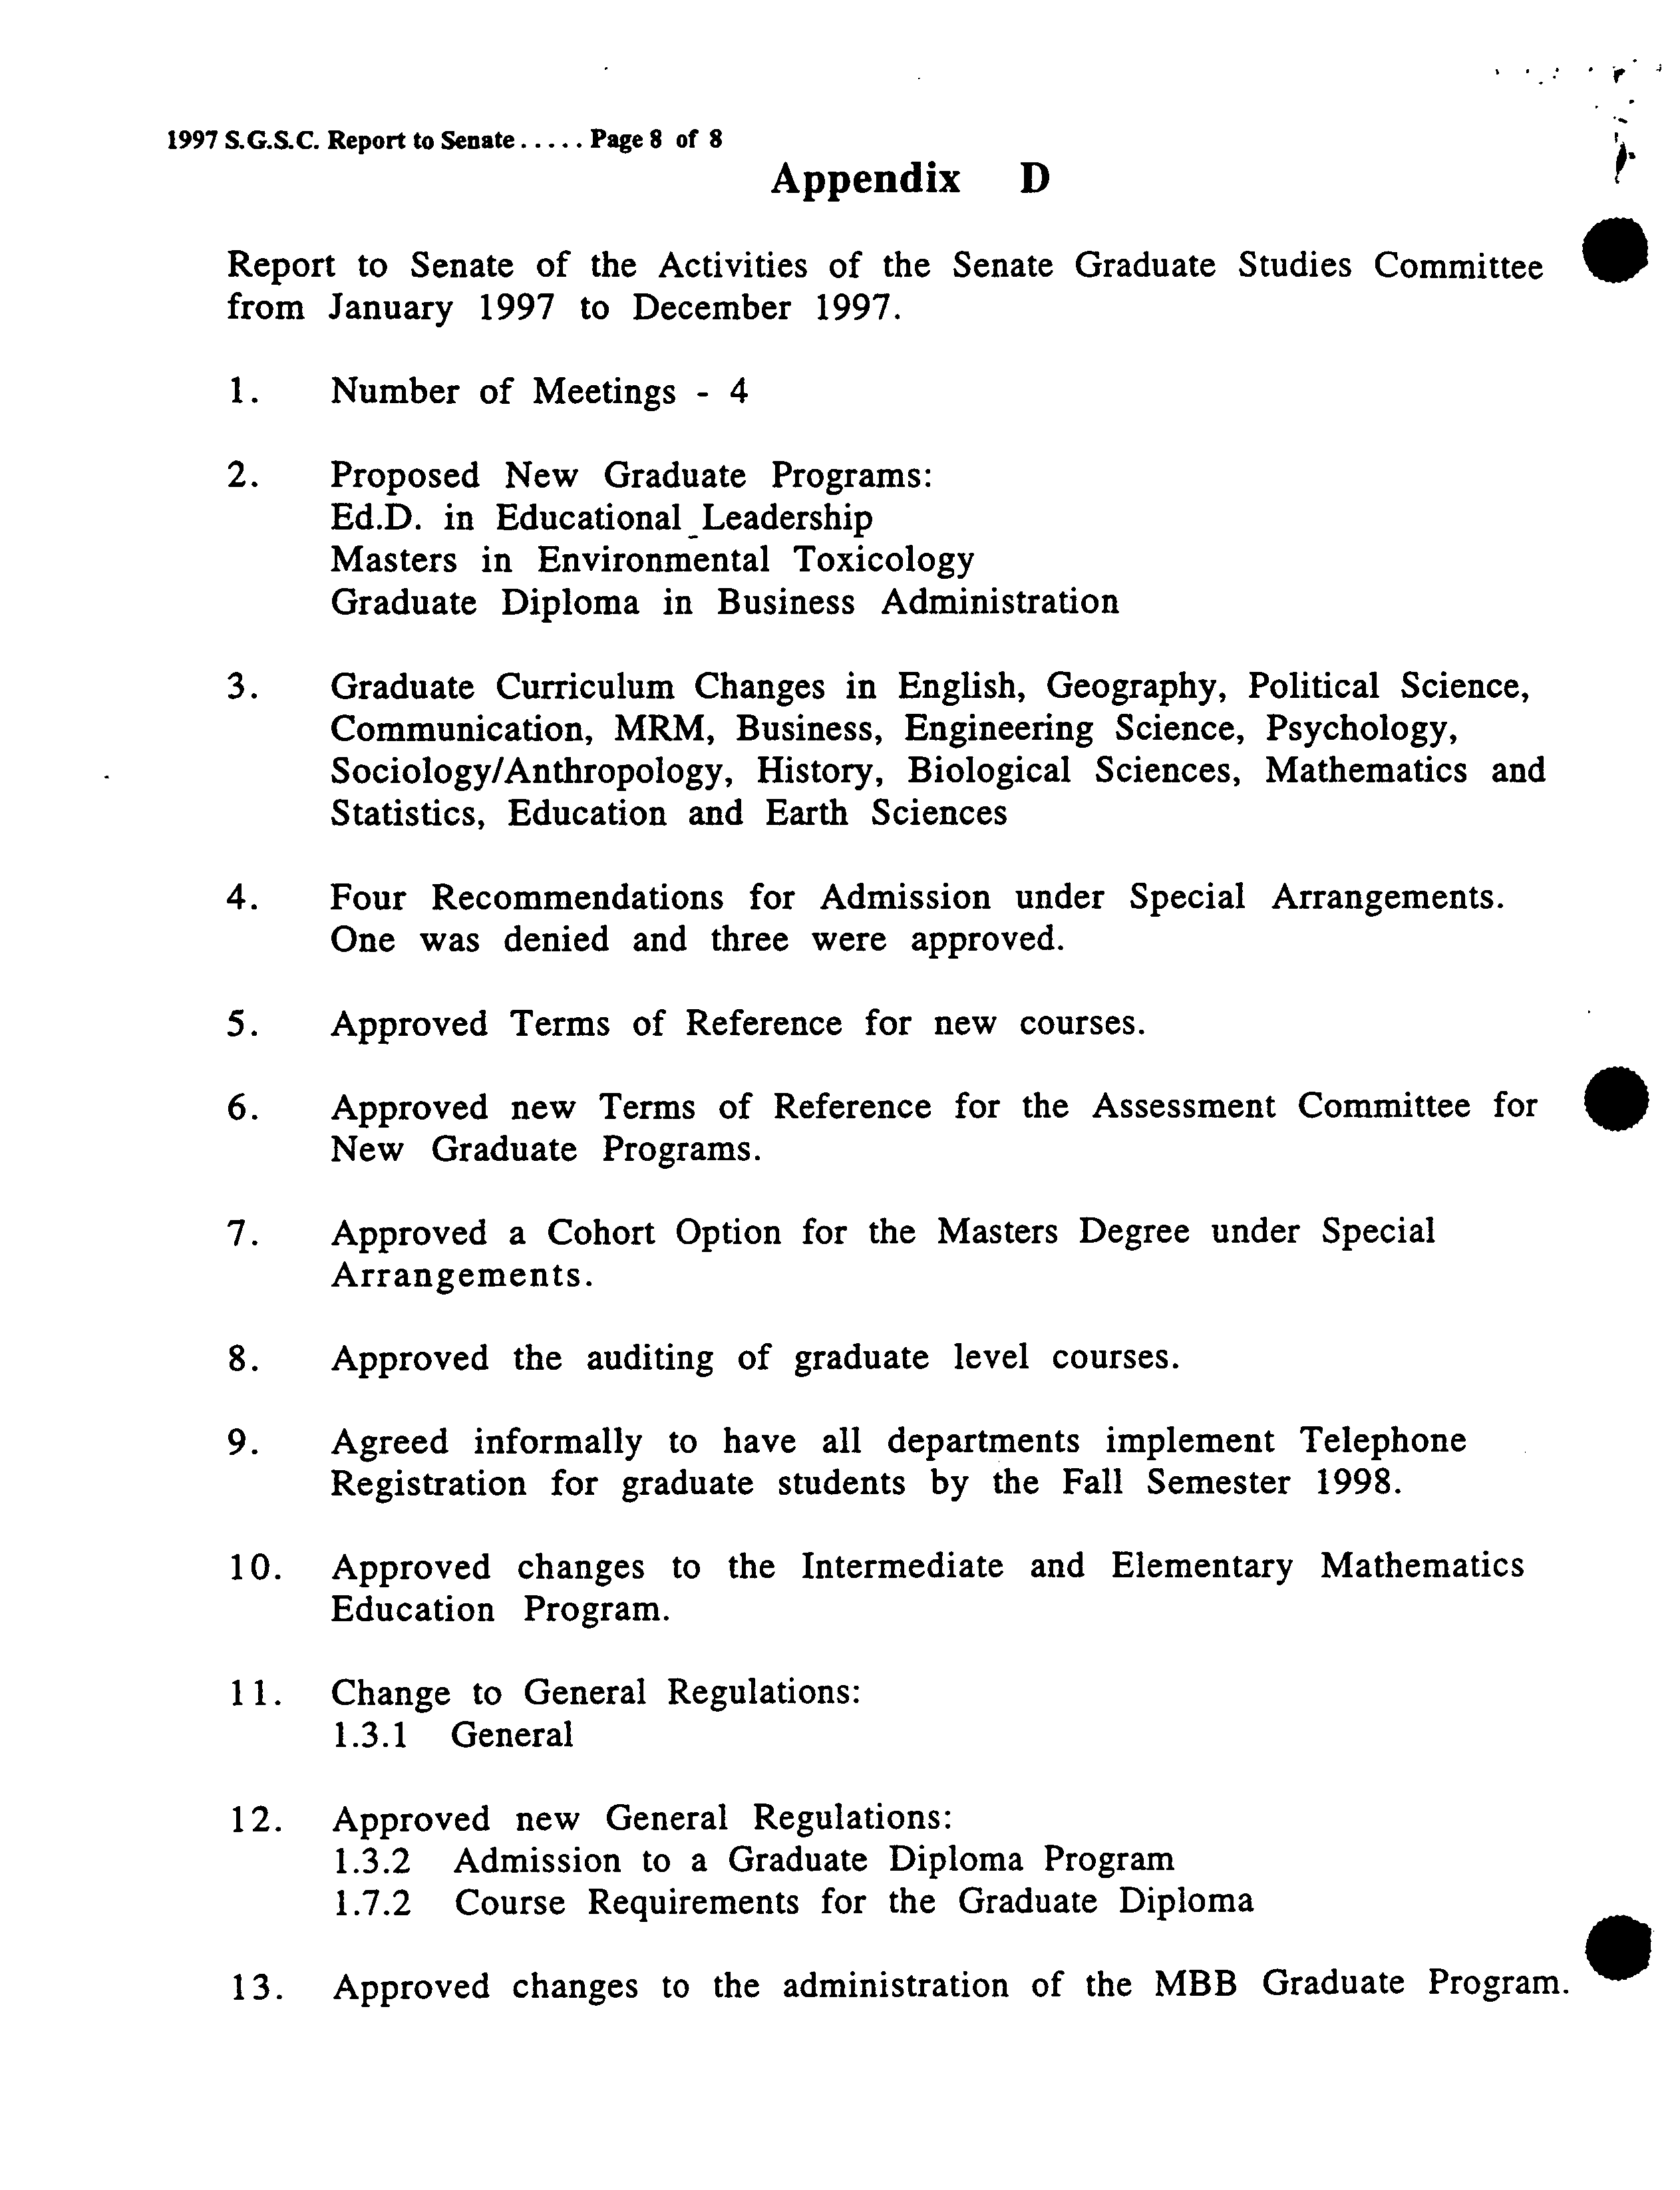
S.G.S.C. Motions
A summary of the motions passed by the S.G.S.C. in 1997, prepared by the Office of the
Registrar, is presented in Appendix
D.
VII.
The Future
I remain cautiously optimistic about the future of graduate studies at SFU. Over the last several
years, we introduced a number of new programs which are in the process of implementation.
Other exciting new program initiatives are presently in the planning/approval process. It will be
essential to ensure that sufficient resources are allocated to support present and future programs,
while maintaining high quality. New programs should be mounted only if there is demonstrated
demand and adequate resources provided; this may imply the discontinuation of other, less
successful programs. The current three-year planning process should be helpful in determining
the priorities that should be assigned by departments and by the University to our graduate
programs.
The introduction of a Provincial Degree Approval Process has delayed implementation of some of
the new programs. It is hoped that the thorough review that they undergo in our own assessment
process will improve their chances of success at the Provincial level.
The quality of most of our existing programs is high, as is the quality of most of the thesis
defences which I have attended. With rare exception, applicants recommended by departments
for entry into Ph.D. programs have been very strong. Through aggressive recruiting of excellent
applicants with the aid of entrance scholarships, rigorous enforcement of the requirements for
satisfactory progress, improved financial aid and careful monitoring of student supervision, it
should be possible to improve further the quality of our graduate programs, reduce withdrawal
rates and decrease degree completion times.
B.P. Clayman
Dean of Graduate Studies
IF-
L
1
1997 S.G.S.C. Report to Senate ?
. Page 5 of $
Appendix
A
.
Annualized
Graduate Enrolments
for Fiscal
Years:
85/86 ?
86/87
87/88 ?
88/89
89/90 ?
90/91 ?
91/92 ?
92/93 ?
93/94 ?
94/95 ?
95/96 ?
96/97
97/98*
Head Count ?
1,377 ?
1,366
1,426 ?
1,444
1,486 ?
1,623 ?
1,864 ?
2,008 ?
2,071 ?
2,128 ?
2,225 ?
2,282 ?
2,294
FTE ?
1,125 ?
1,084 1,147 ?
1,169
1,256 ?
1,404 ?
1,594
?
1,720
?
1,779 ?
1,844 ?
1,914 ?
1,972 ?
2,005
-
L, . UV
2,000?
1,500
?
1,000 ?
500
A
00
o
—
N
00 ?
.-
00 ??
-.
00
00 ?
O\
O
S.-
00
N
00 ?
00 ?
00
00
00 ?
00
0
?
—
?
N
'0
N
.
0\
(projected)
Degrees Awarded in Fiscal Years:
85/86 86/87 87/88 88/89 89/90 90/91 91/92 92/93 93/94 94/95
95/96 96/97 2212
Master's
?
279 214
?
213 ?
253 ?
245 ?
219 285 ?
315 ?
308 425
?
444 466 477
Doctoral ?
39
?
42 ?
50 ?
45 ?
50 ?
49 ?
64
?
66
?
66 ?
78 ?
88 ?
92 ?
73
500 ?
400?
300?
200?
100 ?
0
0410 mliw
0
qm
I
'0
N 00 0
?
0 — N
?
'0
N 00
. ? 00
?
00 ?
00
?
00
?
ON
??
C'
ON
?
C'
?
ON ?
C'
?
C" ?
C'
?
C'
WI
?
'0 ?
N
00
?
C' ?
0 ?
— ?
NIT ?
'0 ?
N
00
?
00 ?
00
?
00 ?
00
?
ON
?
ON ?
ON ?
0'
?
C' ?
C' ?
C' ?
0'
Sgcrep5.xIs I/Ia/US
'V
1997 S.G.S.C. Report to Senate
?
. Page 6 of 8
Appendix B
?
S
Programs approved for part-time study, as of December 1997:
Archaeology (M.A., Ph.D.)
Biological Sciences (MPM)
Business Administration (Exec MBA)
Communication (M.A., Ph.D.)
Economics (M.A., Ph.D.)
Education (M.A., M.Sc., M.Ed.)
Engineering Science (M.Eng.)
English (M.A., Ph.D.)
French (M.A.)
History (M.A., Ph.D.)
Liberal Studies (M.A.)
Mathematics and Statistics (M.Sc., Ph.D.)
Political Science (M.A.)
Physics (M.Sc., Ph.D.)
Publishing (M.PubI)
Resource and Environment Management (REM)
Latin American Studies (M.A.)
Special Arrangements (M.A., Ph.D.)
Women's Studies (M.A.)
[1
is
1997
S.G.S.C. Report
to Senate ?
.
Page
7
of
S
Appendix
C
S
Degree
Completion by Special Arrangements - 85
..
3 through 97-2
Degree
?
Semester
?
Semester
Semesters
program
?
Started ?
Completed
in Pro2ram
MA ?
79-1 ?
85-3
21
MA ?
82-3 ?
85-3
10
MA ?
83-3 ?
86-1
8
MA ?
83-3
?
88-3
16
MA
?
83-3 ?
88-3
16
MA
?
84-3 ?
86-3
7
MA
?
85-1 ?
93-3
27
MA
?
85-3 ?
88-1
8
MA ?
87-1 ?
92-1
16
MA ?
87-1 ?
92-1
16
MA ?
87-3 ?
89-2
6
MA ?
87-3 ?
91-1
11
MA ?
87-3 ?
93-1
17
MA ?
88-3 ?
91-2
9
MA
?
88-3 ?
92-2
12
MA ?
89-1 ?
90-3
6
MA
?
91-3 ?
95-3
13
MA ?
92-1 ?
93-2
5
Max. = 27; Mm. = 5; Median = 11; Average = 12.4 semesters
MPUB ?
91-3 ?
93-2
6
MPTJB ?
91-3 ?
95-3
13
MPUB ?
91-3
?
94-2
9
S
Max. = 13; Mm.
= 6; Median ?
9; Average = 9.3 semesters
MSc ?
80-3 ?
85-3
16
MSc ?
85-3 ?
87-3
7
Ph.D.
?
78-2 ?
86-2
25
Ph.D. ?
79-3
?
86-3
22
Ph.D. ?
80-1 ?
86-2
20
Ph.D. ?
80-3 ?
91-1
32
Ph.D. ?
81-1 ?
86-2
17
Ph.D. ?
81-2 ?
87-1
18
Ph.D. ?
82-3 ?
86-3
13
Ph.D. ?
82-3 ?
87-1
14
Ph.D. ?
82-3 ?
88-3
19
Ph.D. ?
83-1 ?
88-1
16
Ph.D. ?
83-3 ?
90-3
22
Ph.D. ?
84-1
?
95-1
34
Ph.D. ?
85-3
?
88-1
8
Ph.D. ?
85-3
?
91-1
17
Ph.D. ?
85-3
?
91-3
19
Ph.D. ?
86-3 ?
90-2
12
Ph.D. ?
87-1
?
91-2
14
Ph.D. ?
87-3 ?
90-1
8
Ph.D. ?
88-3 ?
92-2
12
Ph.D. ?
89-3
?
94-1
14
S
Ph.D. ?
90-2 ?
96-1
Ph.D. ?
90-3 ?
94-3
18
13
Ph.D. ?
91-3
?
95-3
13
Ph.D. ?
93-3 ?
97-3
0.16
Ph.D. ?
93-1 ?
96-2
11
Ph.D. ?
93-3 ?
97-2
0.12
Max. = 34; ?
Mm. ?
8; Median = 16; Average = 16.9 semesters
Ssgssar2xls I/Io,'S
1997 S.G.S.C. Report to Senate ?
. Page 8 of 8
Appendix D
Report to Senate of the Activities of the Senate Graduate Studies Committee
from January 1997 to December 1997.
1.
Number of Meetings - 4
2.
Proposed New Graduate Programs:
Ed.D. in Educational Leadership
Masters in Environmental Toxicology
Graduate Diploma in Business Administration
3.
Graduate Curriculum Changes in English, Geography, Political Science,
Communication, MRM, Business, Engineering Science, Psychology,
Sociology/Anthropology, History, Biological Sciences, Mathematics and
Statistics, Education and Earth Sciences
4.
Four Recommendations for
Admission under Special Arrangements.
One was denied and three were approved.
5.
Approved Terms of Reference for new courses.
6.
Approved new Terms of Reference for the Assessment Committee for
New Graduate Programs.
7.
Approved a Cohort Option for the Masters Degree under Special
Arrangements.
8.
Approved the auditing of graduate level courses.
9.
Agreed informally to have all departments implement Telephone
Registration for graduate students by the Fall Semester 1998.
10.
Approved changes to the Intermediate and Elementary Mathematics
Education Program.
11.
Change to General Regulations:
1.3.1 General
12.
Approved new General Regulations:
1.3.2 Admission to a Graduate Diploma Program
1.7.2 Course Requirements for the Graduate Diploma
13.
Approved changes to the administration of the
MBB
Graduate Program.
Simon Fraser University
.4 ?
Graduate Studies Fact Book
.
January 1997
Office of the Dean of Graduate Studies
?
Simon Fraser University ?
Burnaby, British Columbia V5A 1 S6
?
Canada
0 ?
Simon Fraser University
Graduate Studies Fact Book
1996
The Graduate Studies Fact Book provides a snap-shot of the graduate student population of
Simon Fraser University in the Fall Semester of 1996, as well as retrospective data based on
information gathered and processed in this office. It is largely complementary to the S.F.U.
Fact Book prepared by the Office of Analytical Studies. Minor differences in enrollment figures
exist between the two publications due to differences in data collection intervals. For the same
reason, the data should not be used for inter-year comparisons. Note also that the program in
Languages and Linguistics was separated into the Departments of French and Linguistics in
1994.
Each section is headed by a graphical summary. In some cases, the summaries omit programs
where the numbers reported are too small to be significant; the tabular data are complete.
It is hoped that this Fact Book will be a useful source of information for the campus commu-
nity and others. This office can provide additional more specialized reports, if these are re-
quired. Note also that the S.F.U. Fact Book is available at http://www.sfu.calanalytical-
studies/FactBook/factbook.html
and that additional information on Simon Fraser University is
http://www.sfu.ca
Information on graduate awards maybe found in the report of
the Senate Graduate Awards Adjudication Committee, which is included in the report to Sen-
ate of the Senate Committee on Scholarships, Awards and Bursaries.
Bruce P. Clayman
Dean of Graduate Studies
Room AQ6046
Phone: (604) 291-
4255
Fax: (604) 291- 3080
Internet: sfu-dgssfu.ca
NTRO.DOC 24-Jan-91
S
Simon Fraser University
Graduate Studies Fact Book
1996 ?
Contents
Enrollment
?
3
Grades ?
9
Citizenship ?
13
Age
?
18
Degree Completion Time
?
22
Degree Completion by Cohorts ?
28
Withdrawal Data ?
32
I L
' ,-
COn1S.DOC 9-Jan-91
Simon Fraser University
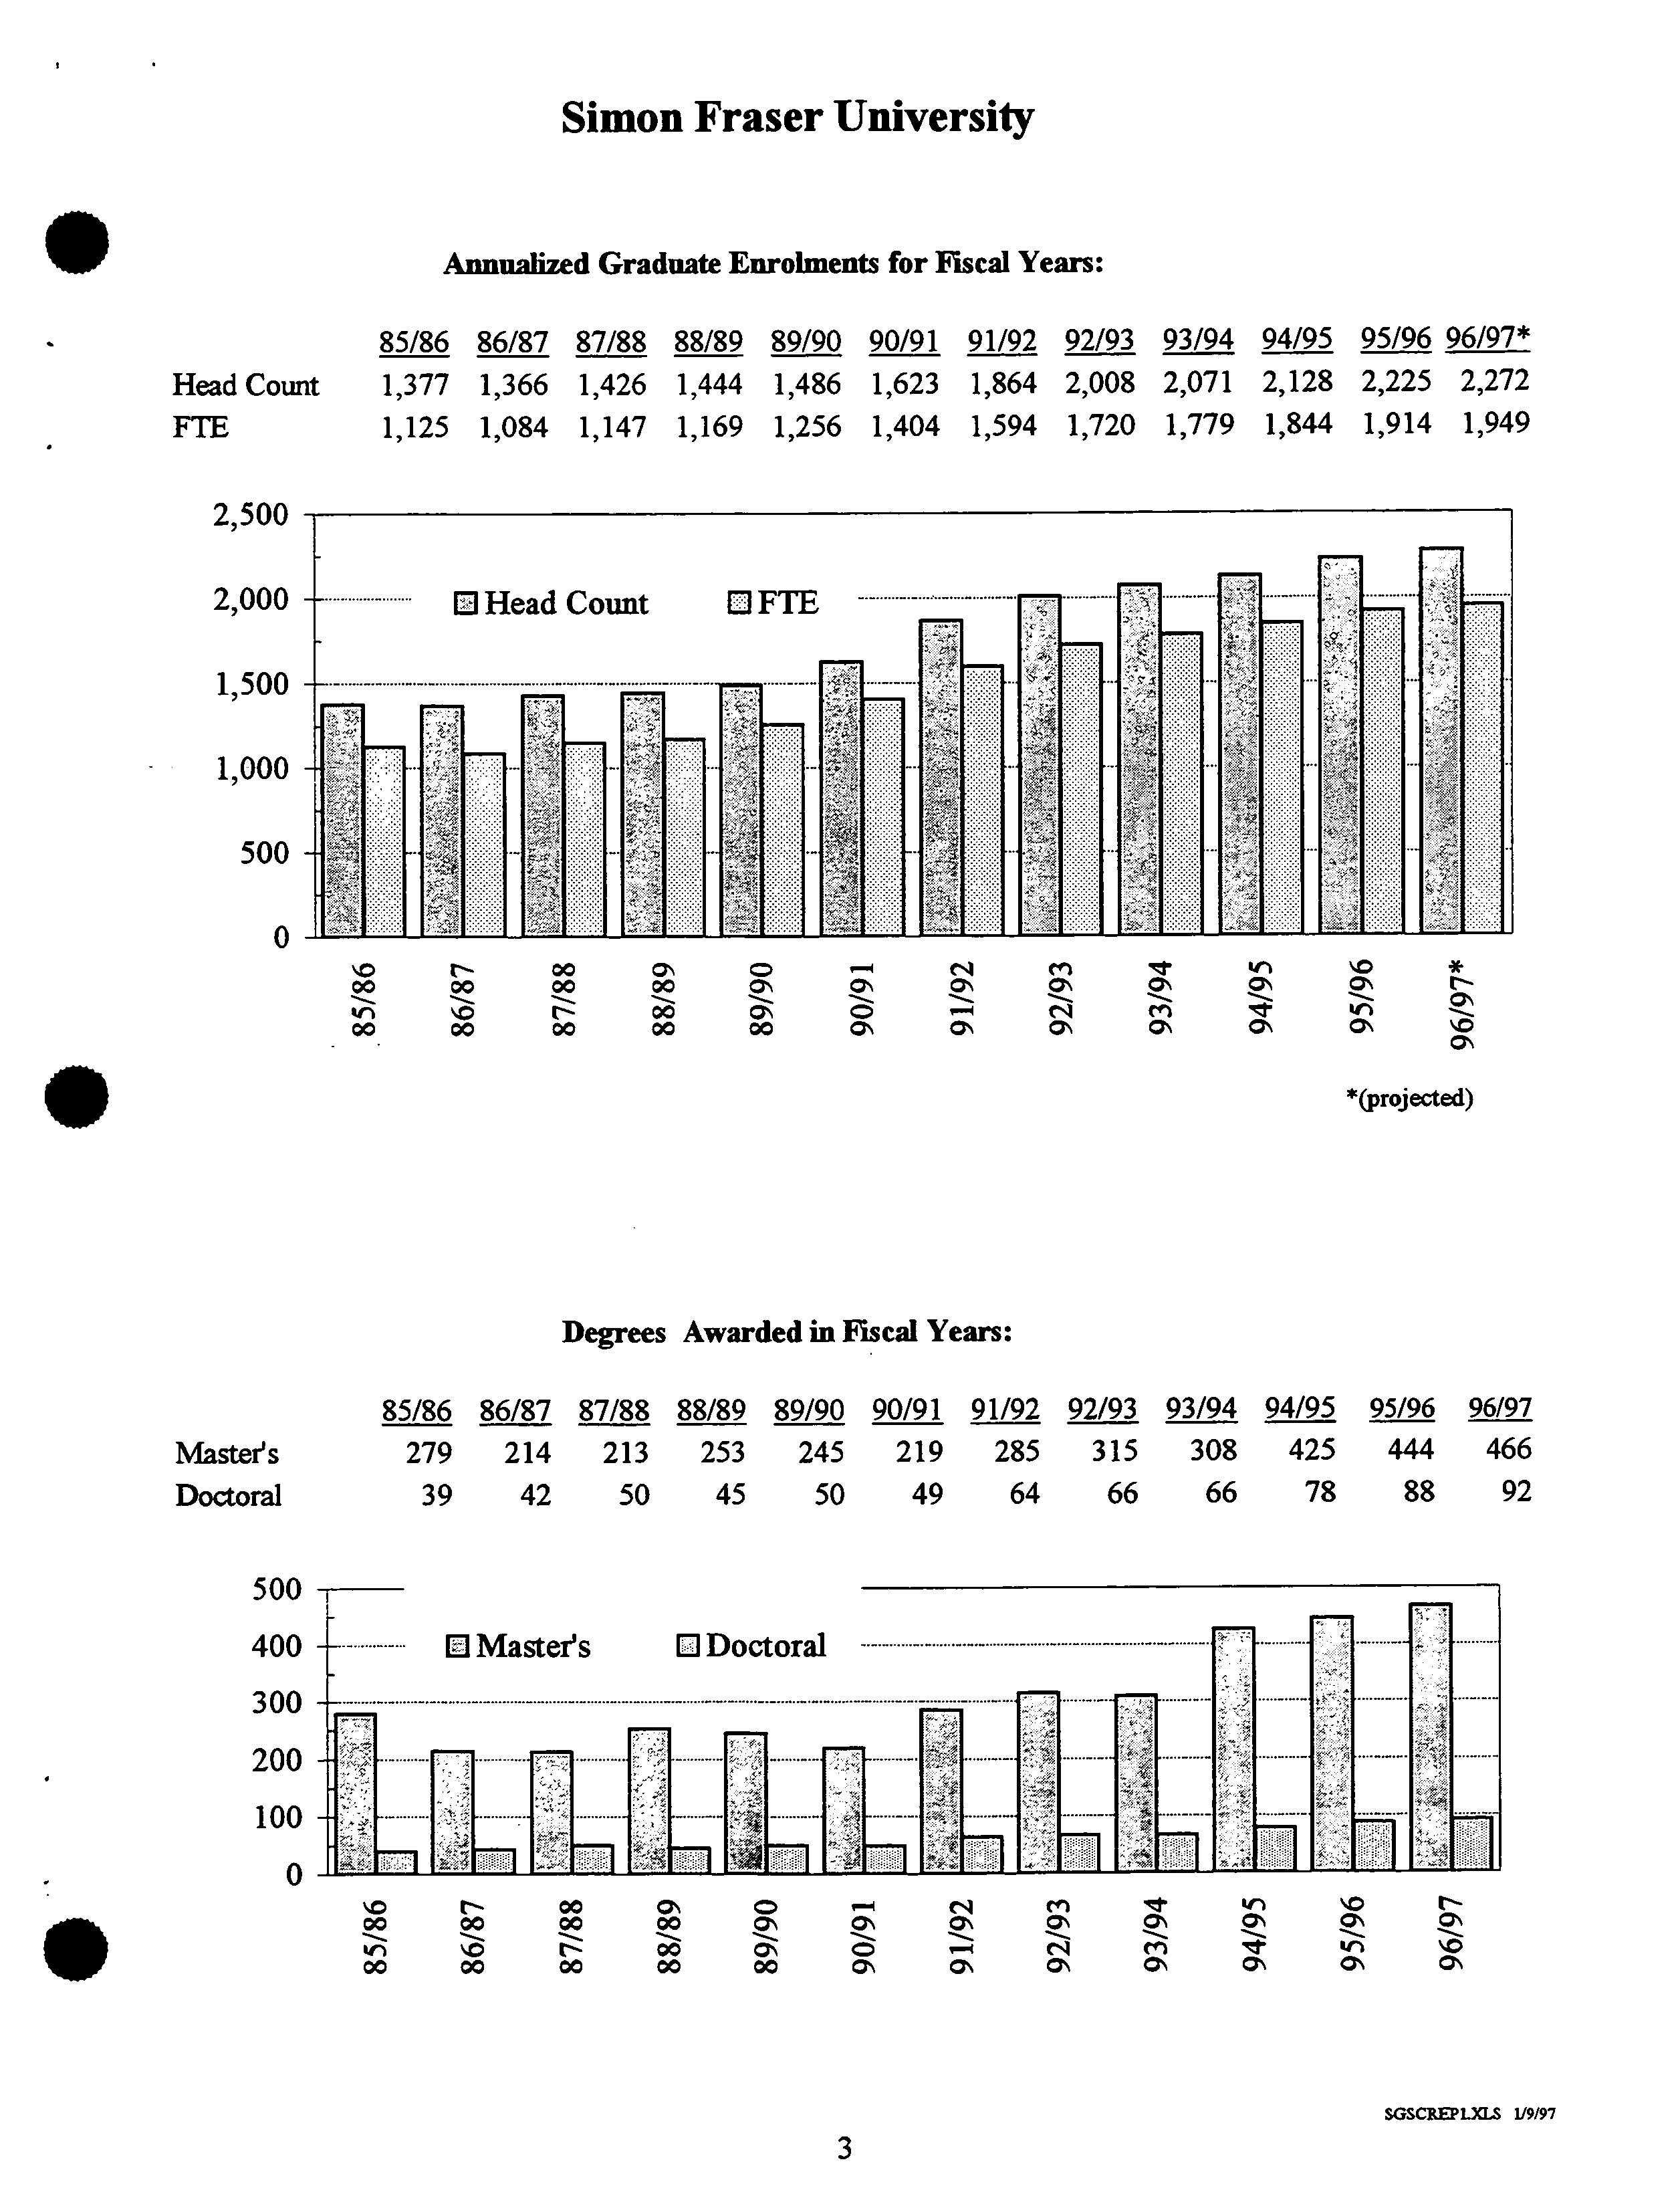
Annualized Graduate Enrolments for Fiscal Years:
85/86 86/87 87/88 88/89 89/90 90/91 91/92 92/93 93/94
94/95 95/96
96/97*
Head Count
?
1,377 1,366 1,426 1,444 1,486 1,623 1,864 2,008 2,071 2,128 2,225 2,272
FTE
?
1,125
1,084 1,147 1,169
1,256
1,404
1,594
1,720 1,779 1,844 1,914 1,949
2,500
2,000
.
DHeadCount DFTE
?
- ? -
1,500 ?
- ....................................................................-.
1,000
500
0
--—-----——--——-------—-
N
?
00
?
M
*
00 ?
00
?
00 ?
00 ?
01, ?
ON
N
kn
00
?
?
110
00
?
?
-
N
00
?
??
-.
0000
??
?
00
ON
-
?
?
-
0
?
?
—
- ? - ?
-
. ?
.
Master's
Doctoral
Degrees Awarded in Fiscal Years:
85/86 86/87 87/88 88/89 89/90 90/91 91/92 92/93 93/94 94/95
95/96
2122
?
279 214 213
?
253
?
245
?
219 285 ?
315 ?
308 425
?
444 466
39 ?
42
?
50
?
45 ?
50 ?
49 ?
64 ?
66 ?
66
?
78
?
88 ?
92
N ?
00 ?
a,% ?
0 ?
—eq
'r ?
N
00 ?
00 ?
00 ?
00 ?
O
N 00
C'
0
00 ?
00 ?
00 ?
00 ?
00 ?
C' ?
C' ?
C\ ?
C' ?
0'
?
ON
?
ON
500 ?
400?
300 ?
200 ?
100 ?
0
SOSCP.EPLXLS 119/97
3
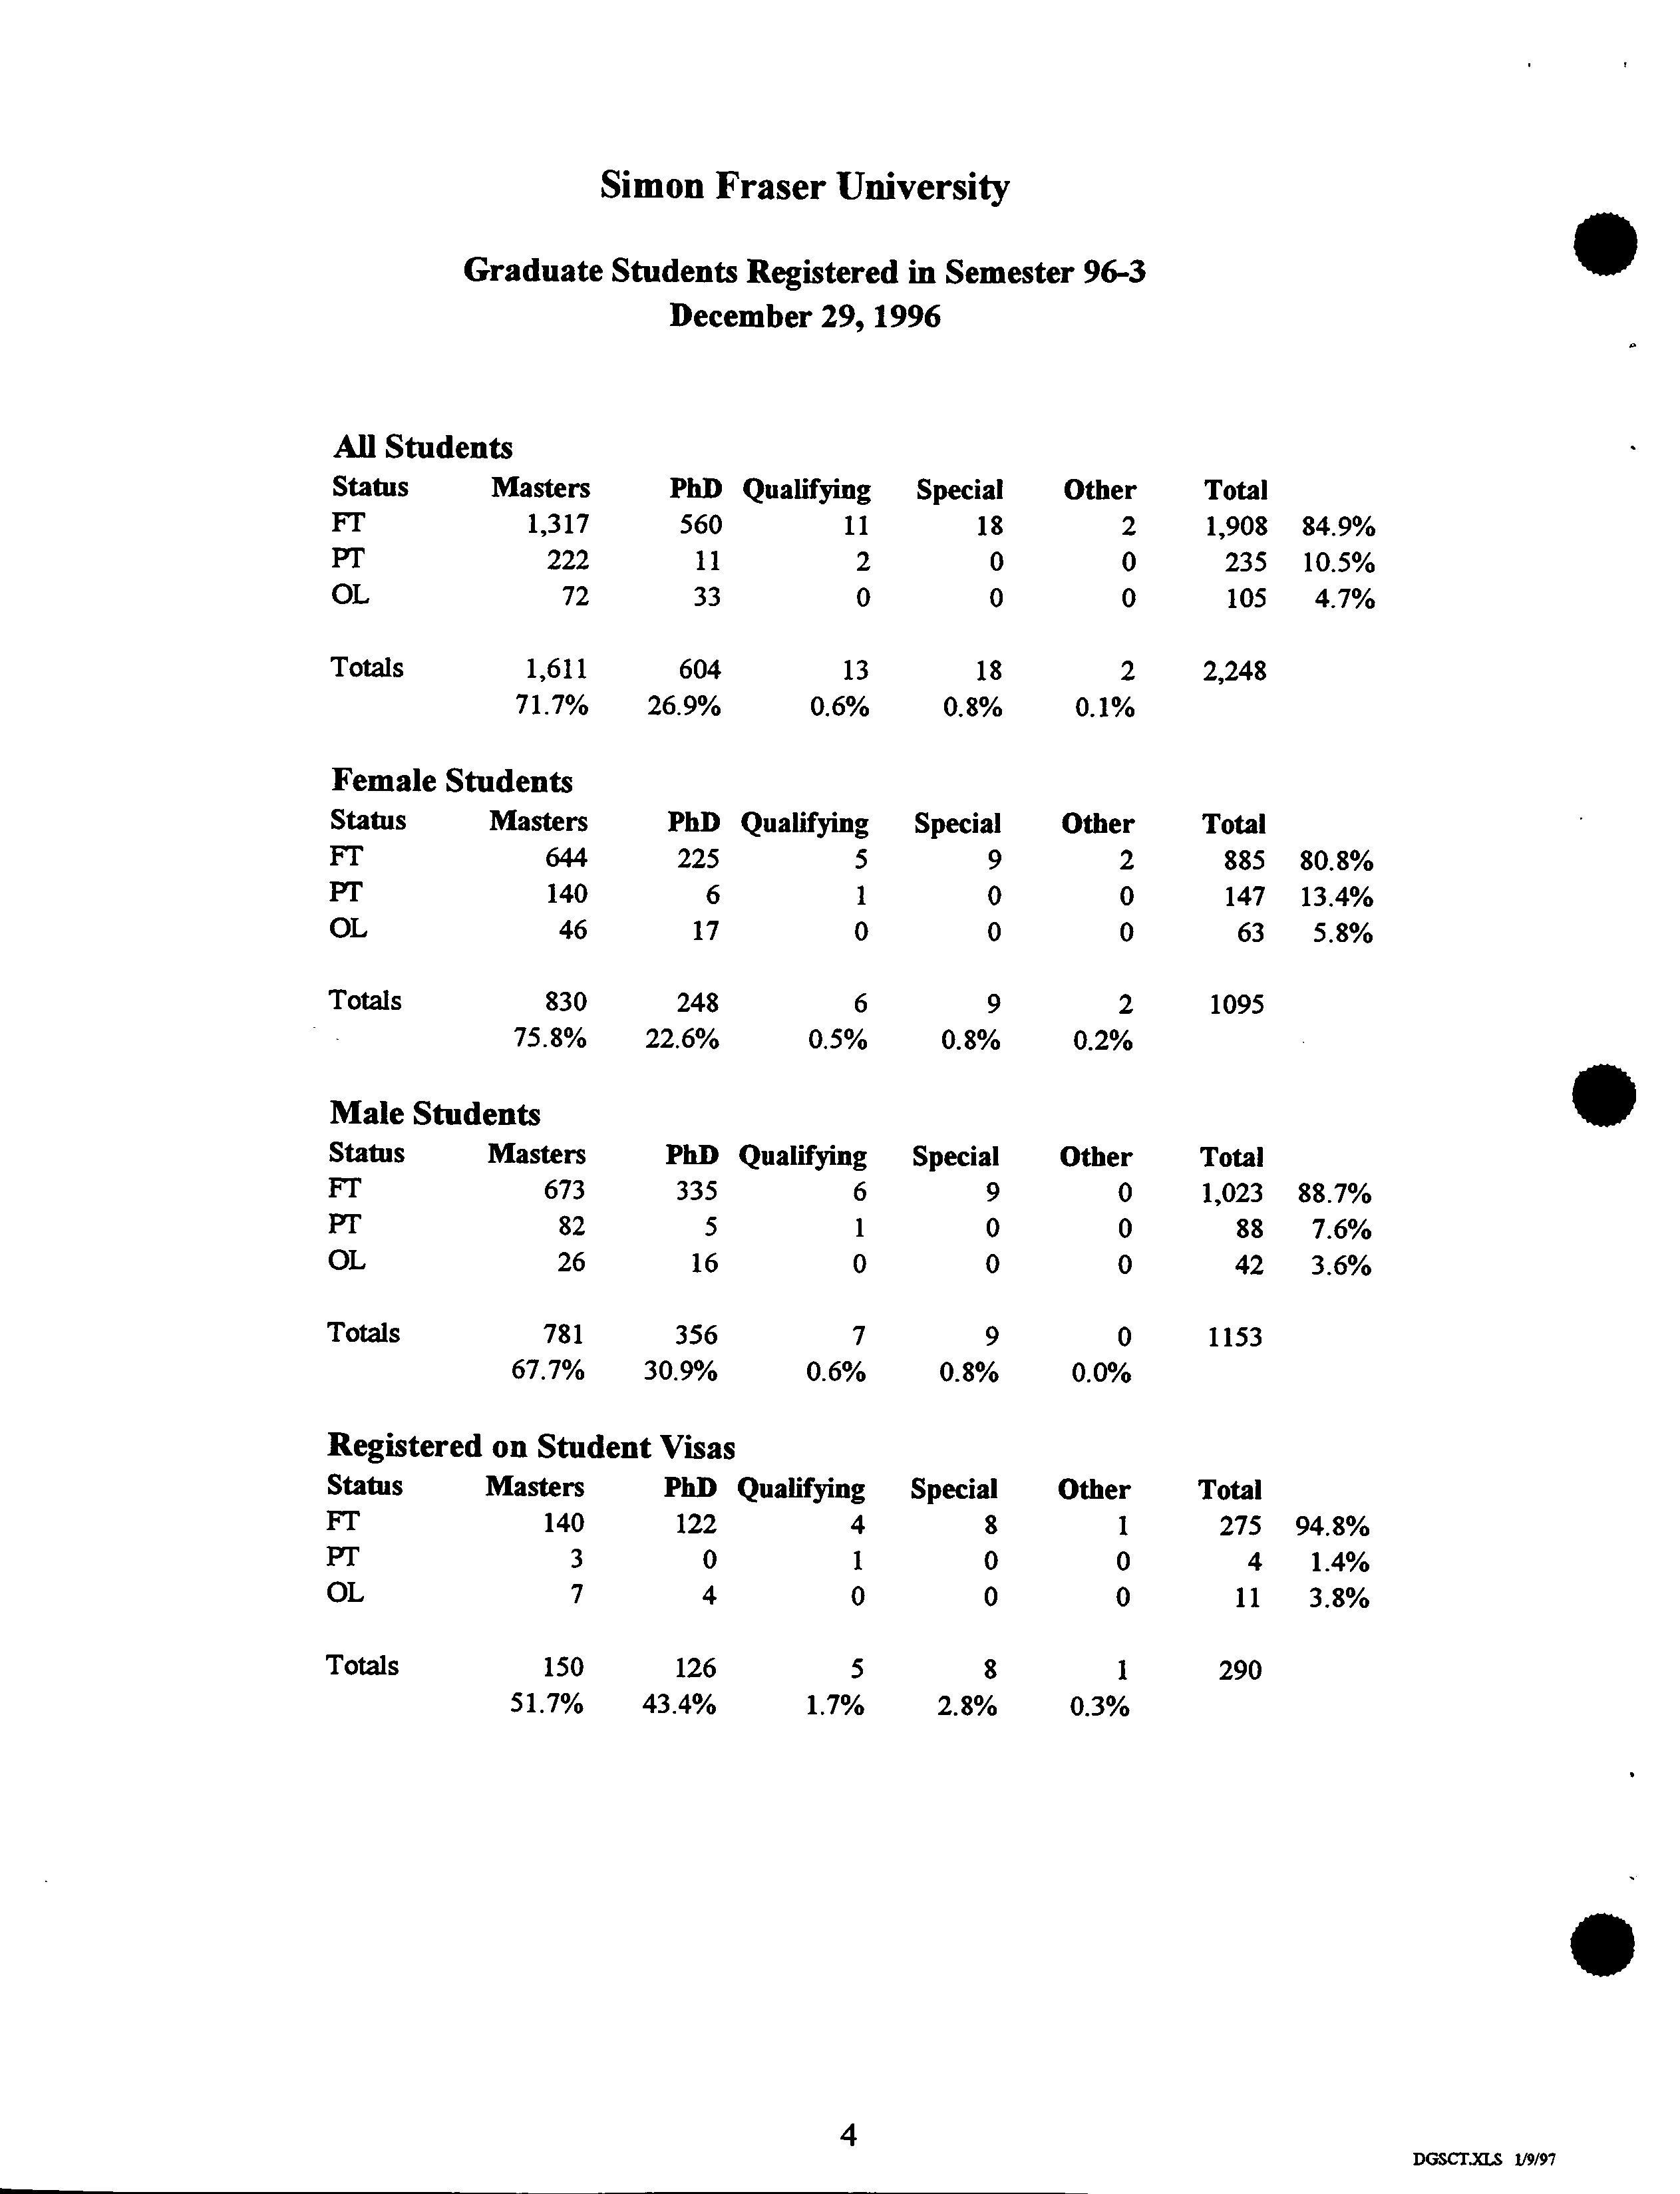
Simon Fraser University
Graduate Students Registered in Semester 96-3
?
December 29, 1996
All Students
Status
Masters
PhD
Qualifying
Special
Other
Total
FT
1,317
560
11
18
2
1,908 ?
84.9%
PT
222
11
2
0
0
235 ?
10.5%
OL
72
33
0
0
0
105 ?
4.7%
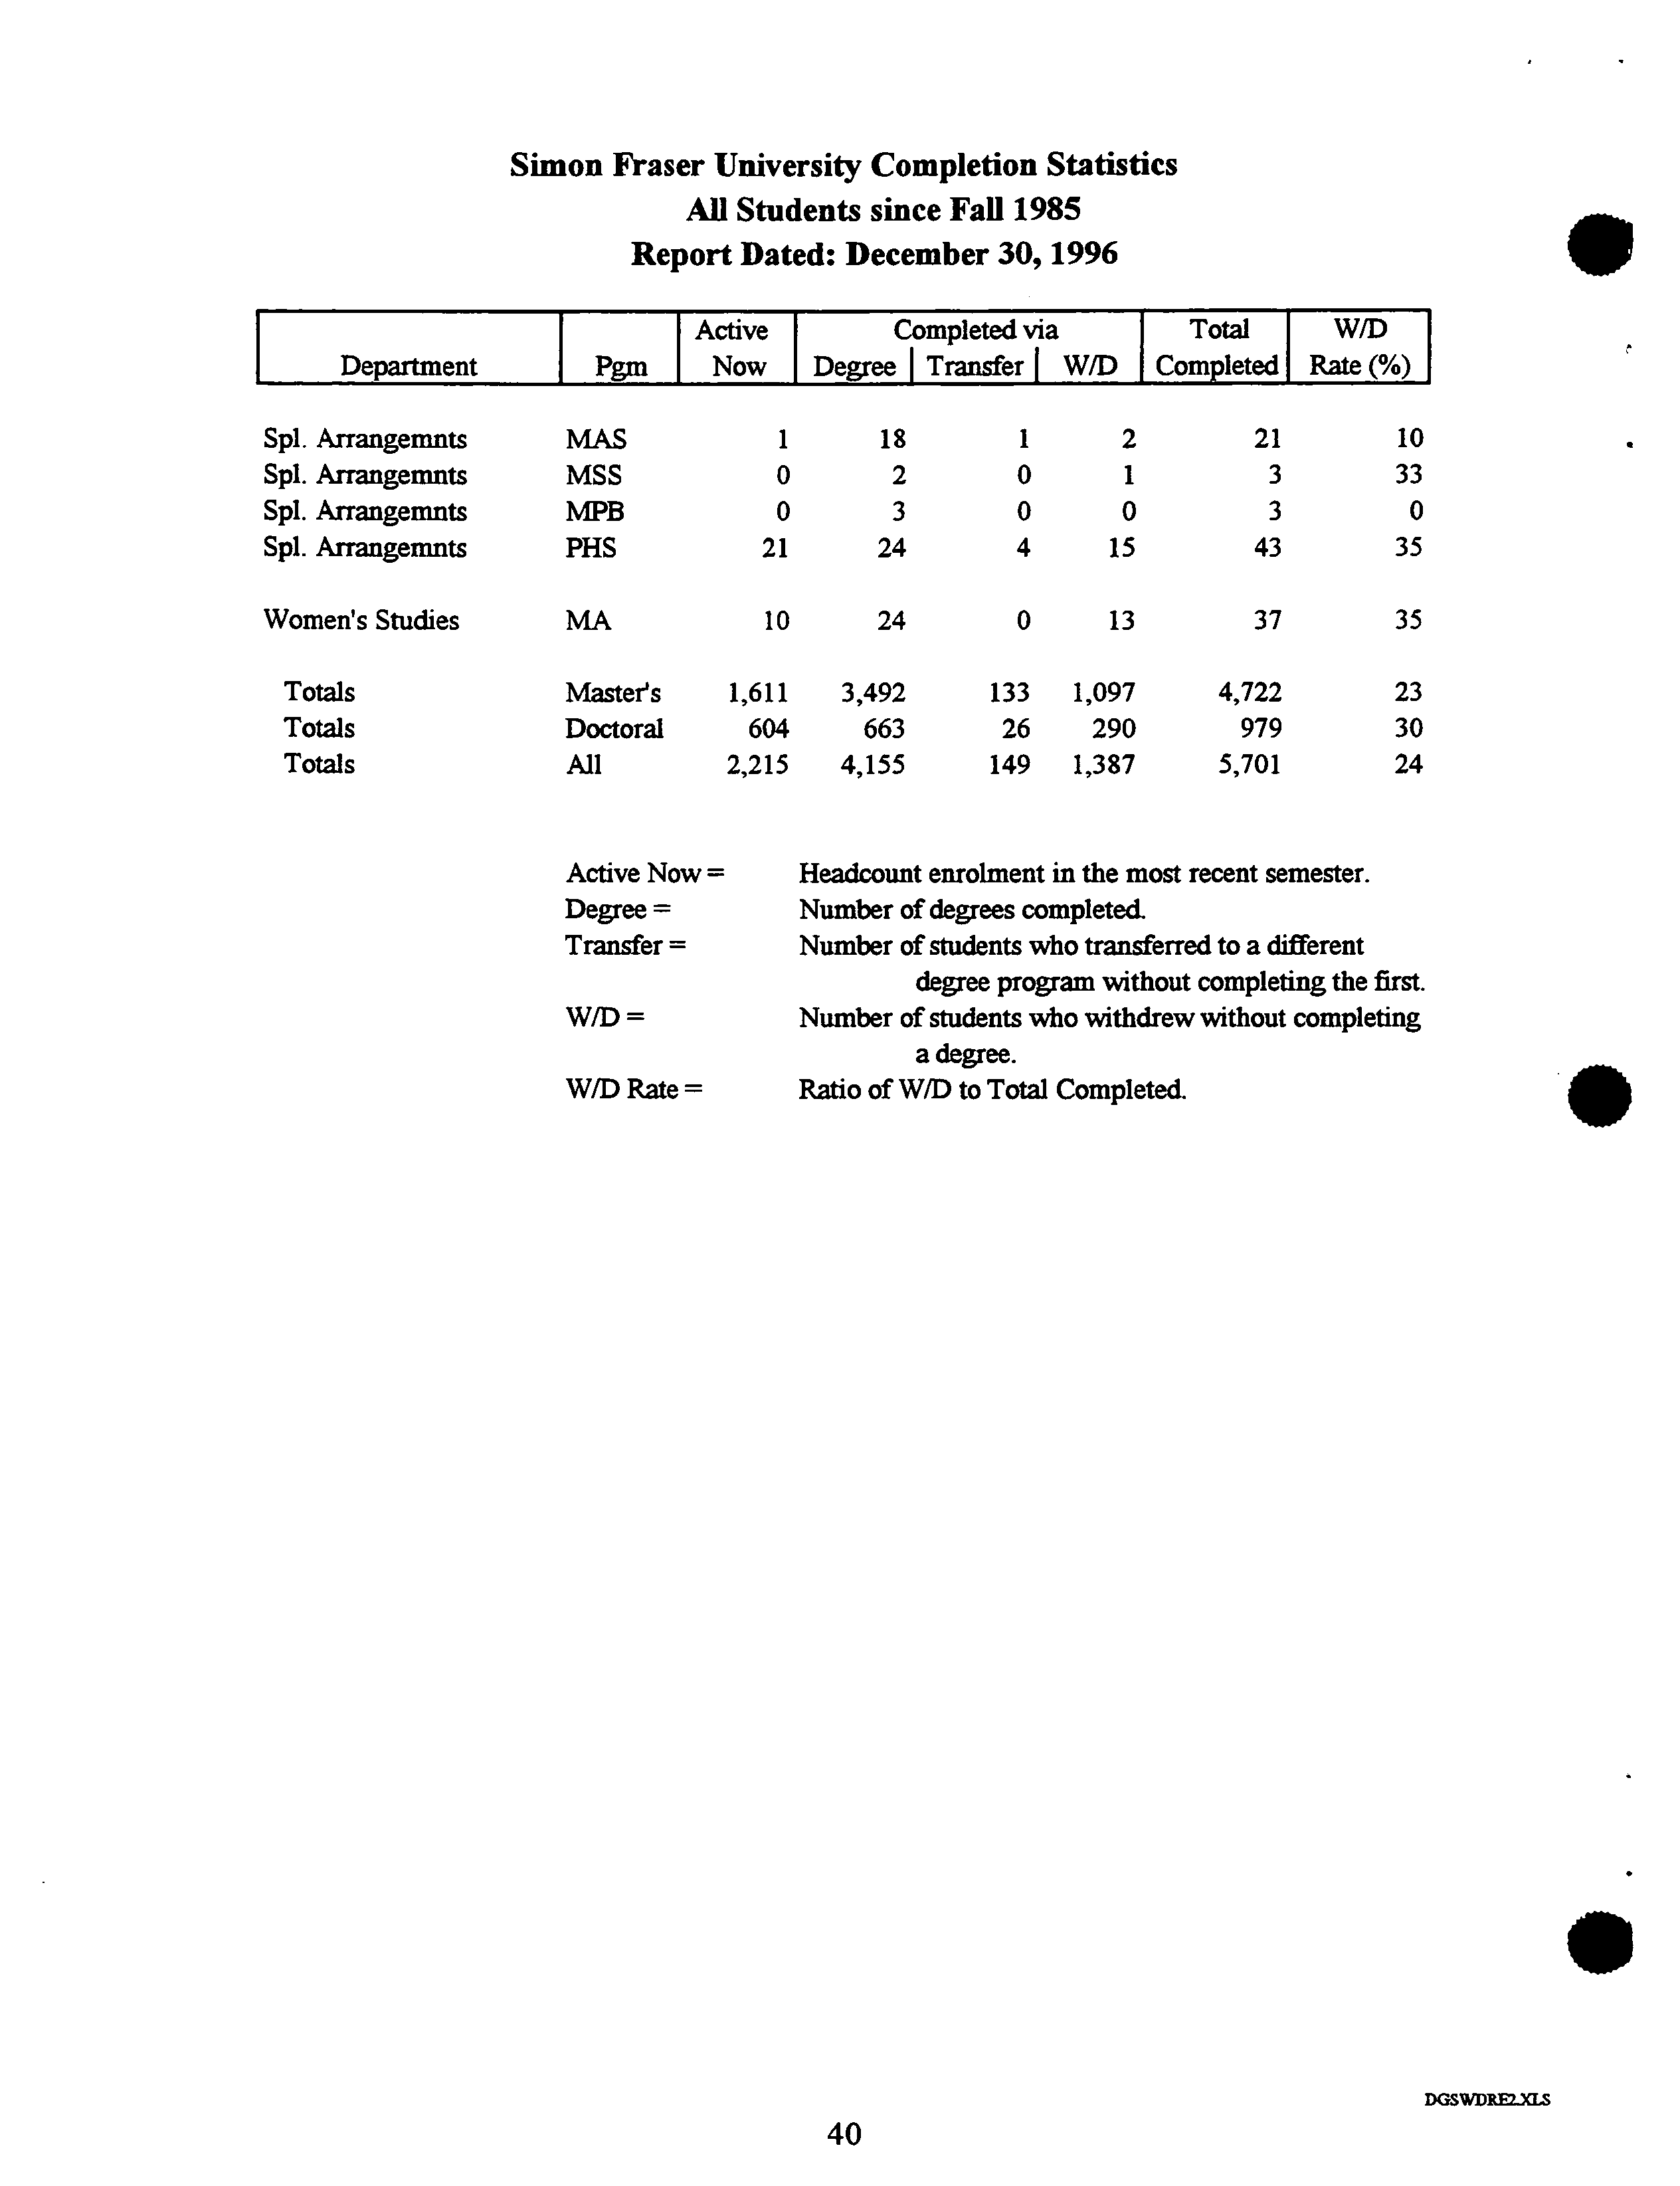
Totals
1,611
604
13
18
2
2,248
71.7%
26.9%
0.6%
0.8%
0.1%
Female Students
Status
?
Masters
PhD
Qualifying
Special
Other
Total
FT ?
644
225
5
9
2
885
80.8%
FT ?
140
6
1
0
0
147
13.4%
OL ?
46
17
0
0
0
63
5.8%
Totals
?
830
248
6
9
2
1095
75.8%
22.6%
0.5%
0.8%
0.2%
Male Students
Status
?
Masters
PhD
Qualifying
Special
Other
Total
FT ?
673
335
6
9
0
1,023
88.7%
P1' ?
82
5
1
0
0
88
7.6%
OL ?
26
16
0
0
0
42
3.6%
Totals
?
781
356
7
9
0
1153
67.7%
30.9%
0.6%
0.8%
0.0%
Registered on Student Visas
Status
?
Masters
PhD
Qualifying
Special
Other
Total
FT ?
140
122
4
8
1
275
94.8%
FT ?
3
0
1
0
0
4
1.4%
OL
?
7
4
0
0
0
11 3.8%
Totals
?
150
126
5
8
1
290
51.7%
43.4%
1.7%
2.8%
0.3%
4
DGSCT.XL.S
JJ9/97
Spi. Arrangemnts MA
Earth Sciences
Biological Sci. MAq
Philosophy
Linguistics
Gerontology
French
Contemp. Arts
•
Women's Studies
Sp. & Lat. Am. Studies
Geography MSc
Chemistry
Archaeology
Publishing
Physics
Kinesiology
History
Geography MA
Biological Sci. MPM
Psychology
Math. & Stats.
Economics
Soc. & Anth.
English
Communication
Engineering Sci. MEng
Education MSc
Criminology
Political Sci.
Computing Sci.
Engineering Sci. MApSc
Bus. Admin. WMBA
Liberal Studies
Res. & Env. Mgmt.
Biological Sci. MSc
Bus. Admin. EMBA
Education MA
Bus. Admin. DMBA
Education MEd
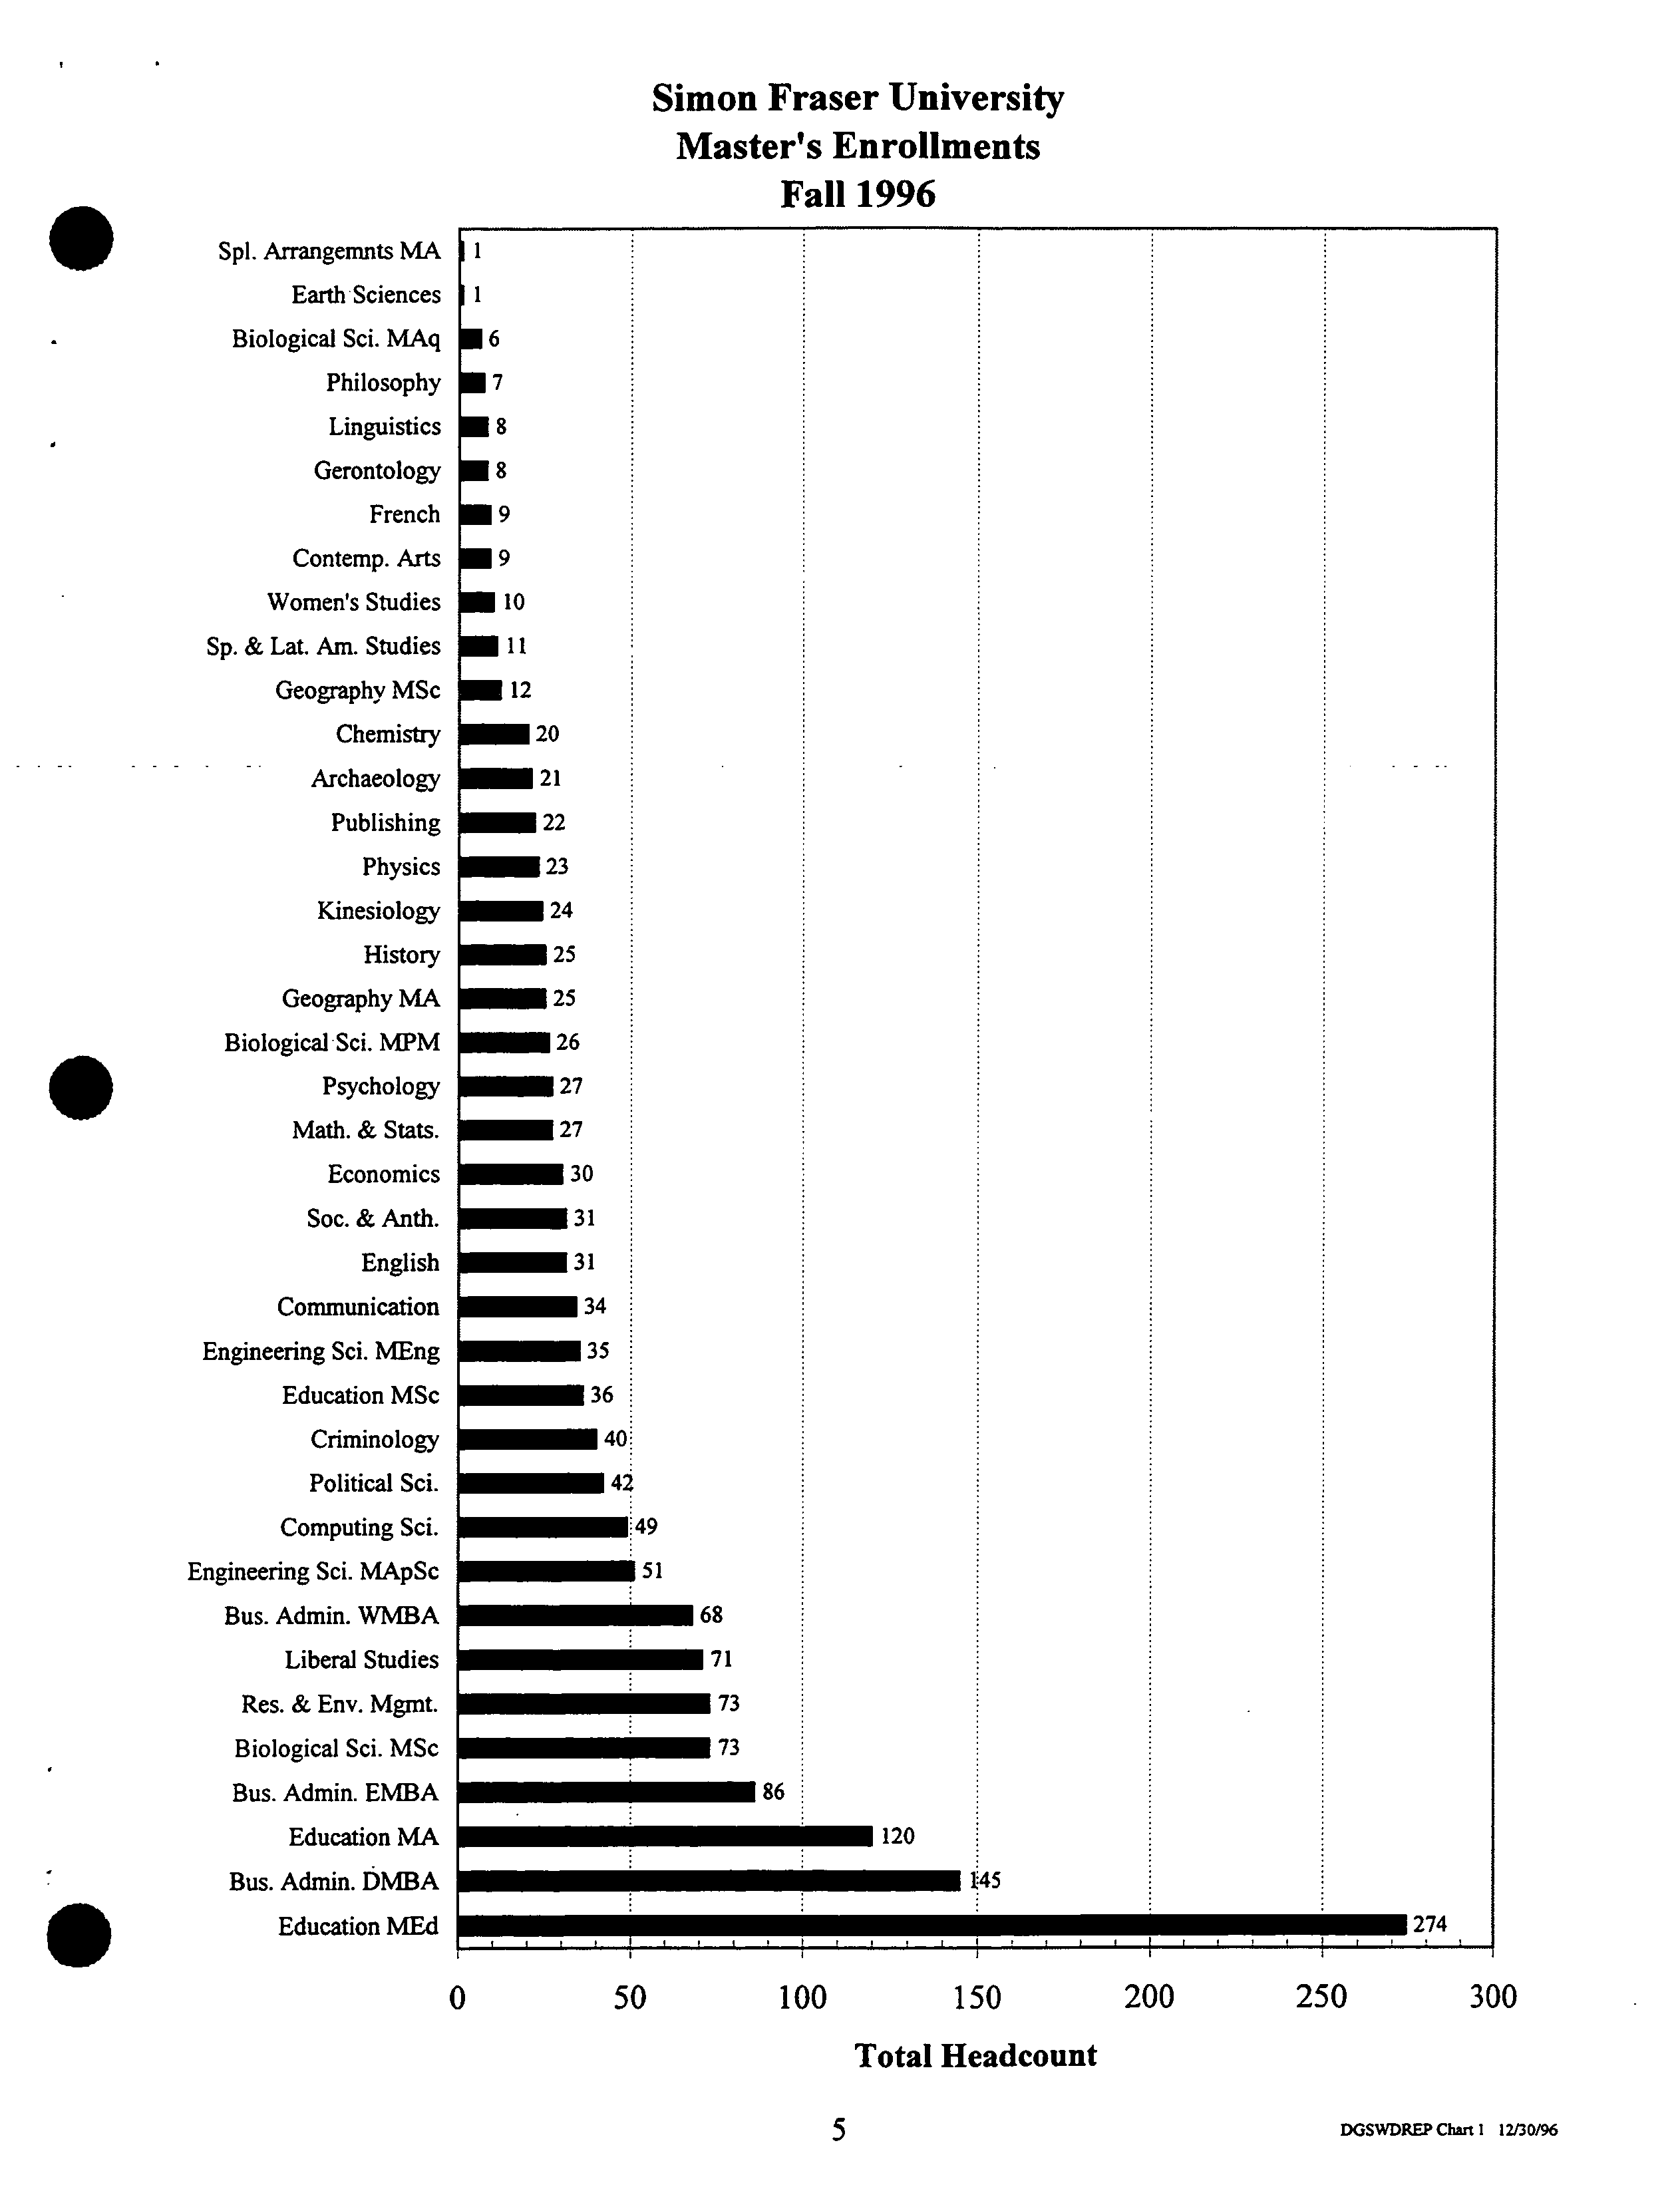
Simon Fraser University ?
Master's Enrollments ?
Fall 1996
16
17
18
18
19
.9
•io
•11
12
20
21
22
23
24
25
25
26
27
27
30
31
31
34
35
36
40
42
49
51
68
71
73
73
86
— 120
145
274
w
0
?
50 ?
100 ?
150 ?
200
?
250 ?
300
Total Headcount
5
?
DGSWDREP Chart 1 12/30/96
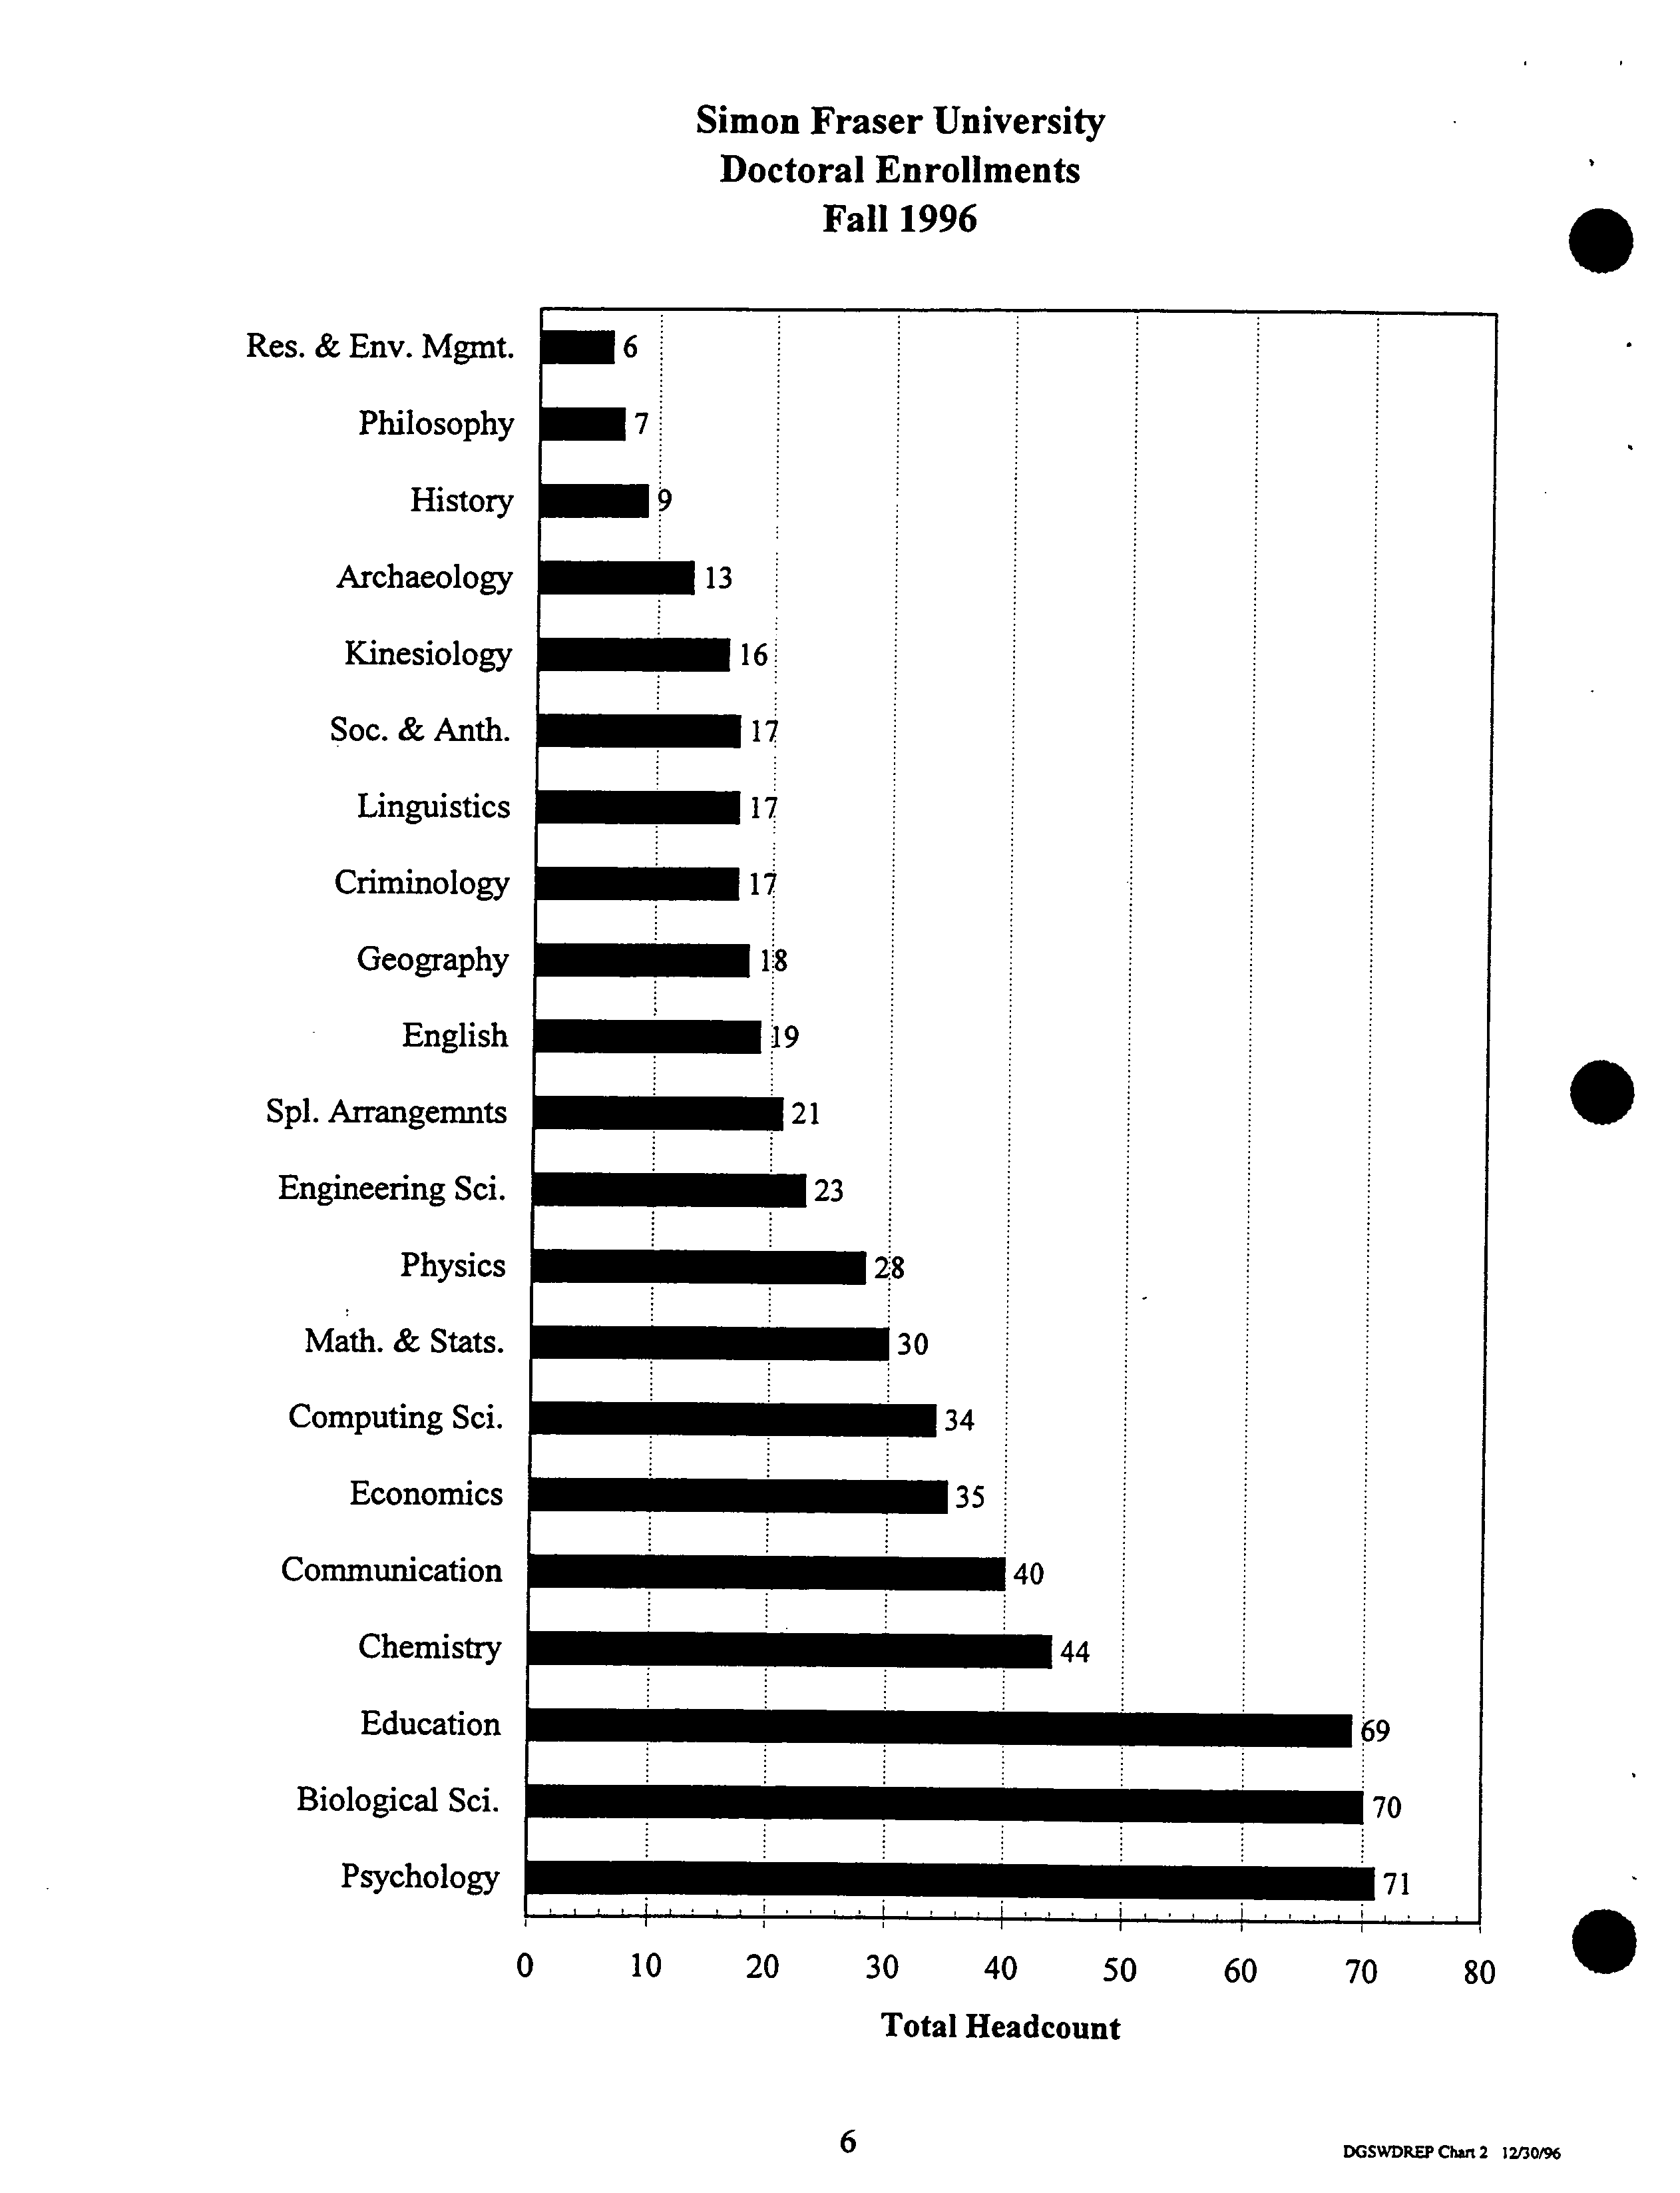
Simon Fraser University ?
Doctoral Enrollments ?
Fall 1996
?
Res. & Env. Mgmt.
?
6
?
Philosophy
?
7
?
History ?
9
?
Archaeology ?
13
?
Kinesiology ?
16
?
Soc. &Anth.
?
17
?
Linguistics ?
17
?
Criminology ?
17
?
Geography
?
1.8
?
English ?
19
?
Spi. Arrangenmts ?
21
?
Engineering Sci.
?
123
?
Physics ?
28
?
Math.& Stats. ?
13°
?
Computing Sci.
?
•34
?
Economics ?
35
?
Communication ?
40
?
Chemistry ?
•44
?
Education ?
69
Biological Sci.
?
70
?
Psychology ?
171
0 ?
10 ?
20 ?
30 ?
40 ?
50 ?
60
?
70 ?
80?
Total Headcount
6 ?
ixswiip
Chan 2 250/96
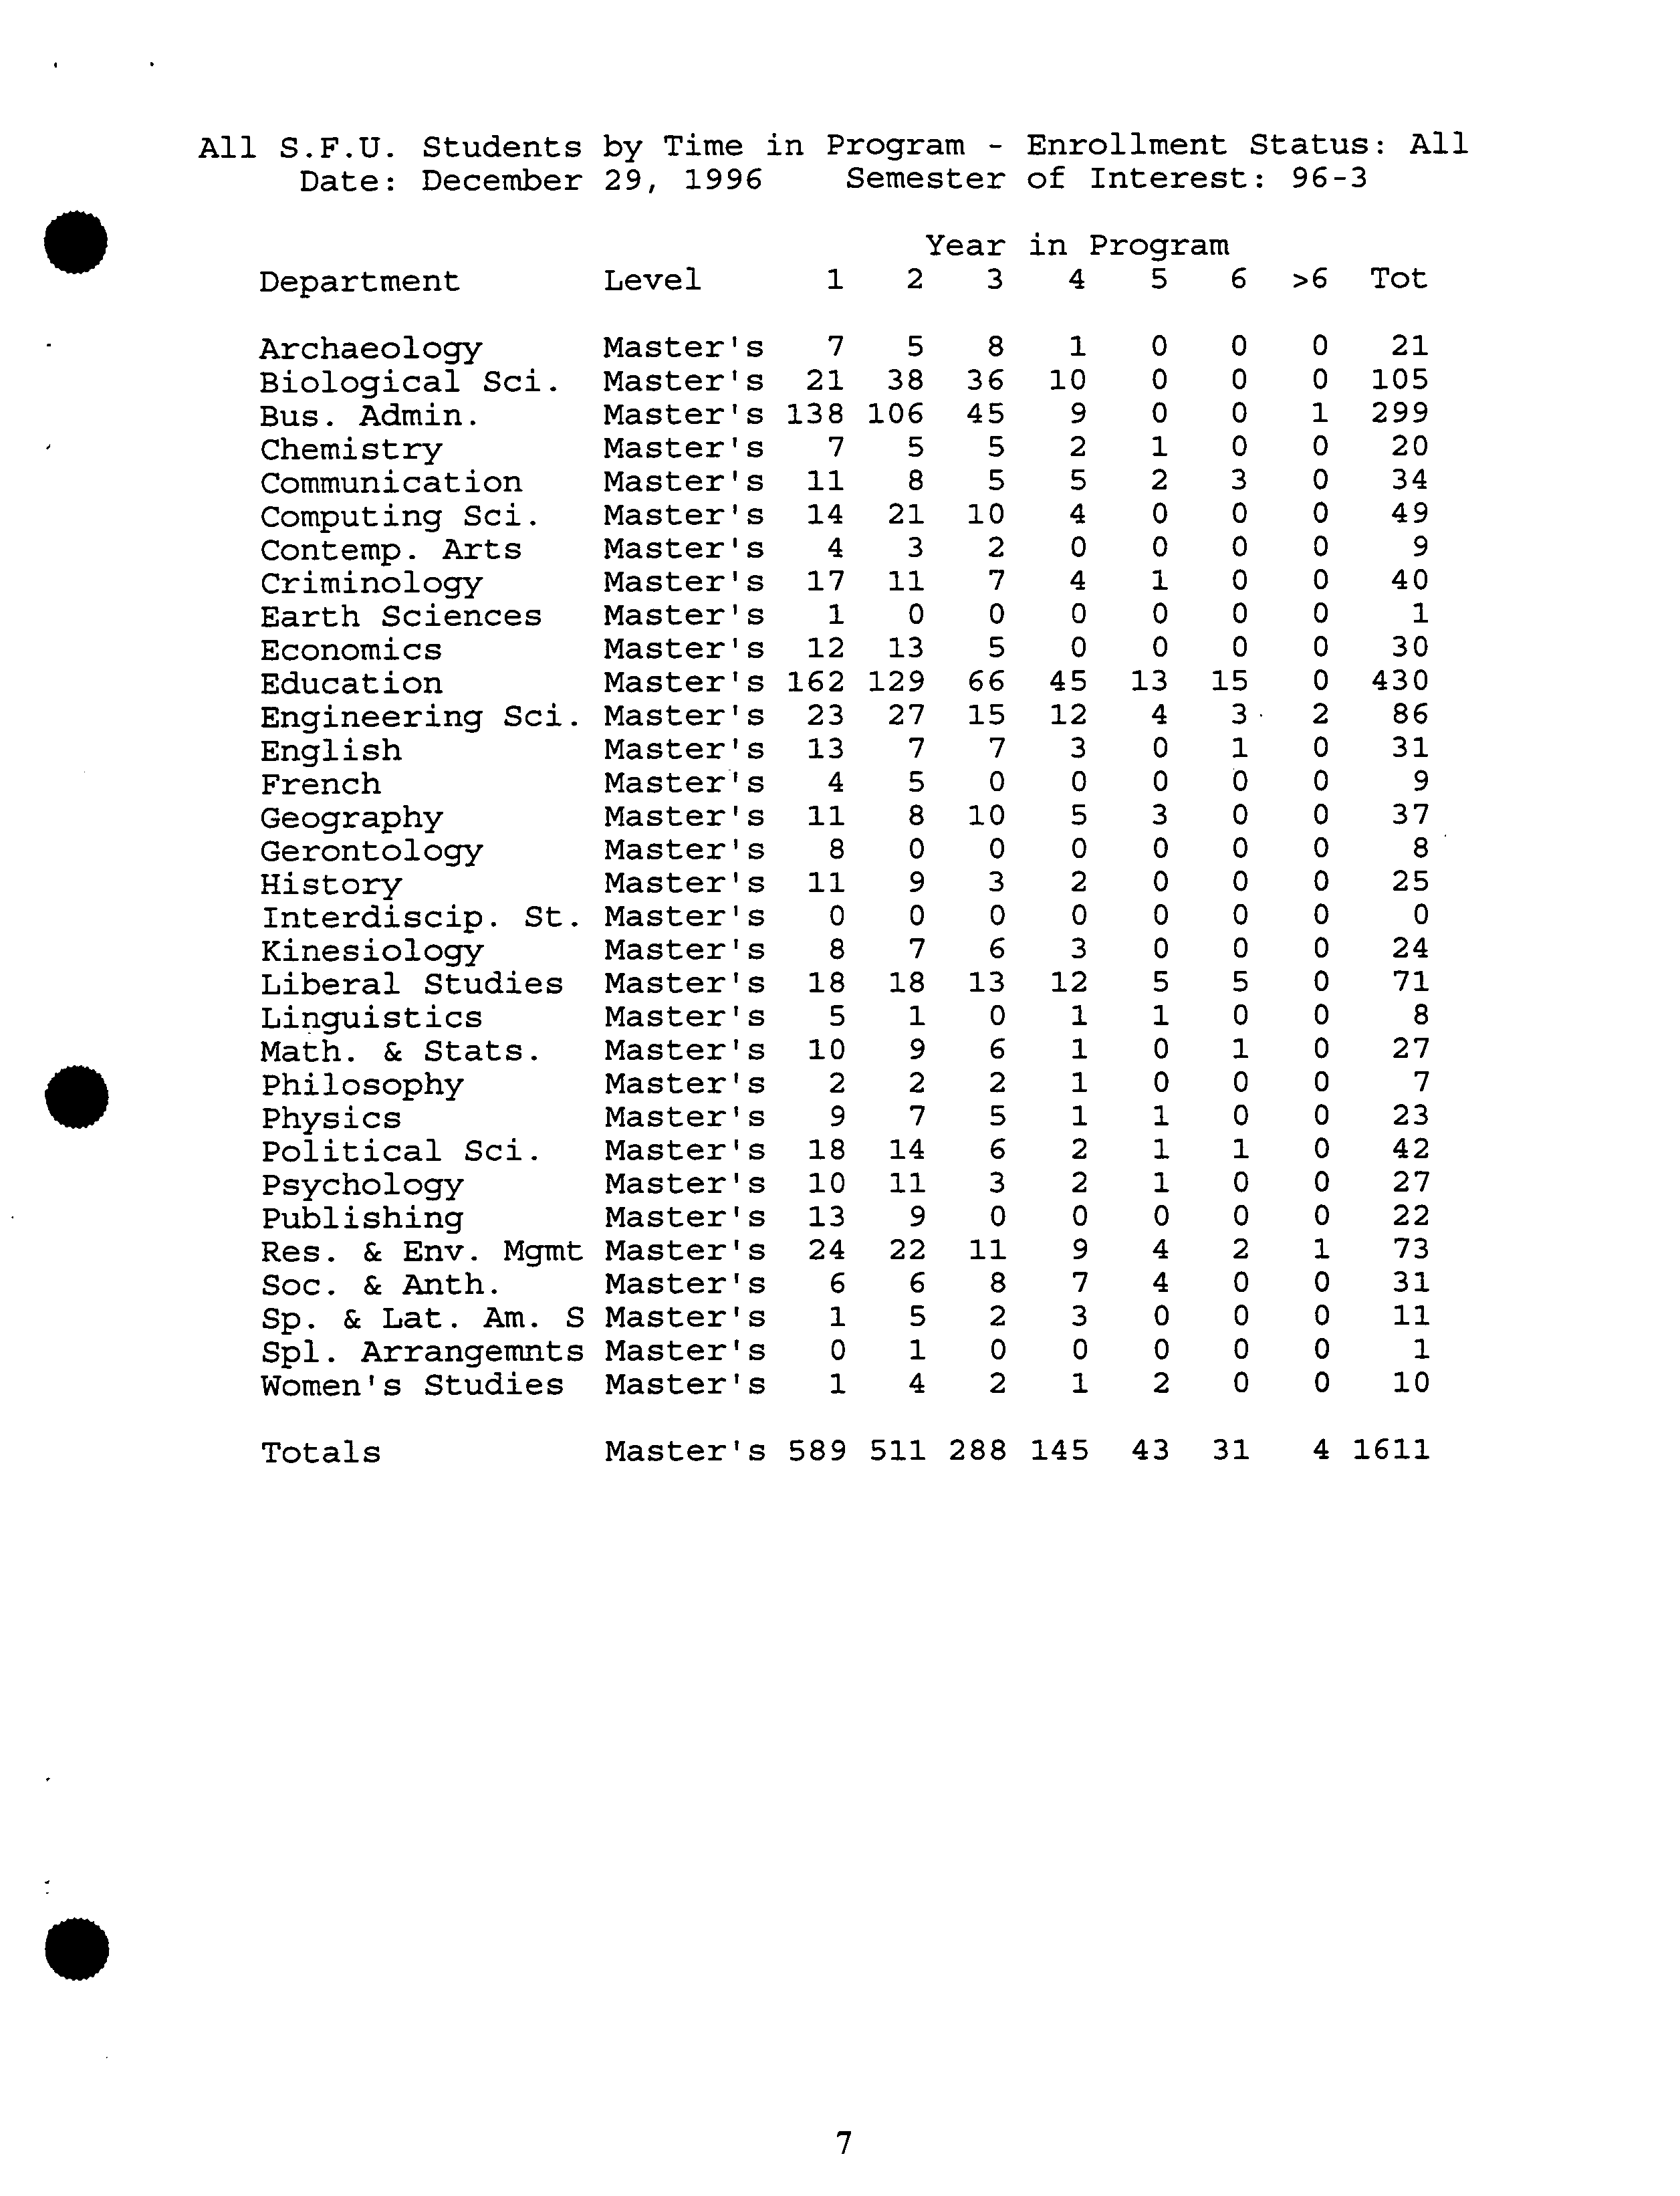
All S.F.U. Students by Time in Program - Enrollment Status: All
?
Date: December 29, 1996
?
Semester of Interest: 96-3
Year in Program
Department ?
Level ?
1 2 ?
3 ?
4 ?
5 6 >6 Tot
Archaeology
Master's
7
5 8
1 0 0
0 21
Biological Sci.
Master's
21 38 36 10
0 0 0 105
Bus. Admin.
Master's
138
106 45 9
0 0
1
299
Chemistry
Master's
7 5
5
2 1 0
0 20
Communication
Master's
11
8 5 5
2 3 0
34
Computing Sci.
Master's
14
21 10
4
0
0 0 49
Contemp. Arts
Master's
4
3
2 0 0
0 0 9
Criminology
Master's
17 11
7
4
1 0
0 40
Earth Sciences
Master's
1
0 0
0
0
0 0
1
Economics
Master's
12 13 5 0
0 0 0 30
Education
Master's
162
129
66 45 13 15
0 430
Engineering Sd.
Master's
23
27 15
12
4
3
2 86
English
Master's
13
7 7
3
0
1
0 31
French
Master's
4 5
0
0
0 0 0 9
Geography
Master's
11 8 10 5
3 0 0
37
Gerontology
Master's 8
0 0
0
0 0
0
8
History
Master's 11 9
3
2 0 0
0 25
Interdiscip. St.
Master's 0 0 0
0 0 0
0 0
Kinesiology
Master's
8
7
6 3 0
0 0 24
Liberal Studies
Master's 18 18
13 12 5 5
0 71
Linguistics
Master's 5
1 0 1 1
0
0 8
Math. ?
& Stats.
Master's
10 9
6
1
0
1
0
27
Philosophy
Master's
2 2 2
1
0 0
0 7
Physics
Master's
9
7 5 1 1
0
0 23
Political Sci.
Master's 18
14
6 2
1
1
0 42
Psychology
Master's 10
11
3
2
1
0
0 27
Publishing
Master's 13 9 0
0 0 0
0 22
Res. & Env. Mgmt
Master's
24 22 11
9
4
2 1
73
Soc. & Anth.
Master's 6
6 8
7 4 0 0 31
Sp. & Lat. Am. SMaster's
1
5 2 3
0 0 0
11
Spi. Arrangemnts
Master's 0
1
0 0 0
0 0 1
Women's Studies
Master's 1
4
2
1
2
0 0 10
Totals
Master's 589
511
288
145
43
31 4 1611
7
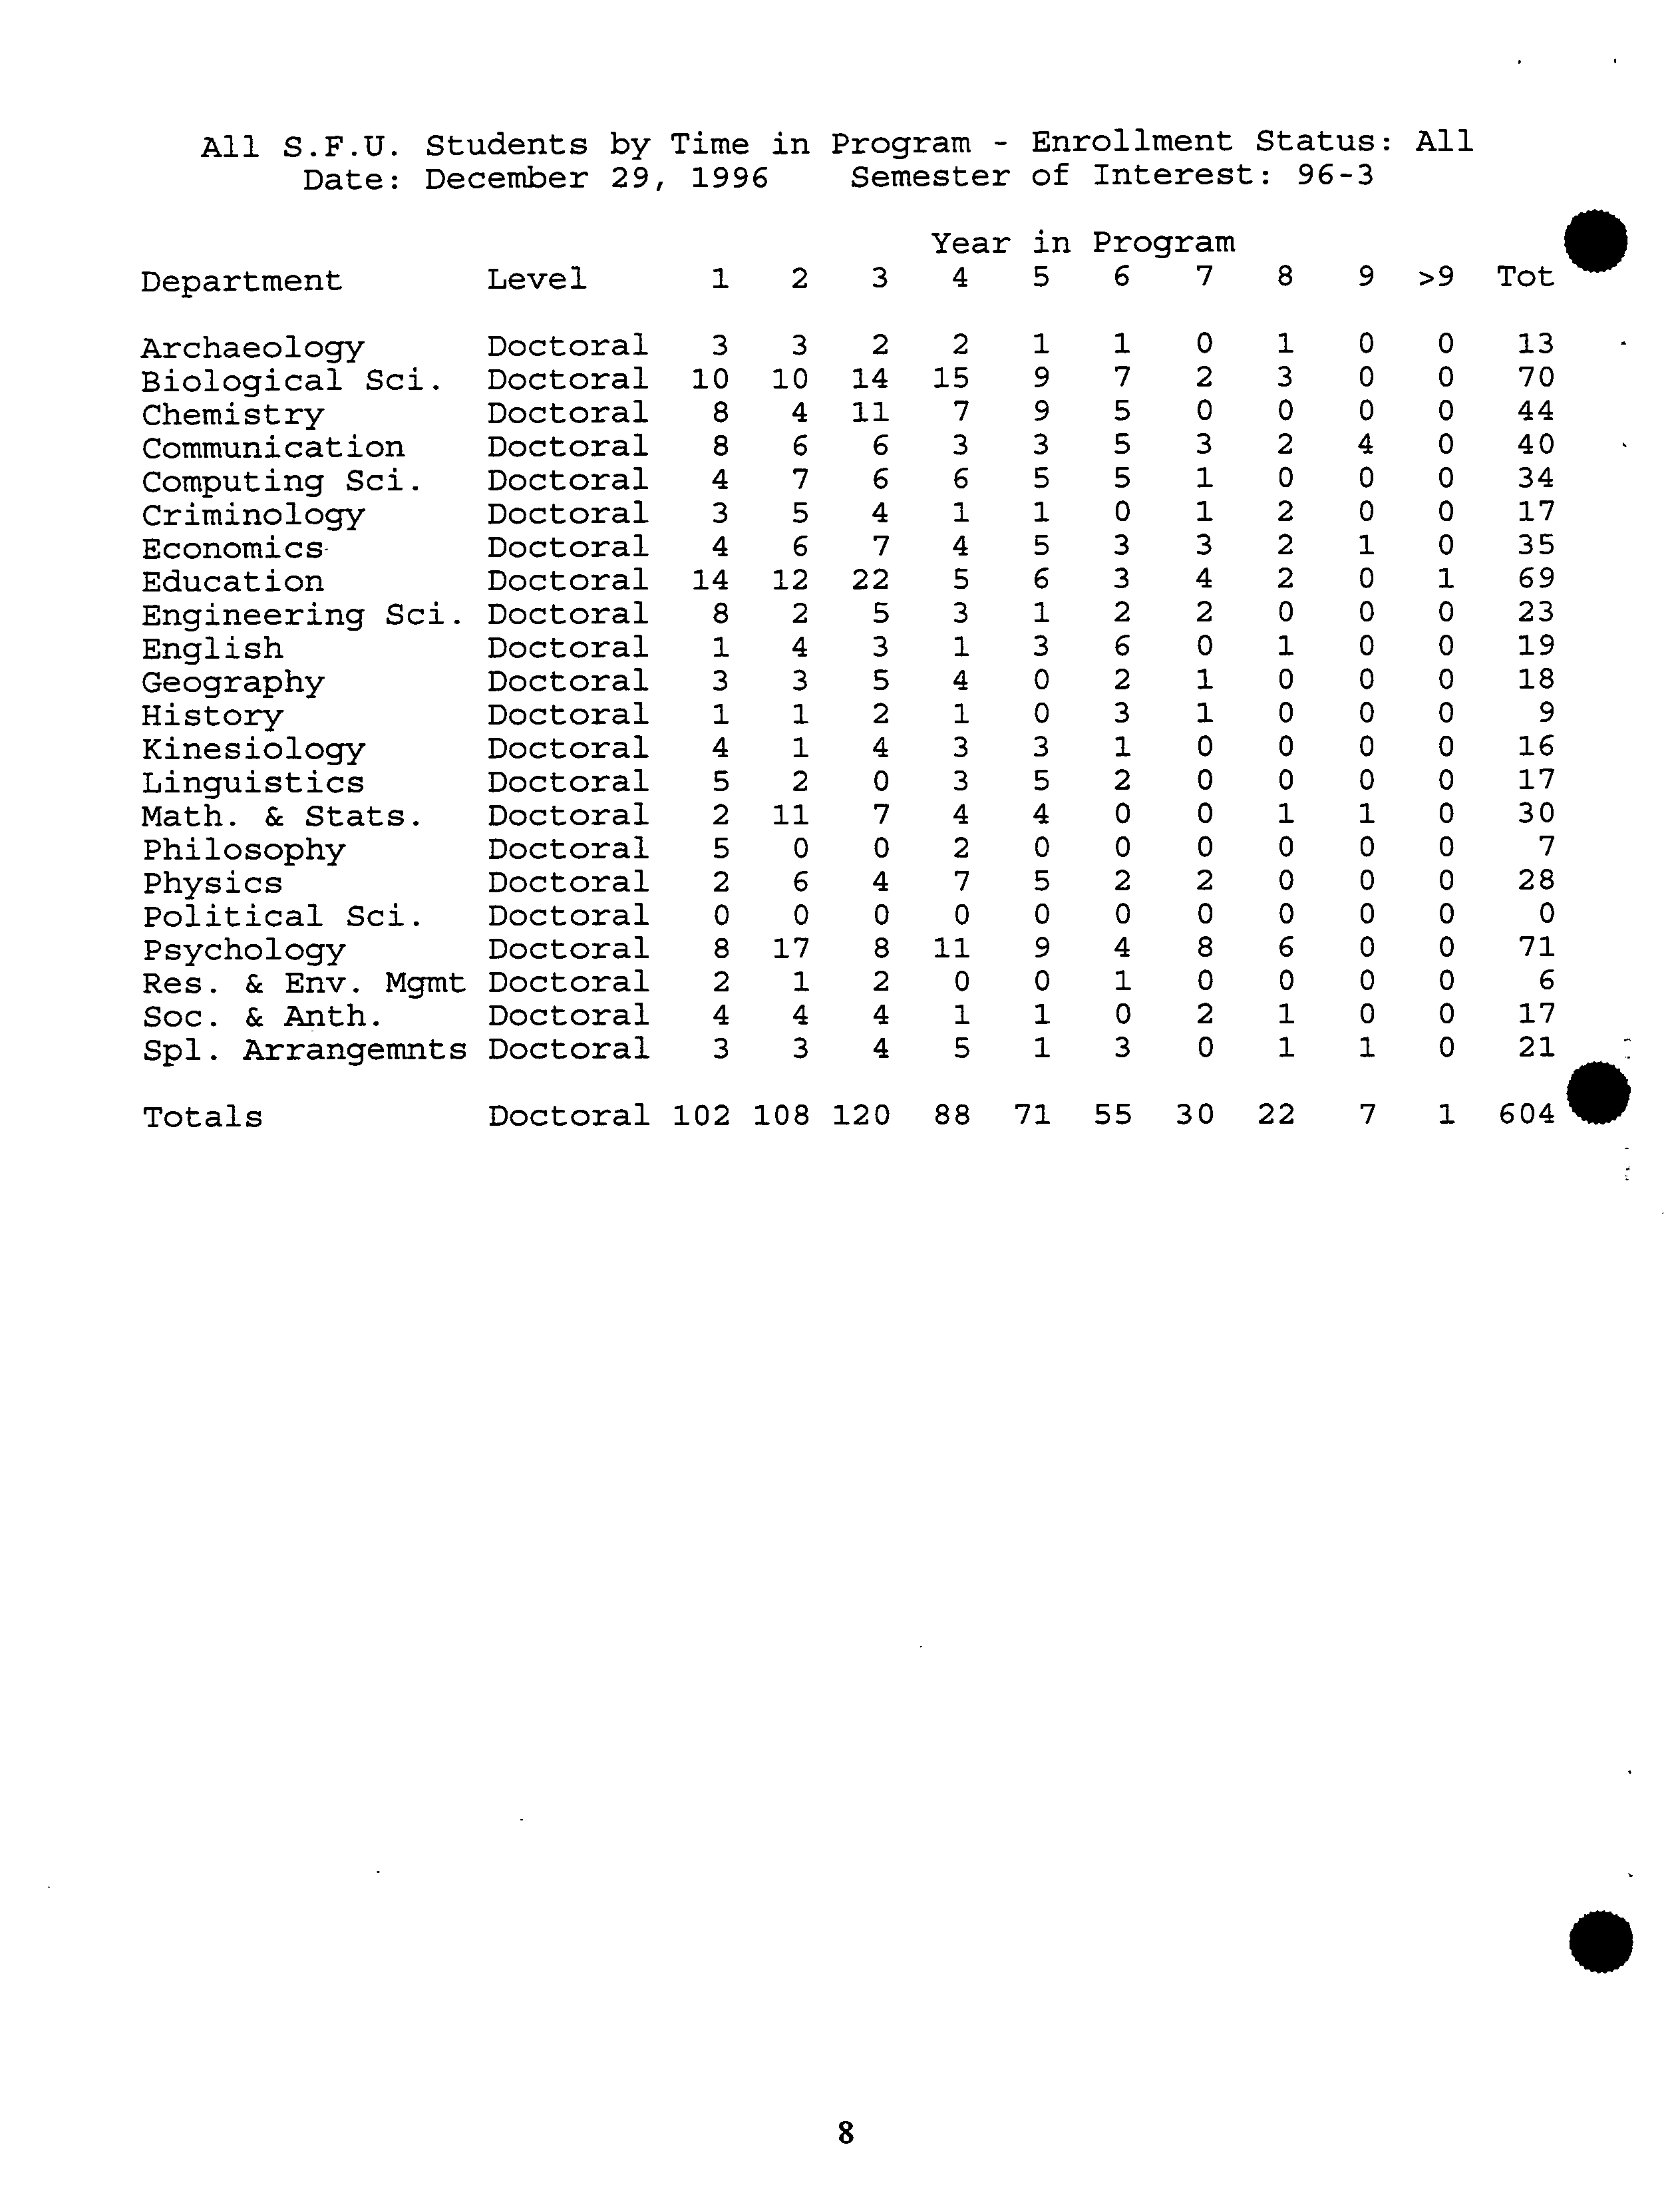
All S.F.U. Students by
Time in
Program -
Enrollment
Status:
All
Date: December 29,
1996
Semester
of
Interest:
96-3
Year in
Program
Department
Level
1
2
3
4 5
6
7
8 9 >9 Tot
Archaeology
Doctoral 3 3
2
2
1 1 0
1
0 0 13
Biological Sci.
Doctoral
10 10
14
15
9
7 2 3 0 0 70
Chemistry
Doctoral 8
4
11
7 9
5
0
0 0 0
44
Communication
Doctoral
8 6
6
3
3
5 3 2 4 0 40
Computing Sci.
Doctoral
4 7 6
6
5
5 1
0
0 0
34
Criminology
Doctoral
3 5
4
1 1
0
1
2 0 0
17
Economics-
Doctoral
4 6
7 4
5 3
3
2
1
0
35
Education
Doctoral
14 12
22 5 6
3
4
2 0 1
69
Engineering Sci.
Doctoral
8
2 5 3
1
2 2 0 0 0 23
English
Doctoral
1 4 3 1
3 6
0 1 0 0 19
Geography
Doctoral
3 3
5 4
0 2 1 0 0 0
18
History
Doctoral
1 1
2 1 0
3 1 0 0 0
9
Kinesiology
Doctoral
4 1 4
3
3 1 0 0 0 0
16
Linguistics
Doctoral
5 2 0
3
5
2 0 0 0 0
17
Math. & Stats.
Doctoral
2 11
7 4
4 0
0 1 1 0
30
Philosophy
Doctoral 5 0
0 2
0 0 0 0 0
0
7
Physics
Doctoral 2 6
4 7 5
2 2 0 0 0
28
Political Sci.
Doctoral
0
0 0 0
0
0 0 0 0 0
0
Psychology
Doctoral
8
17
8
11 9
4
8 6 0 0
71
Res. & Env. MgmtDoctoral
2 1
2
0
0
1
0 0 0 0
6
Soc. & Anth.
Doctoral
4 4 4
1 1 0
2
1 0
0
17
Spi. Arrangemrits
Doctoral 3 3
4 5
1 3 0 1 1 0
21
Totals
Doctoral 102 108 120
88
71
55
30 22 7 1 604
8
Business Administration
Economics
French
Contemporary Arts
Chemistry
Philosophy
Engineering Science
Physics
Political Science
History
Resource & Environ. Mgmt.
Biological Sciences
Liberal Studies
Kinesiology
•
?
Geography
Computing Science
Sociology & Anthropology
Education
Span. & Lat. Am. Studies
Special Arrangements
Publishing
Communication
Mathematics & Statistics
Psychology
Archaeology
Women's Studies
English
Criminology
Linguistics
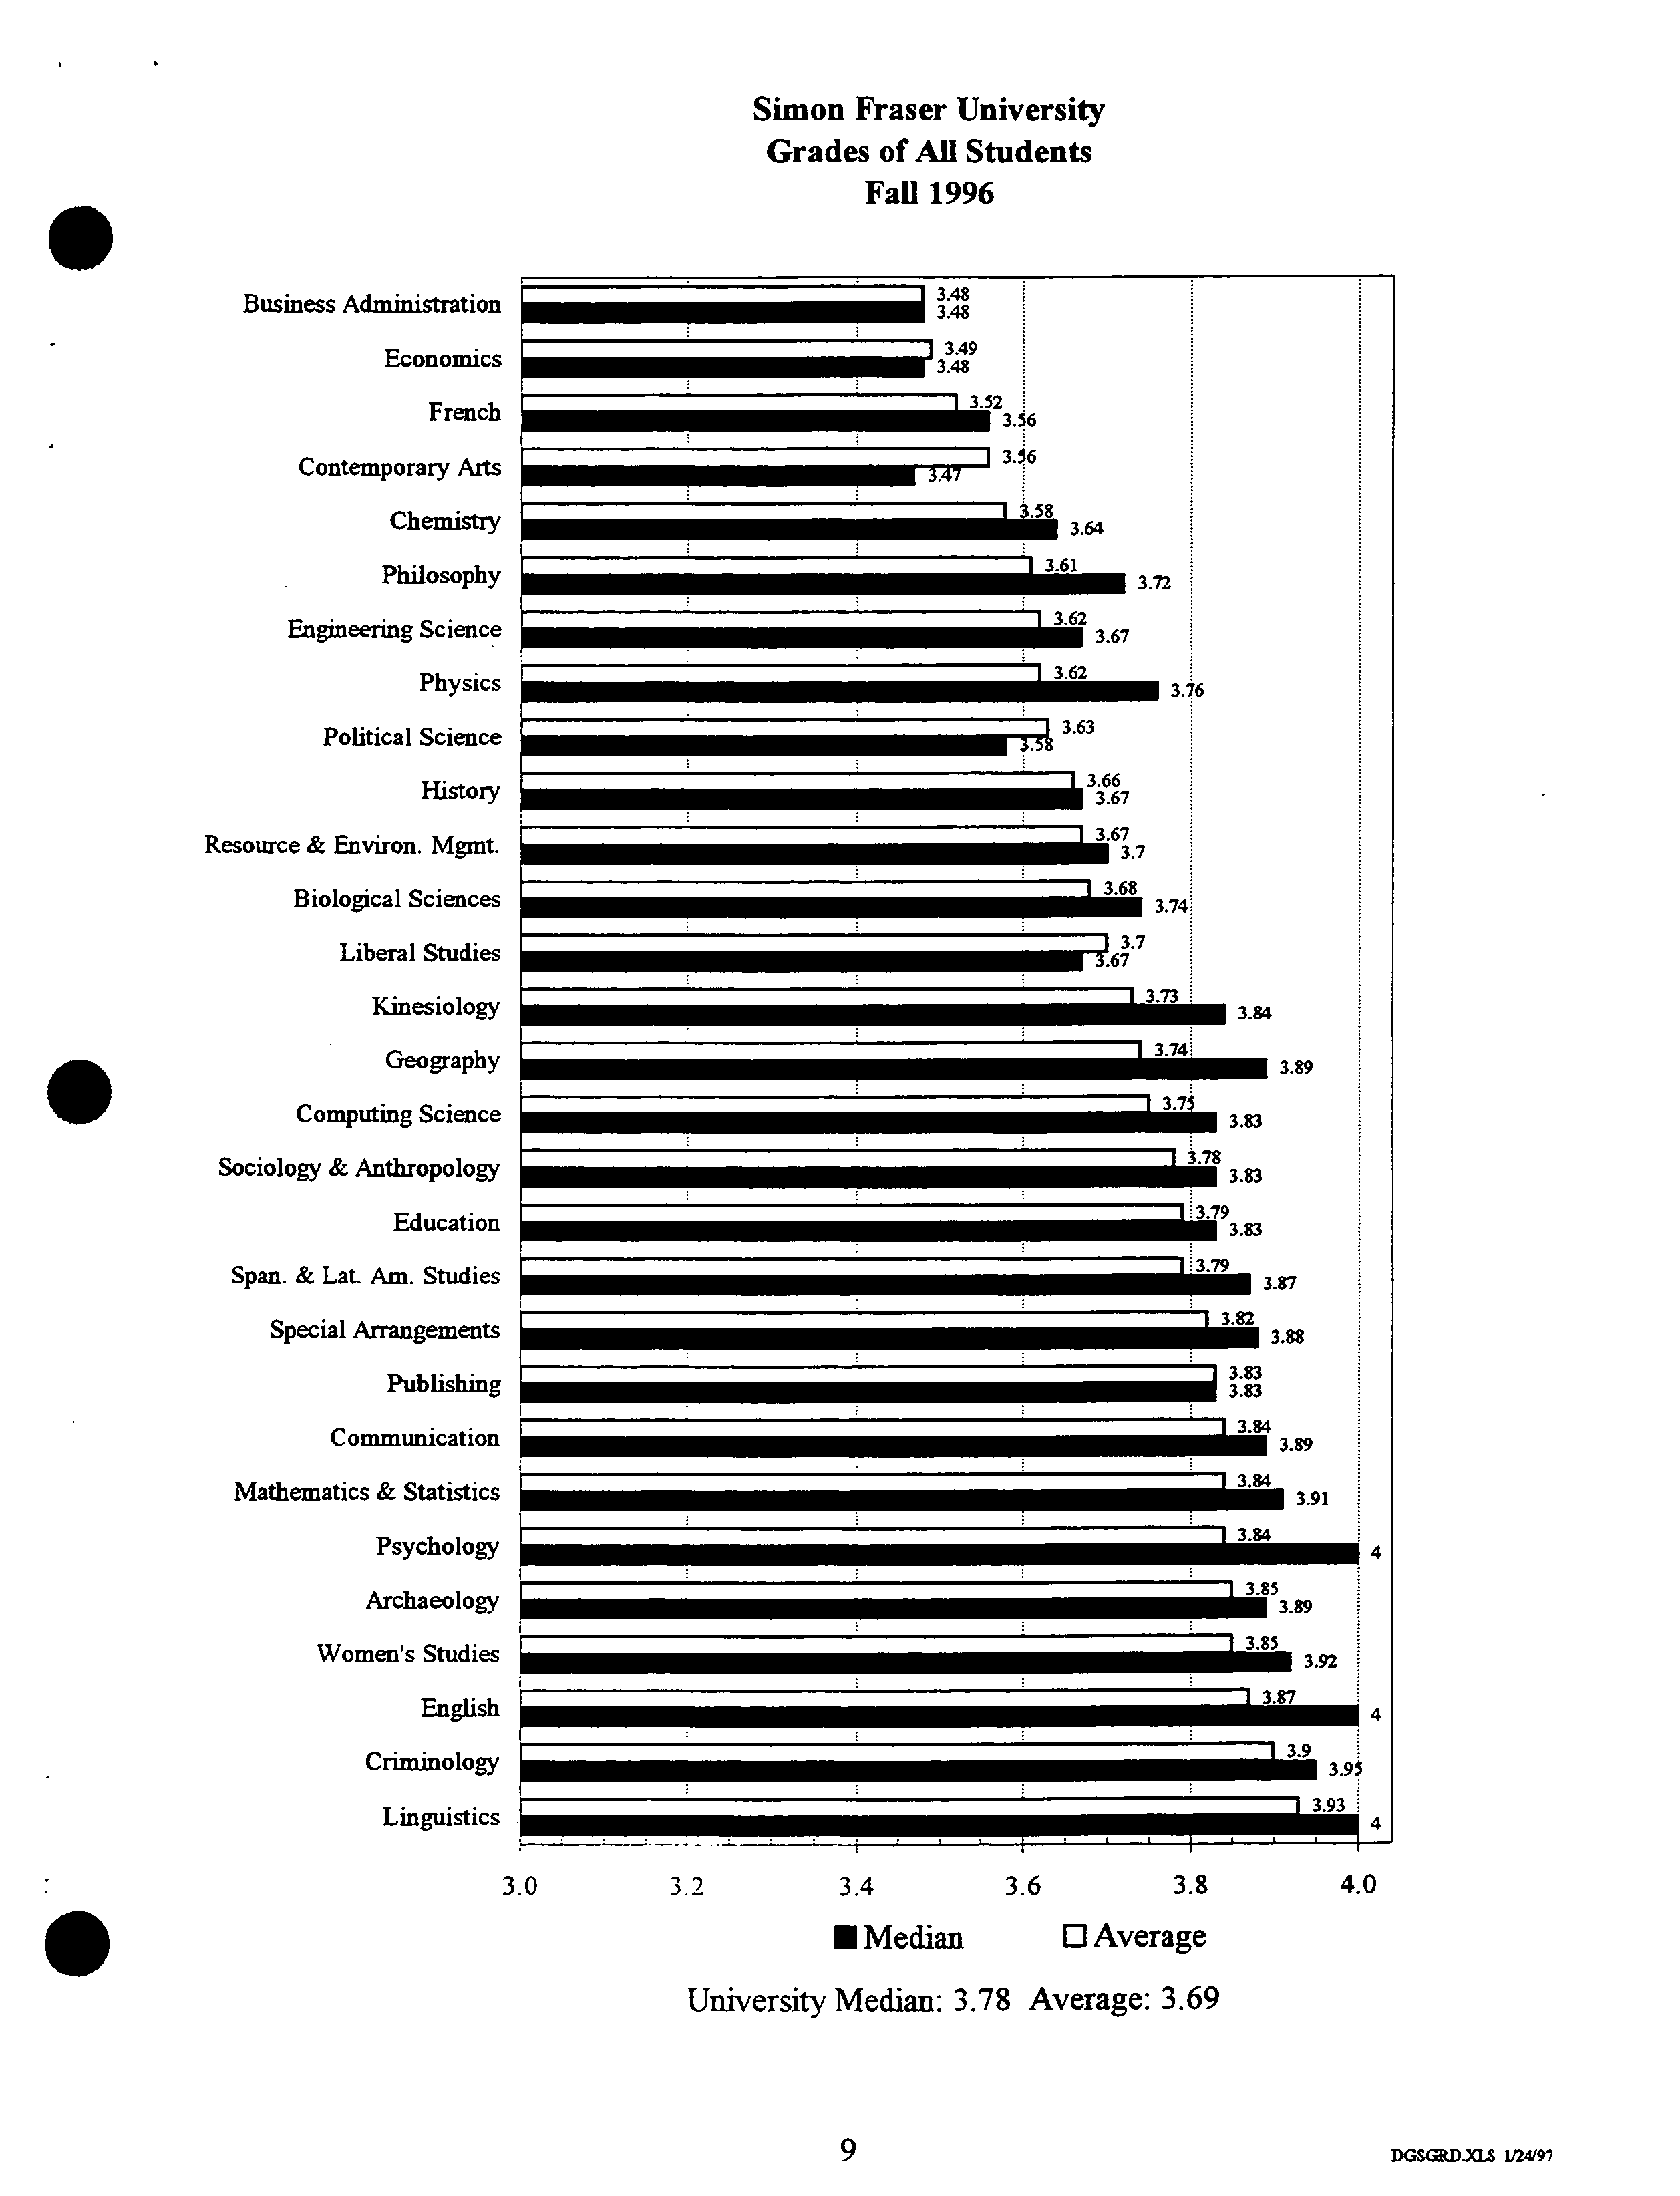
Simon Fraser University ?
Grades of All Students ?
Fall 1996
3.0
?
3.2 ?
3.4
?
3.6
?
3.8 ?
4.0
.
?
?
• Median ?
0 Average ?
University Median: 3.78 Average: 3.69
DGs.D.)as 1/24197
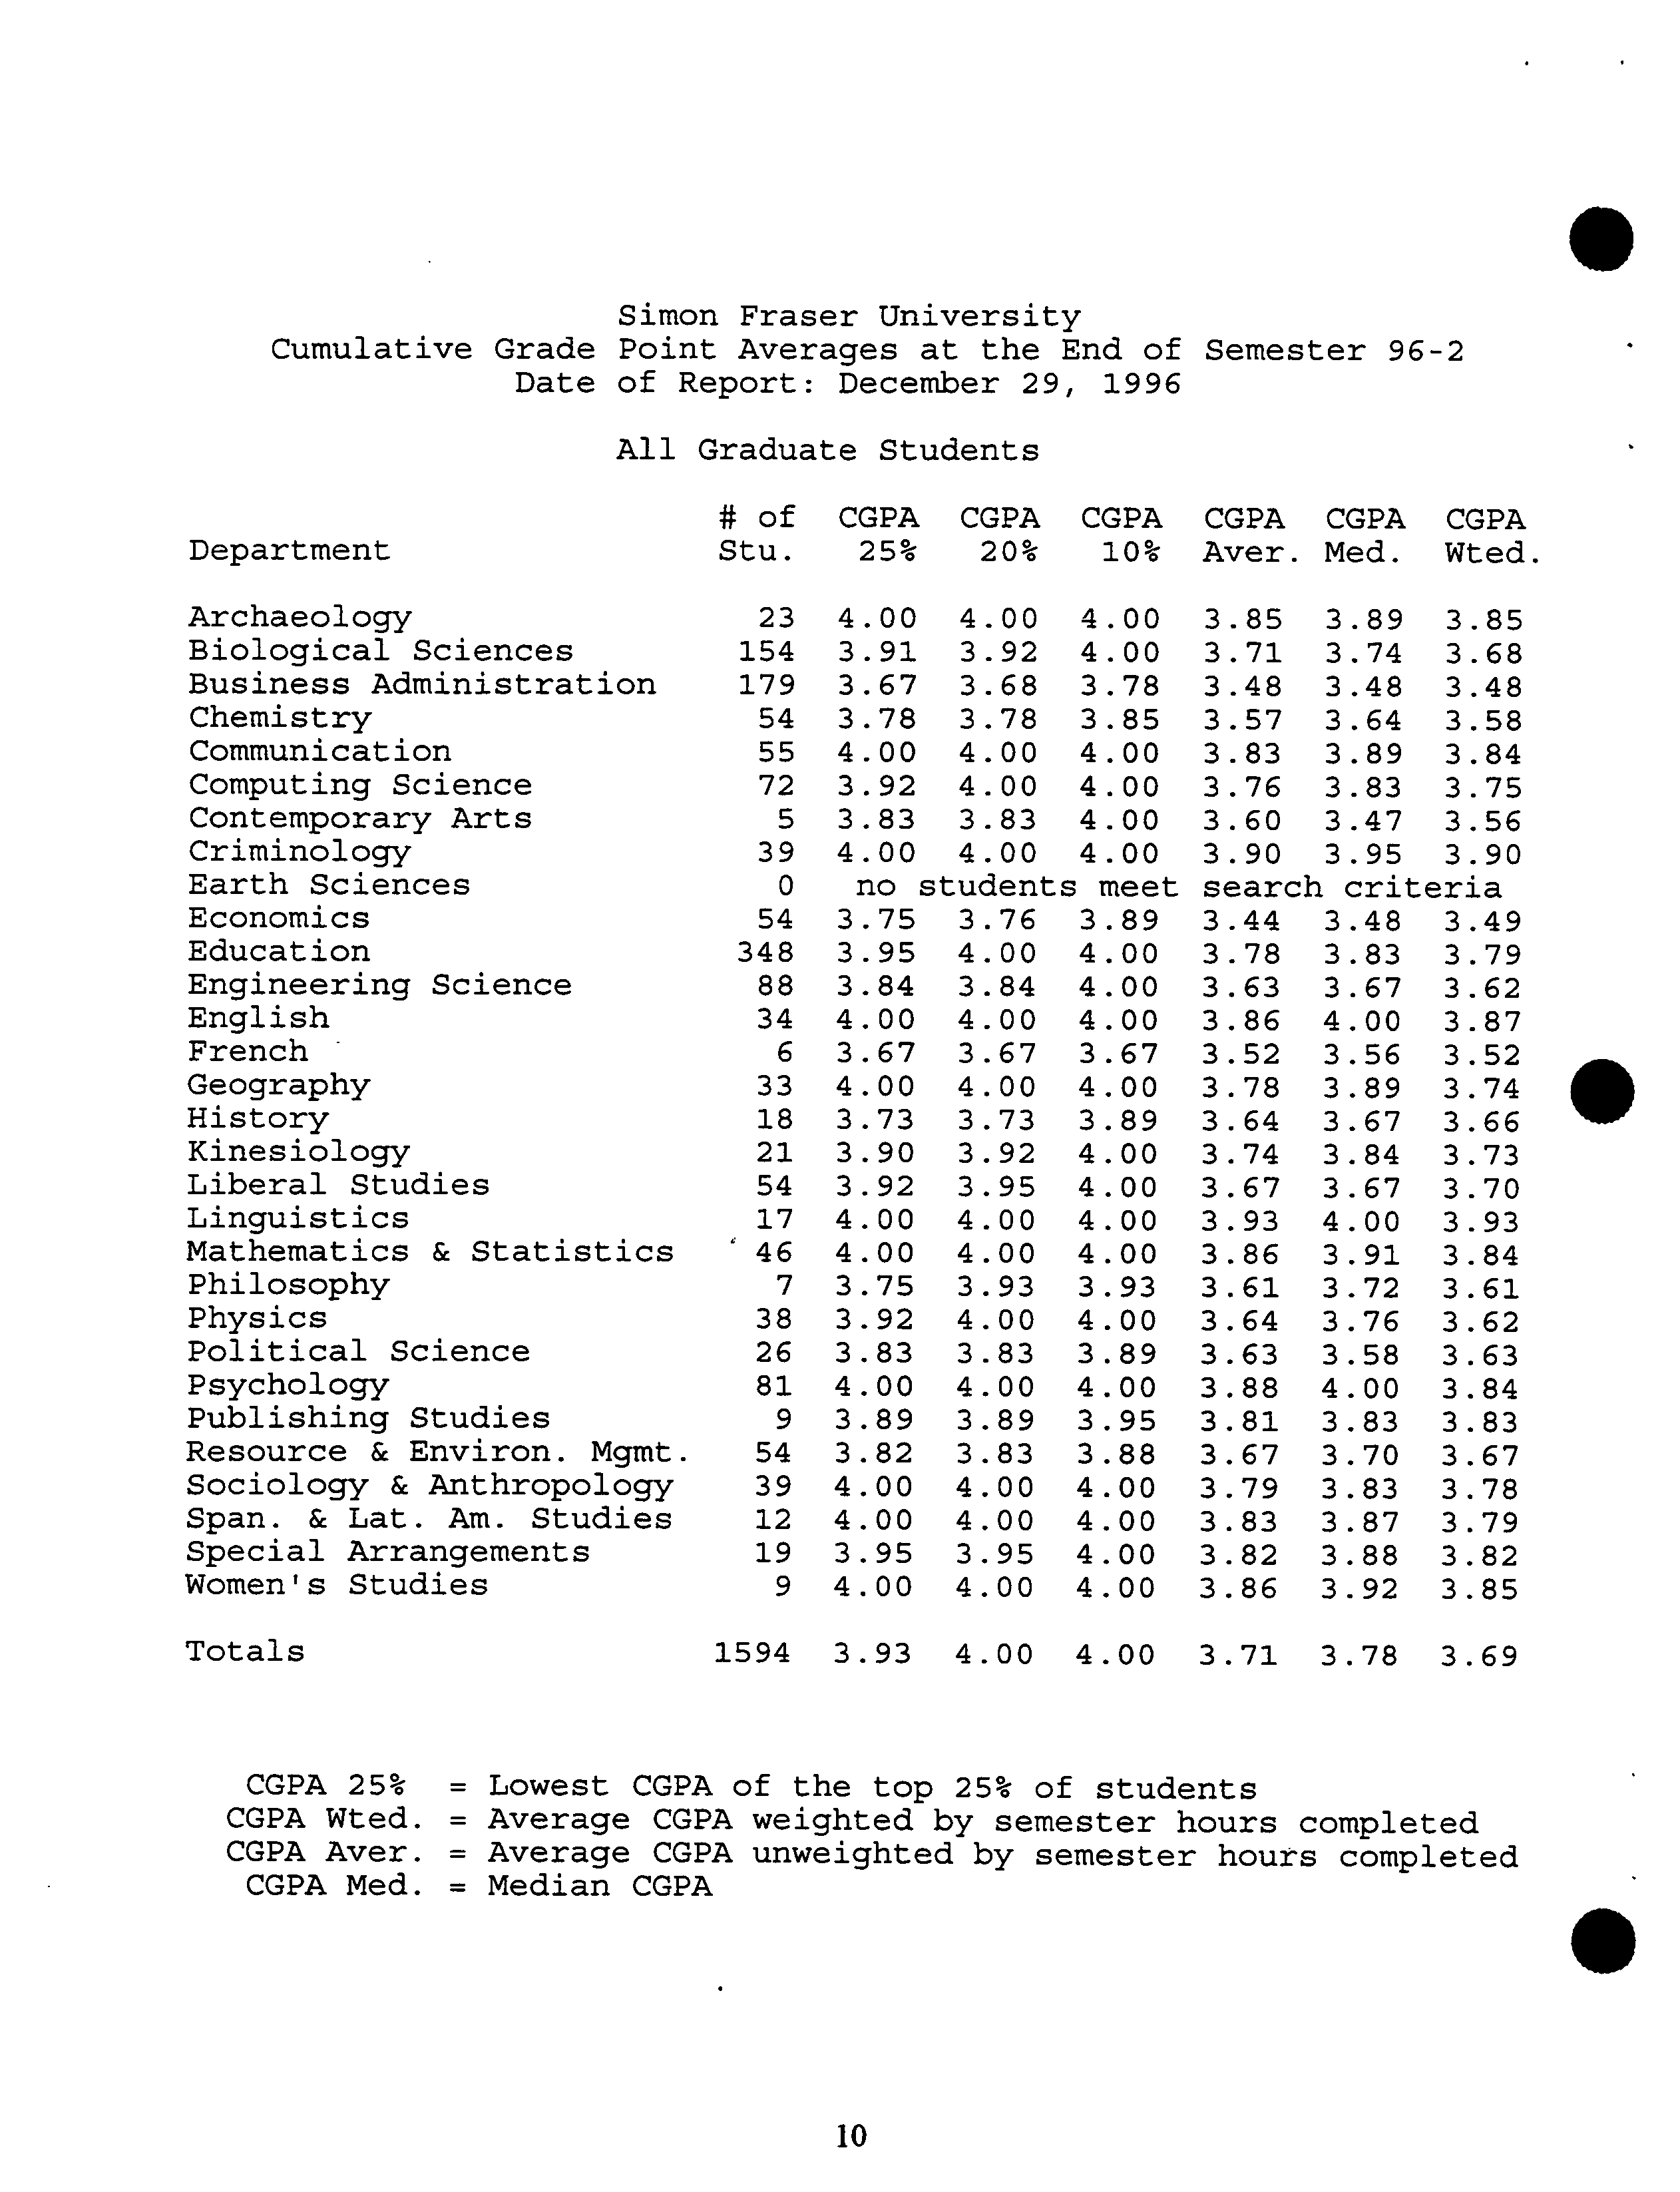
Simon Fraser University
Cumulative Grade Point Averages at the End of Semester 96-2
Date of Report: December 29, 1996
All Graduate Students
# of CGPA CGPA CGPA CGPA CGPA CGPA
Department ?
Stu. ?
25% ?
20%
?
1001 Aver. Med. Wted.
.
Archaeology
Biological Sciences
Business Administration
Chemistry
Communication
Computing Science
Contemporary Arts
Criminology
Earth Sciences
Economics
Education
Engineering Science
English
French
Geography
History
Kinesiology
Liberal Studies
Linguistics
Mathematics & Statistics
Philosophy
Physics
Political Science
Psychology
Publishing Studies
Resource & Environ. Mgmt.
Sociology & Anthropology
Span. & Lat. Am. Studies
Special Arrangements
Women's Studies
Totals
23
4.00
4.00
4.00
3.85 3.89
3.85
154
3.91 3.92 4.00
3.71 3.74
3.68
179 3.67
3.68 3.78 3.48
3.48
3.48
54 3.78 3.78
3.85
3.57
3.64 3.58
55 4.00 4.00 4.00
3.83 3.89
3.84
72
3.92
4.00 4.00
3.76
3.83 3.75
5 3.83
3.83 4.00
3.60
3.47
3.56
39 4.00
4.00 4.00
3.90 3.95
3.90
0 no
students
meet
search criteria
54 3.75
3.76
3.89
3.44 3.48
3.49
348
3.95 4.00 4.00
3.78
3.83
3.79
88 3.84
3.84 4.00
3.63 3.67
3.62
34
4.00 4.00
4.00
3.86
4.00
3.87
6
3.67
3.67 3.67
3.52
3.56
3.52
33 4.00
4.00 4.00
3.78
3.89 3.74
18 3.73
3.73
3.89
3.64 3.67
3.66
21 3.90
3.92
4.00
3.74
3.84
3.73
54 3.92
3.95
4.00
3.67 3.67
3.70
17
4.00
4.00
4.00
3.93
4.00
3.93
46 4.00
4.00
4.00
3.86
3.91
3.84
7
3.75
3.93
3.93
3.61 3.72
3.61
38
3.92 4.00
4.00
3.64
3.76
3.62
26
3.83
3.83 3.89
3.63 3.58
3.63
81 4.00
4.00
4.00
3.88 4.00
3.84
9 3.89
3.89
3.95
3.81
3.83 3.83
54 3.82
3.83 3.88
3.67
3.70
3.67
39
4.00
4.00 4.00
3.79
3.83 3.78
12
4.00
4.00 4.00
3.83 3.87
3.79
19
3.95
3.95 4.00
3.82
3.88 3.82
9 4.00
4.00
4.00
3.86
3.92 3.85
1594
3.93
4.00
4.00
3.71 3.78
3.69
S
CGPA 25% = Lowest CGPA of the top 25
0
1
of students
CGPA Wted. = Average CGPA weighted by semester hours completed
CGPA Aver. = Average CGPA unweighted by semester hours completed
CGPA Med. = Median CGPA
.
10
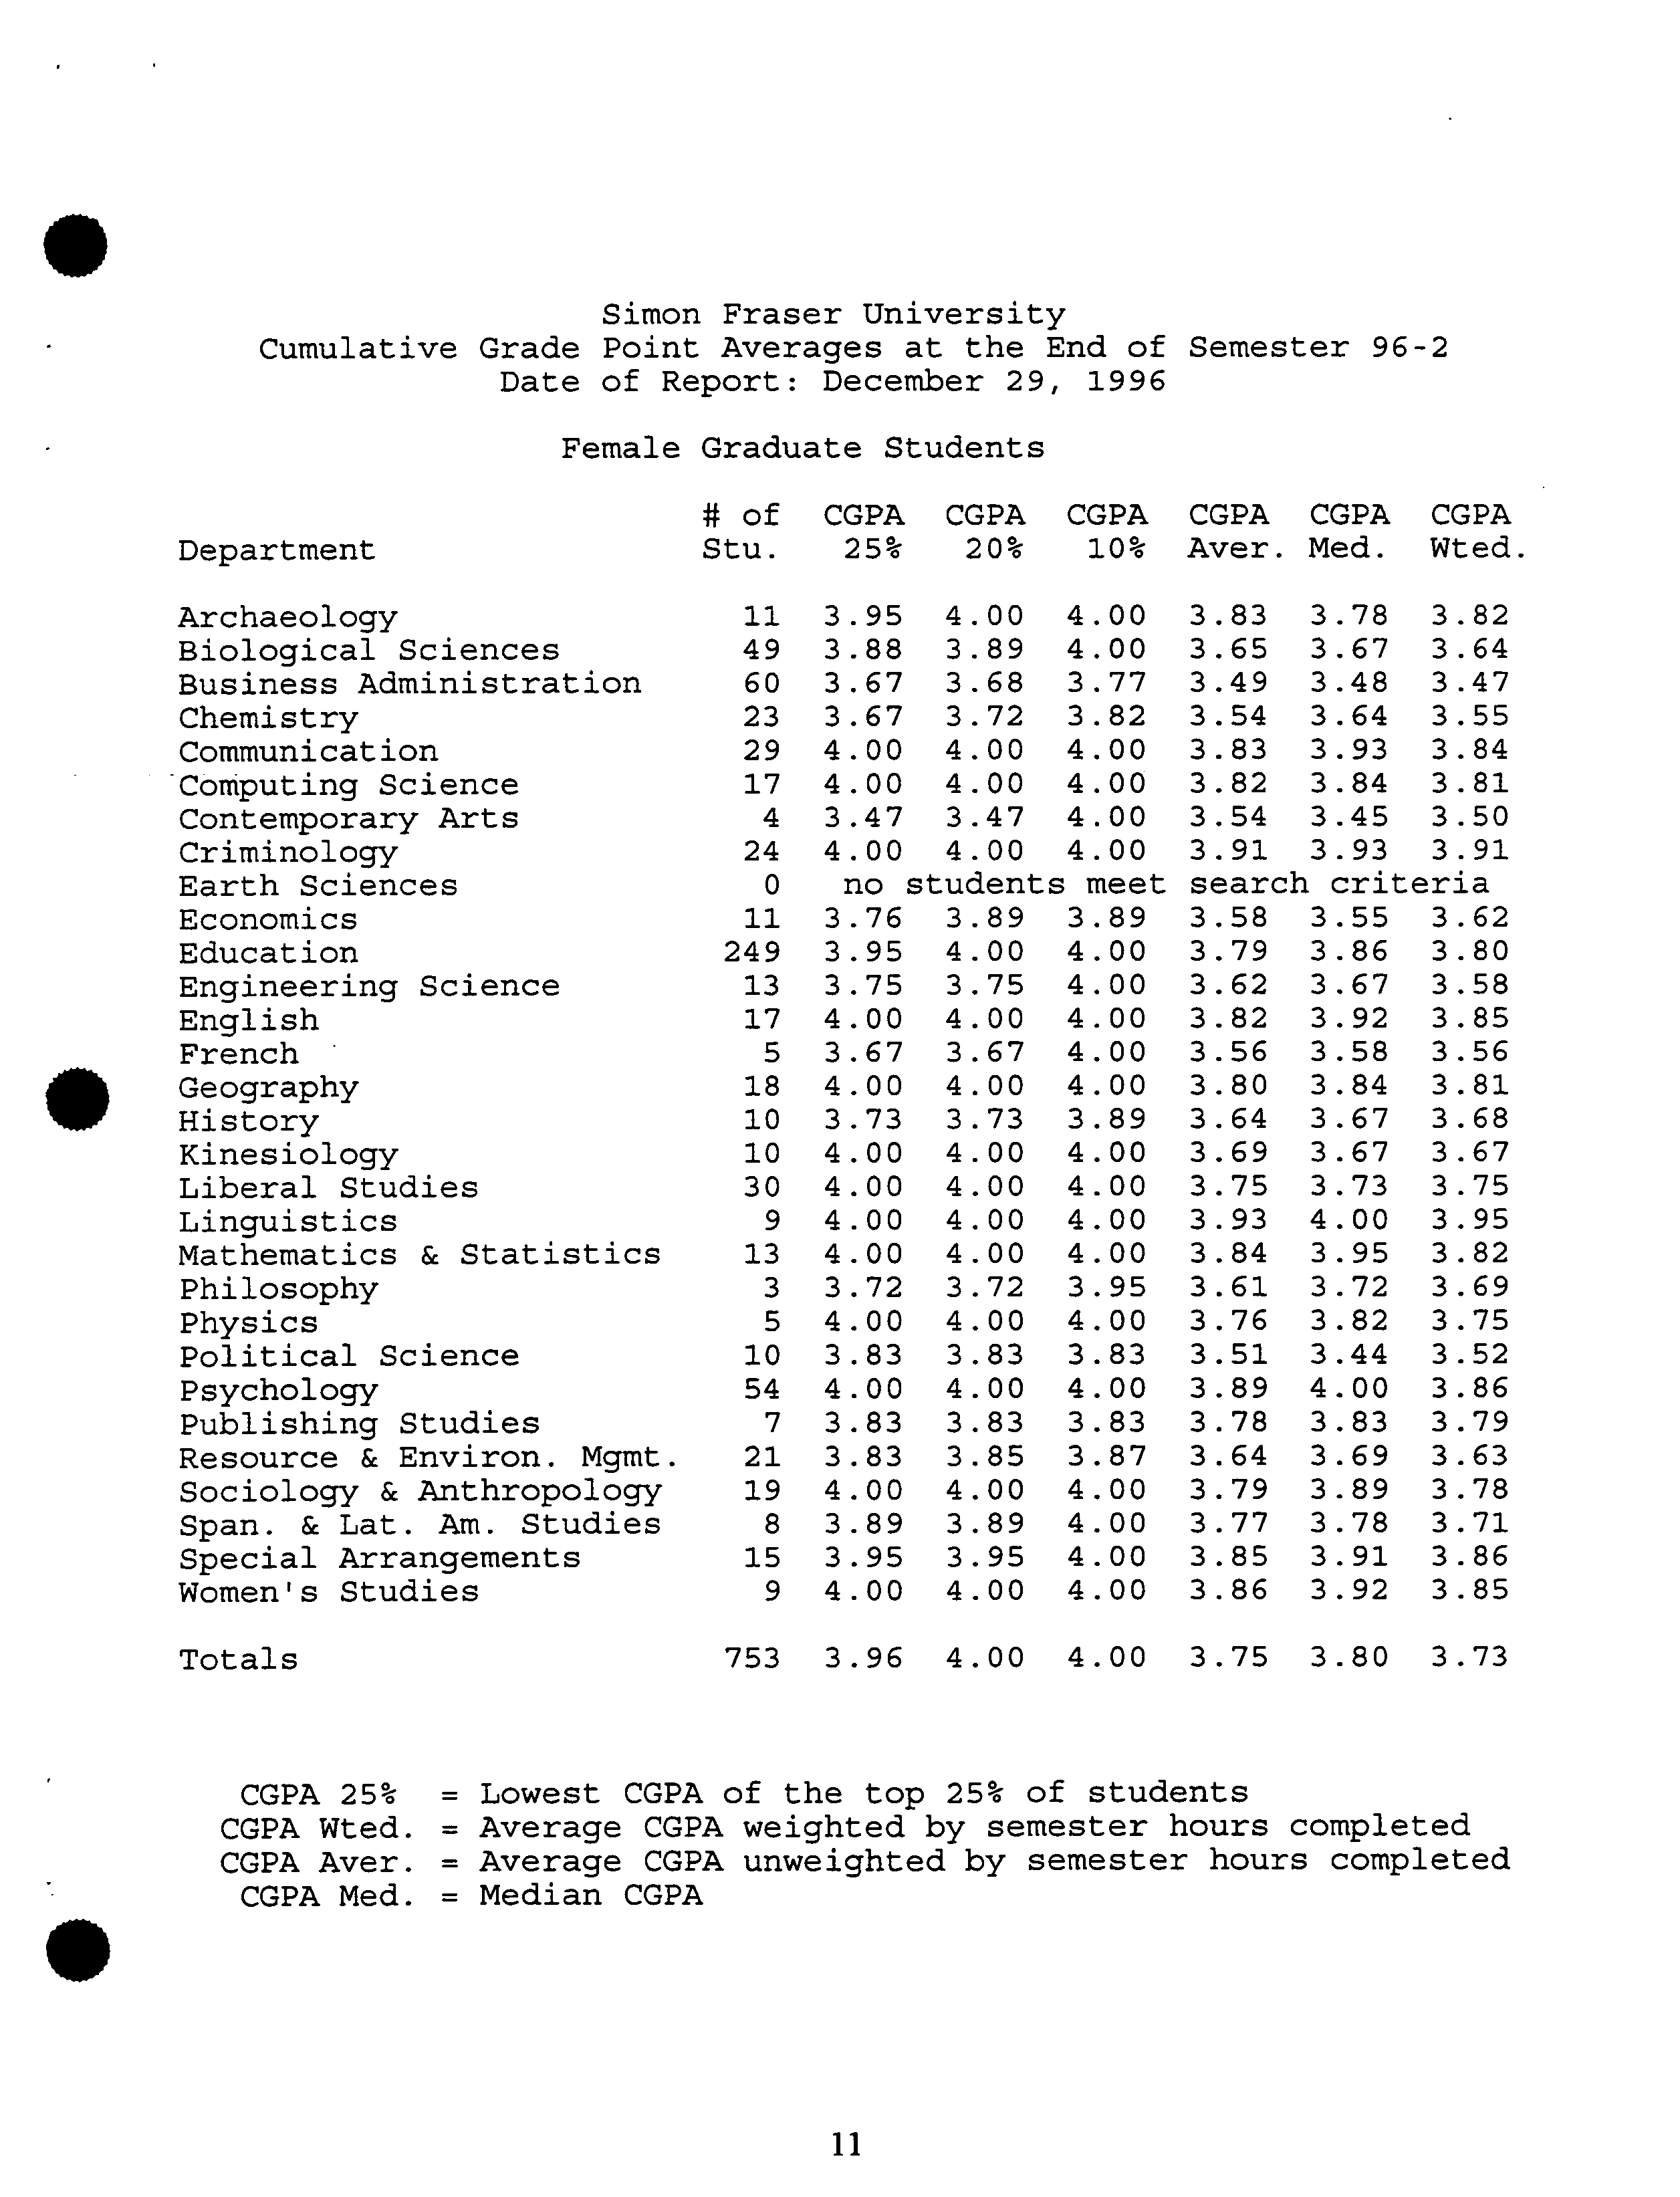
Simon Fraser University
Cumulative Grade Point Averages at the End of Semester 96-2
Date of Report: December 29, 1996
Female Graduate Students
# of CGPA CGPA CGPA CGPA CGPA CGPA
Department ?
Stu. ?
2501 ?
20% ?
10% Aver. Med. Wted.
.
Archaeology
Biological Sciences
Business Administration
Chemistry
Communication
Coniputing Science
Contemporary Arts
Criminology
Earth Sciences
Economics
Education
Engineering Science
English
French
Geography
History
Kinesiology
Liberal Studies
Linguistics
Mathematics & Statistics
Philosophy
Physics
Political Science
Psychology
Publishing Studies
Resource & Environ. Mgmt.
Sociology & Anthropology
Span. & Lat. Am. Studies
Special Arrangements
Women's Studies
Totals
11 3.95
4.00 4.00 3.83
3.78 3.82
49 3.88
3.89 4.00 3.65
3.67 3.64
60
3.67
3.68
3.77
3.49 3.48
3.47
23
3.67
3.72 3.82 3.54 3.64 3.55
29 4.00
4.00 4.00 3.83
3.93 3.84
17 4.00
4.00 4.00
3.82
3.84
3.81
4
3.47 3.47 4.00
3.54 3.45 3.50
24 4.00 4.00
4.00 3.91 3.93 3.91
0
no students
meet search criteria
11
3.76 3.89 3.89
3.58 3.55 3.62
249 3.95
4.00 4.00
3.79
3.86
3.80
13 3.75
3.75 4.00 3.62 3.67 3.58
17
4.00 4.00
4.00 3.82 3.92 3.85
5
3.67 3.67
4.00 3.56 3.58 3.56
18
4.00 4.00 4.00
3.80 3.84 3.81
10
3.73
3.73 3.89
3.64 3.67 3.68
10 4.00 4.00
4.00 3.69
3.67 3.67
30
4.00 4.00
4.00 3.75 3.73
3.75
9 4.00
4.00 4.00
3.93
4.00
3.95
13 4.00
4.00 4.00
3.84 3.95
3.82
3
3.72
3.72 3.95 3.61 3.72
3.69
5 4.00
4.00
4.00 3.76
3.82
3.75
10
3.83 3.83
3.83 3.51 3.44
3.52
54 4.00
4.00 4.00 3.89
4.00 3.86
7
3.83
3.83 3.83
3.78 3.83
3.79
21 3.83 3.85
3.87
3.64
3.69
3.63
19
4.00 4.00
4.00 3.79 3.89
3.78
8
3.89
3.89
4.00 3.77 3.78
3.71
15 3.95
3.95
4.00 3.85 3.91 3.86
9
4.00
4.00 4.00
3.86 3.92 3.85
753 3.96 4.00
4.00
3.75
3.80
3.73
CGPA 25
0
1
= Lowest CGPA of the top 25
1
1
of students
CGPA Wted. = Average CGPA weighted by semester hours completed
CGPA Aver. = Average CGPA unweighted by semester hours completed
CGPA Med. = Median CGPA
.
11
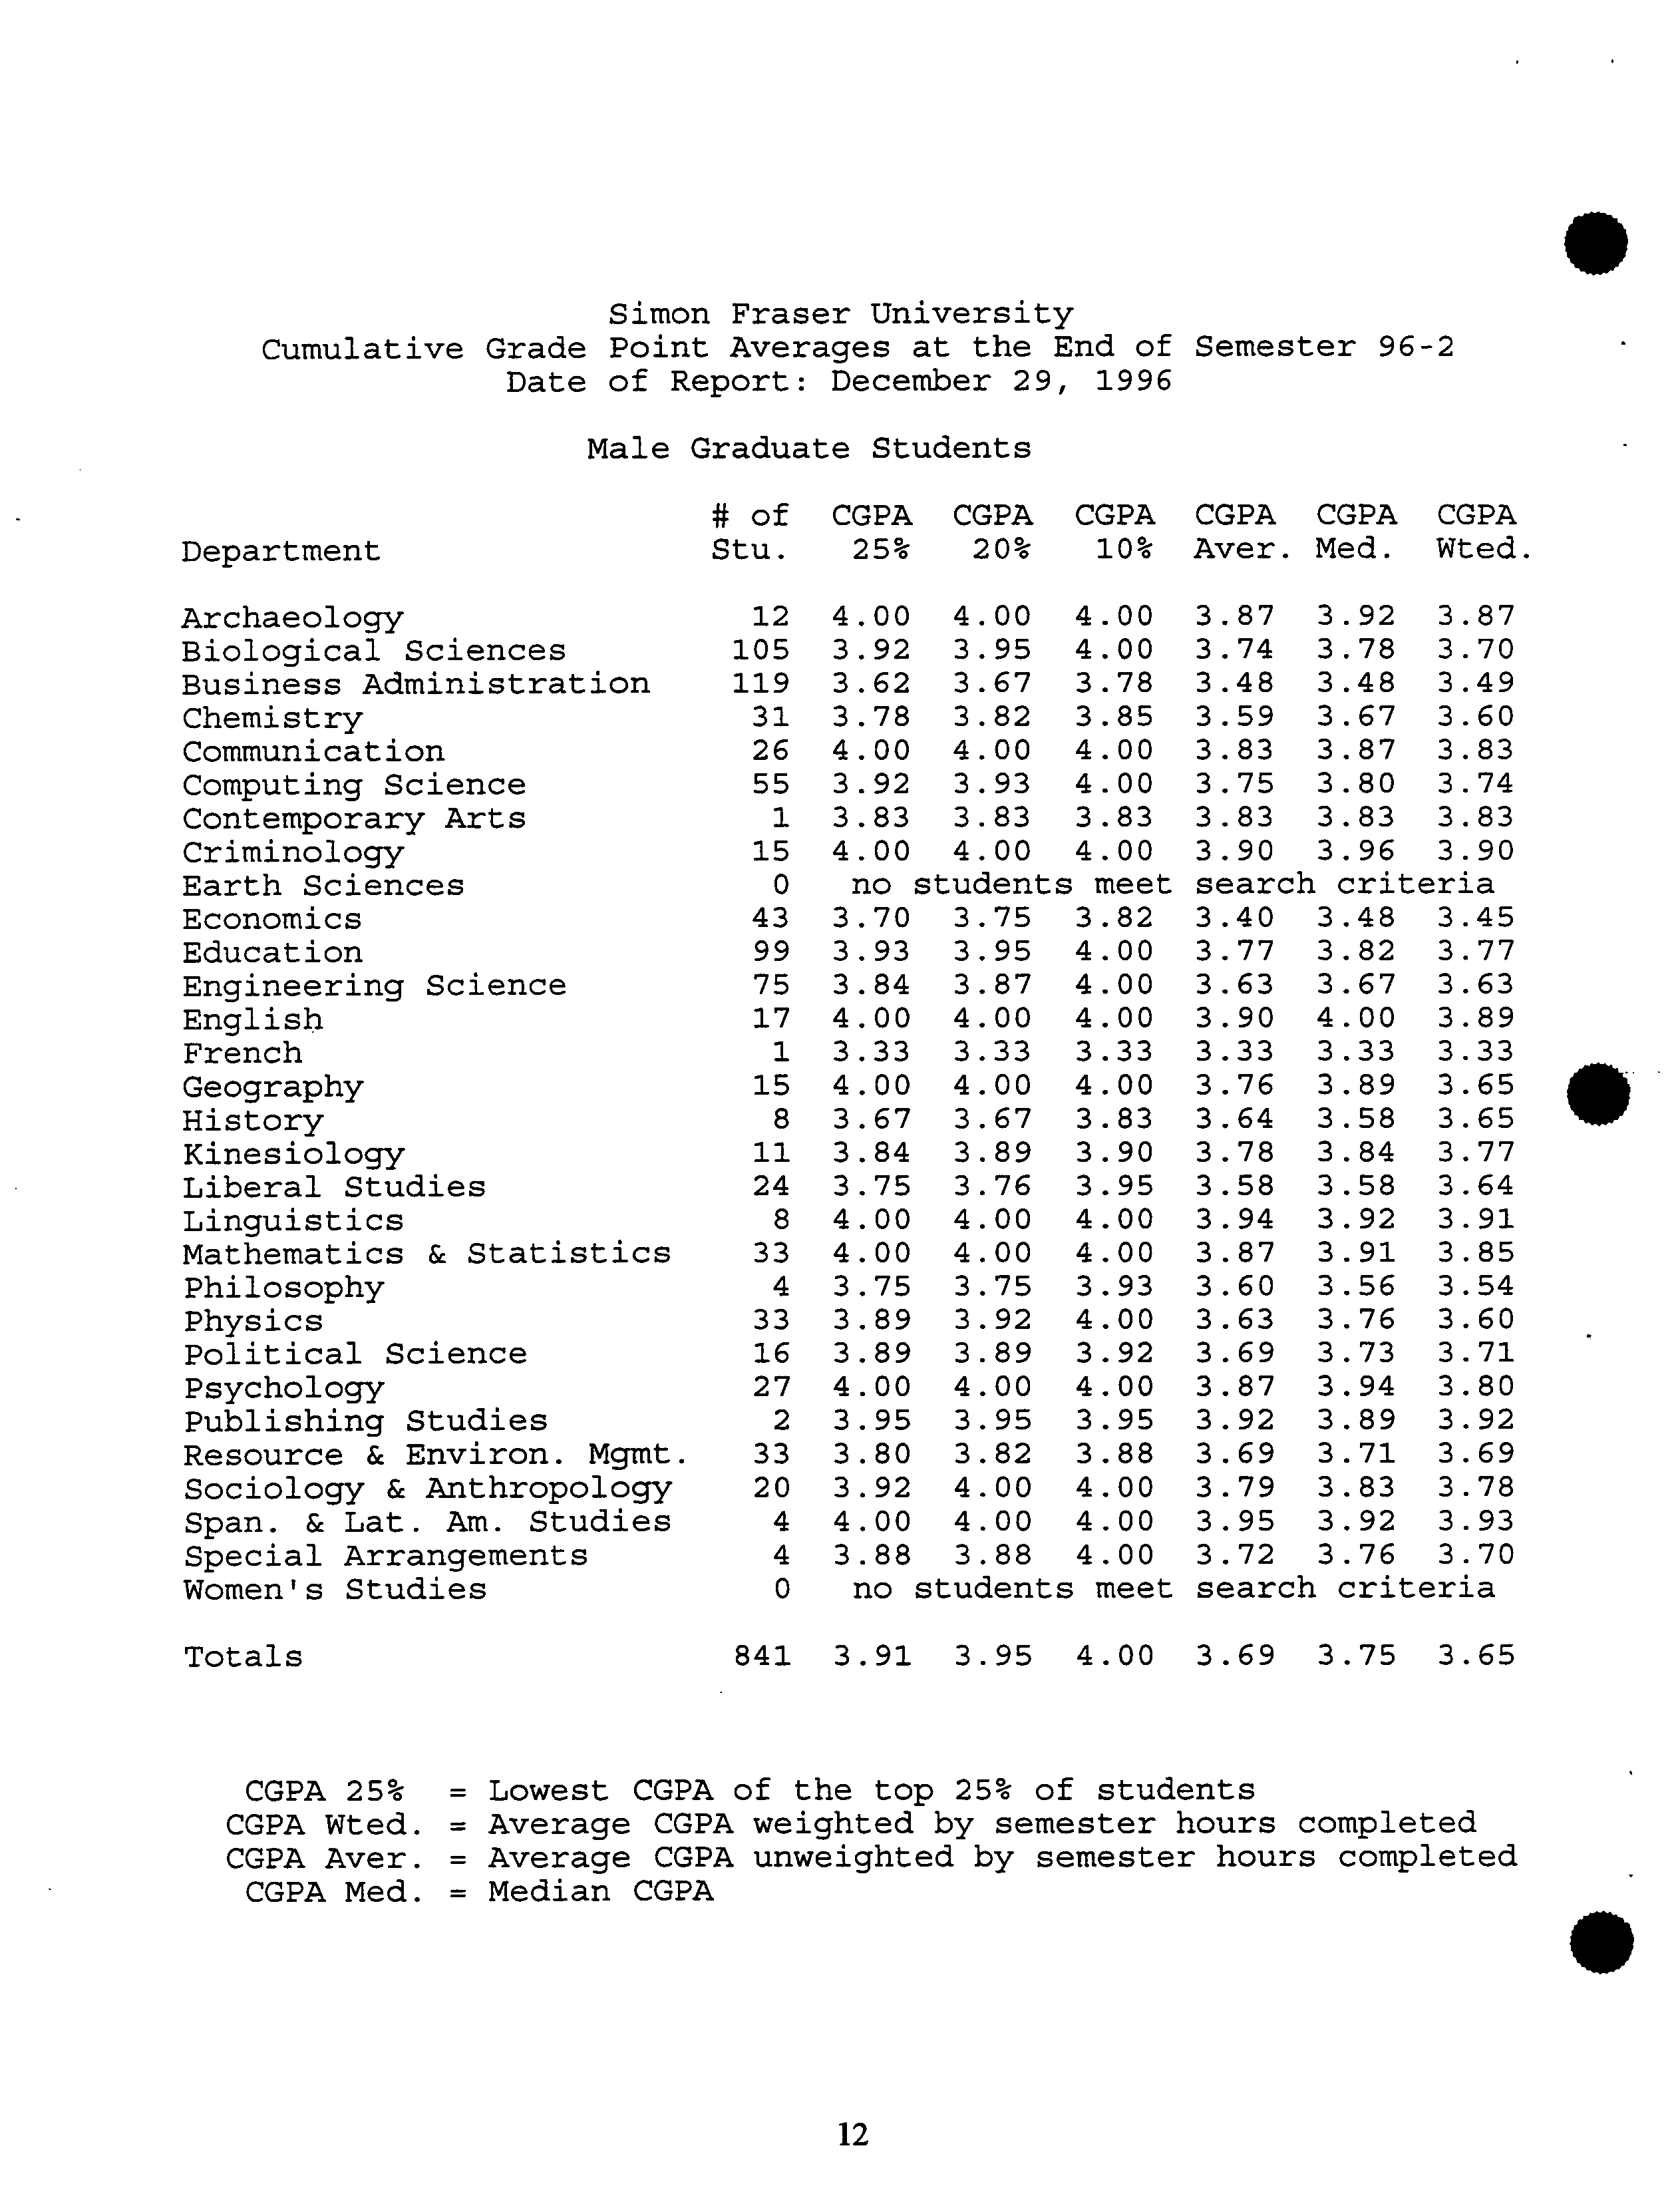
Simon Fraser University
Cumulative Grade Point Averages at the End of Semester 96-2
Date of Report: December 29, 1996
Male Graduate Students
# of CGPA CGPA CGPA CGPA CGPA CGPA
Department ?
Stu. ?
25% ?
20% ?
100i Aver. Med. Wted.
Archaeology
12 4.00 4.00 4.00
3.87 3.92 3.87
Biological Sciences
105 3.92 3.95
4.00
3.74 3.78
3.70
Business Administration
119 3.62
3.67 3.78 3.48 3.48 3.49
Chemistry
31
3.78 3.82 3.85 3.59
3.67
3.60
Communication
26 4.00
4.00 4.00 3.83 3.87 3.83
Computing Science
55
3.92 3.93 4.00
3.75 3.80 3.74
Contemporary Arts
1
3.83
3.83 3.83 3.83 3.83 3.83
Criminology
15
4.00 4.00 4.00 3.90 3.96
3.90
Earth Sciences
0 no
students meet search
criteria
Economics
43
3.70
3.75
3.82 3.40 3.48
3.45
Education
99 3.93
3.95
4.00 3.77 3.82 3.77
Engineering Science
75 3.84
3.87
4.00
3.63
3.67 3.63
English
17 4.00 4.00 4.00 3.90
4.00
3.89
French
1 3.33
3.33 3.33 3.33 3.33 3.33
Geography
15 4.00 4.00 4.00
3.76
3.89 3.65
History
8
3.67 3.67
3.83
3.64 3.58 3.65
Kinesiology
11 3.84 3.89 3.90
3.78
3.84
3.77
Liberal Studies
24 3.75 3.76 3.95 3.58 3.58
3.64
Linguistics
8 4.00 4.00
4.00 3.94 3.92 3.91
Mathematics & Statistics
33 4.00 4.00 4.00
3.87 3.91 3.85
Philosophy
4
3.75 3.75 3.93 3.60 3.56
3.54
Physics
33 3.89
3.92 4.00 3.63
3.76
3.60
Political Science
16 3.89 3.89
3.92 3.69 3.73
3.71
Psychology
27 4.00 4.00 4.00
3.87 3.94 3.80
Publishing Studies
2
3.95 3.95
3.95 3.92 3.89
3.92
Resource & Environ. Mgmt. 33
3.80
3.82 3.88 3.69
3.71 3.69
Sociology & Anthropology
20 3.92 4.00 4.00
3.79 3.83
3.78
Span. & Lat. Am. Studies
4 4.00
4.00 4.00
3.95
3.92 3.93
Special Arrangements
4 3.88 3.88 4.00
3.72 3.76 3.70
Women's Studies
0
no
students
meet search
criteria
Totals
841
3.91 3.95
4.00 3.69 3.75 3.65
CGPA 25% = Lowest CGPA of the top 25% of students
CGPA Wted. = Average CGPA weighted by semester hours completed
CGPA Aver. = Average CGPA unweighted by semester hours completed
CGPA Med. = Median CGPA
.
.
12
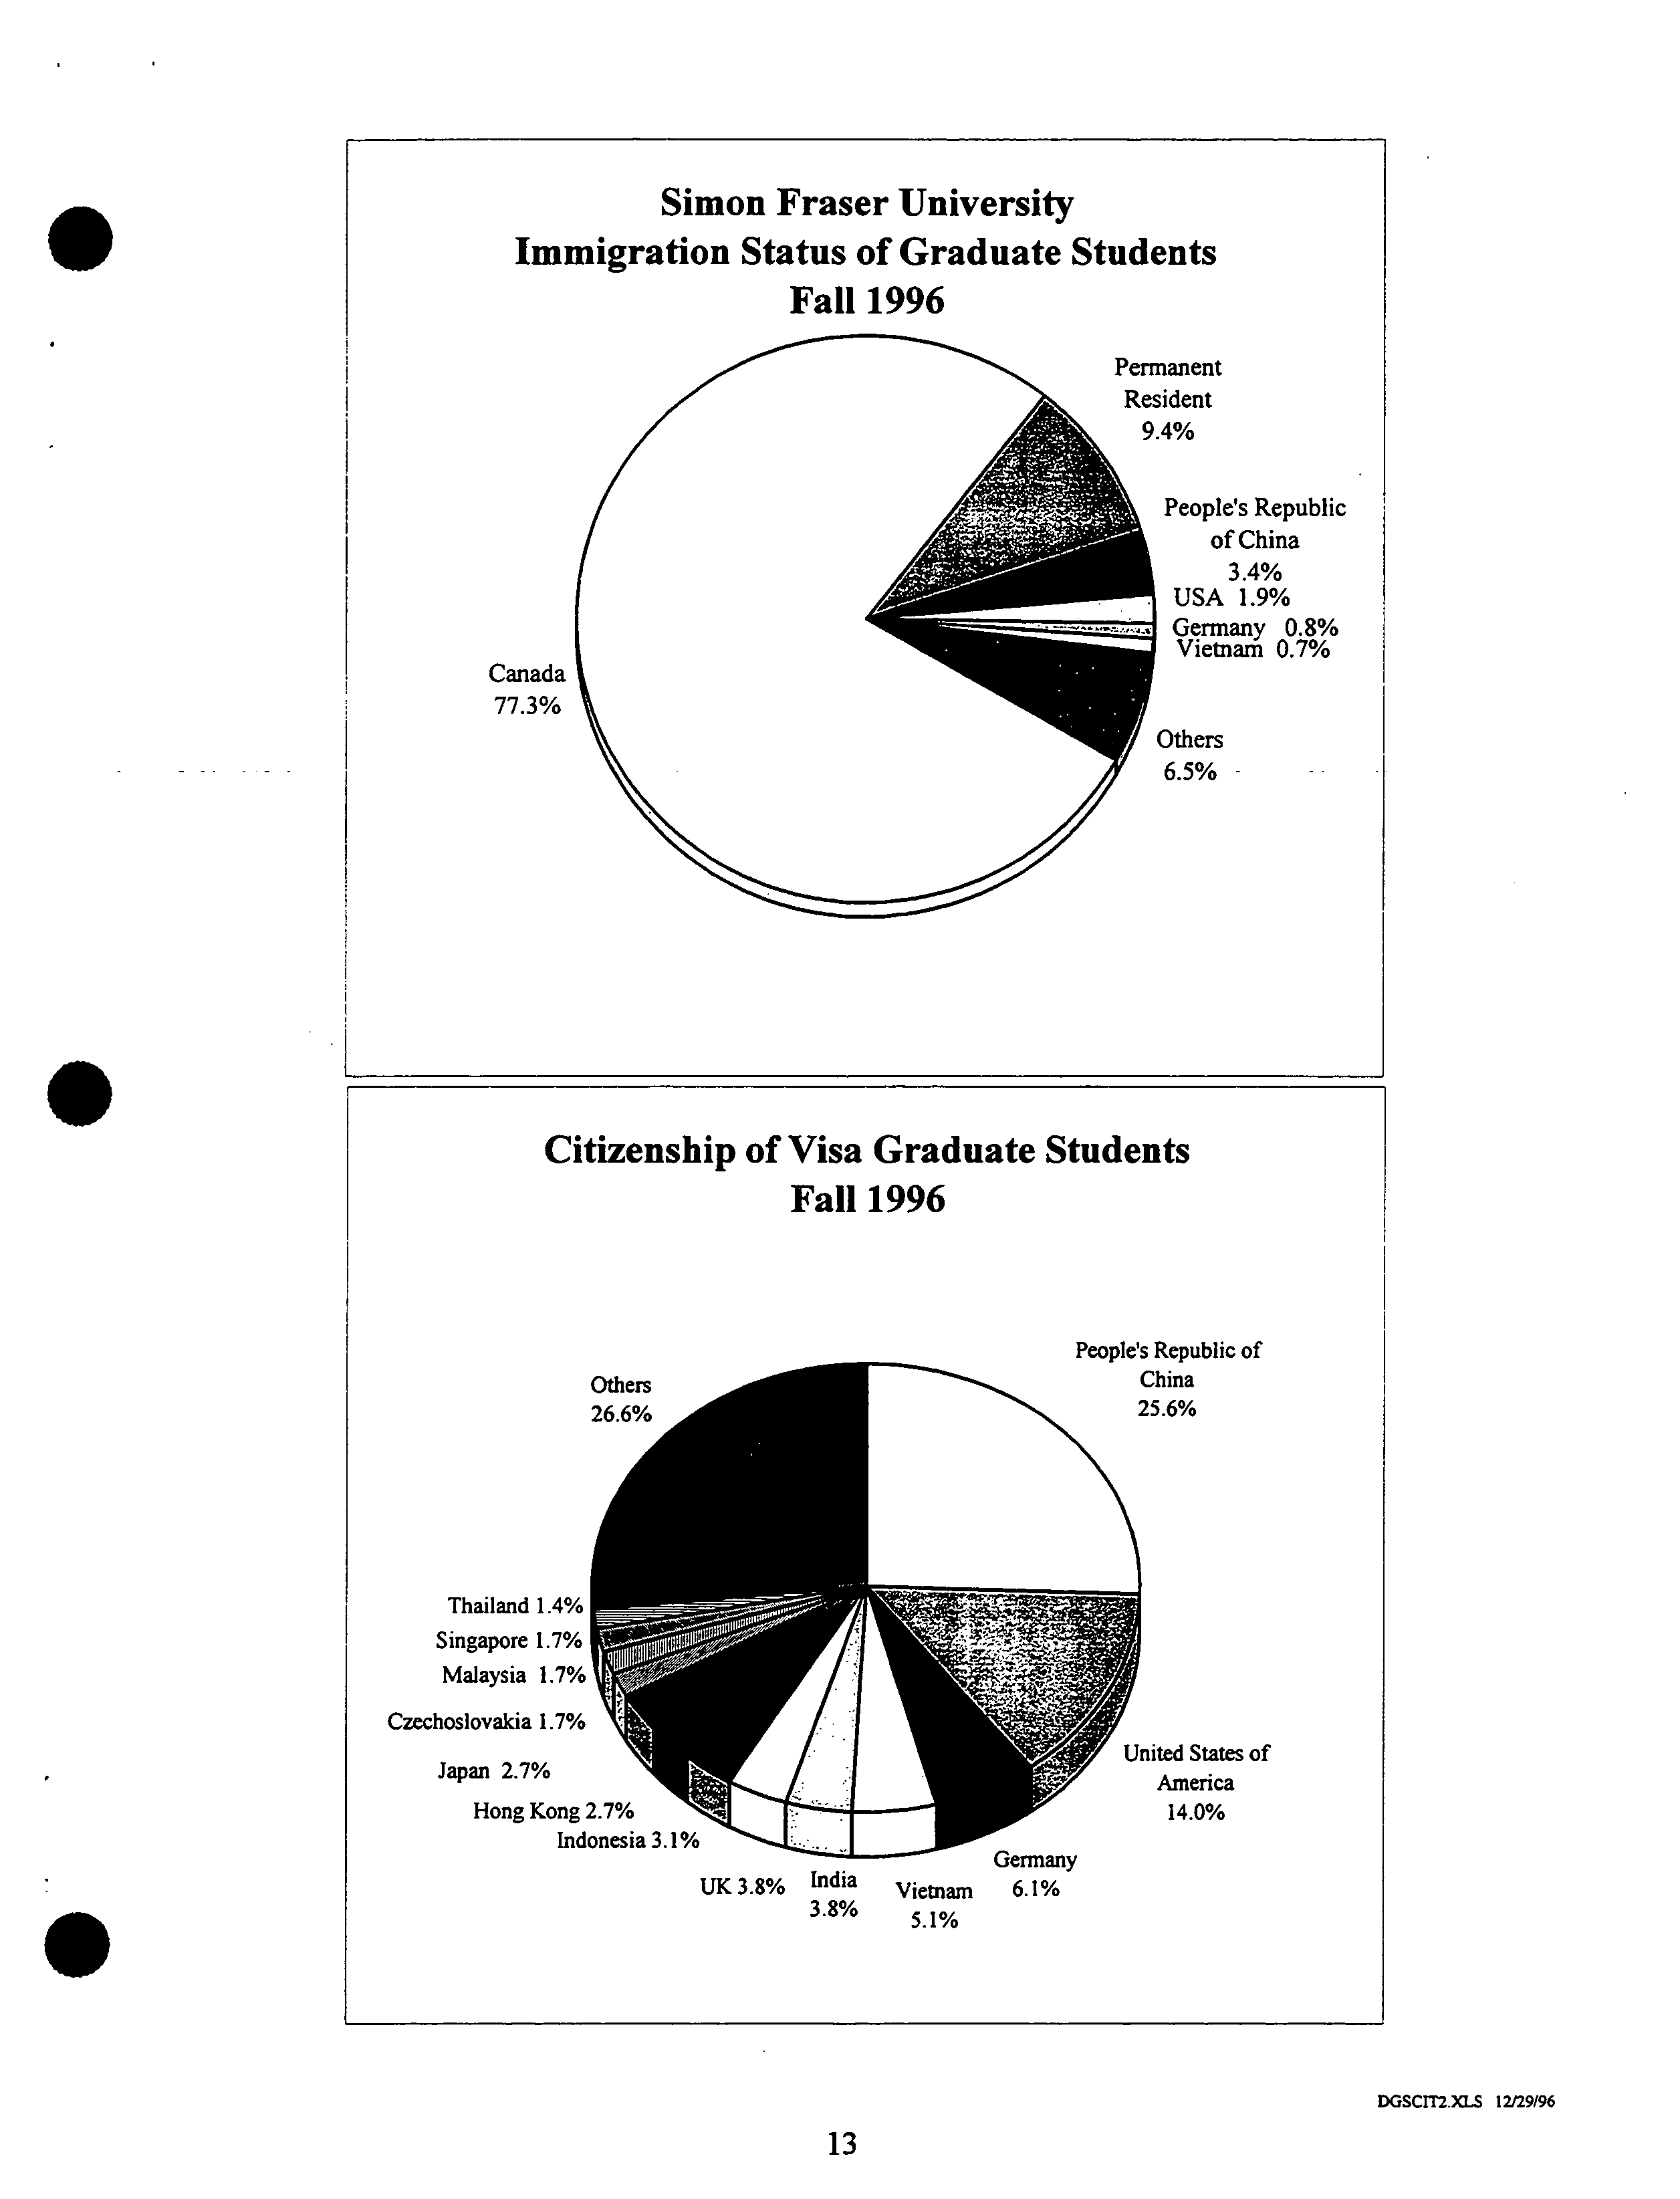
Simon Fraser University?
Immigration Status of Graduate Students
?
Fall 1996
People's Republic?
of China
3.4%
USA 1.9%
Germany 0.8%
Vietnam 0.7%
.
Citizenship of Visa Graduate Students
Fall 1996
People's Republic of
Others
China
26.6%
25.6%
Thailand 1.4%
Singapore 1.7%
..
Malaysia 1.7%
?
.
Czechoslovakia 1.7%
United States of
Japan 2.7%
America
Hong Kong 2.7%
.
?
14.0%
Indonesia 3. I
Germany
UK 3.8%
India ?
Vietnam
?
6.1%
38°'
?
5.1%
DGSCIT2.XLS
12/29/96
13
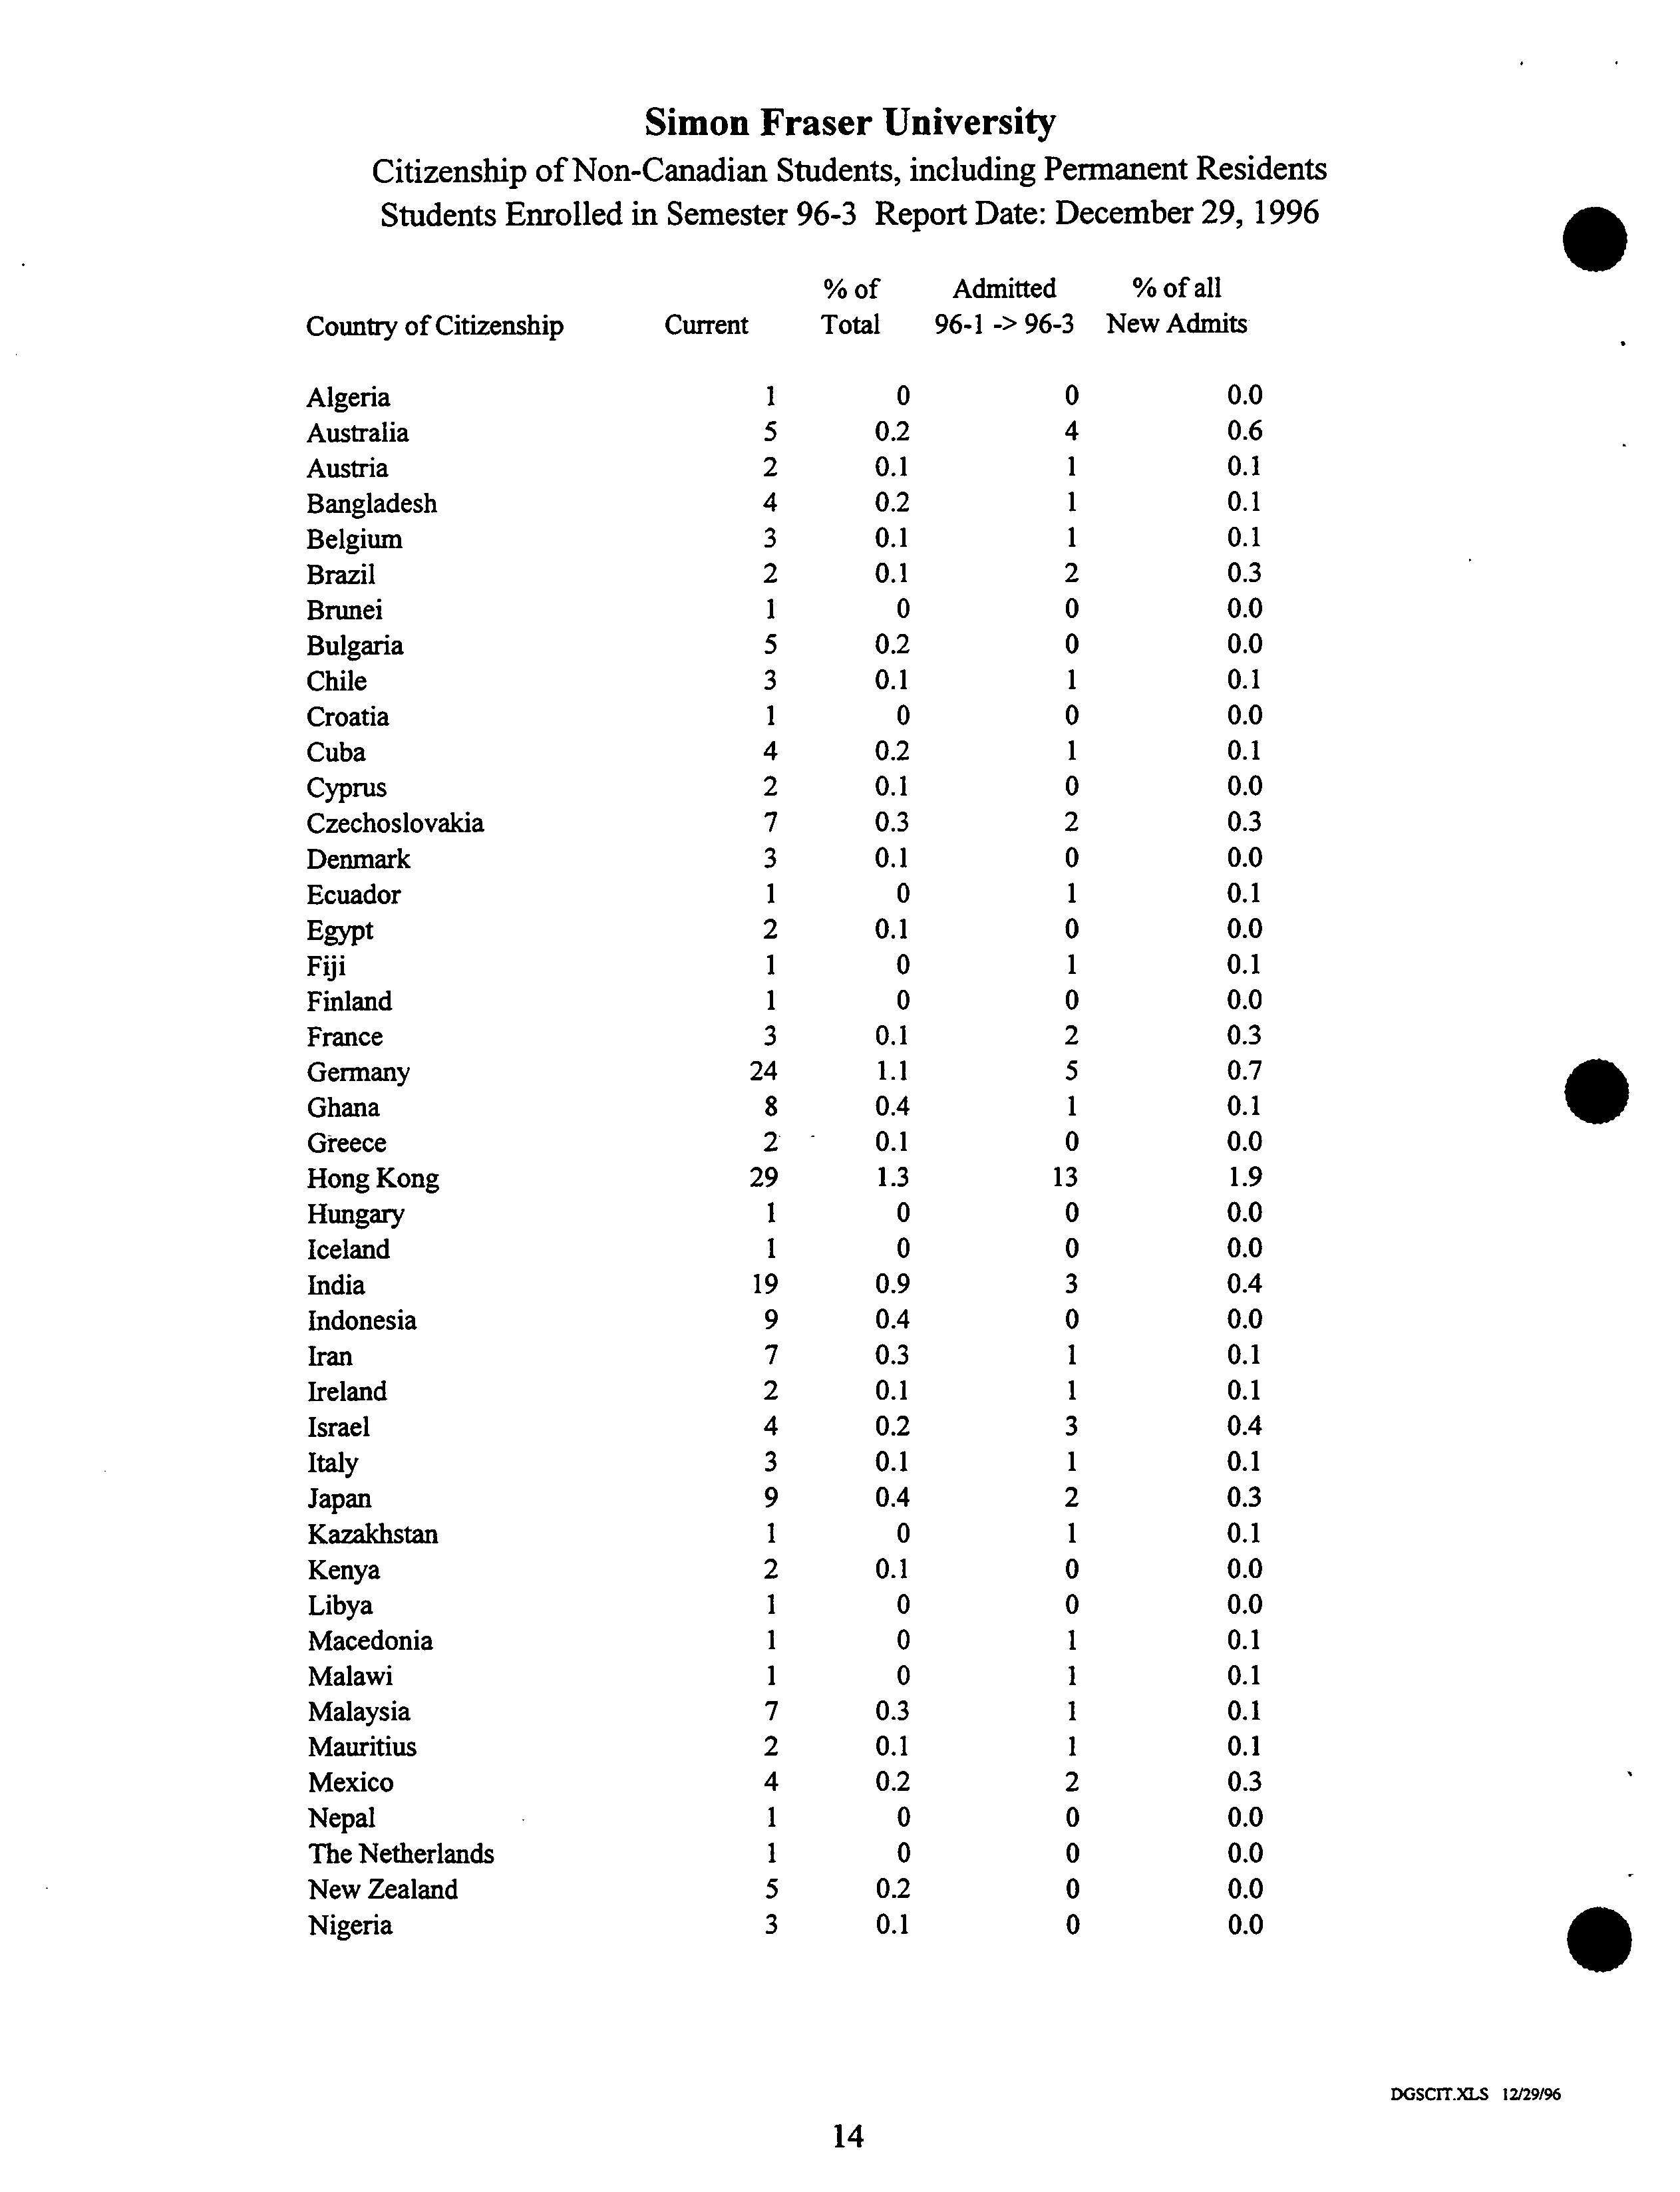
Simon Fraser University
Citizenship of Non-Canadian Students, including Permanent Residents
Students Enrolled in Semester 96-3 Report Date: December 29, 1996
%
of
?
Admitted
% of all
Country of Citizenship
Current
Total
?
96-1 -> 96-3
New Admits
Algeria
1
0 ?
0
0.0
Australia
5
0.2 ?
4
0.6
Austria
2
0.1 ?
1
0.1
Bangladesh
4
0.2 ?
1
0.1
Belgium
3
0.1
?
1
0.1
Brazil
2
0.1 ?
2
0.3
Brunei
1
0 ?
0
0.0
Bulgaria
5
0.2
?
0
0.0
Chile
3
0.1 ?
1
0.1
Croatia
1
0 ?
0
0.0
Cuba
4
0.2 ?
1
0.1
Cyprus
2
0.1 ?
0
0.0
Czechoslovakia
7
0.3 ?
2
0.3
Denmark
3
0.1 ?
0
0.0
Ecuador
1
0
?
1
0.1
Egypt
2
0.1 ?
0
0.0
Fiji
1
0 ?
1
0.1
Finland
1
0 ?
0
0.0
France
3
0.1 ?
2
0.3
Germany
24
1.1 ?
5
0.7
Ghana
8
0.4
?
1
0.1
Greece
2
0.1 ?
0
0.0
Hong Kong
29
1.3 ?
13
1.9
Hungary
1
0
?
0
0.0
Iceland
1
0 ?
0
0.0
India
19
0.9 ?
3
0.4
Indonesia
9
0.4
?
0
0.0
Iran
7
0.3 ?
1
0.1
Ireland
2
0.1 ?
1
0.1
Israel
4
0.2 ?
3
0.4
Italy
3
0.1
?
1
0.1
Japan
9
0.4 ?
2
0.3
Kazakhstan
1
0 ?
1
0.1
Kenya
2
0.1
?
0
0.0
Libya
1
0 ?
0
0.0
Macedonia
1
0 ?
1
0.1
Malawi
1
0 ?
1
0.1
Malaysia
7
0.3 ?
1
0.1
Mauritius
2
0.1 ?
1
0.1
Mexico
4
0.2
?
2
0.3
Nepal
1
0 ?
0
0.0
The Netherlands
1
0 ?
0
0.0
New Zealand
5
0.2 ?
0
0.0
Nigeria
3
0.1
?
0
0.0
DGSCIT.)US 12/29/96
14
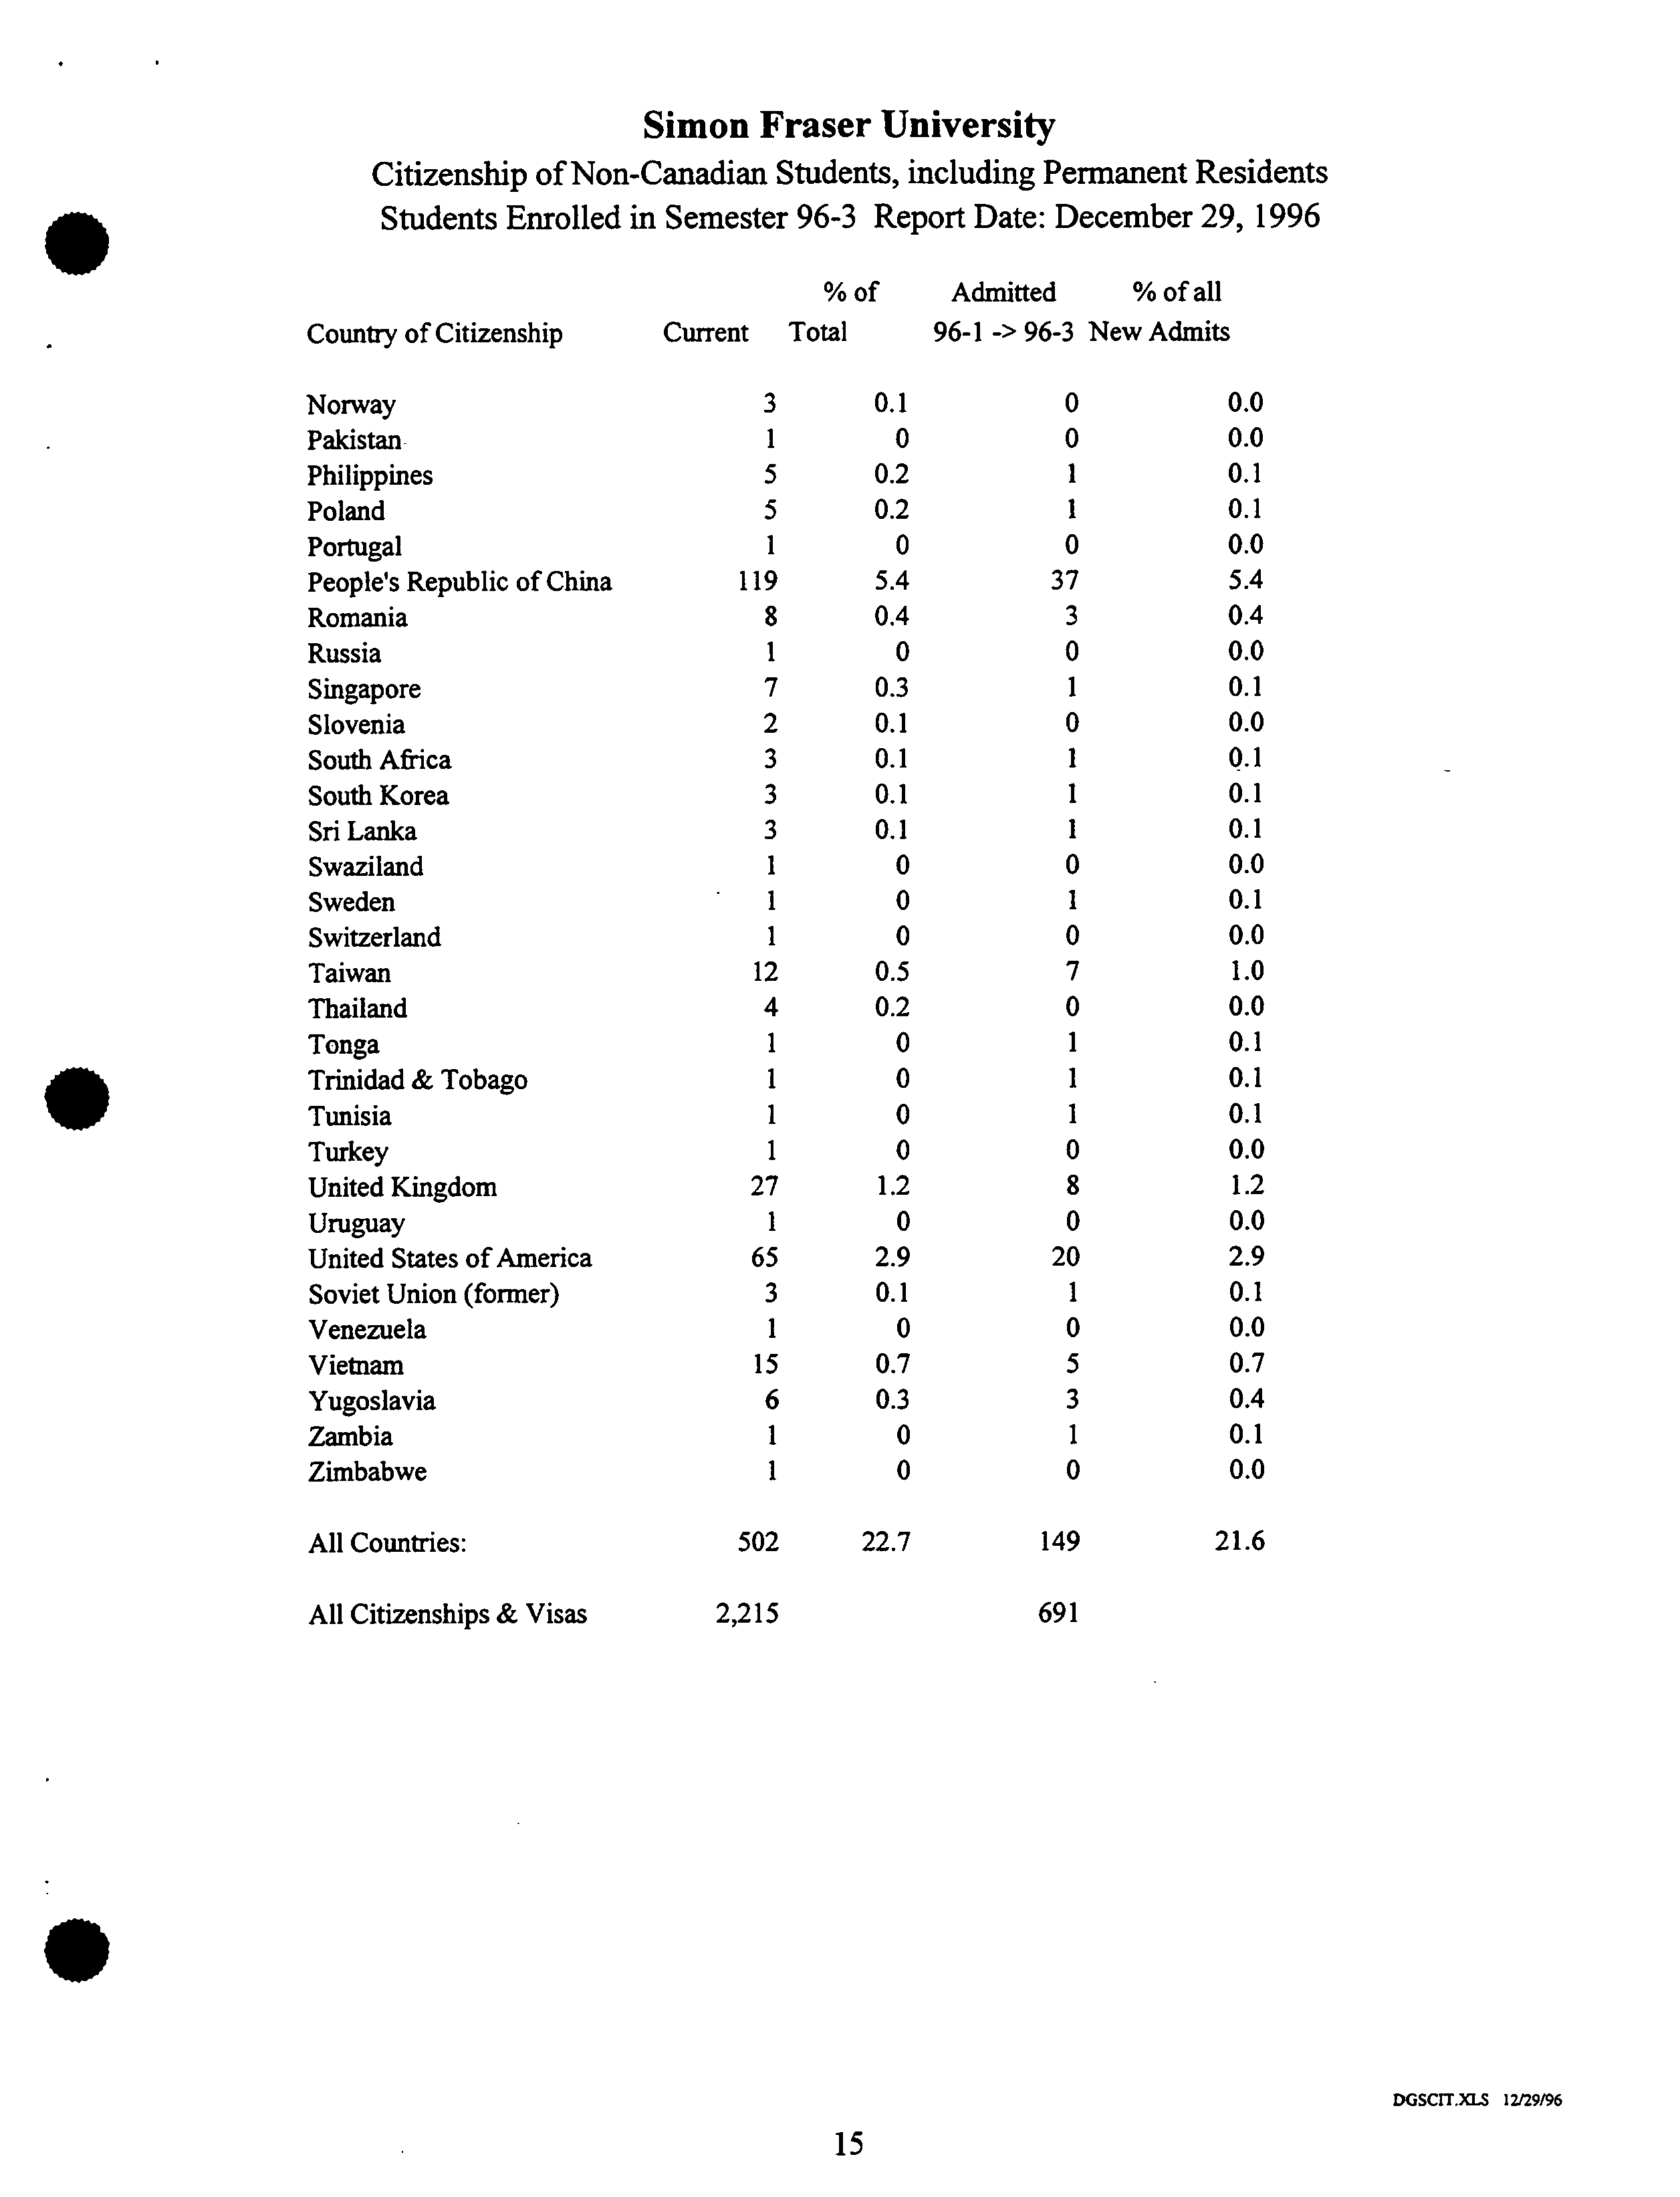
Country of Citizenship
Norway
Pakistan
Philippines
Poland
Portugal
People's Republic of China
Romania
Russia
Singapore
Slovenia
South Africa
South Korea
Sri Lanka
Swaziland
Sweden
Switzerland
Taiwan
Thailand
Tonga
Trinidad & Tobago
Tunisia
Turkey
United Kingdom
Uruguay
United States of America
Soviet Union (former)
Venezuela
Vietnam
Yugoslavia
Zambia
Zimbabwe
All Countries:
All Citizenships & Visas
C
Simon Fraser University
Citizenship of Non-Canadian Students, including Permanent Residents
.
?
Students Enrolled in Semester
96-3
Report Date: December
29, 1996
% of
Admitted ?
% of all
Current
Total
96-1 -> 96-3 New Admits
3 0.1
0
?
0.0
1 0
0 ?
0.0
5
0.2
1 ?
0.1
5
0.2
1 ?
0.1
1
0
0 ?
0.0
119
5.4
37
?
5.4
8
0.4
3 ?
0.4
1 0
0 ?
0.0
7
0.3
1
?
0.1
2 0.1
0 ?
0.0
3
0.1
1 ?
0.1
3
0.1
1 ?
0.1
3 0.1
1 ?
0.1
1 0
0
?
0.0
1 0
1 ?
0.1
1 0
0 ?
0.0
12
0.5
7
?
1.0
4 0.2
0 ?
0.0
1 0
1 ?
0.1
1
0
1
?
0.1
1
0
1 ?
0.1
1 0
0 ?
0.0
27
1.2
8
?
1.2
1 0
0 ?
0.0
65
2.9
20 ?
2.9
3
0.1
1 ?
0.1
1 0
0 ?
0.0
15
0.7
5 ?
0.7
6
0.3
3
?
0.4
1 0
1 ?
0.1
1 0
0 ?
0.0
502
22.7
149 ?
21.6
2,215
691
DGscrr.)U.s
12/29/96
15
Simon Fraser University
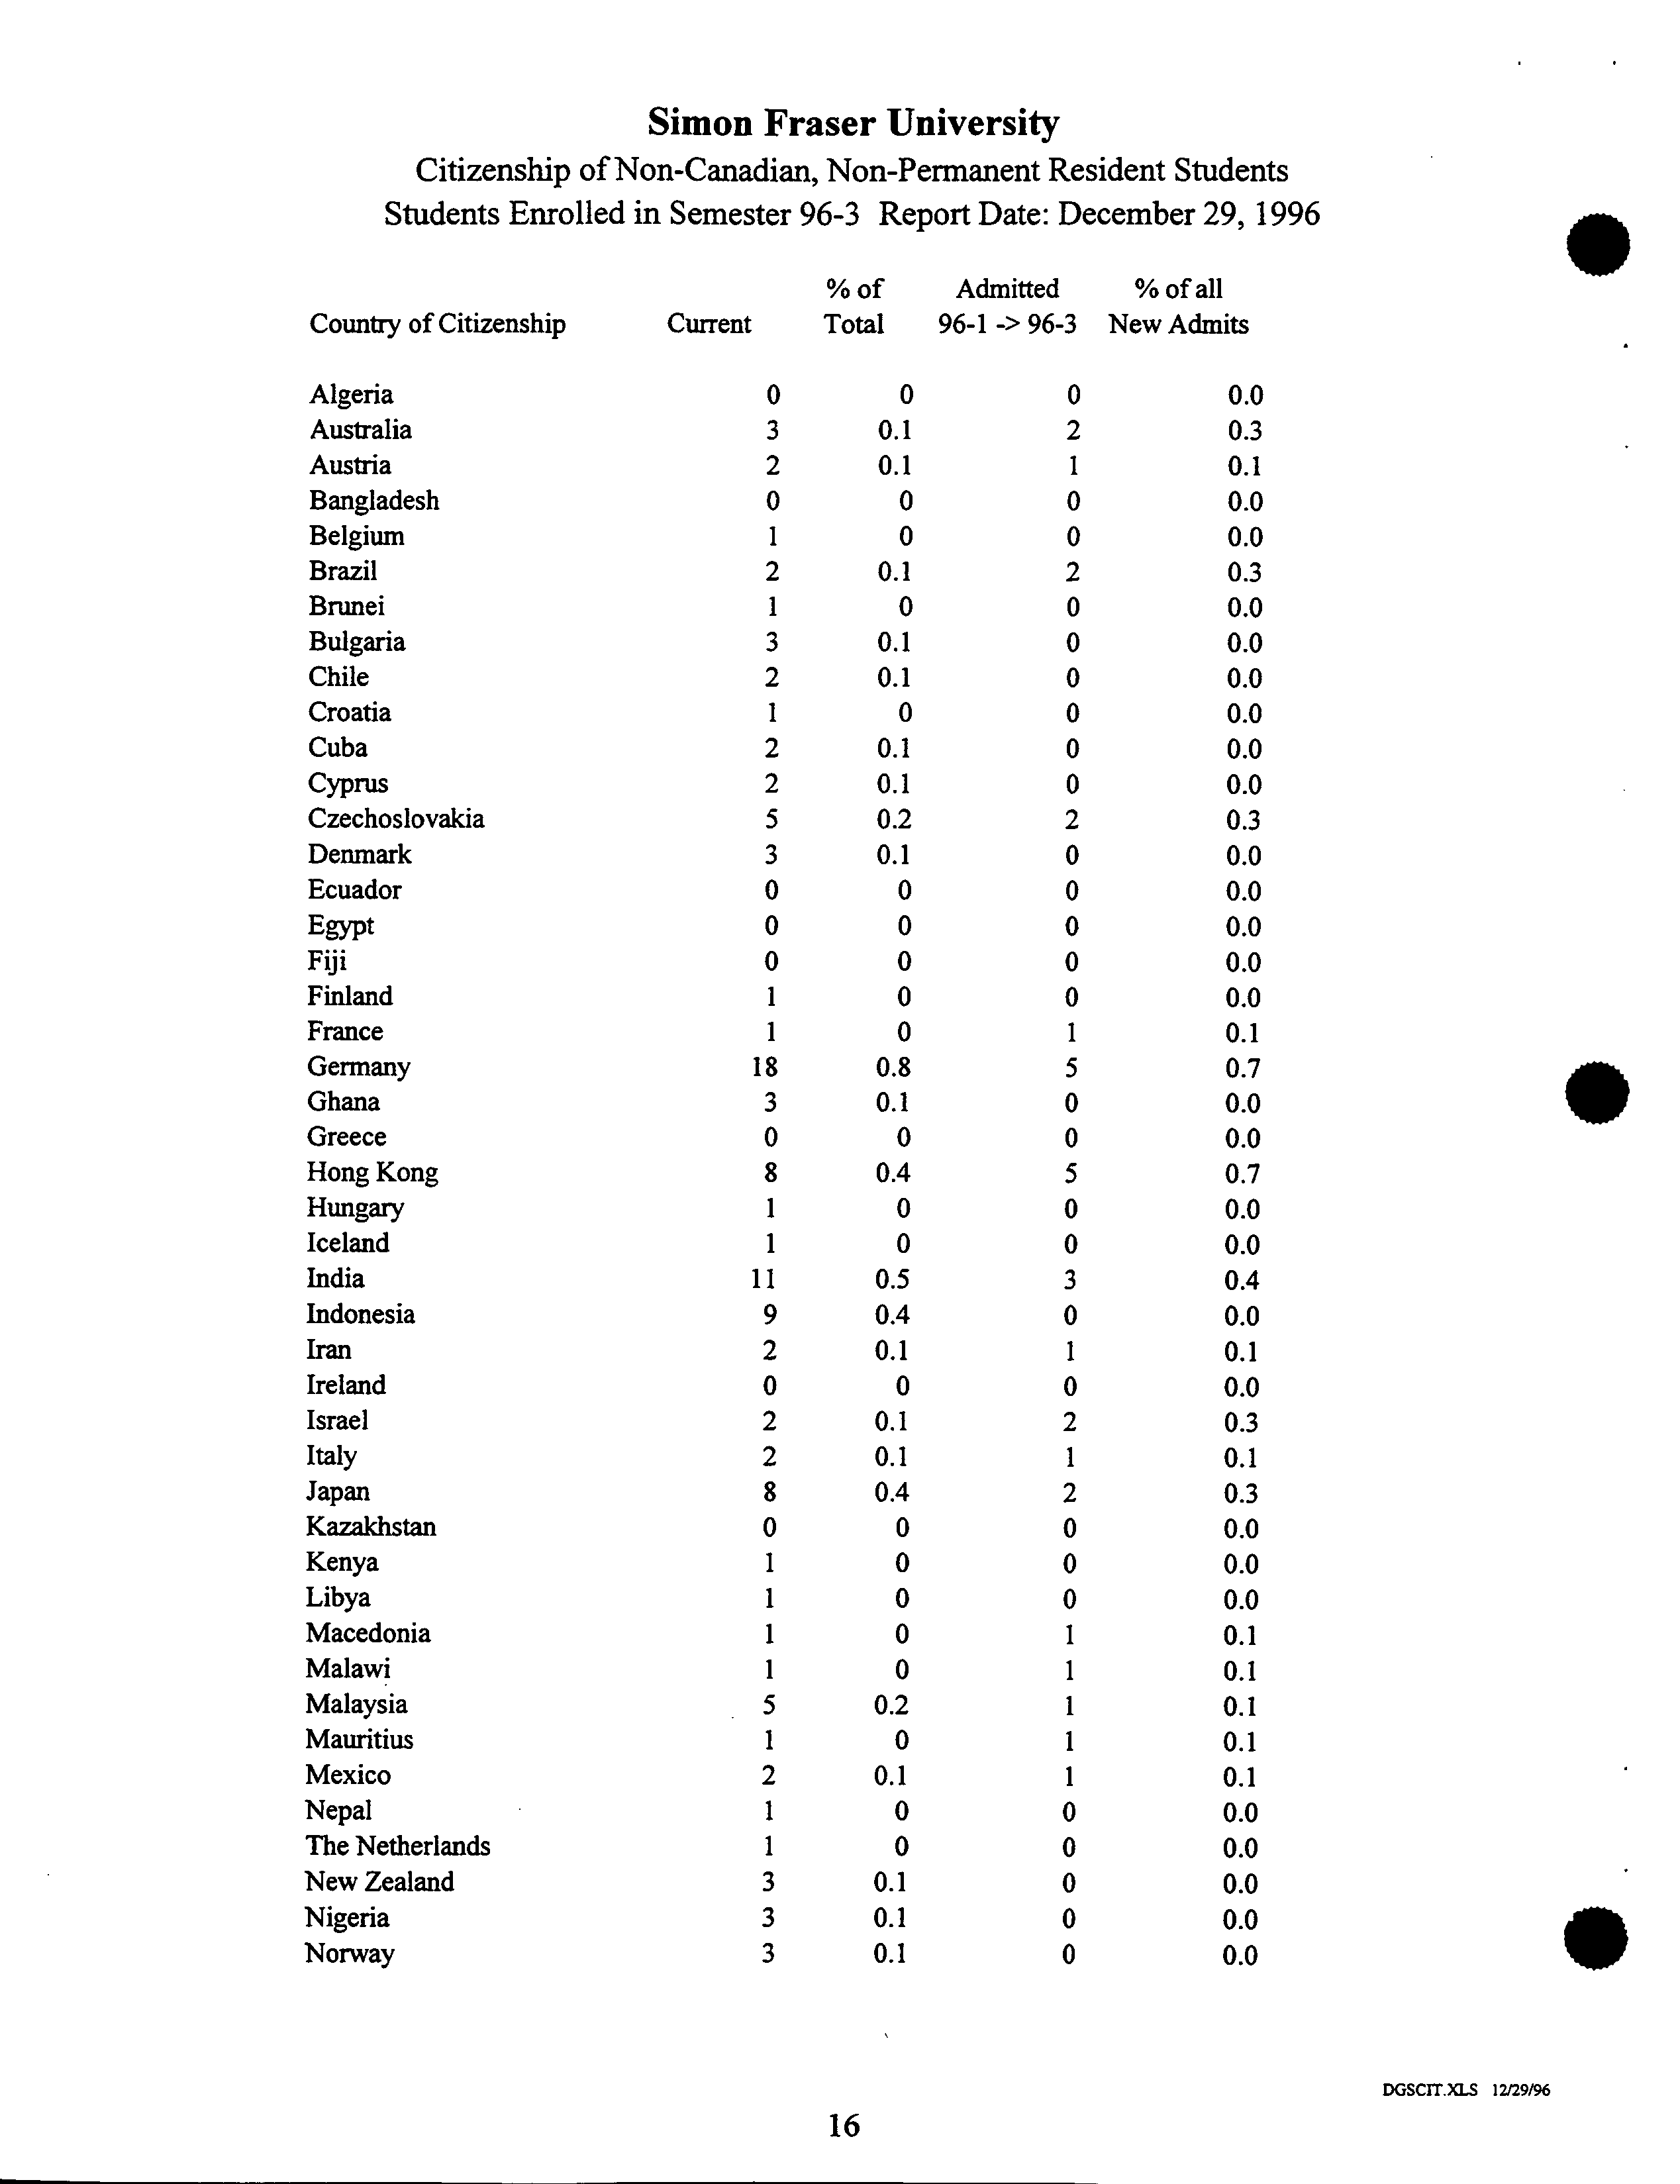
Citizenship of Non-Canadian, Non-Permanent Resident Students
Students Enrolled in Semester 96-3 Report Date: December 29, 1996
%
of ?
Admitted
% of all
Country of Citizenship
Current
Total ?
96-1 -> 96-3 New Admits
Algeria
0
0 ?
0
0.0
Australia
3
0.1 ?
2
0.3
Austria
2
0.1 ?
1
0.1
Bangladesh
0
0 ?
0
0.0
Belgium
1
0 ?
0
0.0
Brazil
2
0.1 ?
2
0.3
Brunei
1
0 ?
0
0.0
Bulgaria
3
0.1 ?
0
0.0
Chile
2
0.1 ?
0
0.0
Croatia
1
0 ?
0
0.0
Cuba
2
0.1 ?
0
0.0
Cyprus
2
0.1 ?
0
0.0
Czechoslovakia
5
0.2 ?
2
0.3
Denmark
3
0.1 ?
0
0.0
Ecuador
0
0 ?
0
0.0
Egypt
0
0
?
0
0.0
Fiji
0
0 ?
0
0.0
Finland
1
0 ?
0
0.0
France
1
0
?
1
0.1
Germany
18
0.8 ?
5
0.7
Ghana
3
0.1 ?
0
0.0
Greece
0
0 ?
0
0.0
Hong Kong
8
0.4 ?
5
0.7
Hungary
1
0 ?
0
0.0
Iceland
1
0 ?
0
0.0
India
11
0.5 ?
3
0.4
Indonesia
9
0.4 ?
0
0.0
Iran
2
0.1 ?
1
0.1
Ireland
0
0
?
0
0.0
Israel
2
0.1 ?
2
0.3
Italy
2
0.1 ?
1
0.1
Japan
8
0.4
?
2
0.3
Kazakhstan
0
0 ?
0
0.0
Kenya
1
0 ?
0
0.0
Libya
1
0 ?
0
0.0
Macedonia
1
0 ?
1
0.1
Malawi
1
0 ?
1
0.1
Malaysia
5
0.2 ?
1
0.1
Mauritius
1
0 ?
1
0.1
Mexico
2
0.1 ?
1
0.1
Nepal
1
0 ?
0
0.0
The Netherlands
1
0
?
0
0.0
New Zealand
3
0.1 ?
0
0.0
Nigeria
3
0.1 ?
0
0.0
Norway
3
0.1 ?
0
0.0
DGSCITXLS 12/29/96
16
Simon Fraser University?
Citizenship of Non-Canadian, Non-Permanent Resident Students
?
Students Enrolled in Semester 96-3 Report Date: December 29, 1996
I
Country of Citizenship
?
Current
Pakistan
0
Philippines
2
Poland
0
Portugal
0
People's Republic of China
75
Romania
3
Russia
0
Singapore
5
Slovenia
2
South Africa
1
South Korea
2
Sri Lanka
3
Swaziland
1
Sweden
0
Switzerland
1
Taiwan
3
Thailand
4
Tonga
I
Trinidad & Tobago
0
Tunisia
I
Turkey
I
United Kingdom
11
Uruguay
1
United States of America
41
Soviet Union (former)
2
Venezuela
0
Vietnam
15
Yugoslavia
0
Zambia
0
Zimbabwe
1
All Countries:
?
293
All Citizenships & Visas:
?
2,215
% of
Admitted
% of all
Total
96-1 -> 96-3
New Admits
o
0
0.0
0.1
0
0.0
0
0
0.0
0
0
0.0
3.4
29
4.2
0.1
1
0.1
0
0
0.0
0.2
1
0.1
0.1
0
0.0
0
0
0.0
0.1
1
0.1
0.1
1
0.1
0
0
0.0
0
0
0.0
0
0
0.0
0.1
1
0.1
0.2
0
0.0
0
1
0.1
0
0
0.0
0
1
0.1
0
0
0.0
0.5
3
0.4
0
0
0.0
1.9
13
1.9
0.1
1
0.1
0
0
0.0
0.7
5
0.7
0
0
0.0
0
0
0.0
0
0
0.0
13.2 ?
90 ?
13.0
691
DGSCIT.XLS 12129196
.
17
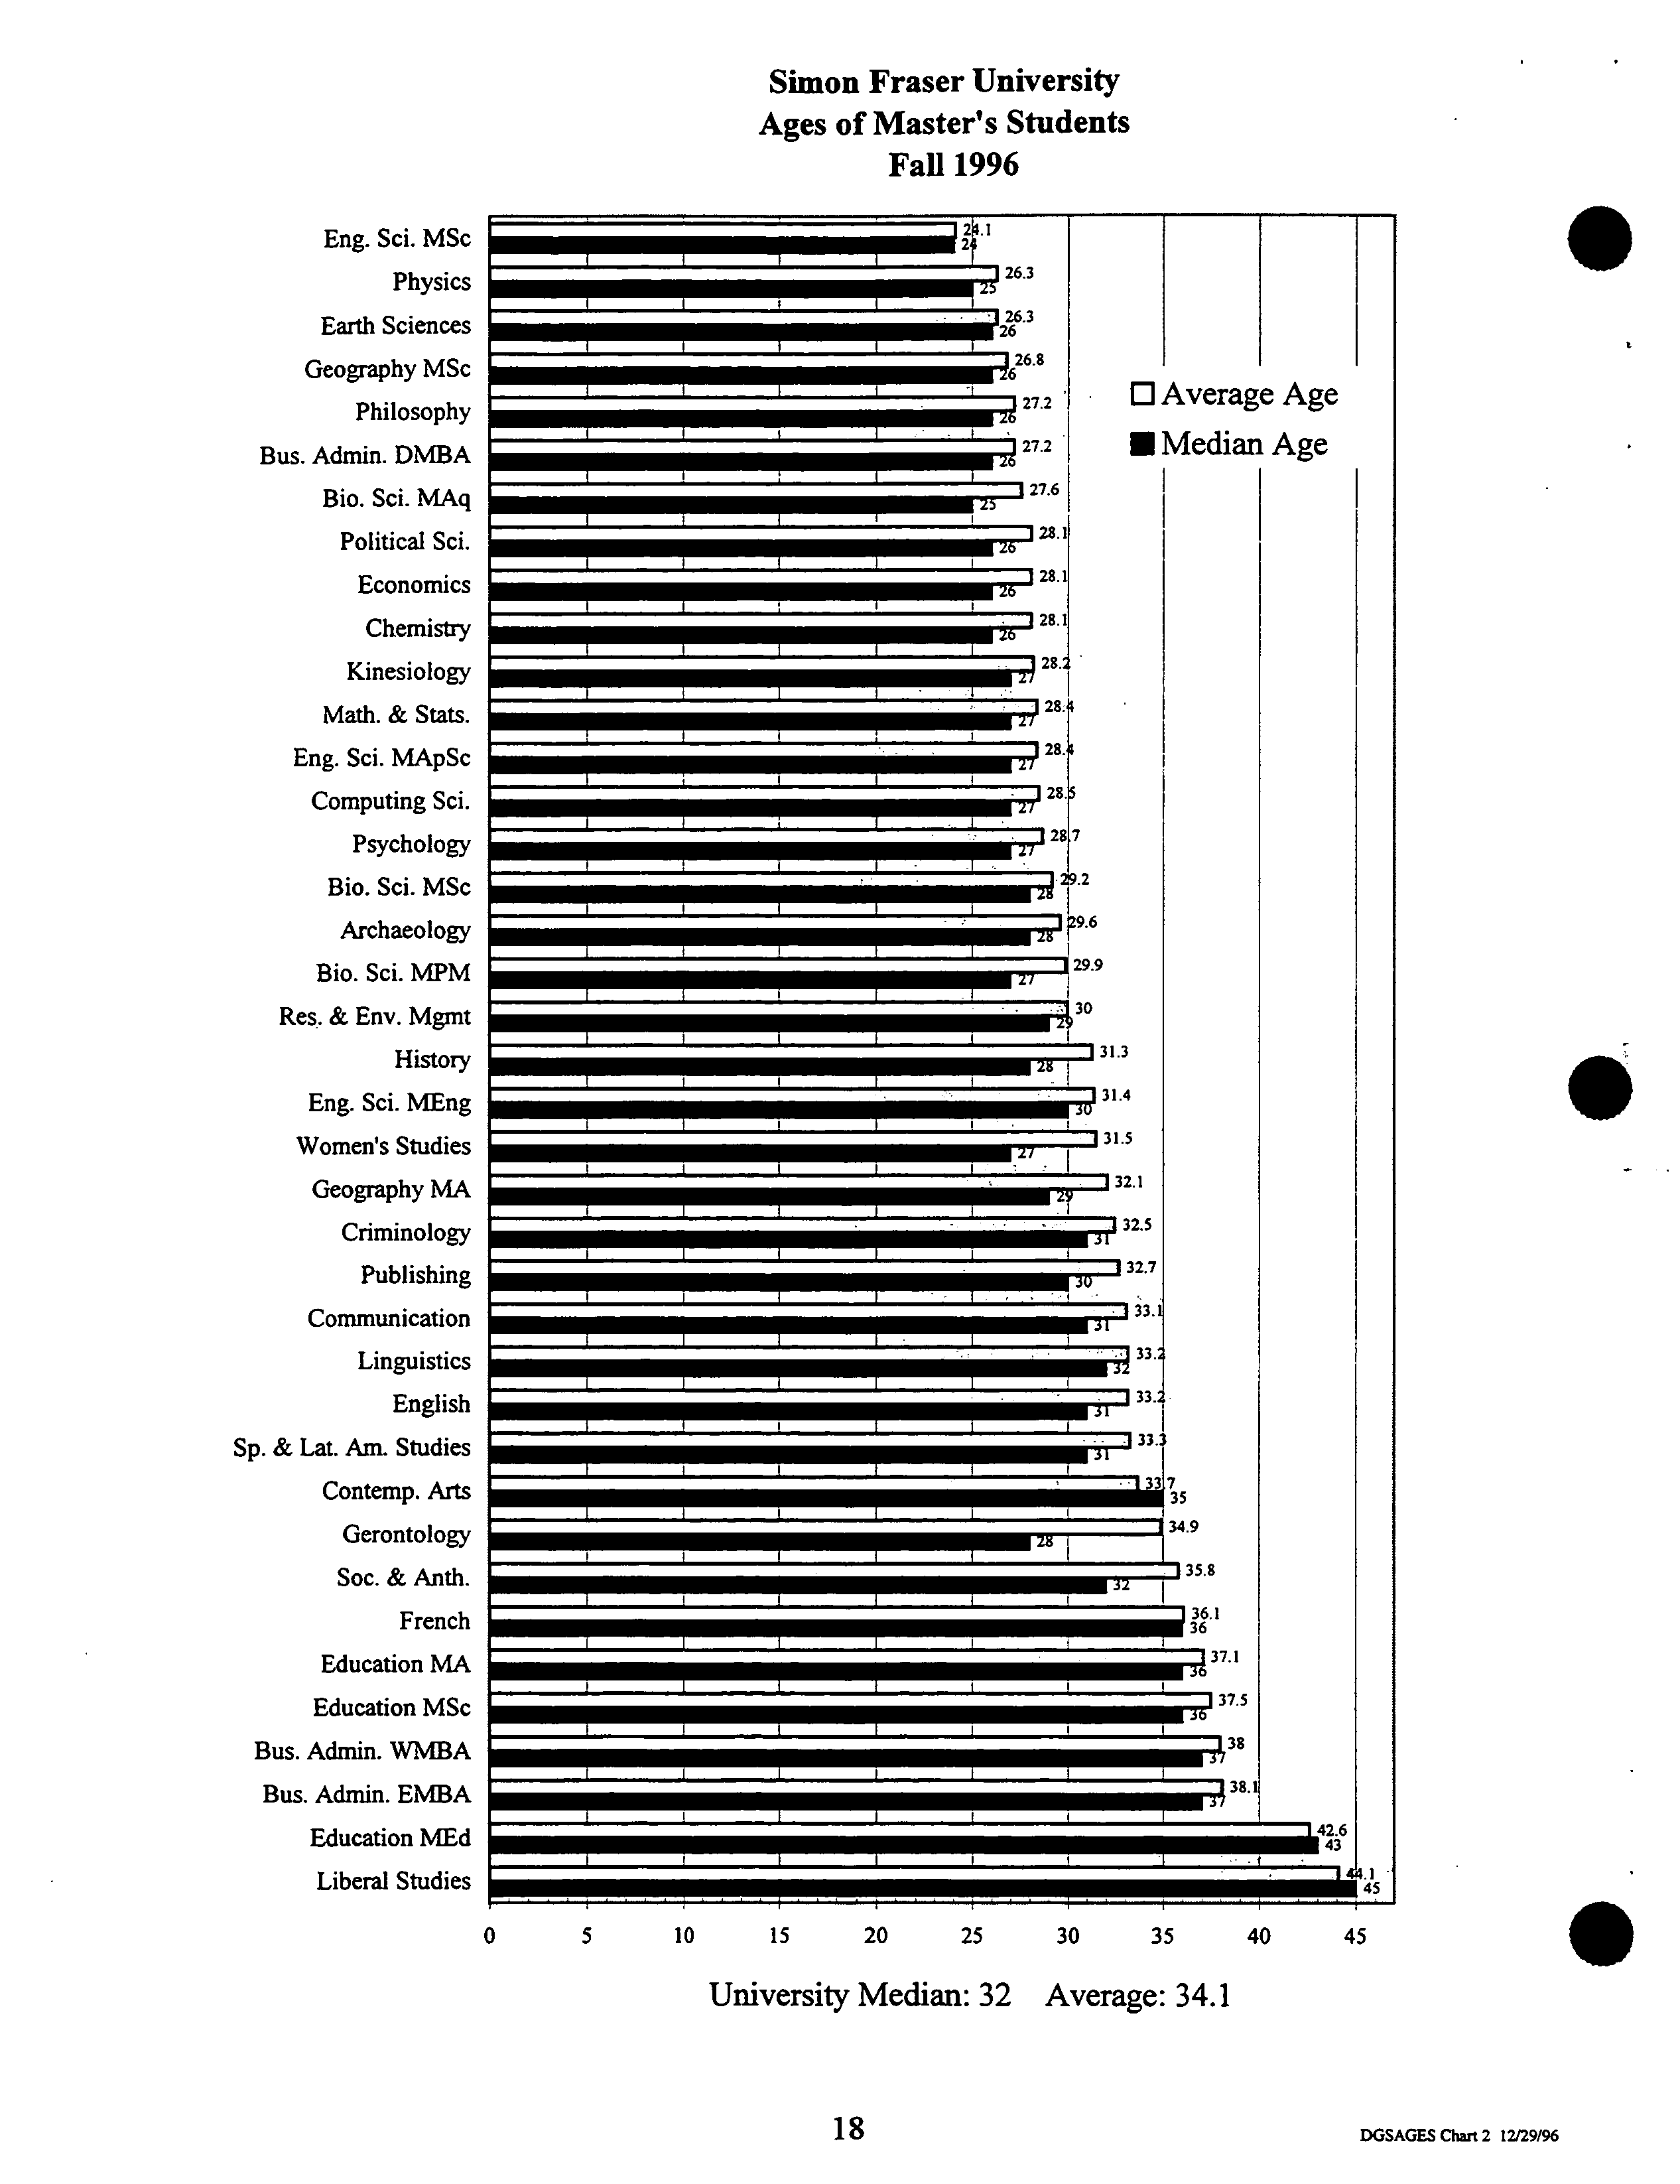
Simon Fraser University
?
Ages of Master's Students
?
Fall 1996
Eng. Sci. MSc ?
Physics ?
Earth Sciences ?
Geography MSc
?
Philosophy ?
Bus. Admin. DMBA
?
Bio. Sci. MAq ?
Political Sci.
?
Economics ?
Chemistry ?
Kinesiology ?
Math. & Stats. ?
Eng. Sci. MApSc ?
Computing Sci. ?
Psychology ?
Bio. Sci. MSc ?
Archaeology ?
Bio. Sci. MPM
?
Res. & Env. Mgint ?
History ?
Eng. Sci. MEng
?
Women's Studies ?
Geography MA ?
Criminology ?
Publishing
?
Communication ?
Linguistics ?
English ?
Sp. & Lat. Am. Studies
?
Contemp. Arts ?
Gerontology ?
Soc. & Anth. ?
French ?
Education MA ?
Education MSc
?
Bus. Admin. WMBA ?
Bus. Admin. EMBA ?
Education MEd ?
Liberal Studies
0 ?
5 ?
10 ?
15 ?
20 ?
25 ?
30 ?
35 ?
40 ?
45
?
S
University Median: 32 Average: 34.1
I
-s
o
18 ?
DOSAGES
Chart 2
12129196
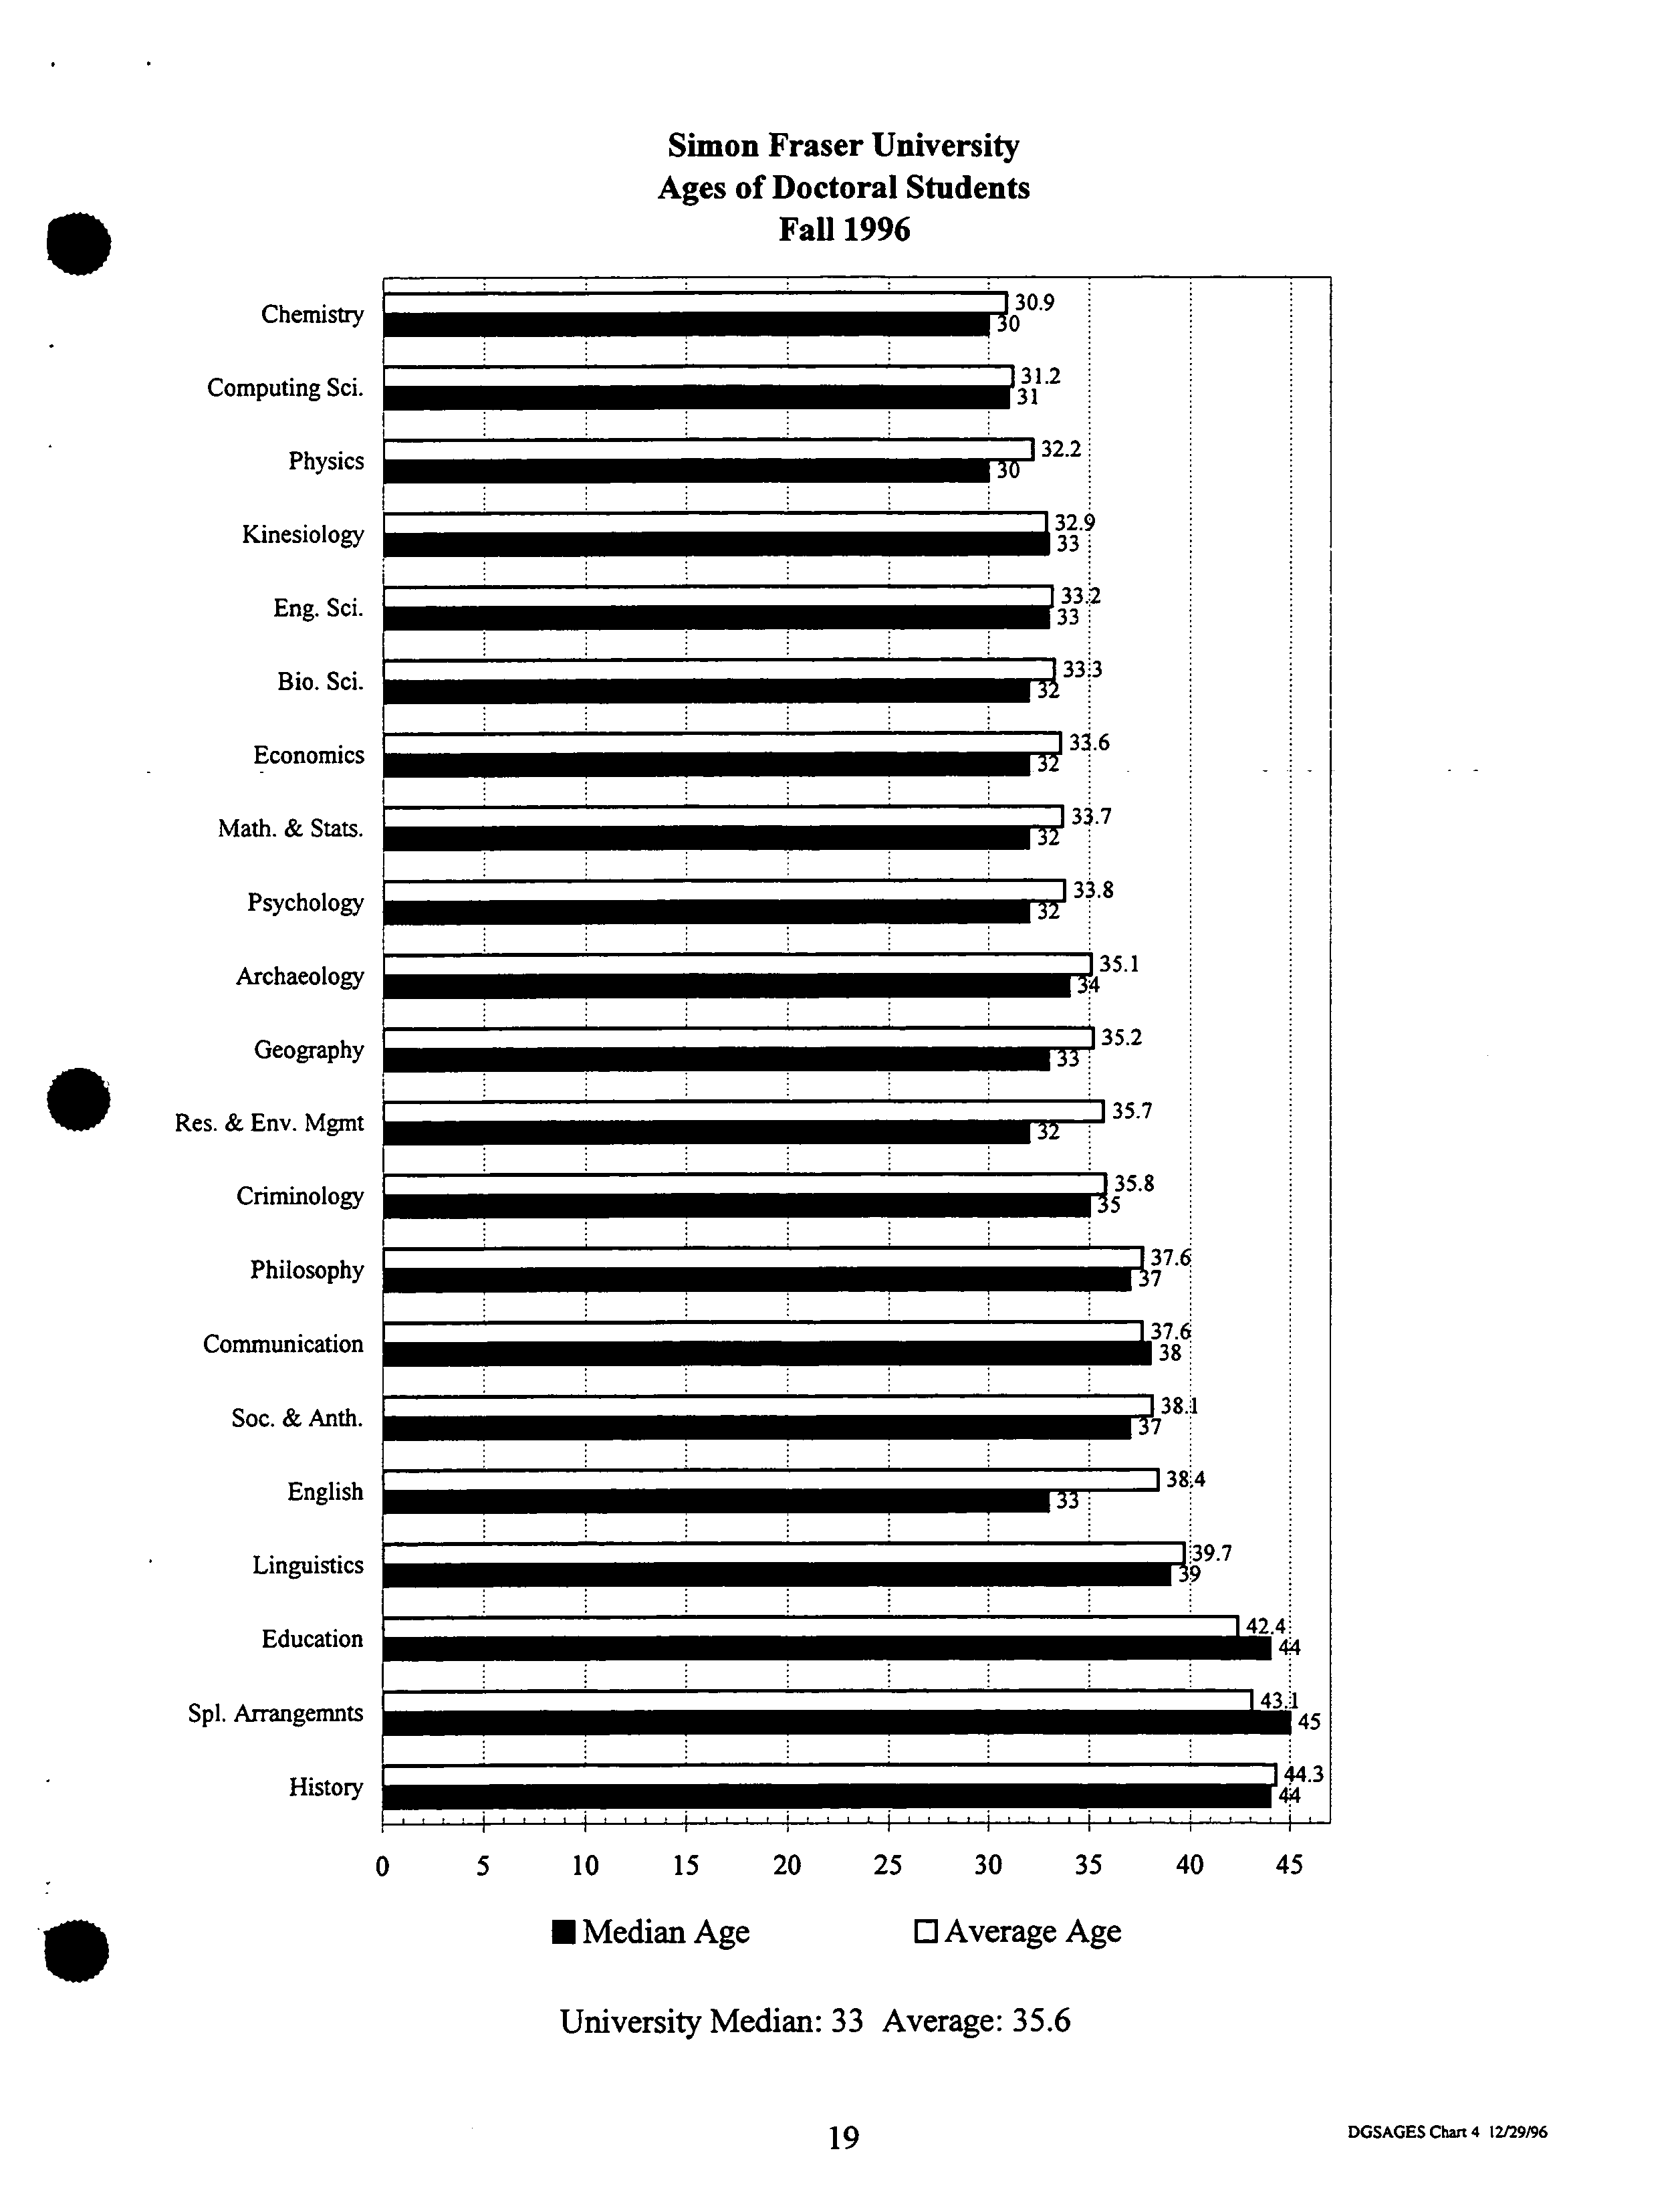
Simon Fraser University ?
Ages of Doctoral Students ?
Fall 1996
Chemistry
Computing Sci.
Physics
Kinesiology
Eng. Sci.
Bio. Sci.
Economics
Math. & Stats.
Psychology
Archaeology
Geography
Res. & Env. Mgmt
Criminology
Philosophy
Communication
Soc. & Anth.
English
Linguistics
Education
Spi. Arrangemnts
• ? History
30.9
• ?
: ?
131.2
31
132.2
30
132.9
33
1332
33
I33;3
32
• ?
133.6
• ?
S
?
I3.7
32
133.8
32
)35.1
135.2
33
•
?
135.7
32
• ? • ?
135.8
•
?
•
137.6
I37.
38
138.1
37
I38.4
33
I39.7
•
•
?
S ?
: ?
•
142.4
• ?
5 ?
•
44
:
?
:
143i
•
45
S
144.3
0 ?
5 ?
10
?
15
?
20
?
25 ?
30
?
35 ?
40
?
4
U Median Age ?
0 Average Age
University Median: 33 Average: 35.6
19 ?
DOSAGES Chart
4 12/29/96
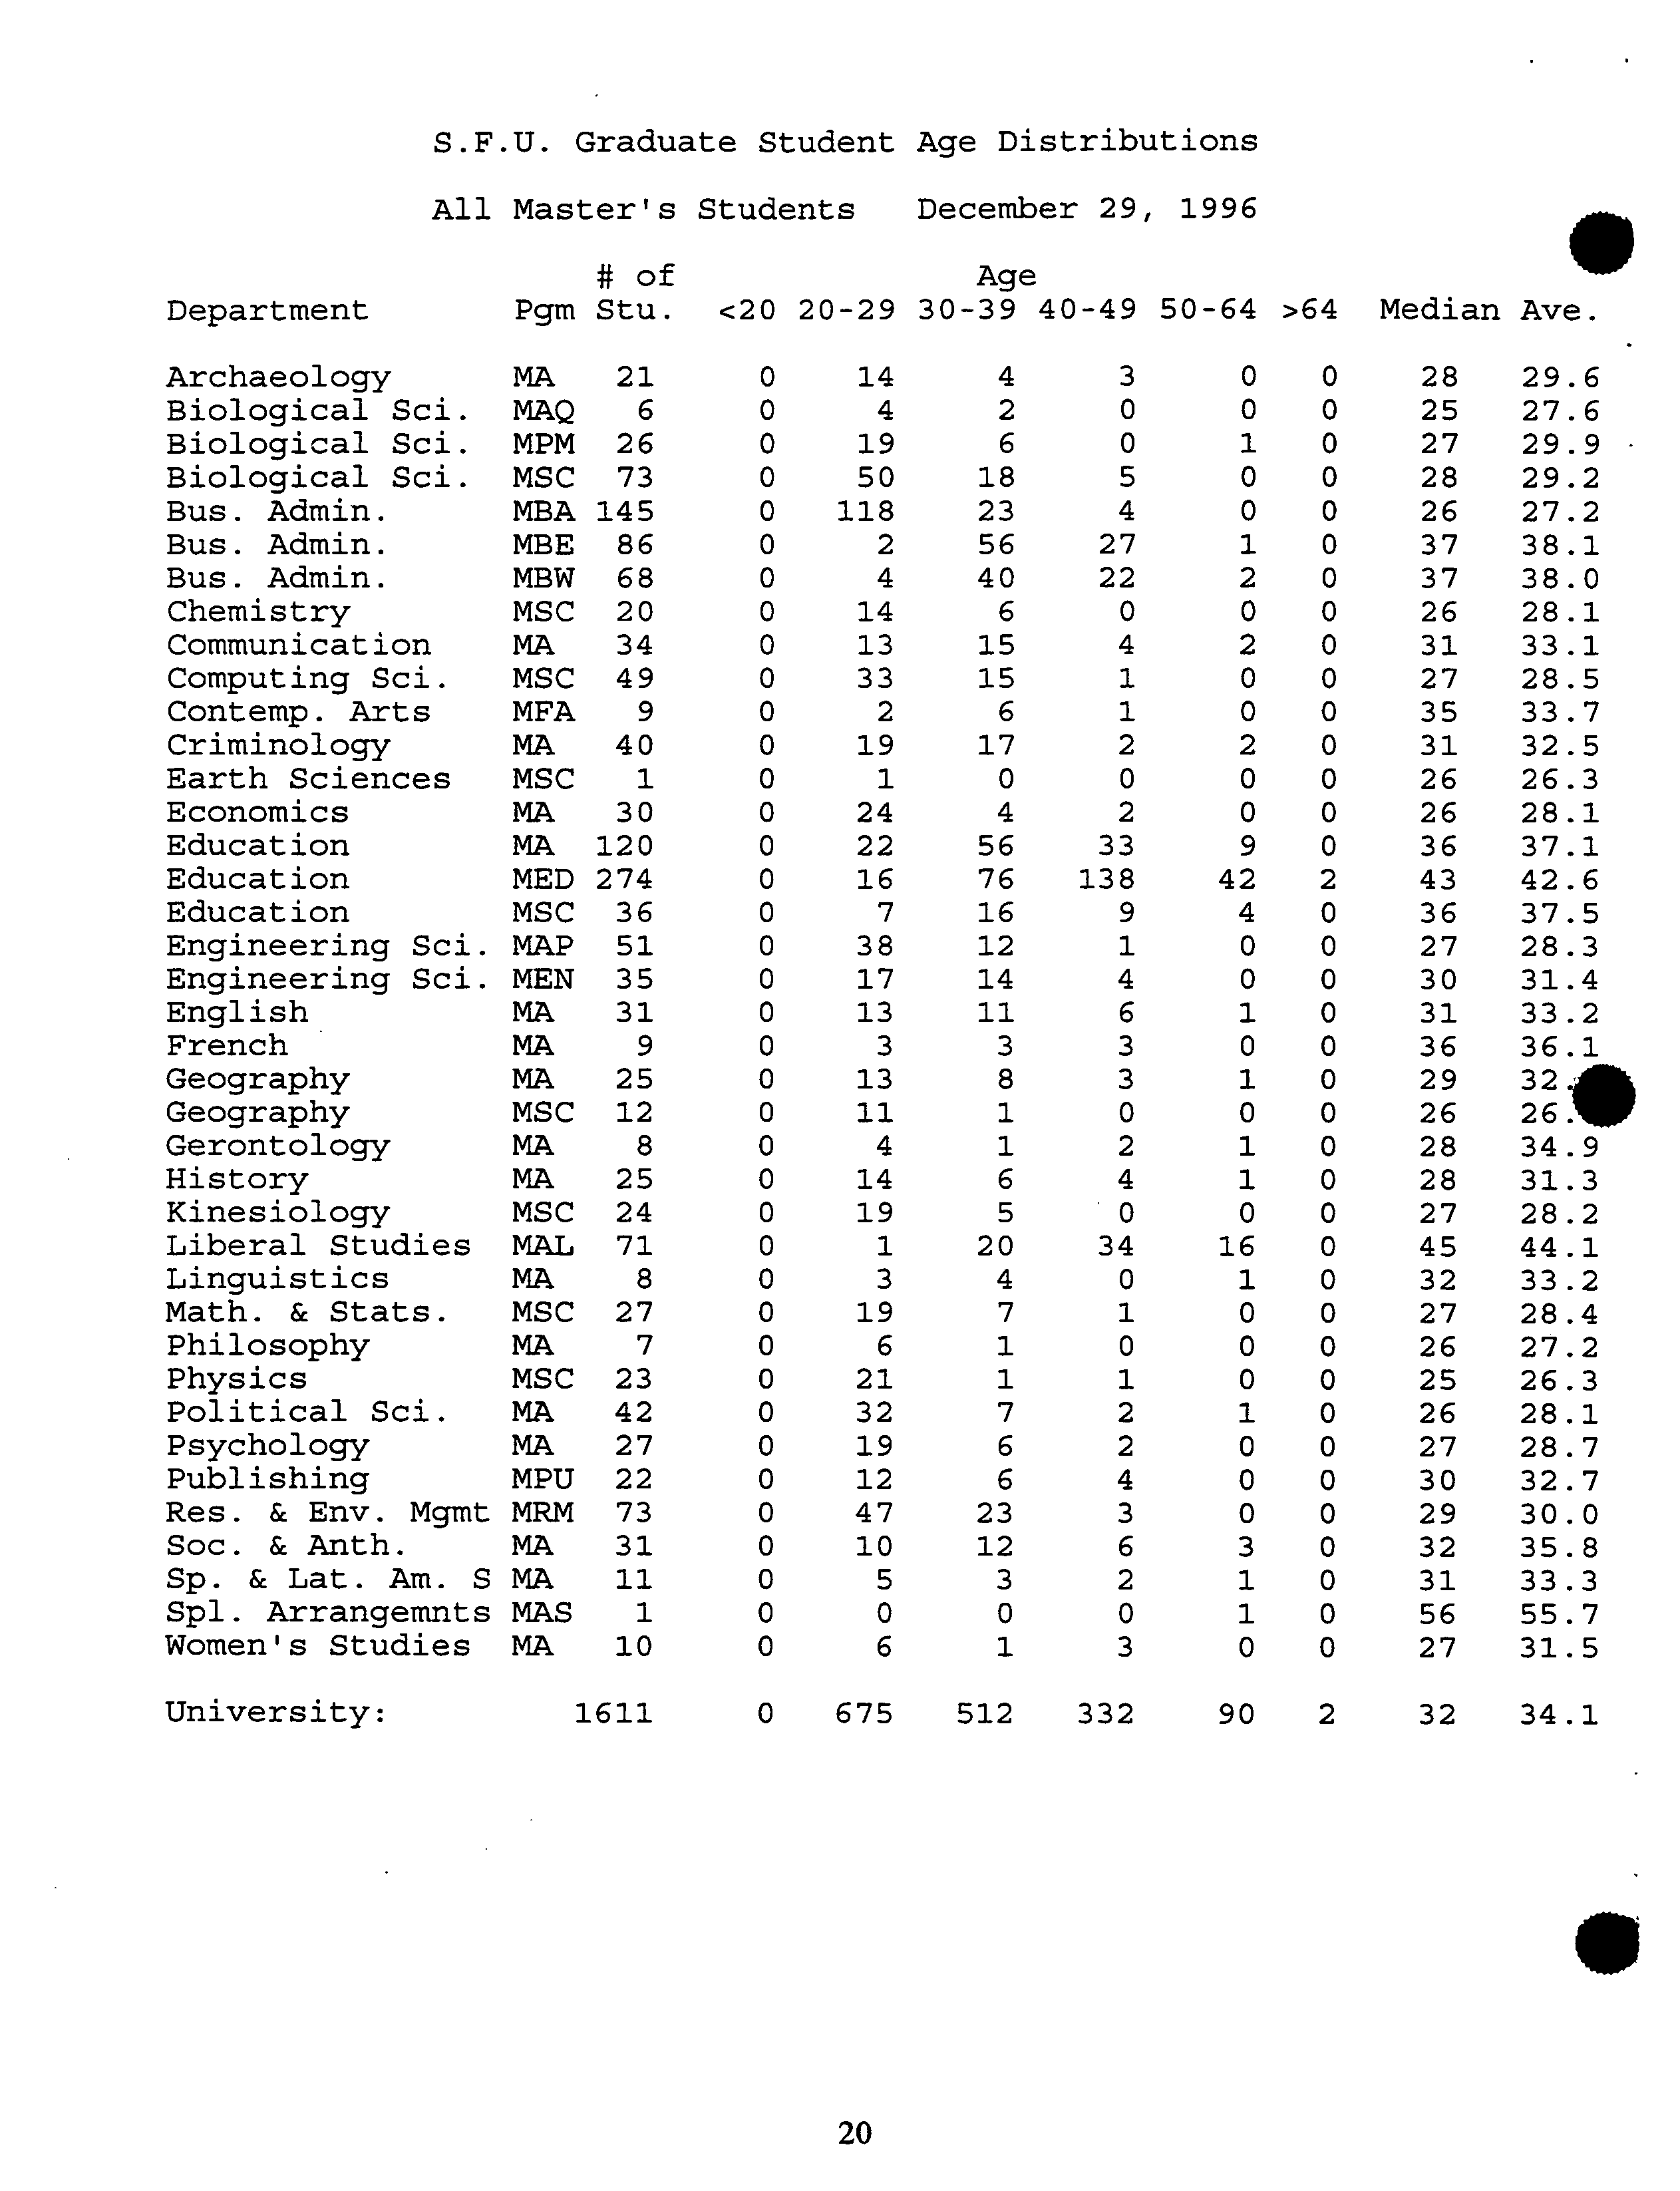
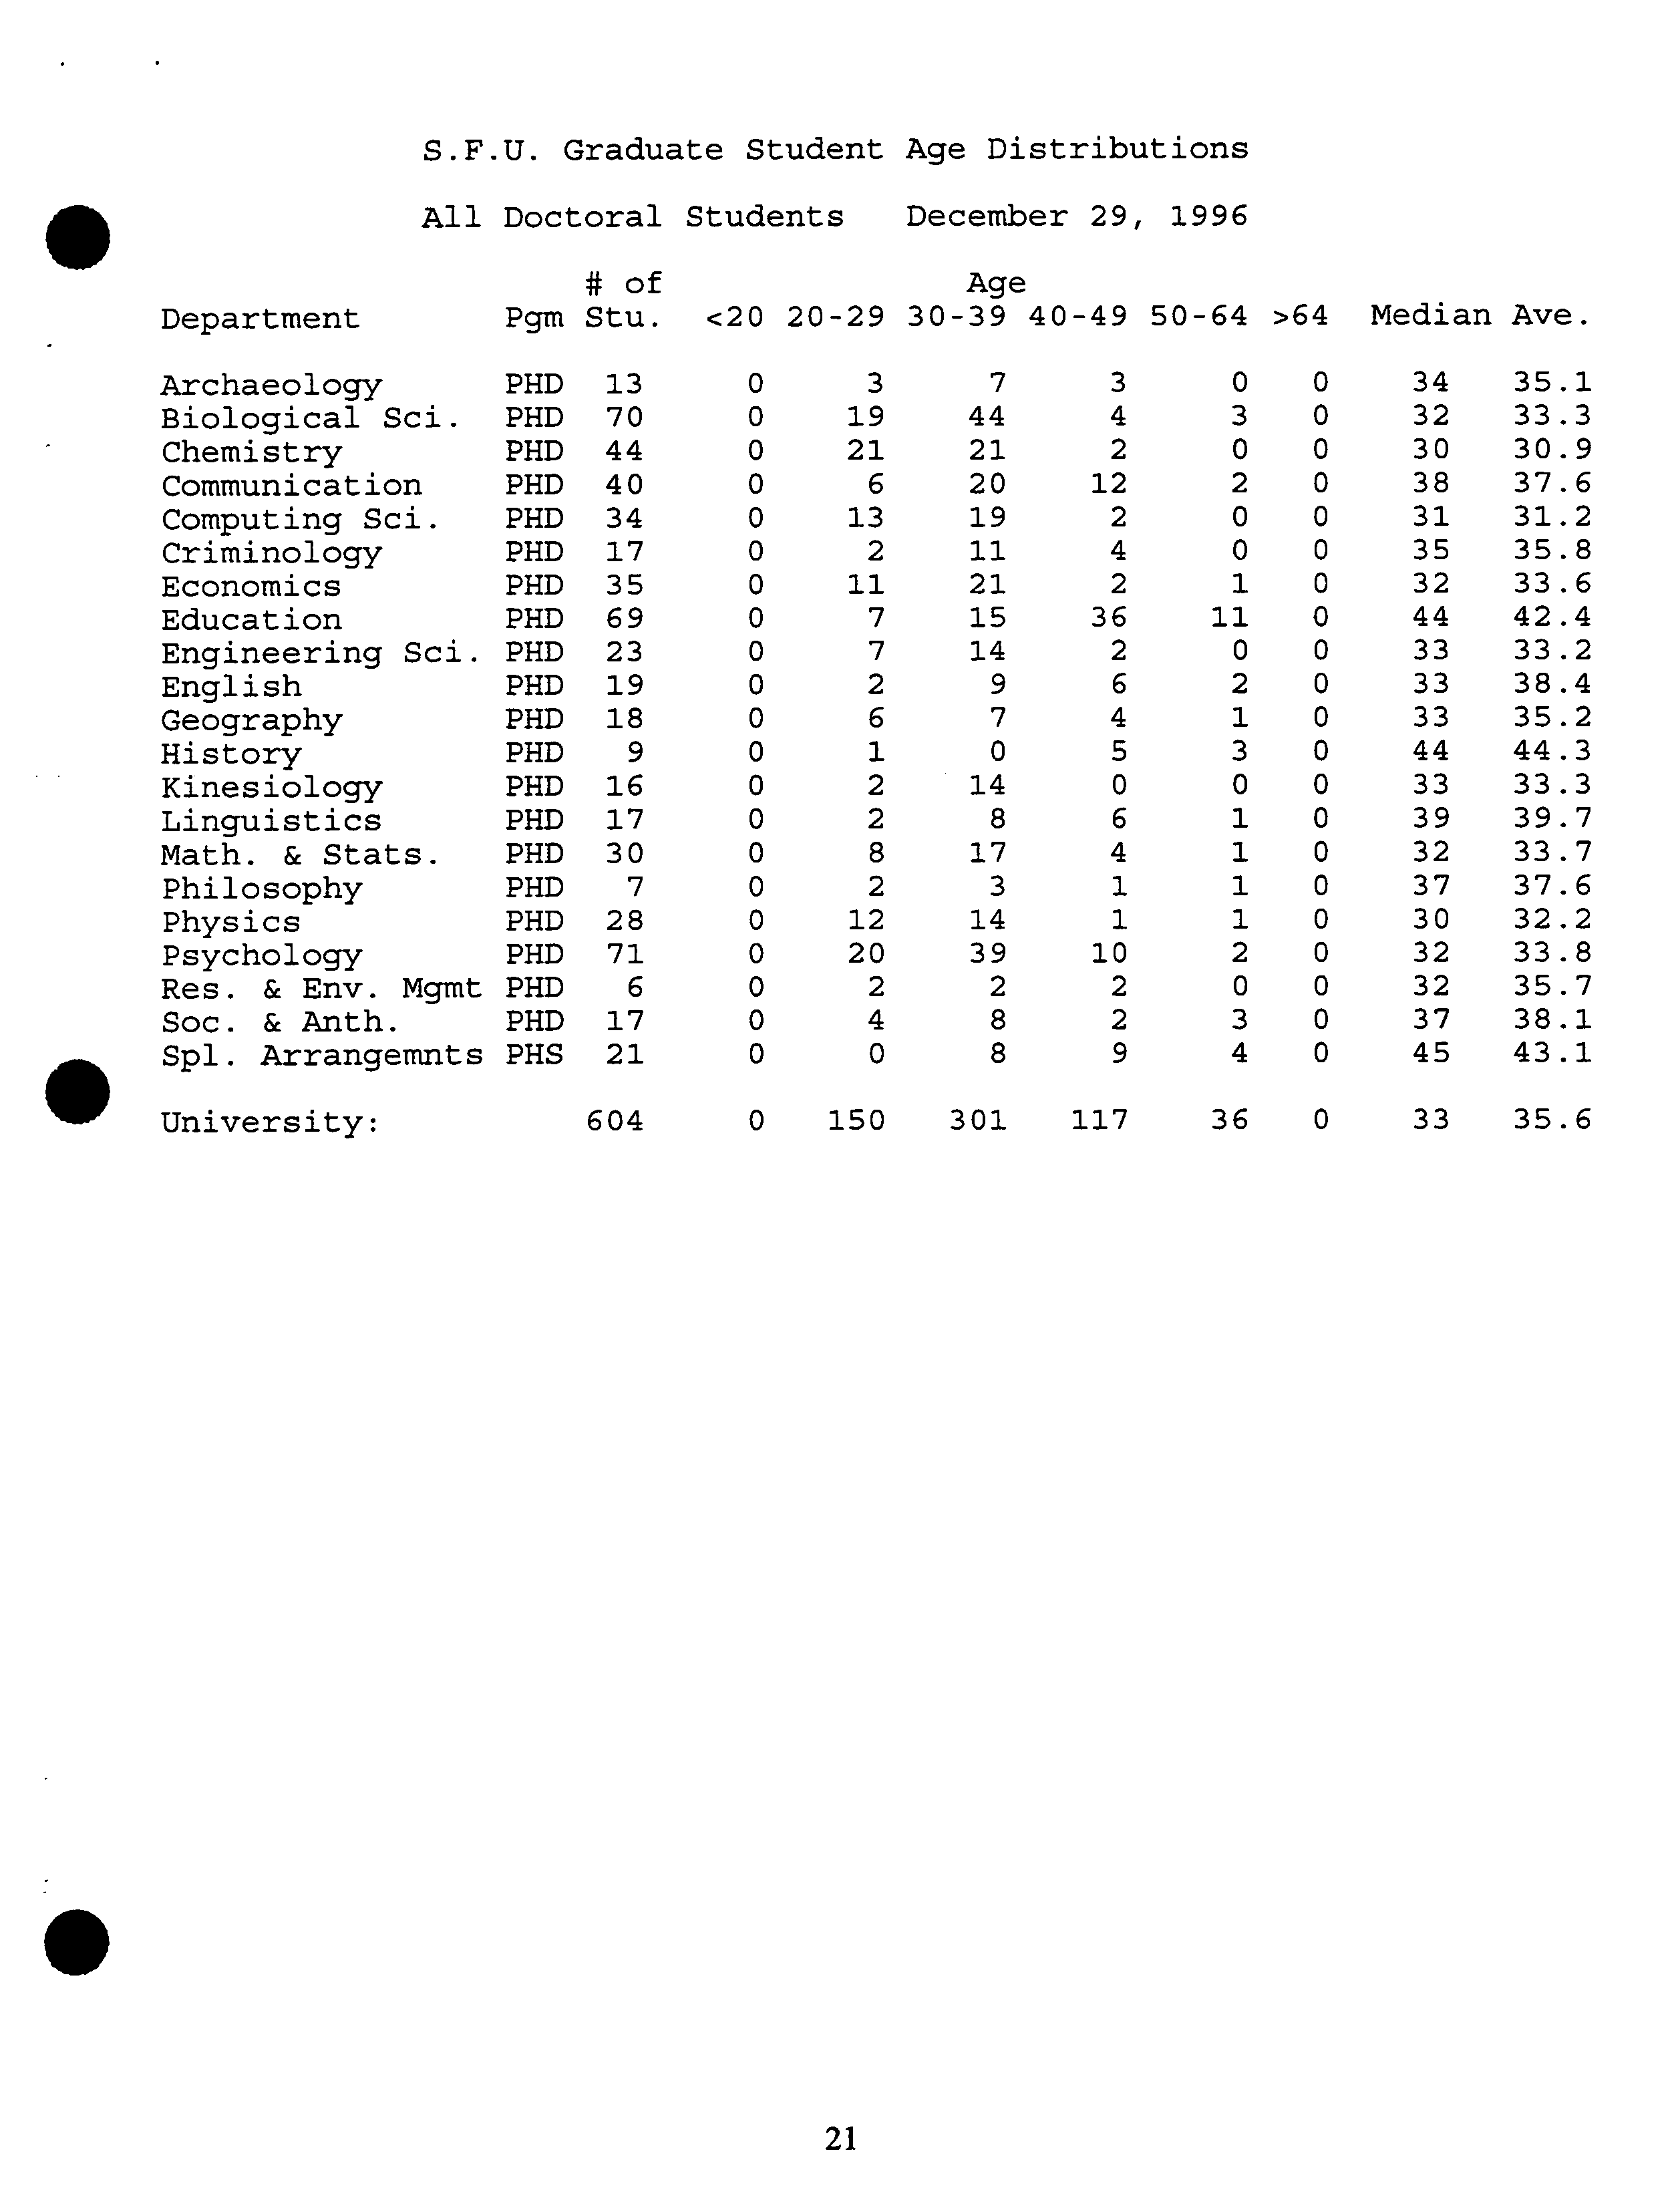
S.F.U. Graduate Student Age Distributions
All Master's Students December 29, 1996
#of ?
Age
Department ?
Pgm Stu. <20 20-29 30-39 40-49 50-64 >64 Median Ave.
Archaeology
MA 21 0 14
4 3 0
0 28
29.6
Biological Sci.
MAO 6
0 4
2
0
0
0 25
27.6
Biological Sci.
MPM
26
0 19
6 0 1
0
27
29.9
Biological Sci.
MSC
73 0 50 18 5 0 0 28
29.2
Bus. Admin.
MBA
145
0 118 23
4
0 0 26
27.2
Bus. Admin.
MBE
86
0 2 56
27
1
0
37
38.1
Bus. Admin.
MBW
68
0
4
40 22
2
0 37
38.0
Chemistry
MSC
20
0 14
6 0 0
0 26 28.1
Communication MA 34 0 13 15
4
2
0
31 33.1
Computing Sci. MSC 49 0 33 15 1 0
0
27
28.5
Contemp. Arts MFA 9 0 2 6 1 0 0
35 33.7
Criminology
MA 40 0 19
17 2
2 0 31 32.5
Earth Sciences MSC 1
0
1
0
0
0
0 26 26.3
Economics
MA 30 0 24 4
2
0 0 26 28.1
Education
MA 120 0 22 56 33 9
0 36
37.1
Education
MED
274
0 16
76
138 42 2 43
42.6
Education
MSC 36 0 7 16 9 4
0 36 37.5
Engineering Sci.
MAP
51 0 38 12 1
0 0 27 28.3
Engineering Sci. MEN 35 0 17 14 4
0 0 30 31.4
English
MA 31 0 13 11
6 1 0 31
33.2
French
MA
9 0 3 3 3 0 0
36 36.1
Geography
MA 25 0 13
8 3 1 0 29
32
Geography
MSC 12 0
11 1 0 0
0 26 26.
Gerontology MA
8 0 4 1 2 1
0 28
34.9
History
MA
25 0 14 6 4
1 0 28
31.3
Kinesiology
MSC 24 0 19 5
0 0 0 27
28.2
Liberal Studies
MAL 71
0 1 20 34
16
0 45
44.1
Linguistics
MA
8 0 3 4
0
1
0
32 33.2
Math.
?
& Stats. MSC 27
0 19 7 1
0
0 27
28.4
Philosophy
MA
7
0
6
1
0 0
0 26 27.2
Physics
MSC 23 0 21
1
1
0
0 25 26.3
Political Sd.
MA 42 0 32 7
2
1
0 26 28.1
Psychology
MA 27
0 19 6 2
0 0 27
28.7
Publishing
MPU 22
0 12
6
4
0 0 30 32.7
Res. & Env. Mgmt
MRM
73
0
47
23 3 0
0 29 30.0
Soc. ?
& Anth.
MA
31 0
10 12
6 3 0 32 35.8
Sp. & Lat. Am. SMA
11
0 5 3 2
1 0 31
33.3
Spl. ArrangemntsMAS
1
0
0
0
0
1
0 56 55.7
Women's Studies
MA
10
0
6
1
3
0 0 27 31.5
University:
1611
0 675 512
332 90 2
32
34.1
Ei
20
S.F.U. Graduate Student Age Distributions
All Doctoral
Students
December
29,
1996
#of
Age
Department
Pgm Stu.
<20 20-29 30-39 40-49
50-64
>64 Median
Ave.
Archaeology
PHD 13
0
3
7
3
0
0 34 35.1
Biological Sci.
PHD 70
0
19
44 4 3
0 32 33.3
Chemistry
PHD
44 0
21 21
2
0
0
30 30.9
Communication
PHD 40
0 6
20
12
2 0 38
37.6
Computing Sci.
PHD 34
0
13 19
2
0 0
31 31.2
Criminology
PHD
17 0 2 11
4
0 0
35 35.8
Economics
PHD 35 0
11 21
2 1
0
32 33.6
Education
PHD 69 0
7 15
36
11
0
44 42.4
Engineering Sci.
PHD 23
0
7 14
2
0 0
33 33.2
English
PHD 19
0
2
9
6
2 0
33 38.4
Geography
PHD
18
0
6
7
4
1
0 33
35.2
History
PHD 9
0 1
0 5
3 0
44 44.3
Kinesiology
PHD 16
0
2 14
0
0 0
33
33.3
Linguistics
PHD
17
0
2
8
6
1 0 39
39.7
Math. ?
& Stats.
PHD 30
0 8
17 4 1 0
32 33.7
Philosophy
PHD
7 0
2 3 1
1 0
37 37.6
Physics
PHD
28
0
12 14
1
1 0 30 32.2
Psychology
PHD
71 0
20 39 10
2 0 32 33.8
Res. & Env. Mgmt
PHD
6 0
2 2 2
0 0 32
35.7
Soc. ?
& Anth.
PHD
17 0
4 8 2 3
0 37 38.1
•
Spl.
Arrangemrlts
PHS
21
0
0
8
9 4
0 45 43.1
University:
604 0
150 301
117 36 0 33 35.6
.
21
0 ?
2
?
4 ?
6 ?
8 ?
10
?
12
?
14
?
16
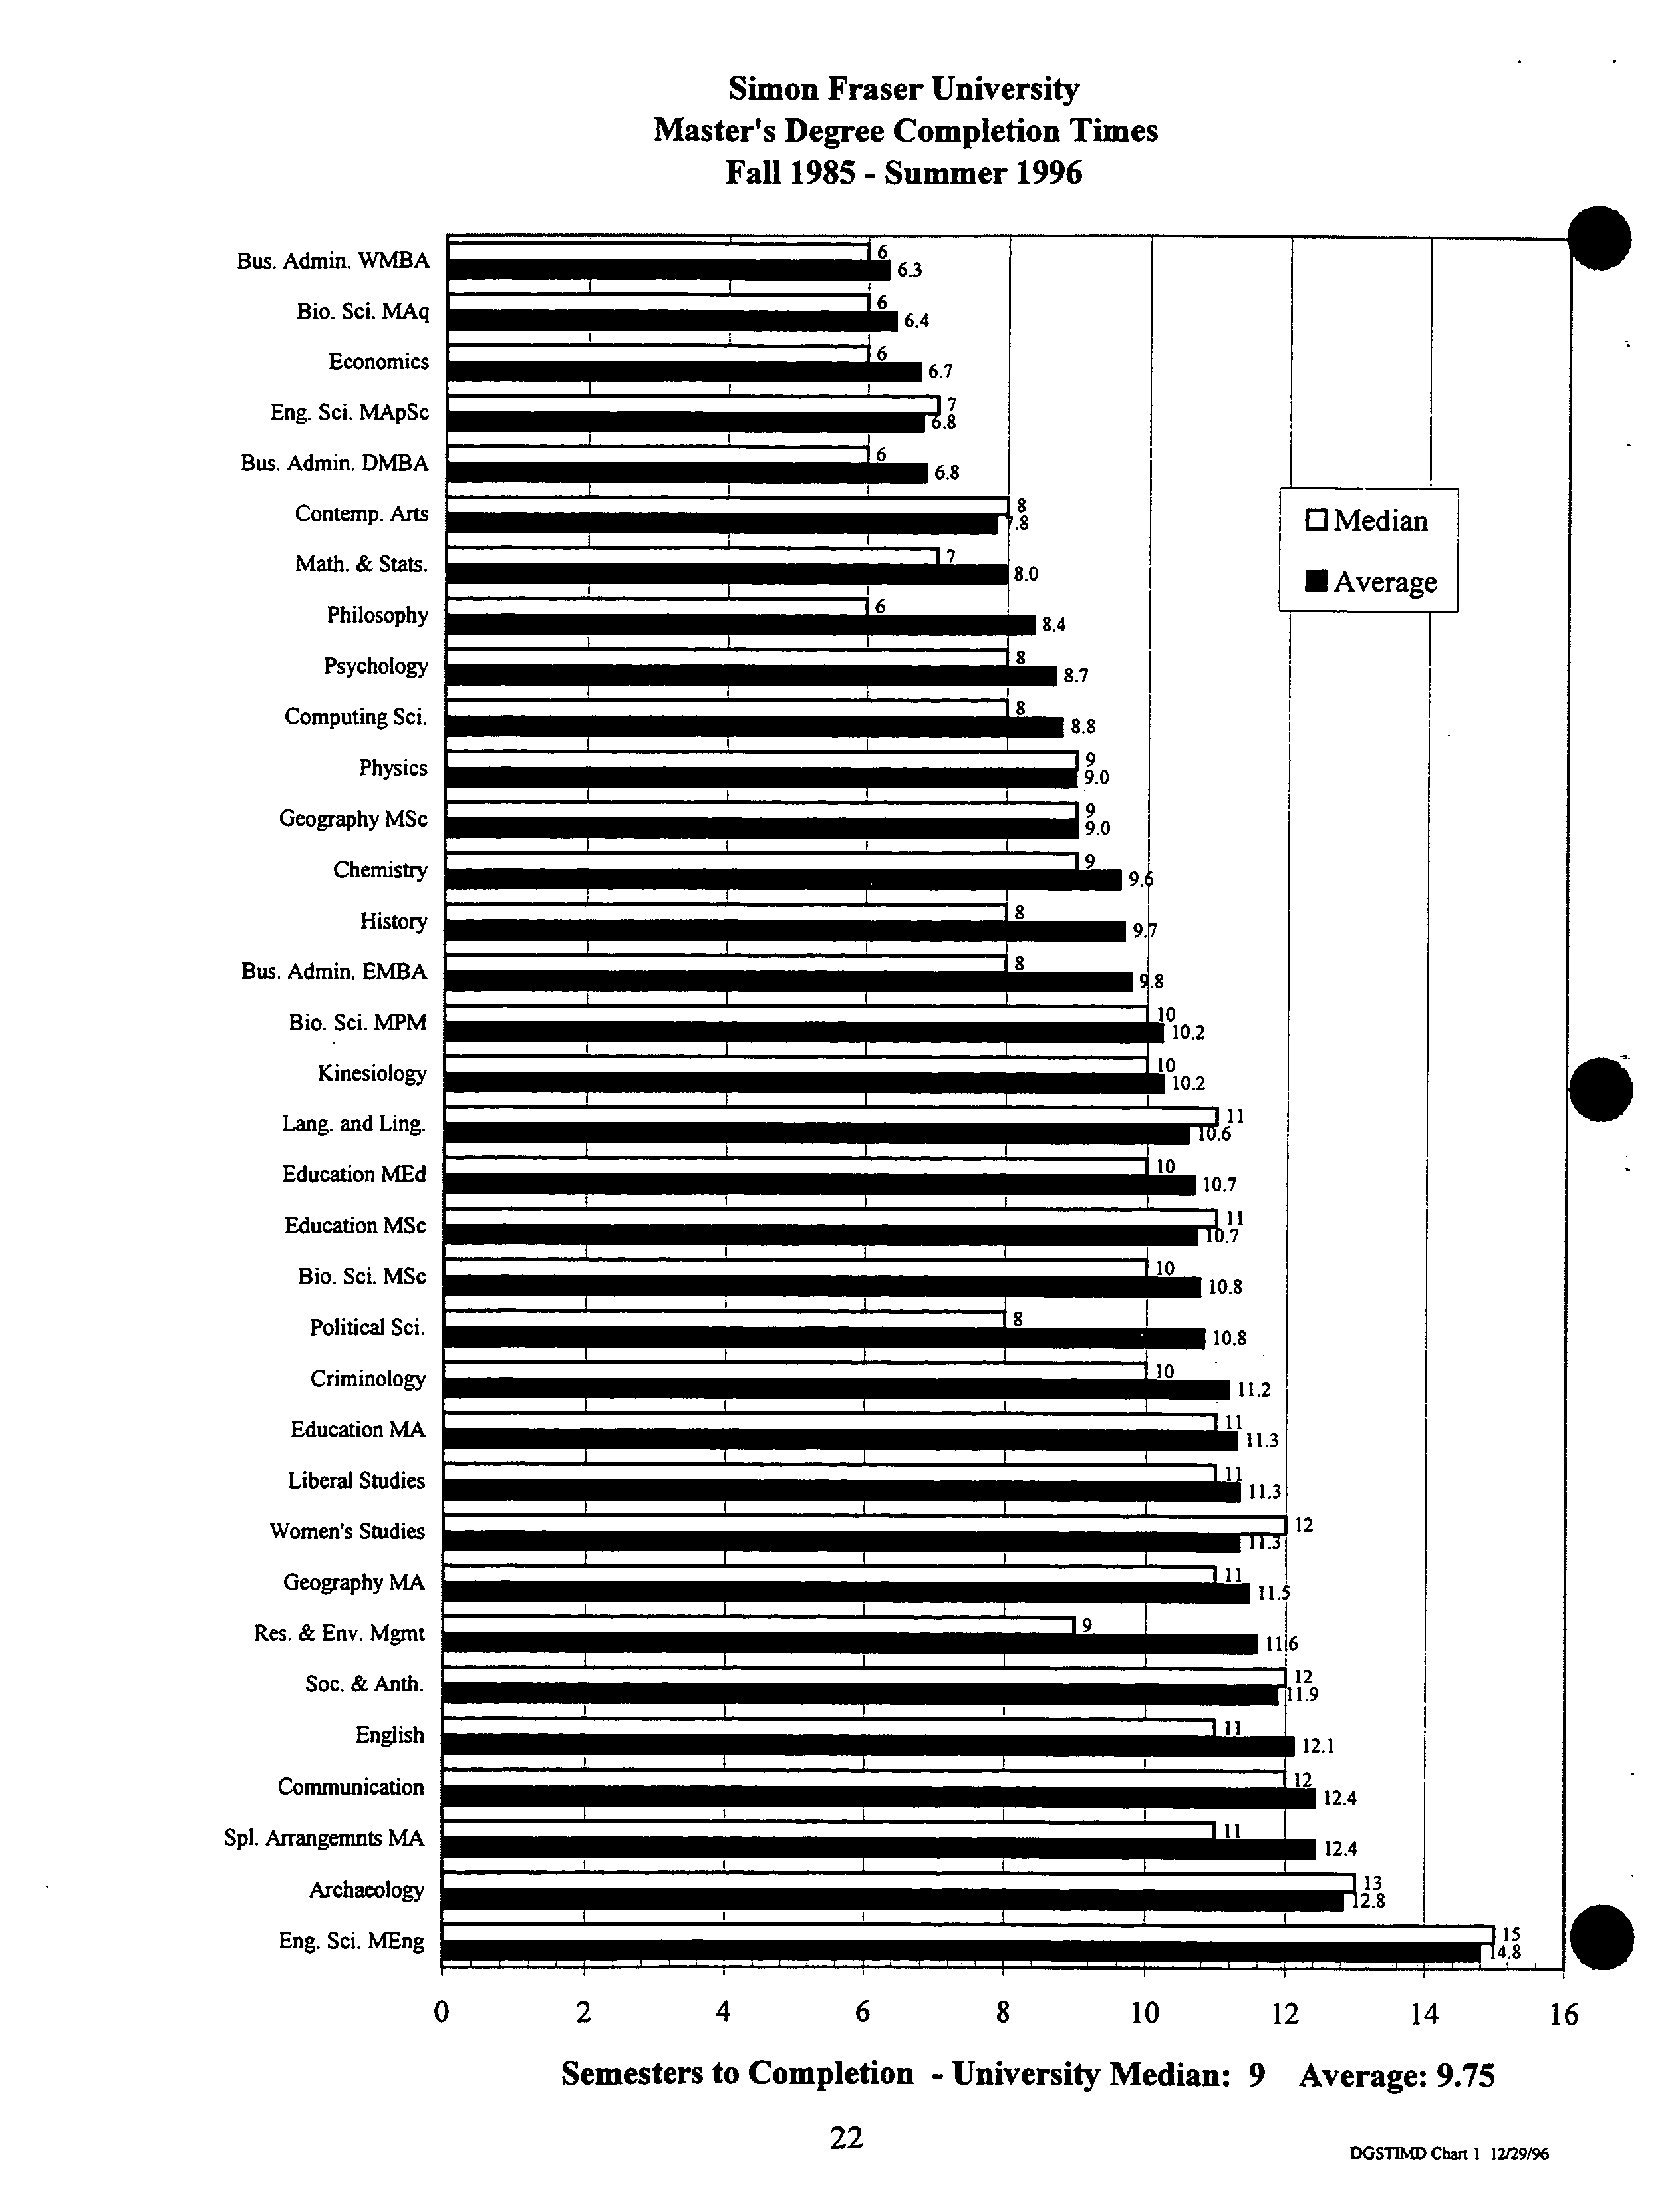
Simon Fraser University ?
Master's Degree Completion Times?
Fall 1985 - Summer 1996
Bus. Admin. WMBA ?
Bio. Sd. MAq
?
Economics ?
Eng. Sci. MApSc ?
Bus. Admin. DMBA ?
Contemp. Arts
?
Math. & Stats. ?
Philosophy ?
Psychology ?
Computing Sci.
?
Physics ?
Geography MSc
?
Chemistry ?
History ?
Bus. Admin. EMBA ?
Bio. Sci. MPM ?
Kinesiology ?
Lang. and Ling. ?
Education MEd
?
Education MSc ?
Bio. Sci. MSc ?
Political Sci.
?
Criminology ?
Education MA ?
Liberal Studies
?
Women's Studies
?
Geography MA
?
Res. & Env. Mgmt ?
Soc. & Anth. ?
English ?
Communication ?
Spi. Arrangemnts MA ?
Archaeology ?
Eng. Sci. MEng
Semesters to Completion - University Median: 9 Average: 9.75
22
?
OG5TIMD Chart
1
I2t29196
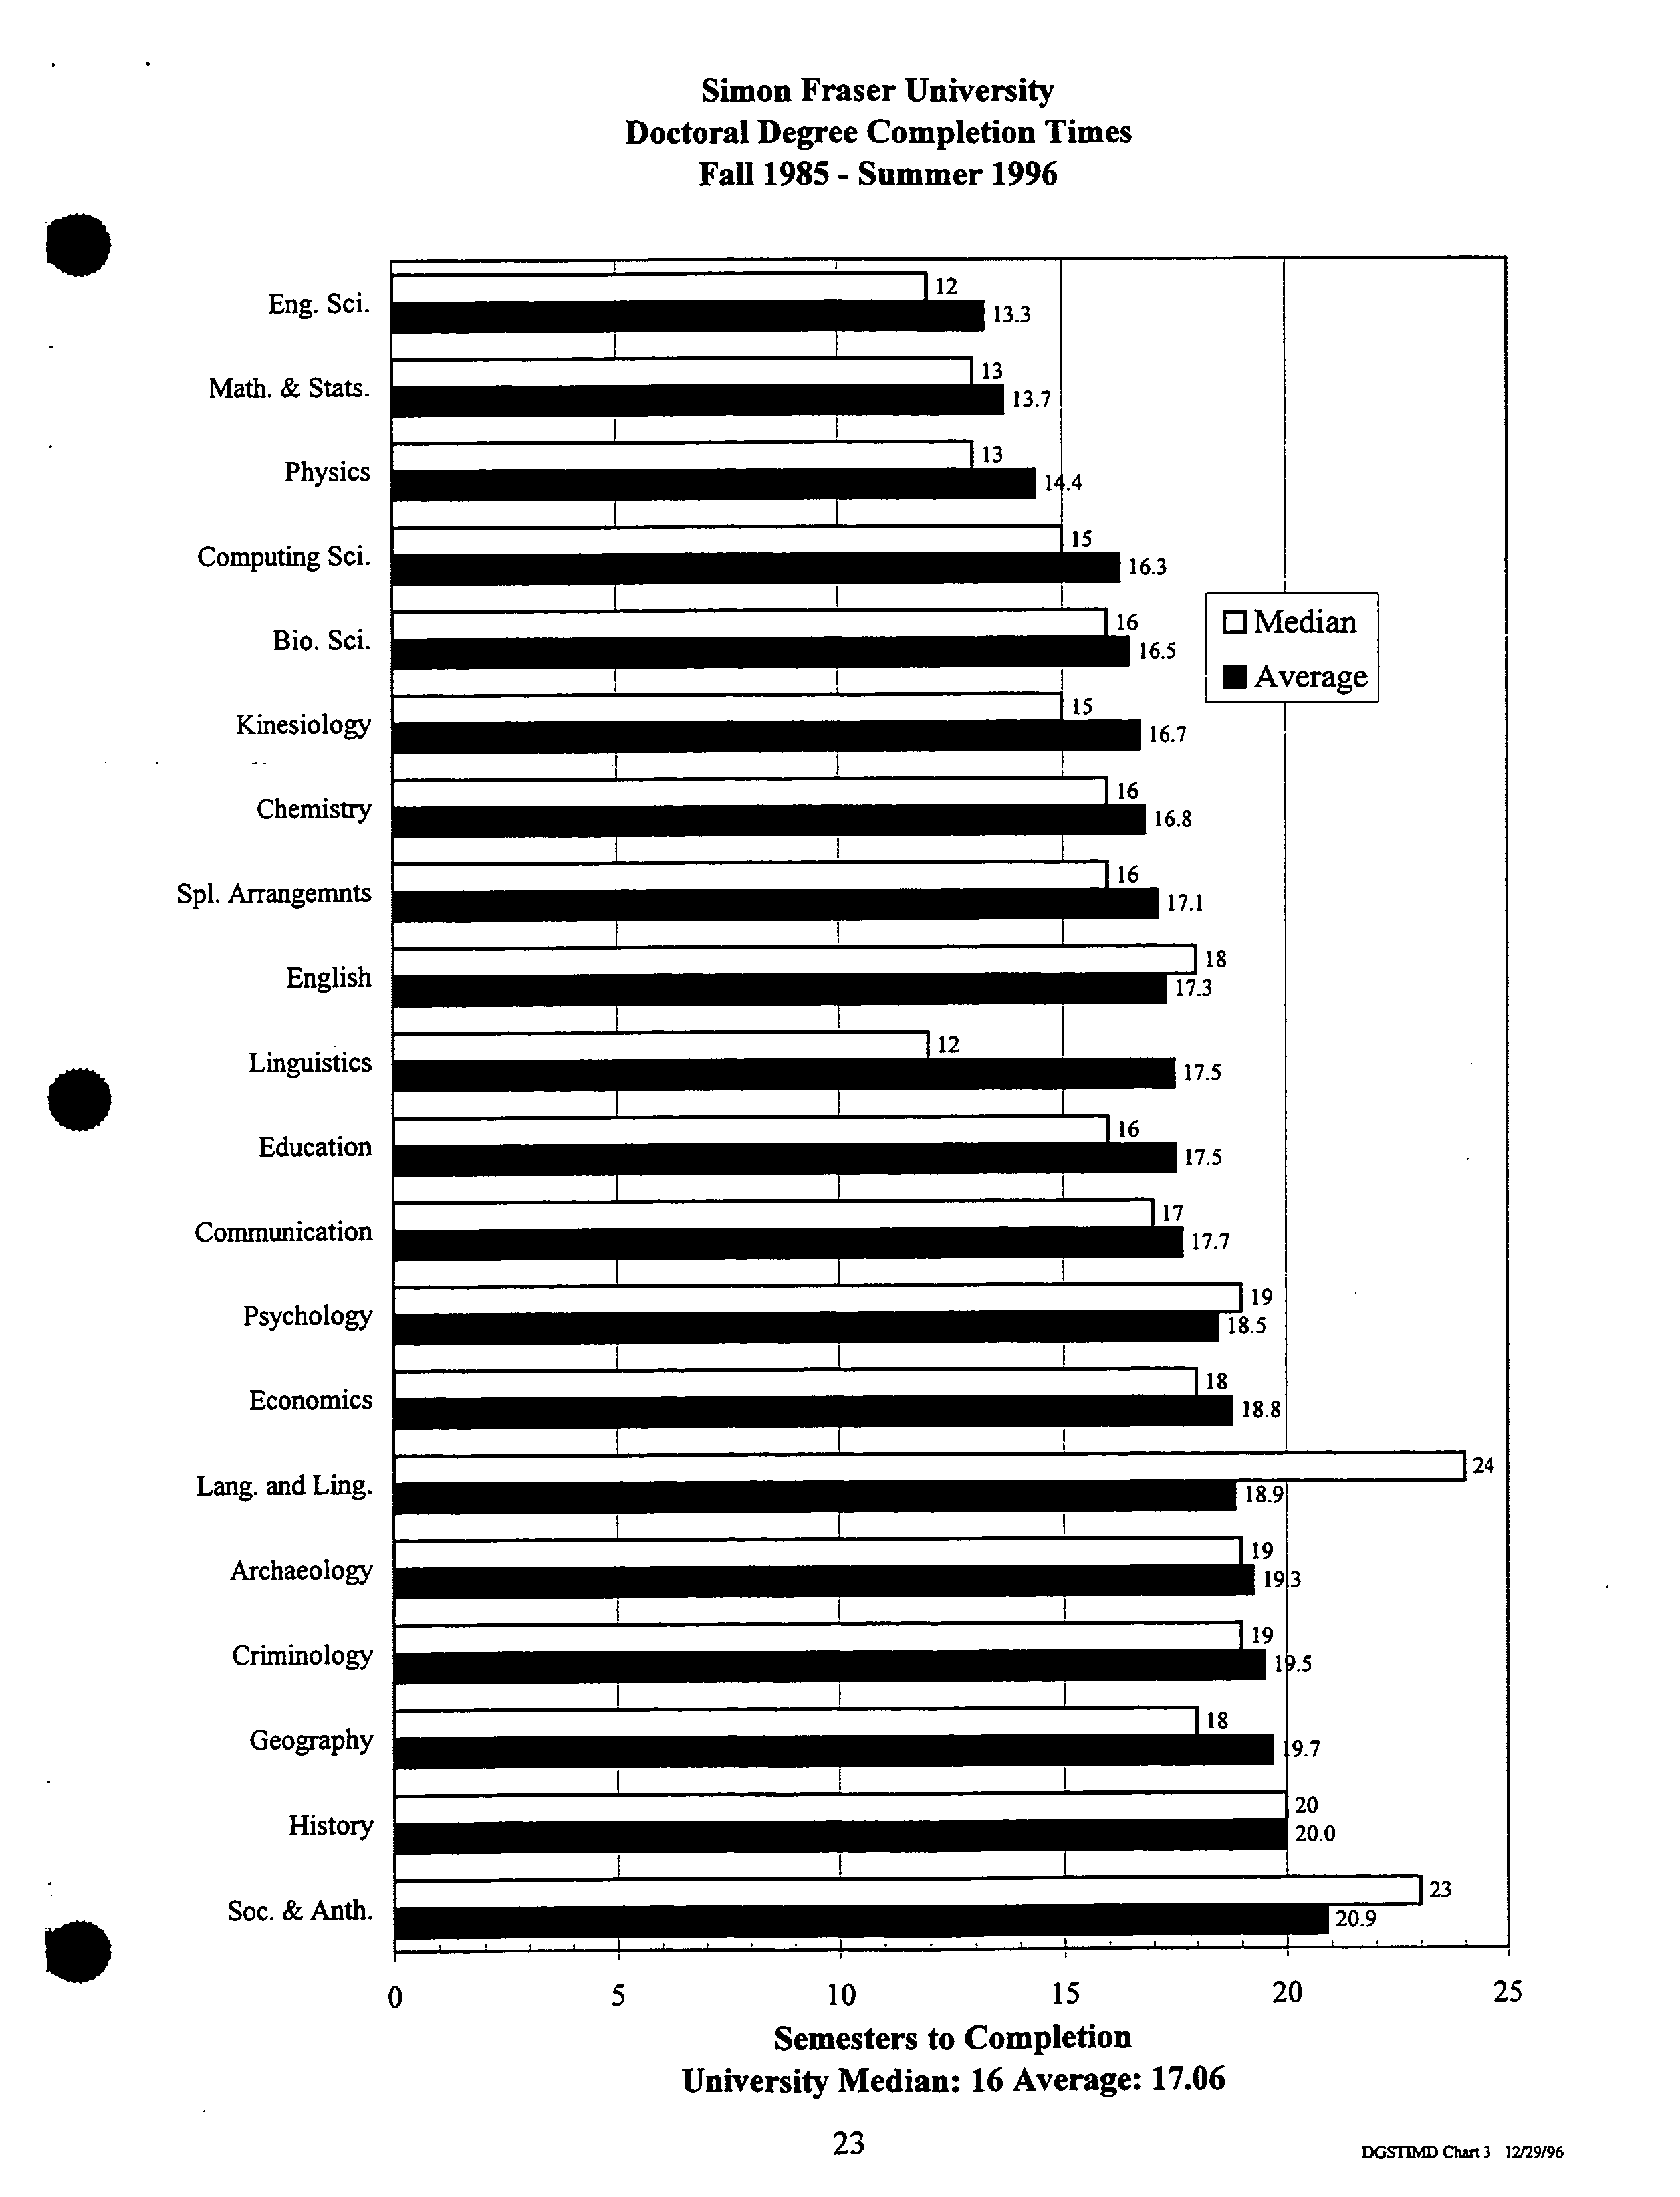
Simon Fraser University ?
Doctoral Degree Completion Times ?
Fall 1985 - Summer 1996
12
•
ii
13.3
13.7
iiim
I
.4
15
- 16.3
116 ?
DMedian
16.5
•
Average
15
16.7
i-=
^
16.8
116
17.1
118
17.3
12
- 17.5
16
- 17.5
Th7
17.7
119
18.5
118
18.8
1
24
•
19
193
al
.5
18
9.7
20
20.0
123
20.9
S
Eng. Sci.
?
Math. &
Stats. ?
Physics ?
Computing Sci.
?
Bio. Sci.
?
Kinesiology
?
Chemistry ?
Spi. Arrangemnts?
English ?
Linguistics ?
Education ?
Communication
?
Psychology
?
Economics
?
Lang.
and Ling. ?
Archaeology
?
Criminology ?
Geography
?
History
S
?
Soc. &
Anth.
0 ?
5 ?
10
?
15
?
20 ?
25
?
Semesters to Completion
?
University Median: 16 Average: 17.06
DGSTIMD Chart 3
12129196
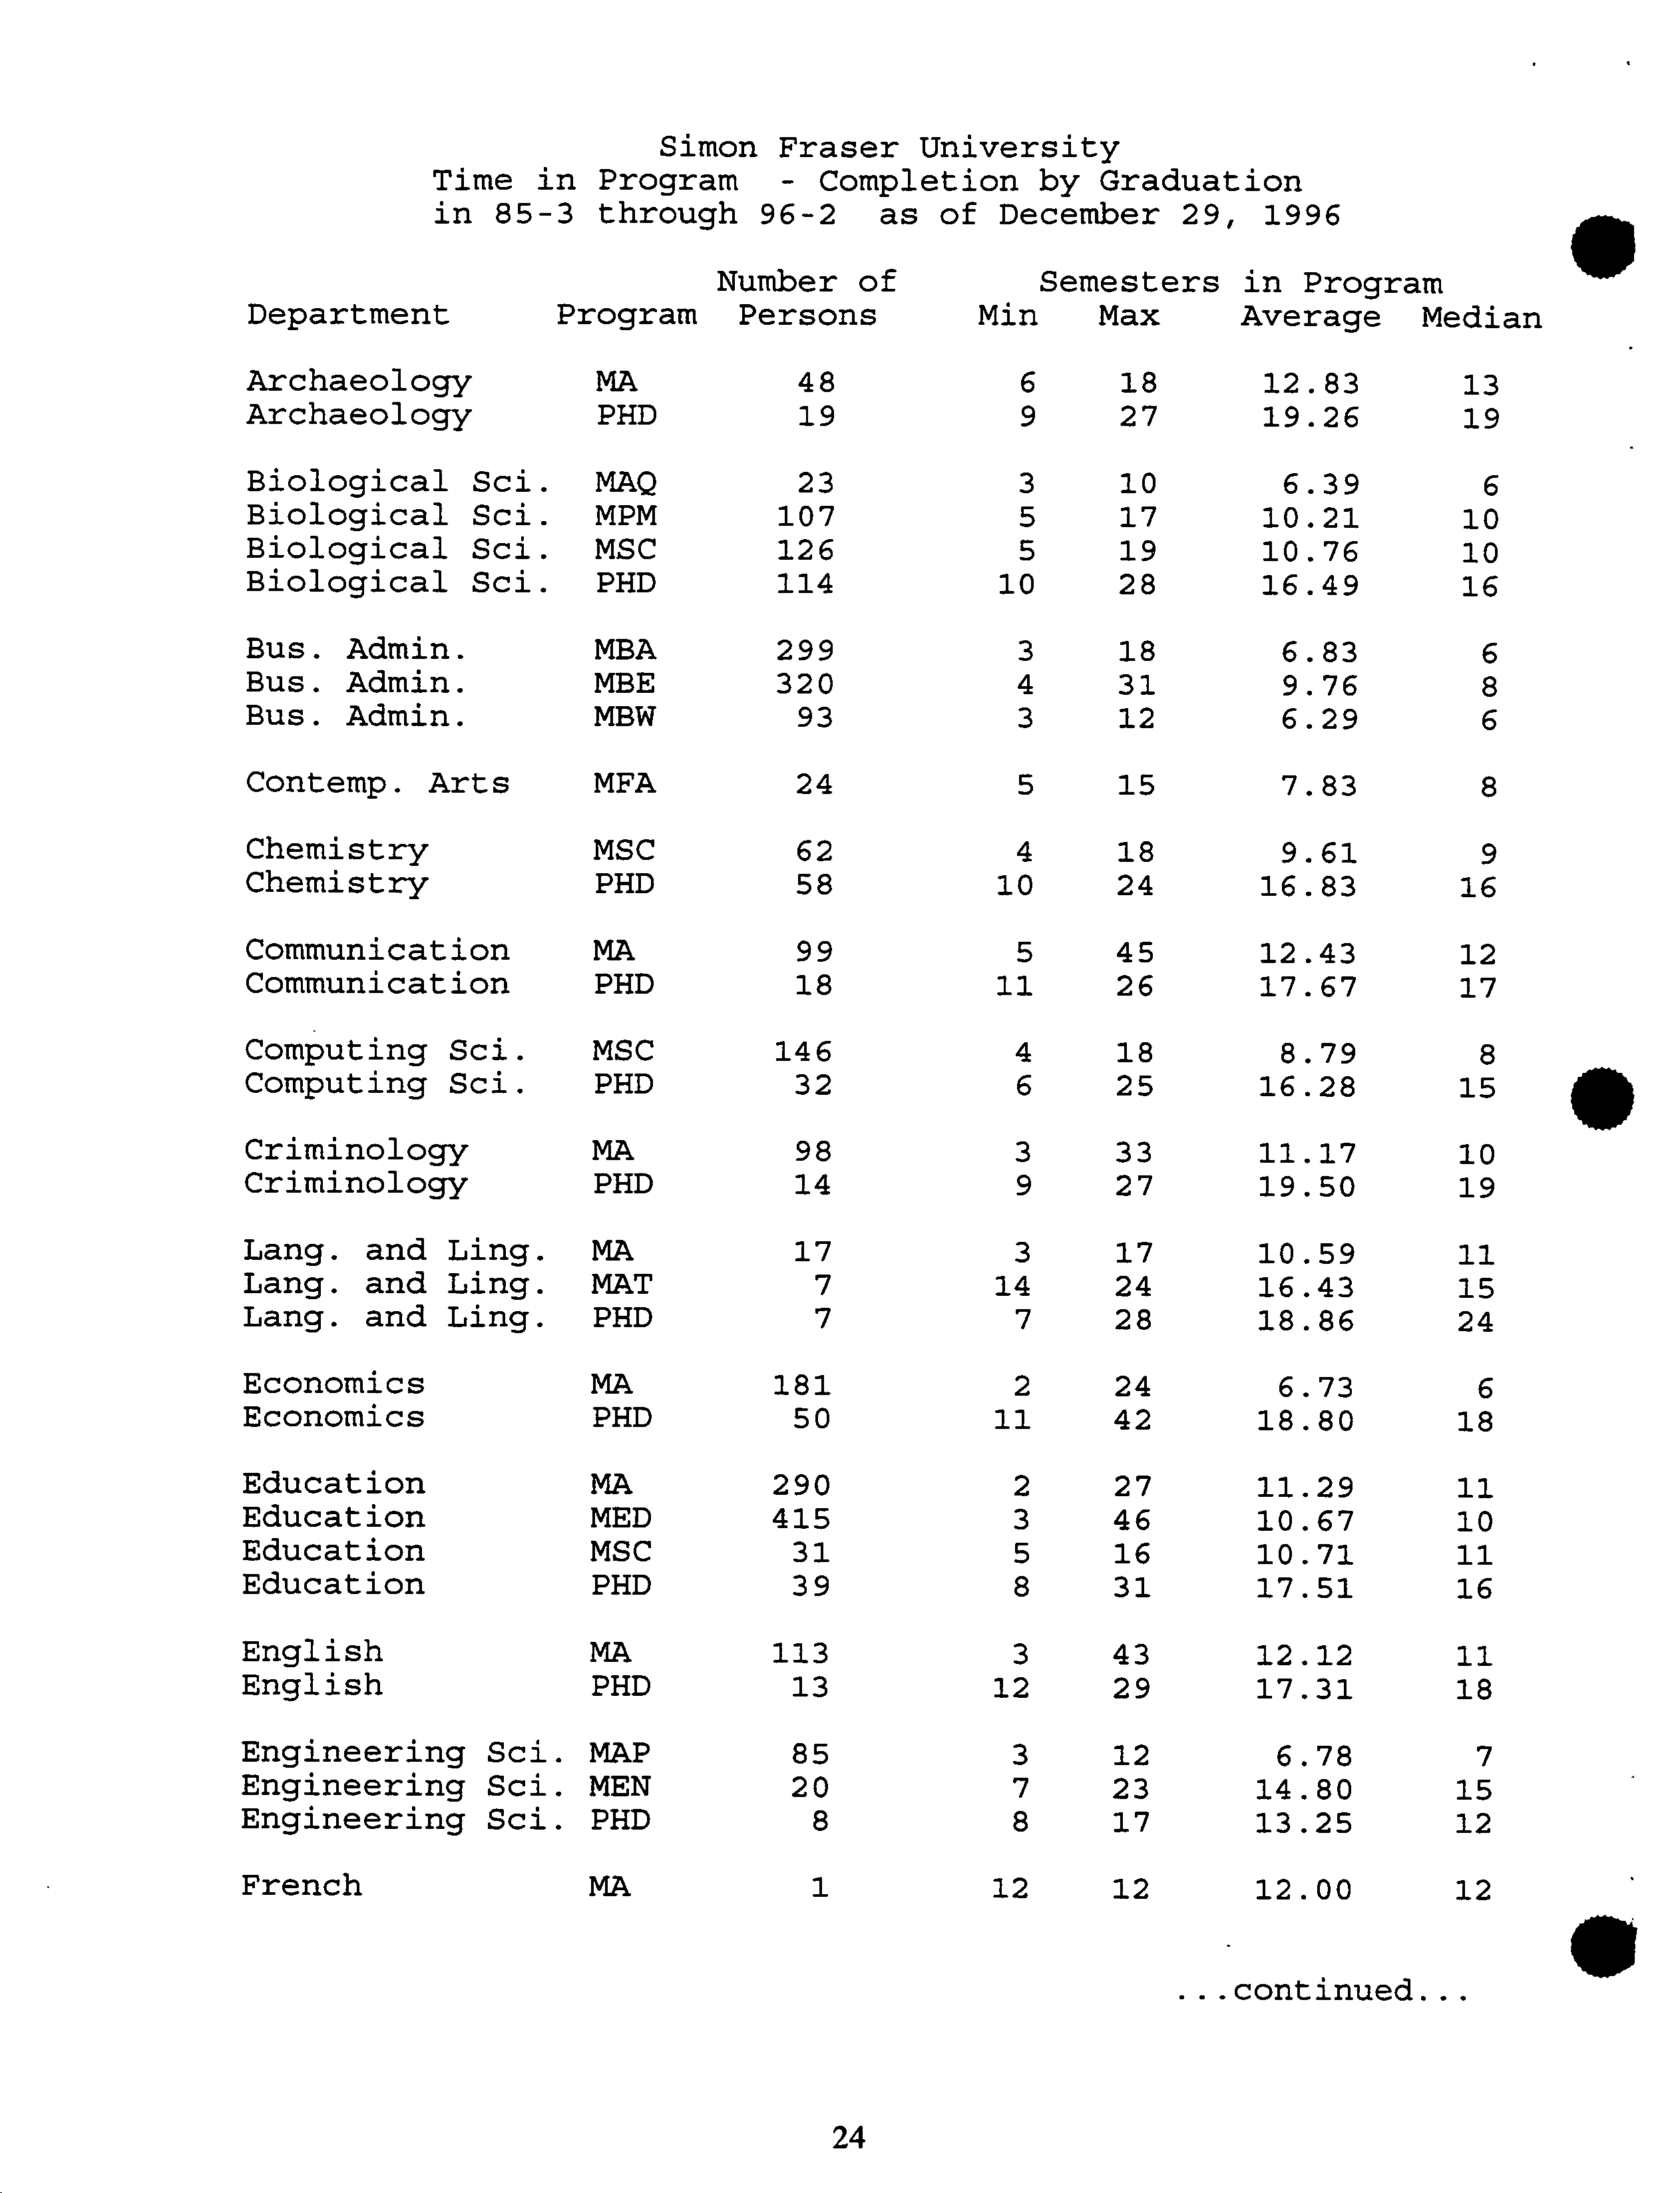
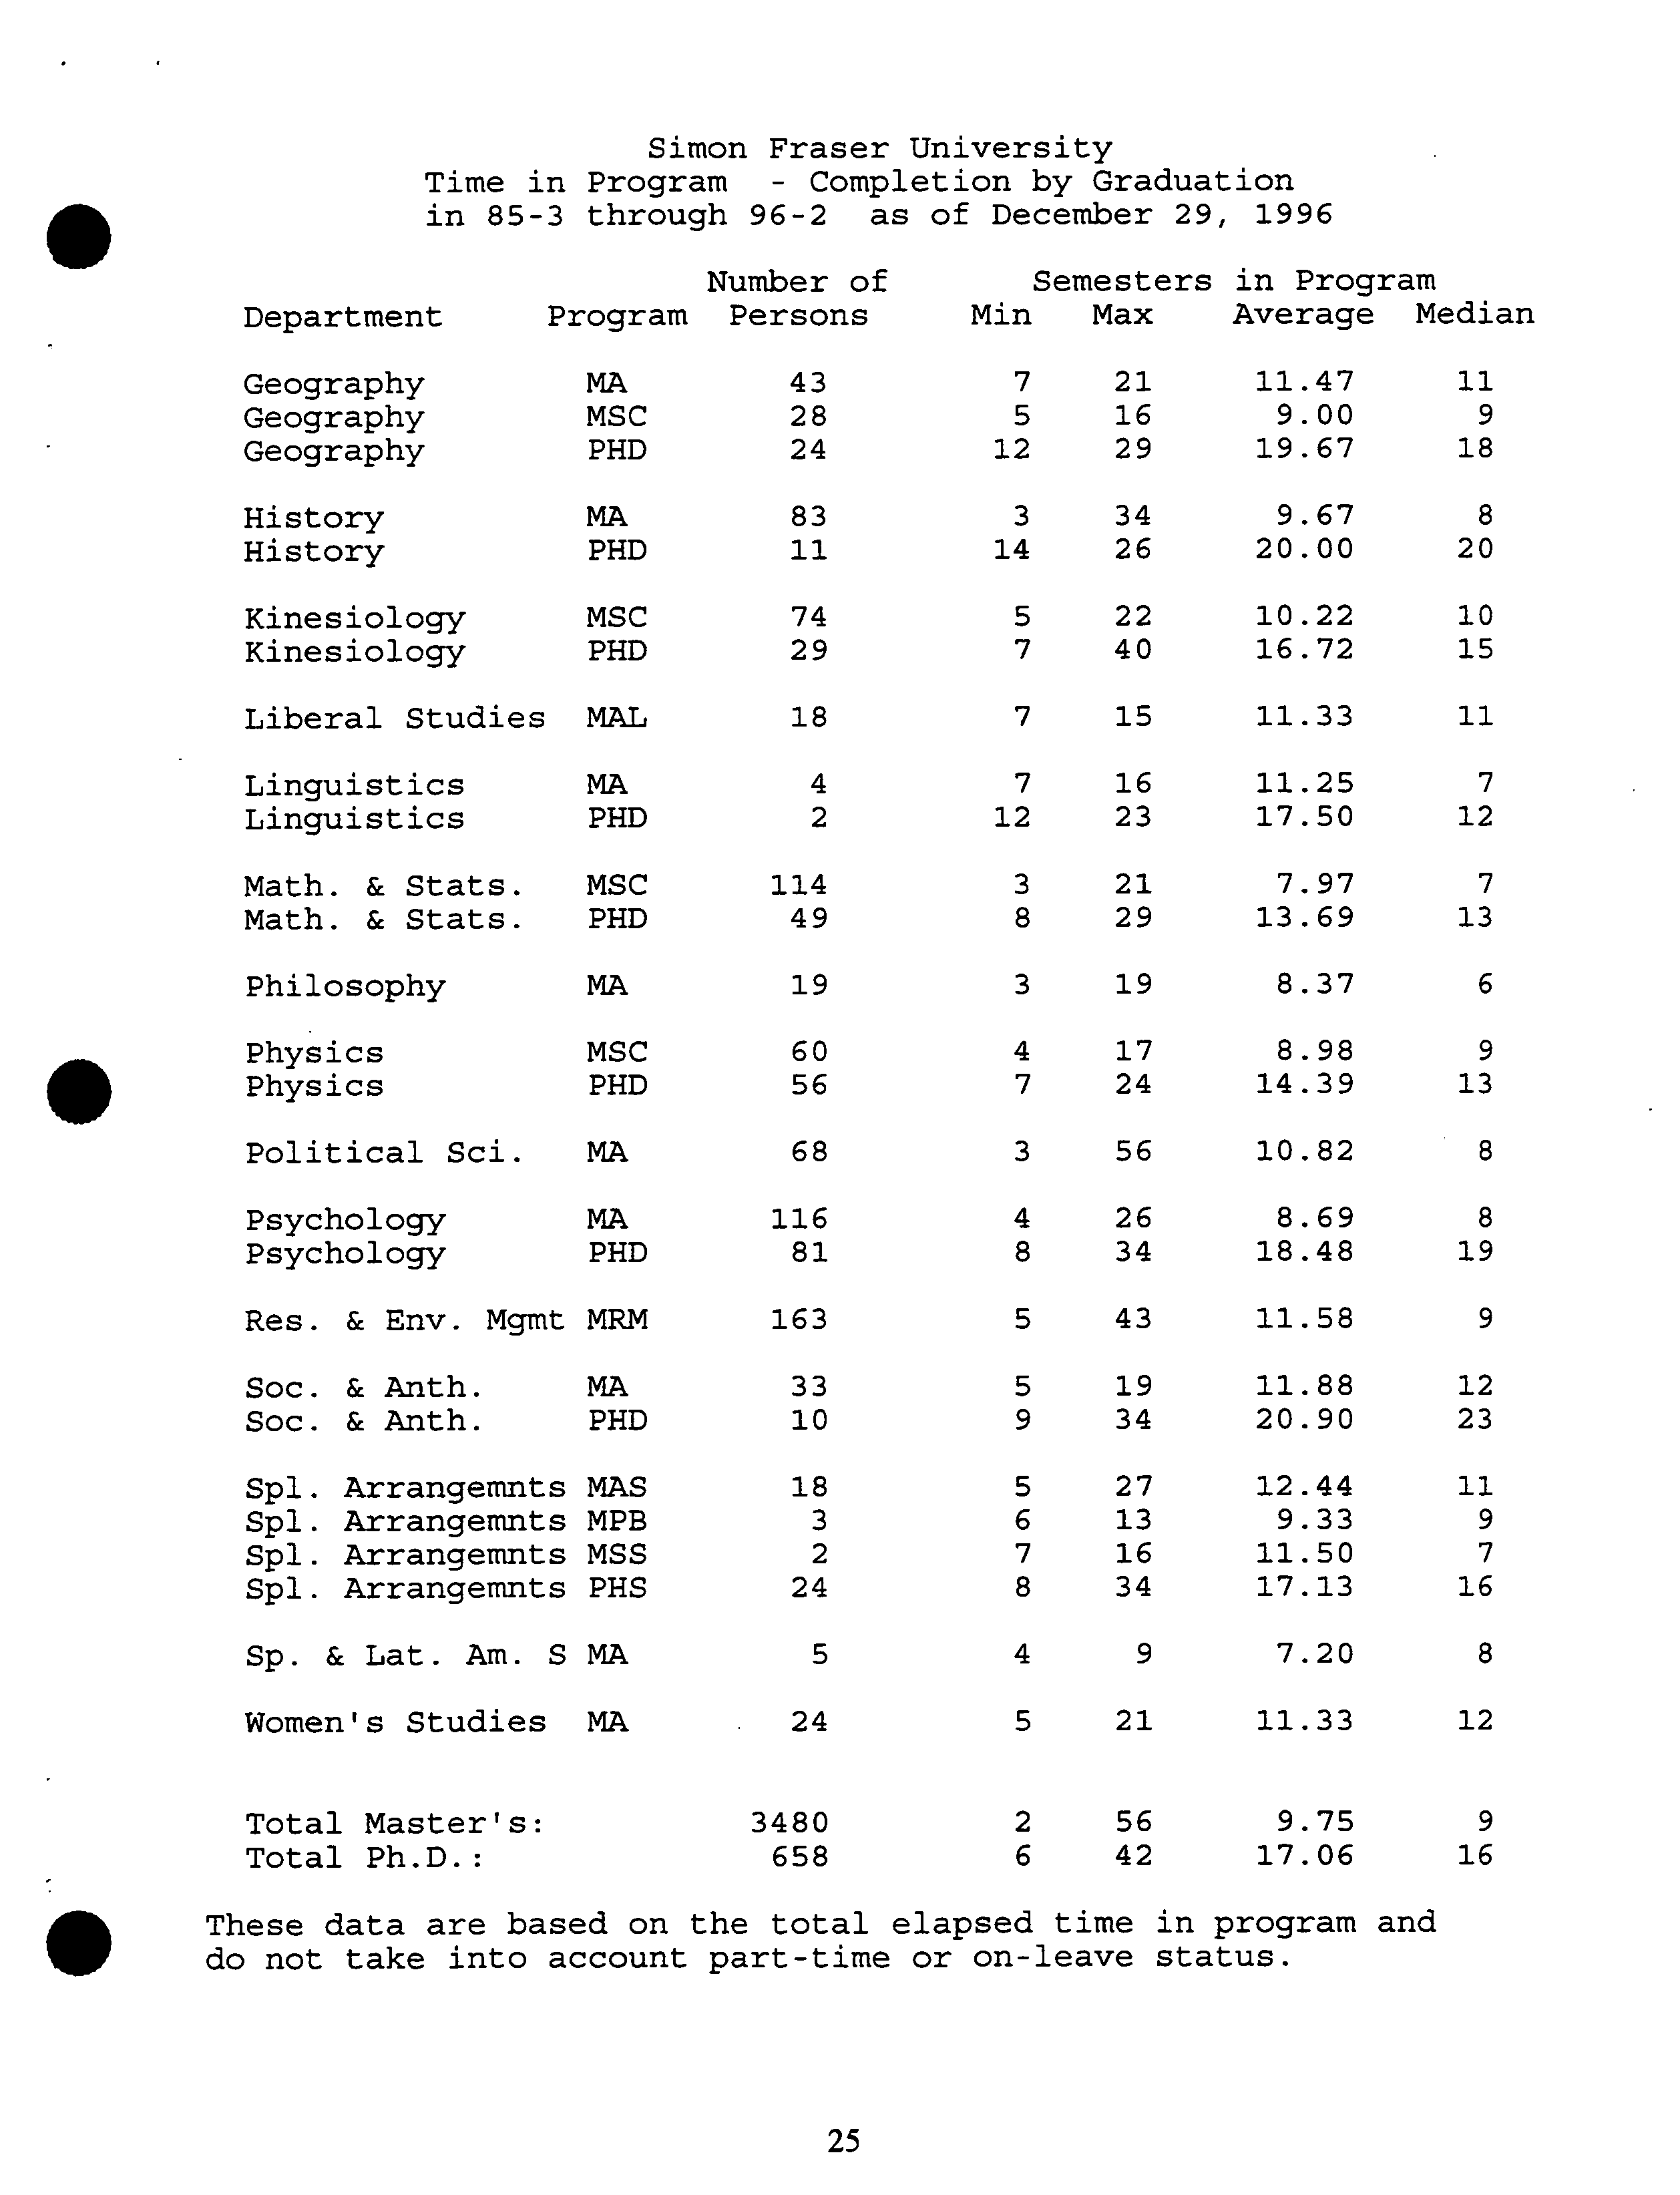
Simon Fraser University
Time in Program - Completion by Graduation
in 85-3 through 96-2 as of December 29, 1996
Number of ?
Semesters in Program
Department
?
Program
Persons
Min Max
Average
Median
Archaeology
MA
48
6 18
12.83
13
Archaeology
PHD
19
9
27
19.26
19
Biological Sci.
MAQ
23
3 10
6.39
6
Biological Sci.
MPM
107
5
17
10.21
10
Biological Sd.
MSC
126
5
19
10.76
10
Biological Sci.
PHD
114
10 28
16.49
16
Bus. Admin.
MBA
299
3 18
6.83
6
Bus. Admin.
MBE
320
4
31
9.76
8
Bus. Admin.
MBW
93
3 12
6.29
6
Contemp. Arts
MFA
24
5 15
7.83
8
Chemistry
MSC
62
4 18
9.61
9
Chemistry
PHD
58
10 24
16.83
16
Communication
MA
99
5 45
12.43
12
Communication
PHD
18
11 26
17.67
17
Computing Sci.
MSC
146
4 18
8.79
8
Computing Sci.
PHD
32
6 25
16.28
15
Criminology
MA
98
3
33
11.17
10
Criminology
PHD
14
9 27
19.50
19
Lang. and Ling.
MA
17
3 17
10.59
11
Lang. and Ling.
MAT
7
14
24
16.43
15
Lang. and Ling.
PHD
7
7
28
18.86
24
Economics
MA
181
2
24
6.73
6
Economics
PHD
50
11
42
18.80
18
Education
MA
290
2 27
11.29
11
Education
MED
415
3
46
10.67
10
Education
MSC
31
5 16
10.71
11
Education
PHD
39
8
31
17.51
16
English
MA
113
3 43
12.12
11
English
PHD
13
12
29
17.31
18
Engineering Sci.
MAP
85
3 12
6.78
7
Engineering Sci.
MEN
20
7
23
14.80
15
Engineering Sci.
PHD
8
8 17
13.25
12
French
MA
1
12
12
12.00
12
S
continued...
24
Simon Fraser University
Time in Program - Completion by Graduation
in 85-3 through 96-2 as of December 29, 1996
Number of
Semesters
in Program
Department ?
Program Persons
Min
Max
Average ?
Median
Geography
MA
43
7 21
11.47
11
Geography
MSC
28
5
16
9.00
9
Geography
PHD
24
12 29
19.67
18
History
MA
83
3
34
9.67
8
History
PHD
11
14 26
20.00
20
Kinesiology
MSC
74
5
22
10.22
10
Kinesiology
PHD
29
7 40
16.72
15
Liberal Studies
MAL
18
7 15 11.33
11
Linguistics
MA
4
7 16
11.25
7
Linguistics
PHD
2
12
23
17.50
12
Math. ?
& Stats.
MSC
114
3
21
7.97 7
Math.
?
& Stats.
PHD
49
8
29 13.69
13
Philosophy
MA
19
3
19
8.37
6
Physics
MSC
60
4
17
8.98
9
Physics
PHD
56
7
24
14.39
13
Political Sci.
MA
68
3
56
10.82
8
Psychology
MA
116
4
26
8.69
8
Psychology
PHD
81
8
34
18.48
19
Res. & Env. Mgmt
MRI4
163
5
43
11.58
9
Soc.
?
& Anth.
MA
33
5
19
11.88 12
Soc. ?
& Anth. PHD
10
9
34 20.90
23
Spi. Arrangemnts
MAS
18
5
27
12.44
11
Spi. Arrangemnts
MPB
3
6
13
9.33
9
Spi. Arrangemnts
MSS
2
7 16
11.50
7
Spi. Arrangemnts
PHS
24
8
34
17.13
16
Sp. ?
& Lat. Am.
?
S
MA
5
4 9
7.20
8
Women's Studies
MA
24
5
21 11.33
12
Total Master's:
3480
2
56
9.75
9
Total Ph.D. :
658
6
42
17.06
16
These data are based on
the total
elapsed
time in program and
.
do not take into account
part-time
or on-leave status.
25
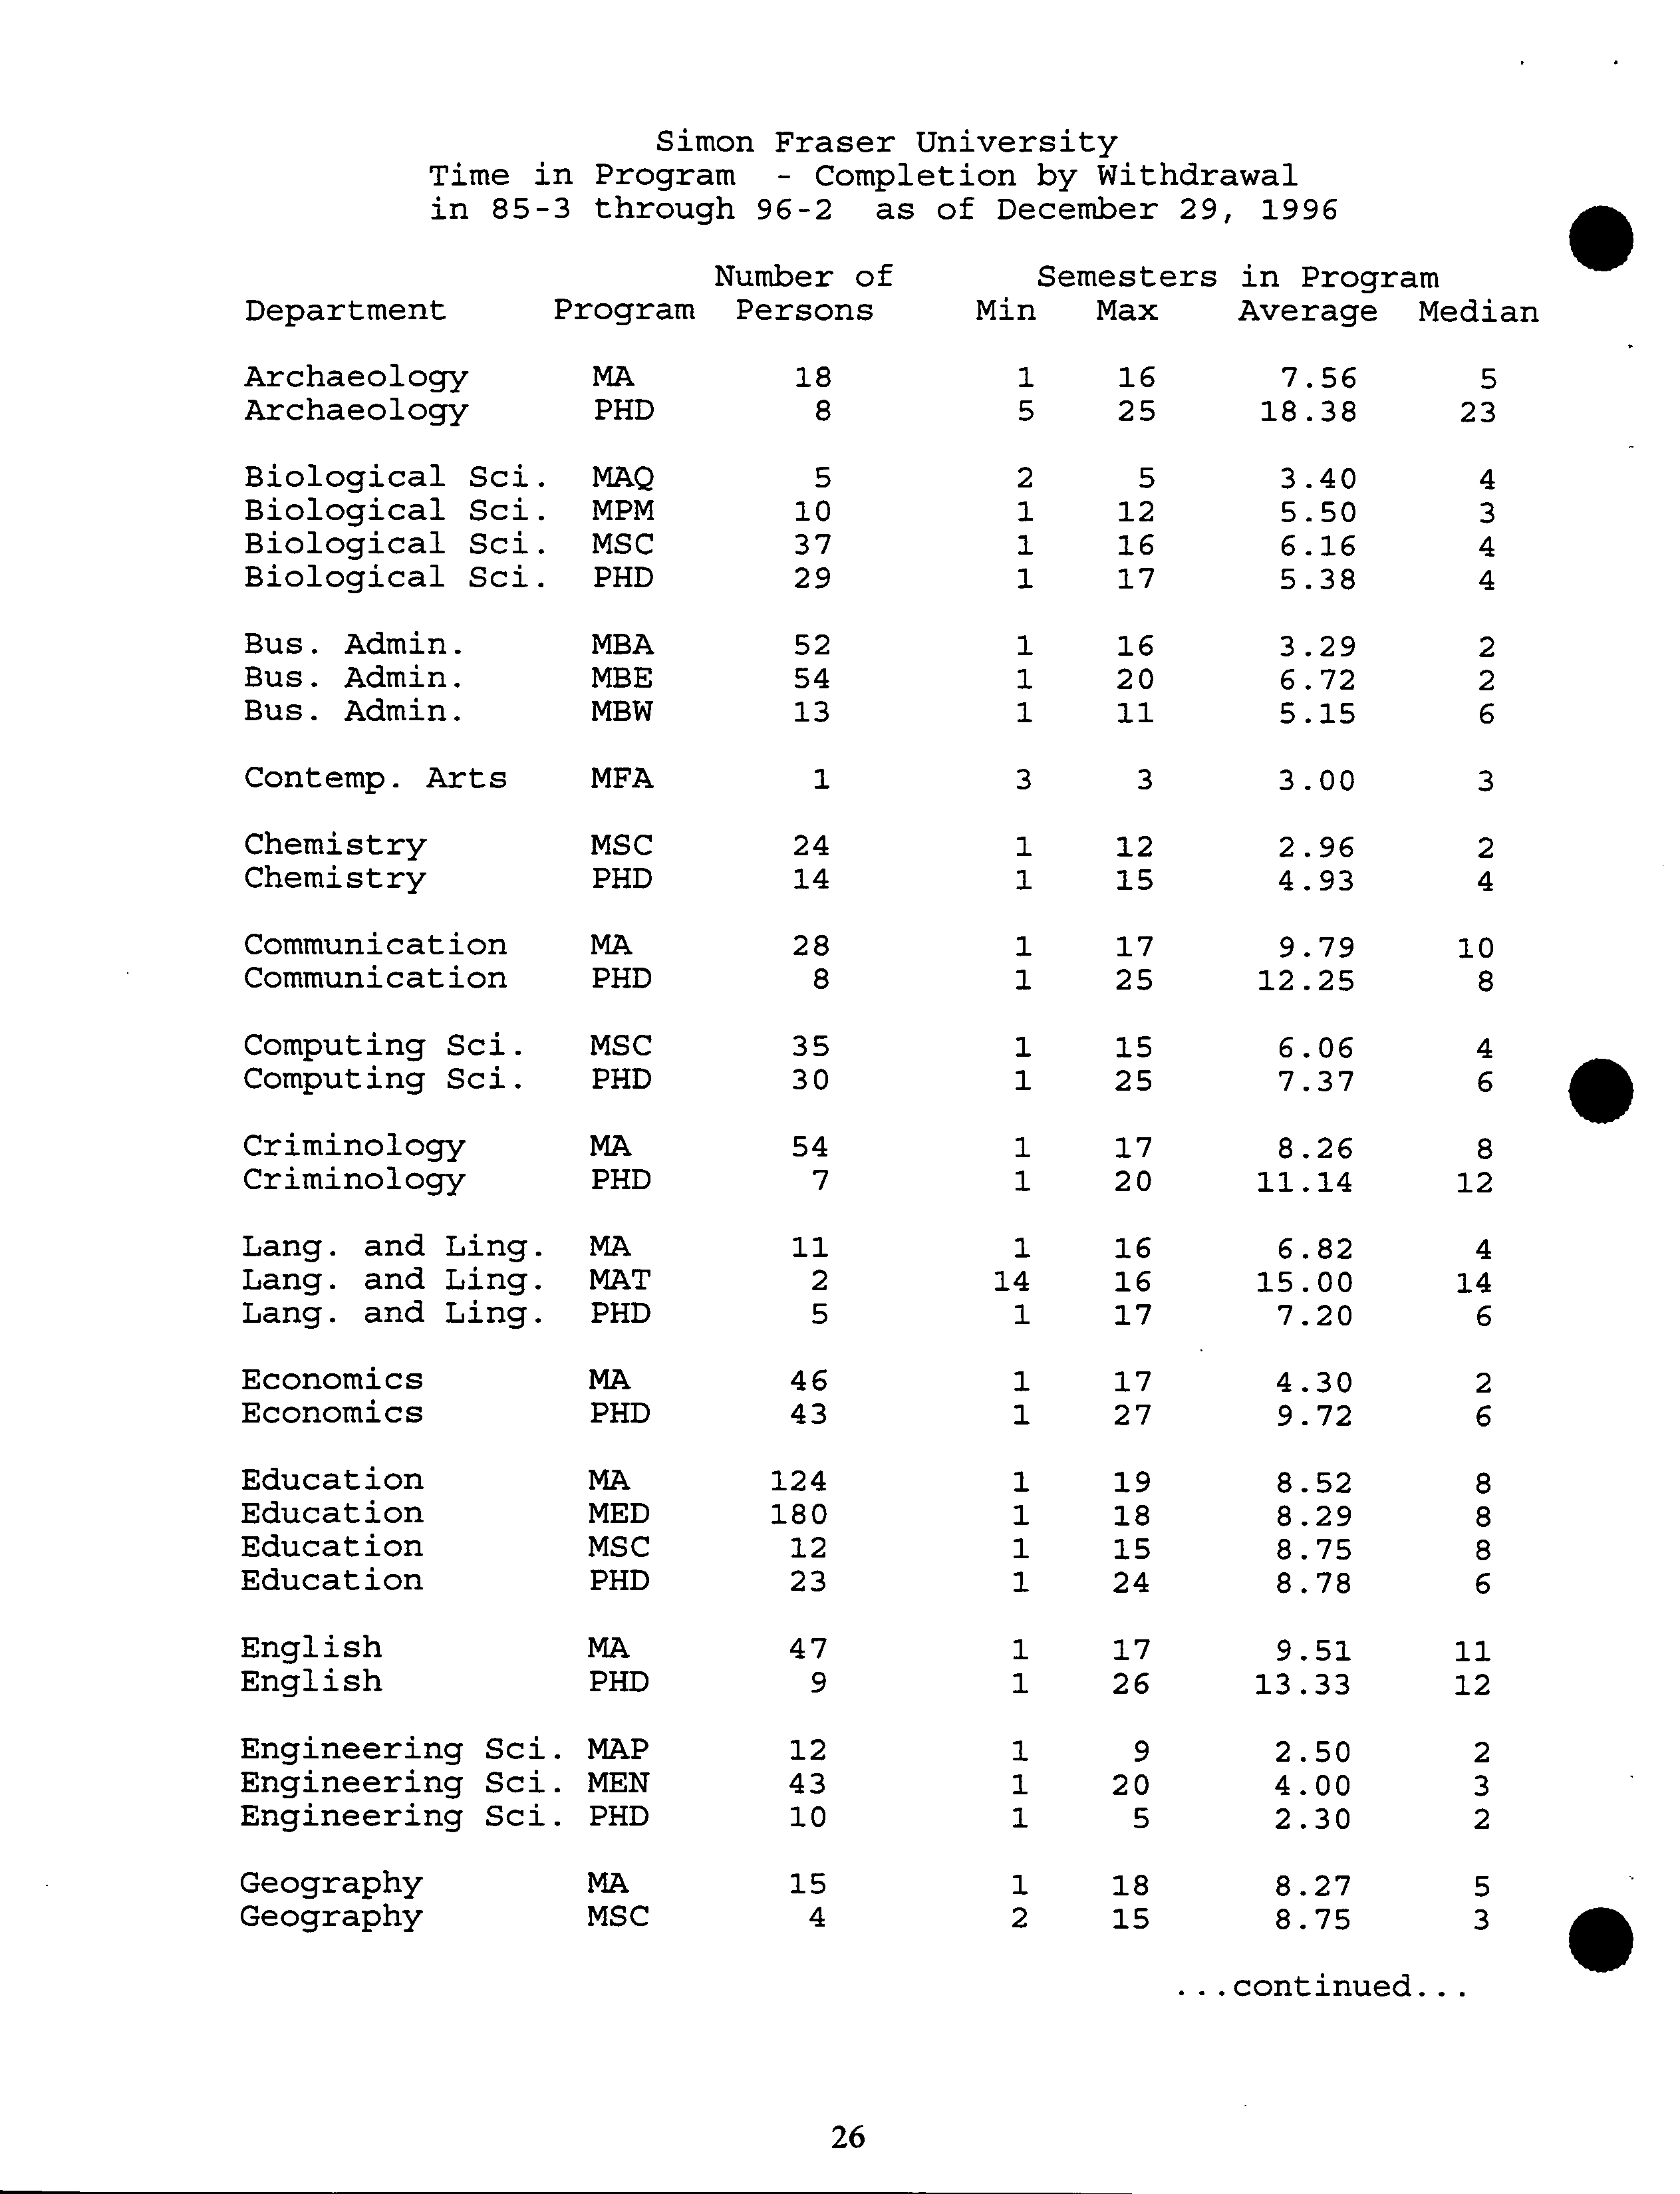
Simon
Fraser
University
Time in
Program
- Completion
by Withdrawal
in 85-3
through
96-2 ?
as
of December 29,
1996
Number of
Semesters
in Program
Department ?
Program ?
Persons Min Max
Average
?
Median
Archaeology
MA
18
1 16
7.56
5
Archaeology
PHD
8
5 25
18.38
23
Biological Sci.
MAQ
5
2
5
3.40
4
Biological Sci.
MPM
10
1 12
5.50
3
Biological Sci.
MSC
37
1 16
6.16
4
Biological Sci.
PHD
29
1
17
5.38
4
Bus. Admin.
MBA
52
1
16
3.29
2
Bus. Admin.
MBE
54
1 20
6.72
2
Bus. Admin.
MBW
13
1 11
5.15
6
Contemp. Arts
MFA
1
3
3
3.00
3
Chemistry
MSC
24
1
12
2.96
2
Chemistry
PHD
14
1
15
4.93
4
Communication MA
28
1
17
9.79
10
Communication PHD
8
1
25
12.25
8
Computing Sd.
MSC
35
1
15
6.06
4
Computing Sci.
PHD
30
1
25
7.37
6
Criminology
MA
54
1 17
8.26
8
Criminology
PHD
7
1 20
11.14
12
Lang. and Ling.
MA
11
1
16
6.82
4
Lang. and Ling. MAT
2
14
16
15.00
14
Lang. and Ling. PHD
5
1
17
7.20
6
Economics
MA
46
1 17
4.30
2
Economics
PHD
43
1 27
9.72
6
Education
MA
124
1
19
8.52
8
Education
MED
180
1
18
8.29
8
Education
MSC
12
1
15
8.75
8
Education
PHD
23
1
24
8.78
6
English
MA
47
1 17
9.51
11
English
PHD
9
1
26
13.33
12
Engineering Sci.
MAP
12
1
9
2.50
2
Engineering Sd. MEN
43
1
20
4.00
3
Engineering Sci. PHD
10
1
5
2.30
2
Geography
MA
15
1
18
8.27
5
Geography
MSC
4
2
15
8.75
3
continued...
26
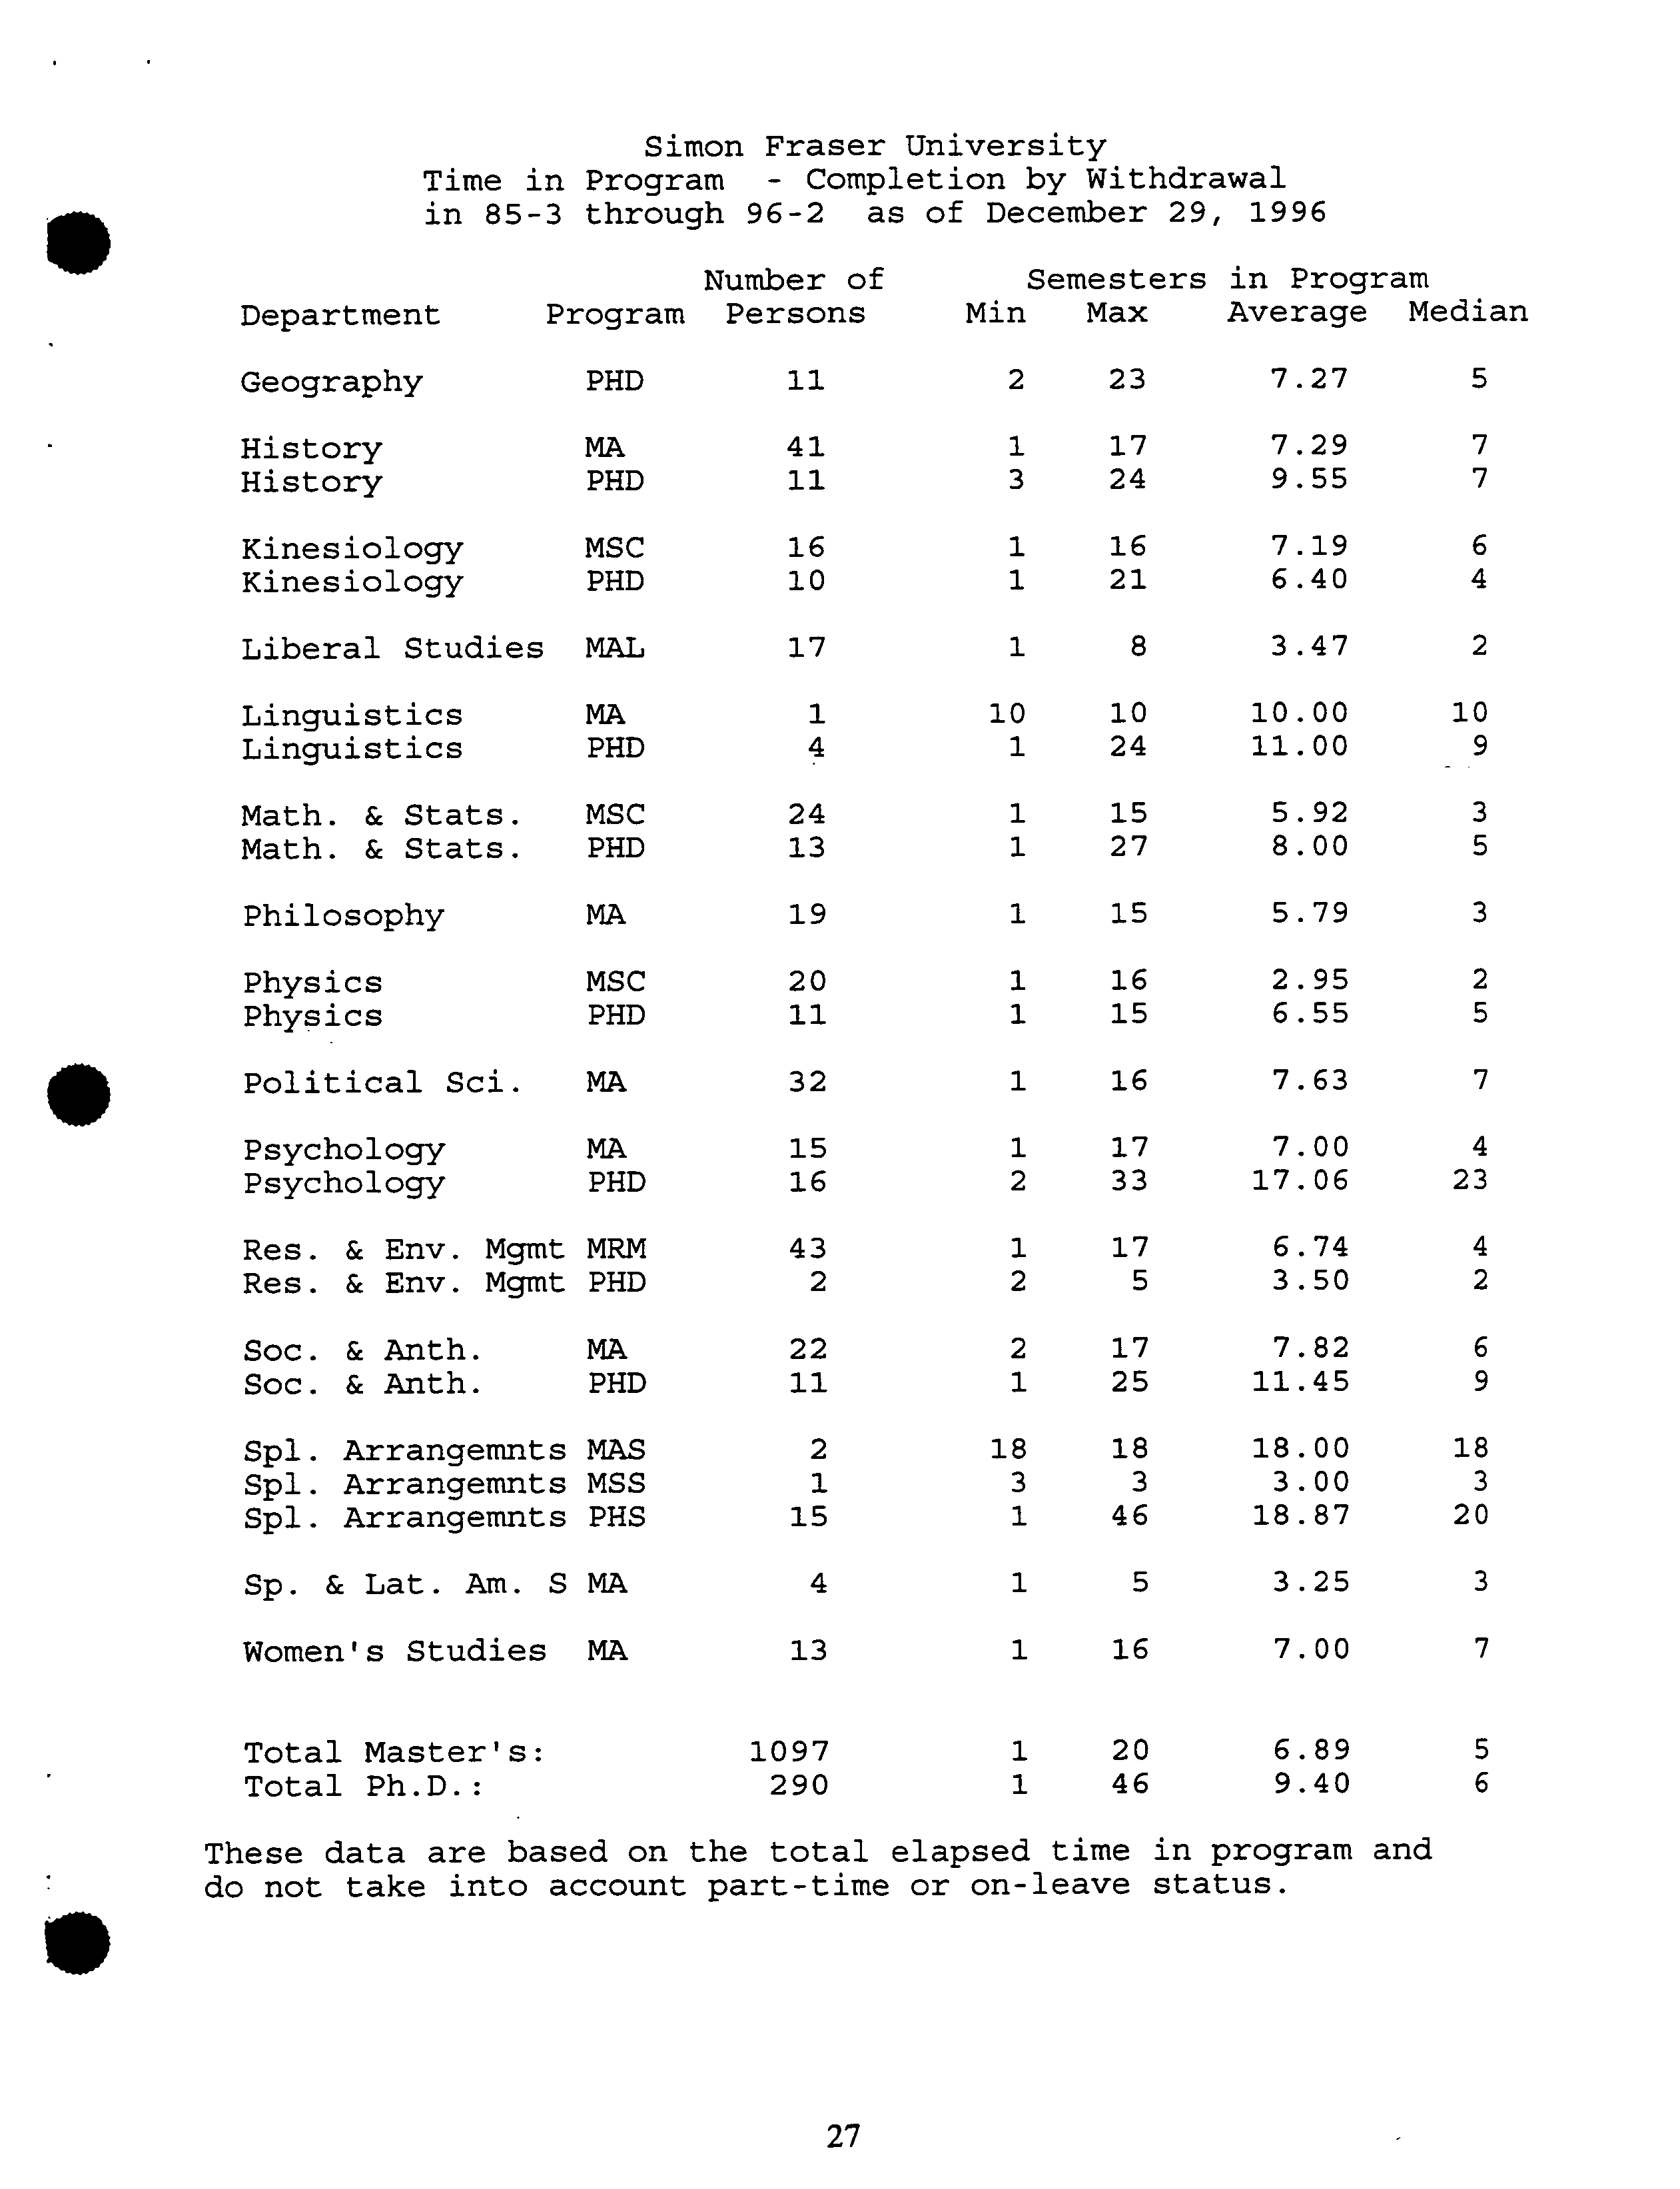
Simon
Fraser University
Time in
Program
- Completion by
Withdrawal
S
in 85-3
through
96-2 ?
as of December 29,
1996
Number of
Semesters
in Program
Department ?
Program
?
Persons
Min Max
Average
?
Median
Geography
PHD
11
2 23
7.27
5
History
MA
41
1
17
7.29
7
History
PHD
11
3
24
9.55
7
Kinesiology
MSC
16
1
16
7.19
6
Kinesiology
PHD
10
1
21
6.40
4
Liberal Studies
MAL
17
1
8
3.47
2
Linguistics
MA
1
10
10
10.00
10
Linguistics
PHD
4
1
24 11.00
-
?
9
Math. ?
& Stats.
MSC
24
1 15
5.92 3
Math. ?
& Stats.
PHD
13
1
27 8.00 5
Philosophy
MA
19
1
15
5.79
3
Physics
MSC
20
1
16
2.95
2
Physics
PHD
11
1
15
6.55
5
Political Sci.
MA
32
1 16
7.63
7
Psychology
MA
15
1
17
7.00
4
Psychology
PHD
16
2 33
17.06
23
Res. & Env. Mgmt
MRM
43
1
17
6.74
4
Res. & Env. Mgmt
PHD
2
2
5
3.50
2
Soc. ?
& Anth.
MA
22
2
17
7.82 6
Soc.
?
& Anth.
PHD
11
1
25
11.45
9
Spi. Arrangemnts MAS
2
18
18
18.00
18
Spl. Arrangemnts
MSS
1
3
3
3.00
3
Spl. Arrangemnts
PHS
15
1 46
18.87
20
Sp. ?
& Lat. Am.
?
S
MA
4
1 5
3.25
3
Women's Studies
MA
13
1
16
7.00
7
Total Master's: ?
1097 ?
1 ?
20 ?
6.89 ?
5
Total Ph.D.:
?
290 ?
1 ?
46 ?
9.40 ?
6
These data are based on the total elapsed time in program and
do not take into account part-time or on-leave status.
I*
27
Simon Fraser University ?
Graduate Completion Data
?
1990/91 Master's Registrants
Eng. Sci. MEng
?
Lang. and Ling.
?
Geography MSc
?
Bus. Admin. WMBA ?
Education MSc
?
Geography MA
?
Physics ?
Kmesiology ?
Philosophy ?
History ?
Contemp. Arts
?
Bio. Sci. MAq ?
Archaeology
?
Bio. Sci. MPM
?
Women's Studies
?
Soc. & Anth. ?
Criminology
?
Math. & Stats. ?
Political Sci.
?
Chemistry
?
Bio. Sci. MSc ?
English
?
Psychology ?
Communication ?
Computing Sci.
?
Eng. Sci. MApSc
?
Res. & Env. Mgmt
?
Bus. Admin. EMBA
?
Education MA
?
Economics
?
Bus. Admin. DMBA
?
Education MEd
• Enrolled
Transferred
o Withdrawn
Graduated
.
0 ?
10 ?
20 ?
30 ?
40
?
50 ?
60
?
a
Number
DGSCRDEP Chart 1 12129/96
Simon Fraser University ?
Graduate Completion Data
?
1990/91 Doctoral Registrants
Spi. Arrangements ?
History
?
Psychology
?
Communication
?
• Enrolled
Transferred
?
Economics
?
o Withdrawn
• Graduated
Math. & Stats.
English
.
?
Criminology
Computing Sci.
Eng. Sci.
Education
Physics
Kinesiology
Bio. Sci.
Chemistry
r
5
?
10
?
15
Number
12129/96 DGSCRDEP Chart 2
Simon Fraser University
Degree Completion Rates by Department and Semester of Entry
Entry in 90-3
-
through
Completed91-2 ?
-
-
December
?
29,
-
?
1996
?
Currently
40
Department
Pgm
Total
Degree
Withdrawn Transferred
Enrolled
Archaeology
MA
5
4 80.0% 1
20.0 0
1
0 0.006 0
0.0%
Archaeology
PHD
1
0 0.0% 1 100.0% 0 0.0%
0
0.0%
Biological Sci.
MAQ
4
4 100.0% 0 0.006 0 0.006 0
0.001
Biological Sci.
MPM 6 5 83.3% 0 0.006
0 0.006
1
16.7%
Biological Sci.
MSC 16 10 62.5%
5 31.3%
1
6.301
0 0.0%
Biological Sd.
PHD
11 7
63.6% 0 0.0%
0
0.006 4 36.4%
Bus. Admin.
MBA
38 35
92.1% 3 7.9%
0 0.006 0 0.0%
Bus. Admin.
MBE 34 24 70.6%
9 26.5% 0 0.0%
1 2.9%
Bus. Admin.
MBW
1
1 100.0%
0
0.0%
0 0.006 0 0.0%
Contem. Arts
MFA
4
4 100.0% 0
0.0% 0 0.006 0 0.0%
Chemistry
Chemistry
Communication
Communication
Computing Sci.
Computing Sci.
Criminology
Criminology
Lang. and Ling.
Economics
Economics
Education
Education
Education
Education
English
English
Engineering Sci.
Engineering Sci.
Engineering Sci.
Geography
Geography
Geography
History
History
MSC 15 10 66.7%
5 33.3% 0 0.0%
PHD 18 7 38.9%
5
27.8%
4 22.2%
MA 16 14 87.5% 2 12.5%
0 0.006
PHD
7
1 14.3%
2 28.6% 0 0.0%
MSC 18 16 88.9%
2 11.1% 0 0.0%
PHD 8 2 25.0%
2 25.0 0
1
2
25.0%
MA 10
6 60.0
0
1
3
30.0 0
1
1
10.0%
PHD 5 2 40.0% 2
40.0% 0 0.0%
MA
1 1 100.0%
0 0.0% 0 0.00-S
MA 37
31 83.8%
5
13.5%
0 0.006
PHD 9 1 11.1%
5 55.6% 0 0.0%
MA 40 25 62.5%
11 27.5% 1
2.501
MED
60
38
63.3% 18
30.0% 1
1.706
MSC
3
1
33.3% 1 33.3% 0 0.006
PHD
9 3 33.3% 1 11.1%
0 0.0%
MA 14 12 85.7
1
0
1
7.1%
0 0.006
PHD 4
2 50.0% 1 25.0%
0 0.0%
MAP 24
21
87.5%
1
4.2% 2 8.306
MEN
5 0 0.0%
2
40.0 0
1
0 0.001
PHD 6 3 50.0%
1 16.7
0
1
0 0.006
MA 3 2 66.7%
1 33.3% 0 0.0%
MSC 1 1 100.0%
0
0.0% 0 0.001
PHD
1
0
0.0%
0
0.0% 0 0.0%
MA
6
3 50.0%
3 50.0%
0 0.0%
PHD 3 1 33.3%
0 0.006
0 0.0%
0
?
0.0%
2 11.1%
0 ?
0.0%
4 57.1%
0
?
0.0%
2 25.00k
0
?
0.0%
1 20.0%
1 ?
2.7%
3 33.3%
3 ?
7.5%
3 ?
5.0%
1 33.3%
5 55.6%
1 ?
7.1%
1 25.0%
0
?
0.0%
3 60.0%
2 33.3%
0
?
0.0%
0 ?
0.0%
1 100.0%
Is
0
0.0%
2 66.7%
Simon Fraser University
?
Degree Completion Rates by Department and Semester of Entry
I*
?
Completed
in 90-3 through 91-2 - December 29, 1996
Completed
?
Currently
Department ?
Pgm Total Degree Withdrawn Transferred Enrolled
Kinesiology
MSC 8
3
37.5%
1 12.5
0
1
4
50.0%
0
0.0%
Kinesiology
PHD 7
6 85.7%
1 14.3%
0 0.006
0
0.0%
Linguistics
PHD 1
0
0.0%
0 0.0%
0 0.0%
1
100.0%
Math.
?
& Stats.
MSC
10 7 70.0%
2 20.0%
1 10.0%
0
0.090S
Math.
?
& Stats. PHD 4
2 50.0%
1 25.0%
1 25.0%
0
0.001
Philosophy
MA. 5 3 60.0%
2 40.0%
0 0.0%
0
0.0%
Physics
MSC
7
3 42.9%
1 14.3%
3 42.9%
0 0.001
Physics
PHD 7
4
57.1%
0
0.0%
0 0.0%
3 42.9%
Political Sci.
MA 13
8 61.5% 5 38.5%
0 0.0%
0
0.0%
Psychology
MA
15
14 93.3% 1 6.701
0
0.0%
0 0.001
Psychology
PHD
7
1 14.3
1
0
2 28.6%
0
0.001
4 57.1%
Res. &Env. Mgmt
MRM
24
21 87.5% 2
8.3%
0
0.0%
1 4.2%
Res. & Env. Mgmt
PHD
1
0
0.001
0
0.006 0 0.0%
1
100.0%
Soc. ?
& Anth.
MA. 7
5 71.4 0
1
1 14.3%
0 0.0%
1
14.3%
Soc. ?
& Anth.
PHD 1
0 0.0% 1 100.0%
0 0.0%
0
0.001
Spl. Arrangemnts
PHD 4 1 25.0%
0 0.0%
1
25.0%
2
50.0%
Women's Studies
MA 6
5 83.3% 1 16.7%
0 0.0%
0
0.0%
All Master's
456 337 73.9
1
0
89
19.5%
14 3.1%
16 3.5%
All Doctoral
114
43
37.7
1
1
25 21.9%
8 7.0%
38 33.3%
31
Engineering Sci. MEng
?
Chemistry ?
Spi. Arrangemnts MPub ?
Philosophy
?
Geography MSc
?
Soc. & Anth. ?
Education MSc
?
Archaeology
?
Women's Studies
?
Physics ?
Geography MA ?
Communication
?
Biological Sci. MAq
?
Political Sci. ?
Liberal Studies
?
Contemp. Arts ?
Biological Sci. MPM ?
Criminology
?
Psychology ?
History ?
English ?
Kinesiology
?
Engineering Sci. MApSc ?
Education MEd
?
Biological Sci. MSc
?
Math. & Stats. ?
Economics ?
Res. & Env. Mgmt
?
Computing Sci.
?
Education MA ?
Bus. Admin. WMBA ?
Bus. Admin. EMBA
?
Bus. Admin. DMBA
Simon Fraser University ?
Graduate Completion Data?
1991/92 Master's Registrants
•Enrolled
Transferred
o Withdrawn
IM Graduated
.
o ?
5 ?
10 ?
15 ?
20
25 ?
30 ?
35
?
40 ?
45
?
S
Number
32 ?
Doscp
Chart 5
114197
Simon Fraser University ?
Graduate Completion Data ?
1991/92 Doctoral Registrants
Linguistics ?
History ?
Geography ?
Economics ?
Chemistry ?
Spi. Arrangemnts ?
English ?
Education
• Enrolled
Q Transferred ?
o Withdrawn ?
Graduated
Communication ?
Psychology ?
Physics ?
Computing Sci.
?
Biological Sci.
?
Engineering Sci.
?
Math. & Stats.
?
Kinesiology
0 ?
2 ?
4
?
6
?
8
?
10 ?
12 ?
14 ?
16 ?
18
Number
33 ?
DGSCRDEP Chart 4 1/4/97
Simon Fraser University-
Degree Completion
Rates by Department and
Semester of
Entry
Entry
in 91-3
Completedthrough
92-1 - January
4, ?
1997
Currently
0
Department
Pgm Total
Degree
Withdrawn
Transferred
Enrolled
Archaeology
MA
4
4 100.0%
0
0.006
0
0.0%
0
0.0%
Archaeology
PHD
1
0
0.0%
0
0.0% 0
0.001
1
100.0%
Biological
Biological
Sci.Sci.
MPMMAQ
11
8
8
7
72.7%87.5%
11
12.5%
9.109 1
0
0.001
9.1%
0
1
9.1%
0.001
Biological Sci.
MSC
19
12
63.2%
3
15.8% 4
21.1%
0
0.0%
Biological Sci.
PHD
16
3 18.8%
5
31.3% 0
0.006
8
50.0%
Bus. Admin.
MBA
43
37
86.0%
6
14.0%
0
0.006
0
0.0%
Bus. Admin.
MBE
33 29
87.9%
3
9.1%
0 0.001
1
3.0%
Bus. Admin.
MBW
29
26
89.7%
3
10.3%
0
0.0%
0
0.0%
Contemp. Arts
MFA
8
8 100.0%
0
0.0%
0 0.001
0
0.001
Chemistry
MSC
5
2
40.0%
1 20.0%
2
40.0%
0
0.006
Chemistry
PHD
3
0
0.006
0
0.006
0
0.006
3
100.0%
Communication
MA
12
7
58.3%
2 16.7%
0 0.001
3 25.0%
Communication
PHD
5
1
20.0%
0
0.006
0
0.0%
4
80.001
Computing Sci.
MSC
22
16
72.7%
4
18.2
0
1
2
9.1%
0 0.0%
Computing Sci.
PHD
8
3 37.5%
0
0.0%
0
0.001
5
62.5 *
Criminology
MA 11
9
81.8%
2 18.2 0
1
0 0.0%
0
0.001
Criminology
PHD
2
2
100.0%
0
0.0%
0
0.0%
0
0.006
Lang. and Ling.
MA
2
1 50.0%
0 0.0%
1 50.0%
0
0.0%
Lang. and Ling.
PHD
1
1 100.0%
0
0.0%
0
0.006
0
0.0%
Economics
MA
18
13
72.21 1
5 27.8%
0
0.0%
0
0.001
Economics
PHD
8
0
0.0%
4 50.0%
1 12.5%
3
37.5%
Education
MA
36
18
53.0%
10
27.8%
1
2.8%
7
19.4%
Education
MED
21
12 57.1
1
0
4
19.0%
0
0.006
5 23.8%
Education
MSC
8
4
50.0%
2 25.0%
1 12.5%
1
12.5%
Education
PHD
8 1
12.51
0
1
12.5%
0 0.0%
6
75.001
English
MA
14 11
78.6%
2
14.3 0
1
1 7.106
0 0.0%
English
PHD
8
1 12.5%
0
0.0%
0
0.006
7 87.5%
Engineering Sci.
MAP
14
12
85.7%
2
14.3%
0
0.006
0 0.006
Engineering Sd.
MEN
8
1 12.5%
4
50.0%
0 0.0%
3 37.5%
Engineering Sci.
PHD
14
4
28.6%
7
50.0%
1 7.1%
2 14.3%
Geography
MA
9 7 77.81 0
0
0.0%
0
0.0%
2 22.2%
Geography
MSC
3
3 100.01
0
0.0%
0 0.001
0 0.0%
Geography
PHD
3 0 0.0%
1
33.3%
0 0.001
2 66.7k
34
Simon
Fraser
University
Degree Completion
Rates by Department and Semester of
Entry
S
Entry
in 91-3
through
92-1
- January
4, ?
1997
Completed
Currently
Department
Pgm
Total
Degree Withdrawn
Transferred
Enrolled
History
MA
19
11
57.9
0
1
7
36.8 0
1
0 0.006 1 5.306
History
PHD 4
0
0.0%
2 50.0
0
1
0
0.006
2
50.001
Kinesiology
MSC 16
12
75.0%
3 18.8%
1
6.301
0
0.0%
Kinesiology
PHD 9
5
55.6%
1 11.1%
0 0.006 3 33.3%
Liberal Studies
MAL 20 8
40.0%
4
20.0% 0 0.006
8
40.0%
Linguistics
MA
1
0
0.006
1
100.0%
0 0.0% 0 0.0%
Linguistics
PHD 3
0 0.001
1
33.3% 0 0.001 2
66.7%
Math. ?
& Stats. MSC 20
13 65.0% 6 30.0% 0 0.0%
1
5.0%
Math. ?
& Stats. PHD 6 5
83.3% 0 0.006 0 0.0%
1
16.7%
Philosophy
MA
3
3
100.0%
0
0.006 0 0.0%
0
0.0%
Physics
MSC
12 7 58.3% 2
16.7%
3
25.0% 0 0.0%
Physics
PHD 6 3
50.0% 2 33.3 0
1
0 0.0% 1
16.7%
Political Sci.
MA 16 8
50.0 0
1
6
37.5 0
1
0 0.006 2 12.5%
Psychology
MA
11 10 90.9% 1 9.106 0 0.0% 0 0.0%
Psychology
PHD 10
3
30.0%
2
20.0
0
1
0 0.0% 5 50.0%
Res. & Env. Mgmt
MRN 22 16
72.7
1
0 4 18.21 0 0 0.001 2 9.1%
Soc. & Anth.
MA
7 4
57.1%
3 42.9 0
1
0 0.0%
0
0.0%
Soc. & Anth.
PHD 2 1
50.0
0
1
1 50.0% 0 0.0% 0
0.0%
Spl. Arrangemrlts
MAS
2
2 100.0% 0 0.0% 0 0.0%
0
0.005
Spi. Arrangemnts MPB 3 3
100.0
1
0 0
0.006 0 0.006
0
0.006
Spl. Arrangemnts
PHD
3
1 33.31 0
0
0.006 0 0.006
2
66.7%
Women's Studies
MA 7
5
71.4%
2 28.6% 0 0.0%
0
0.001
All Master's
497
349 70.2%
94 18.9%
17
3.4% 37
7.4%
All Doctoral
120 34
28.3% 27 22.5% 2 1.7%
57
47.5%
S
35
Simon Fraser University
?
Master's Program Withdrawals?
Fall 1985 - Fall 1996
4
10
11
12
12
12
14
15
16
17
17
19
.20
20
120
21
•22
23
25
27
27
'9
'9
NOW
30
•32
_33
-33
-33
—35
—35
—44
49
49
0 ?
10 ?
20 ?
30 ?
40 ?
50
Fraction of Withdrawals
(%) ?
University Average: 23%
.
66
60 ?
70
S
Contemp. Arts ?
Biological Sci. MPM
?
Spl. Arrangemnts MA
?
Psychology ?
Geography MSc
?
Engineering Sci. MApSc ?
Bus. Admin. WMBA ?
Bus. Admin. EMBA
?
Bus. Admin. DMBA ?
Kinesiology ?
Math. & Stats. ?
Biological Sci. MAq
?
Computing Sci. ?
Biological Sci. MSc
?
Physics ?
Linguistics ?
Economics
?
Res. & Env. Mgmt. ?
Communication ?
Chemistry
?
Geography MA ?
Education MSc ?
Archaeology
?
English ?
Education MA ?
Education MEd
?
Political Sci. ?
Spl. Arrangemnts MSc ?
Lang. and Ling. MA
?
History ?
Women's Studies ?
Criminology ?
Soc. & Anth. ?
Sp. & Lat. Am. Studies ?
Philosophy
?
Liberal Studies ?
Engineering Sci. MEng
?
DGSWDREP Chart 3 12130/96
Simon Fraser University ?
Doctoral Program Withdrawals
?
Fall 1985 - Fall 1996
16
16
18
'9
20
25
30
fl31
131
132
-35
37
3
141
-45
46
50
152
0 ?
10 ?
20 ?
30 ?
40 ?
50
Fraction of Withdrawals
(%)
?
University Average: 30%
37
60 ?
70
DGSWDREP Chart 4 12/30/96
Physics ?
Psychology ?
Chemistry ?
Biological Sci.
?
Math. & Stats.
?
Kinesiology ?
Archaeology
?
Geography ?
Communication ?
Criminology ?
Spi Arrangemnts ?
Education
?
Lang. and Ling.
?
English ?
Economics ?
Computing Sci.
?
History ?
Soc. & Anth.
?
Engineering Sci.
?
Linguistics
.
a
Active
Completed via
Total
W/D
Department
Pgm
Now
I
Degree
I
Transfer
I ?
W/D Completed
Rate (%)
Archaeology
MA
21
48
0
18
66
27
Archaeology
PHD
13
19
0
8
27
30
Biological Sci.
MAQ
6
23
1
5
29
17
Biological Sci.
MPM
26
108
2
10
120
8
Biological Sci.
MSC
73
127
29
37
193
19
Biological Sci.
PHD
70
116
5
29
150
19
Bus. Admin.
MBA
145
301
0
52
353
15
Bus. Admin.
MBE
86
320
0
54
374
14
Bus. Admin.
MEW
68
93
0
13
106
12
Chemistry
MSC
20
62
20
24
106
23
Chemistry
PHD
44
58
6
14
78
18
Communication
MA
34
99
1
28
128
22
Communication
PHI)
40
18
0
8
26
31
Computing Sci.
MSC
49
146
7
35
188
19
Computing Sci.
PHD
34
32
3
30
65
46
Contemp. Arts
MFA
9
24
0
1
25
4
Criminology
MA
40
99
3
54
156
35
Criminology
PHD
17
15
0
7
22
32
Earth Sciences
MSC
1
0
0
0
0
N/A
Economics
MA
30
182
1
46
229
20
Economics
PHD
35
50
2
43
95
45
Education
MA
120
291
8
124
423
29
Education
MED
274
416
5
180
601
30
Education
MSC
36
31
2
12
45
27
Education
PHD
69
39
1
23
63
37
Engineering Sci.
MAP
51
86
4
12
102
12
Engineering Sci.
MEN
35
20
2
43
65
66
Engineering Sci.
PHD
23
8
1
10
19
53
English
MA
31
113
1
47
161
29
English
•
PHD
19
13
0
9
22
41
French ?
MA ?
9 ?
1 ?
0 ?
0 ?
1
?
0
Simon Fraser University Completion Statistics
All Students since Fall 1985
Report Dated: December 30, 1996
S
a
DGSWDRE2.XLS
38
Simon Fraser University Completion Statistics
All Students since Fall 1985
Report Dated: December 30, 1996
Active
Completed via
Total
WID
Department
Pgm
Now
Degree
I
Transfer
I
I
Completed
I Rate (%)
Geography
MA
25
43
1
15
59
25
Geography
MSC
12
28
1
4
33
12
Geography
PHI)
18
24
1
11
36
31
Gerontology
MA
8
0
0
0
0
N/A
History
MA
25
84
1
41
126
33
History
PHD
9
11
0
11
22
50
Kinesiology
MSC
24
75
9
16
100
16
Kinesiology
P1-ID
16
30
0
10
40
25
Lang. and Ling.
MA
0
24
3
13
40
33
Lang. and Ling.
PHD
0
7
1
5
13
38
Liberal Studies
MAL
71
18
0
17
35
49
Linguistics
MA
8
4
0
1
5
20
•
Linguistics
PHI)
17
2
0
4
6
67
Math.& Stats.
MSC
27
114
5
24
143
17
Math.& Stats.
PHD
30
49
2
13
64
20
Philosophy
MA
7
19
1
19
39
49
Philosophy
PHD
7
0
0
0
0
N/A
Physics
MSC
23
60
18
20
98
20
Physics
PHD
28
56
0
11
67
16
Political Sci.
MA
42
69
0
32
101
32
Political Sci.
PHD
0
0
0
0
0
N/A
Psychology
MA
27
116
2
15
133
11
Psychology
PHD
71
82
0
16
98
16
Publishing
MPU
22
0
1
0
1
0
Res. & Env. Mgmt
MRM
73
163
3
43
209
21
Res. & Env. Mgmt
PHD
6
0
0
2
2
100
Soc. &Anth.
MA
31
33
1
22
56
39
•
Soc&Anth.
PHD
17
10
0
11
21
52
Sp. & Lat. Am. Studies
MA
11
5
0
4
9
44
DGSWDRE2.XLS
39
Simon Fraser University Completion Statistics
All Students since Fall 1985
Report Dated: December 30, 1996
Department
Pgm
Active
Now
Completed via
Degree
I
Transfer
I
W/D
Total
Completed
WID
Rate (%)
Spi. Arrangemnts
MAS
1
18
1
2
21
10
Spi. Arrangemnts
MSS
0
2
0
1
3
33
Spi. Arrangemnts
MPB
0
3
0
0
3
0
Spi. Arrangemnts
PHS
21
24
4
15
43
35
Women's Studies
MA
10
24
0
13
37
35
Totals
Master's
1,611
3,492
133
1,097
4,722
23
Totals
Doctoral
604
663
26
290
979
30
Totals
All
2,215
4,155
149
1,387
5,701
24
Active Now = ?
Headcount enrolment in the most recent semester.
Degree =
?
Number of degrees completed.
Transfer = ?
Number of students who transferred to a different
degree program without completing the first.
W/D =
?
Number of students who withdrew without completing
a degree.
W/D Rate =
?
Ratio of WID to Total Completed.
0
.
DGswnRia.s
40
S
S
El