S.03-92
o
?
SIMON FRASER UNIVERSITY
MEMORANDUM
To: ?
Senate
From:
?
R.
Blackman, Chair
Senate Committee on Undergraduate Studies
Subject:
?
Diverse Qualifications Admission Committee (DQAC) Review for 2003
(SCUS Reference 03-16)
Date: ?
September 15, 2003
Action undertaken at the September 9, 2003 meeting of the Senate Committee on
Undergraduate Studies gives rise to the following motion:
.
?
MOTION:
"That Senate approve the recommendations in the DQAC review of extending
the Diverse Qualifications Admission Policy by five years to Fall Semester
2009 with a review to occur in 2008 as set forth in S. 03- 92 ."
is
SIMON FRASER UNIVERSITY
Office of the Associate Vice-President, Academic
?
MEMORANDUM
TO:
Senate ?
FROM: Bill Krane, Chair
Diverse Qualifications
Adjudication Committee
RE: Review of DQ Admission Policy ?
DATE: June 11, 2003
At the December 7, 1998 Senate meeting, the following motion was passed:
"that Senate approve, as set forth in S.98-95, that the Diverse Qualifications
Admission Policy be extended by five years to Fall Semester 2004, with a review
to occur in 2003"
The DQAC recently concluded a review of the academic performance of DQ students
who were admitted to the University over the past five years (see attached). The
performance of these students was compared to a randomly selected group of normal
admits with similar entrance characteristics. The major findings were as follows:
• persistence and completion rates were virtually identical for the DQ cohort
and comparison group;
• both groups performed equally well in terms of semesterly GPA;
• in general, the average CGPAs of the two groups were comparable and, in
some cases, the DQ cohort outperformed the comparison group;
• DQ students took more credit hours per semester than those in the
comparison group, resulting in faster completion of their degrees; and,
• based on the academic standing in their last registered semester, 937o of the
DQ cohort were eligible to register for the subsequent semester, versus 917o
for the comparison group.
After considering these results, the DQAC undertook action at its meeting of May 29,
2003, which gives rise to the following motion:
"that Senate approve as set forth in S.03- , that the Diverse Qualifications
. ?
Admission Policy be extended by five years to Fall semester 2009, with a review
to occur in 2008." ?
/ /Z
-
SIMON FRASER UNIVERSITY
Analysis of Students Admitted to SFU with
?
Diverse Qualifications
1997-1 to 2002-3
Prepared by ?
Joanne Heslop, Analyst ?
Office of Analytical Studies
?
June 9, 2003
o
.
L
Analysis of Students Admitted to SFU with Diverse Qualifications
?
(1997-1 to 2002-3)
Introduction:
Simon Fraser University seeks to not only admit applicants who are academically very
well qualified, but also those who meet minimum admission standards, present a clear
and valid reason for attending the University and have:
• demonstrated commitment and/or excellence in other endeavours, or
• succeeded in their studies in spite of difficult circumstances.
Up to 10% of candidates for admission to SFU can be recognized for non-academic
attributes and achievements under the Diverse Qualifications Admission Policy.
Beginning in the Spring of 1997, SFU accepted its first cohort of students admitted under
the Diverse Qualifications (DQ) Admissions Policy. In the Fall of 1998, the Office of
Analytical Studies prepared an analysis of the 165 DQ admits from the first five entry
cohorts (1997-1 to 1998-2). In response, the Diverse Qualifications Adjudication
. ?
Committee (DQAC) noted, "Overall, there were insufficient data to draw firm
conclusions about the success of the policy"
2
and Senate passed the motion "that the
Diverse Qualifications Admission Policy be extended by five years to Fall semester 2004,
with a review to occur in 2003." This current report is based on an analysis of the
students admitted to SFU under the DQ Policy over the six-year period, from 1997 to
2002. Refer to the Appendix for a complete set of detailed tables.
Note: Appendix available
upon request by contacting Bobbie Grant at 604 291-3168 or
email bgrant@sfu.ca
Volume of DQ Admits:
In the six years since its inception in 1997-1, a total of 762 students have been admitted
to SFU under the Diverse Qualifications Admission Policy. This represents
2.5%
of all
registered new students admitted in the time period, or 3.0% when Science students are
omitted from the total.
4
The number of students admitted annually ranged from a low of
77 in calendar year 1998 to a high of 171 in 2001 (see Chart 1). As shown in Chart 2, the
majority of the students admitted came from three basis of admission categories: BC
Grade 12 (28
0
/o),
Mature (23%) and BC College Transfer (2 1%).
'SFU Calendar, 2002/03.
2
SCAP 98-60.
S.98-95.
The Diverse Qualifications Admissions Policy is not available to Faculty of Science applicants.
Page 1
o
Chart 1 ?
Students Admitted to SFU
With Diverse Qualifactions: 1997 to 2002
'fVU
-
350 -
-
300
-
-
250
--------------------------------------------
;ljjj; --------
100
-
Ot ?
----
1997
1998
1999
2000
2001
2002
6-Yr Total
EEO
B.C. Grade 12
29
6
24
20
37
41
157
B.C.College
40
23
37
24
45
42
211
Other
54
48
54
63
89
86
394
,
—
*
— Total
1 ?
123
77
1 ?
115
107
171
169
1
?
762
# Students reported by calendar year, 1997 to 2002.
Chart
% Distribution of DQ Admits
by Basis of Admission
6-Year Total (1997 to 2002)
?
B.C. College ?
28%
?
Mature ?
123%:
?
B.C. Grade 12 ?
T''-'----1-----'-
?
21%
?
University Transfer ?
I
9
?
Degree ?
18%
?
I
?
Canadian Grade
12
?
I
?
Technical ?
13%
College Transfer
=2%
?
?
Foreign Grade
12/13 ?
1%
Other - Misc
0%
?
5%
?
10%
?
15% ?
20% ?
25%
?
30%
.
Analysis of Diverse Qualifications Admits (1997-1 to 2002-3)
?
2003.06.09 ?
Office of Analytical Studies
?
Page 2
The DQ Cohort and the Control Group:
This analysis compares the cohort of 762 students admitted to SFU with diverse
qualifications from 1997-1 to 2002-3 to a control group of 762 students admitted under
normal academic qualifications over the same time period, with an equal number of
students randomly selected from each admission semester and each basis of admission
category, counting upwards from the admission GPA cut-off.
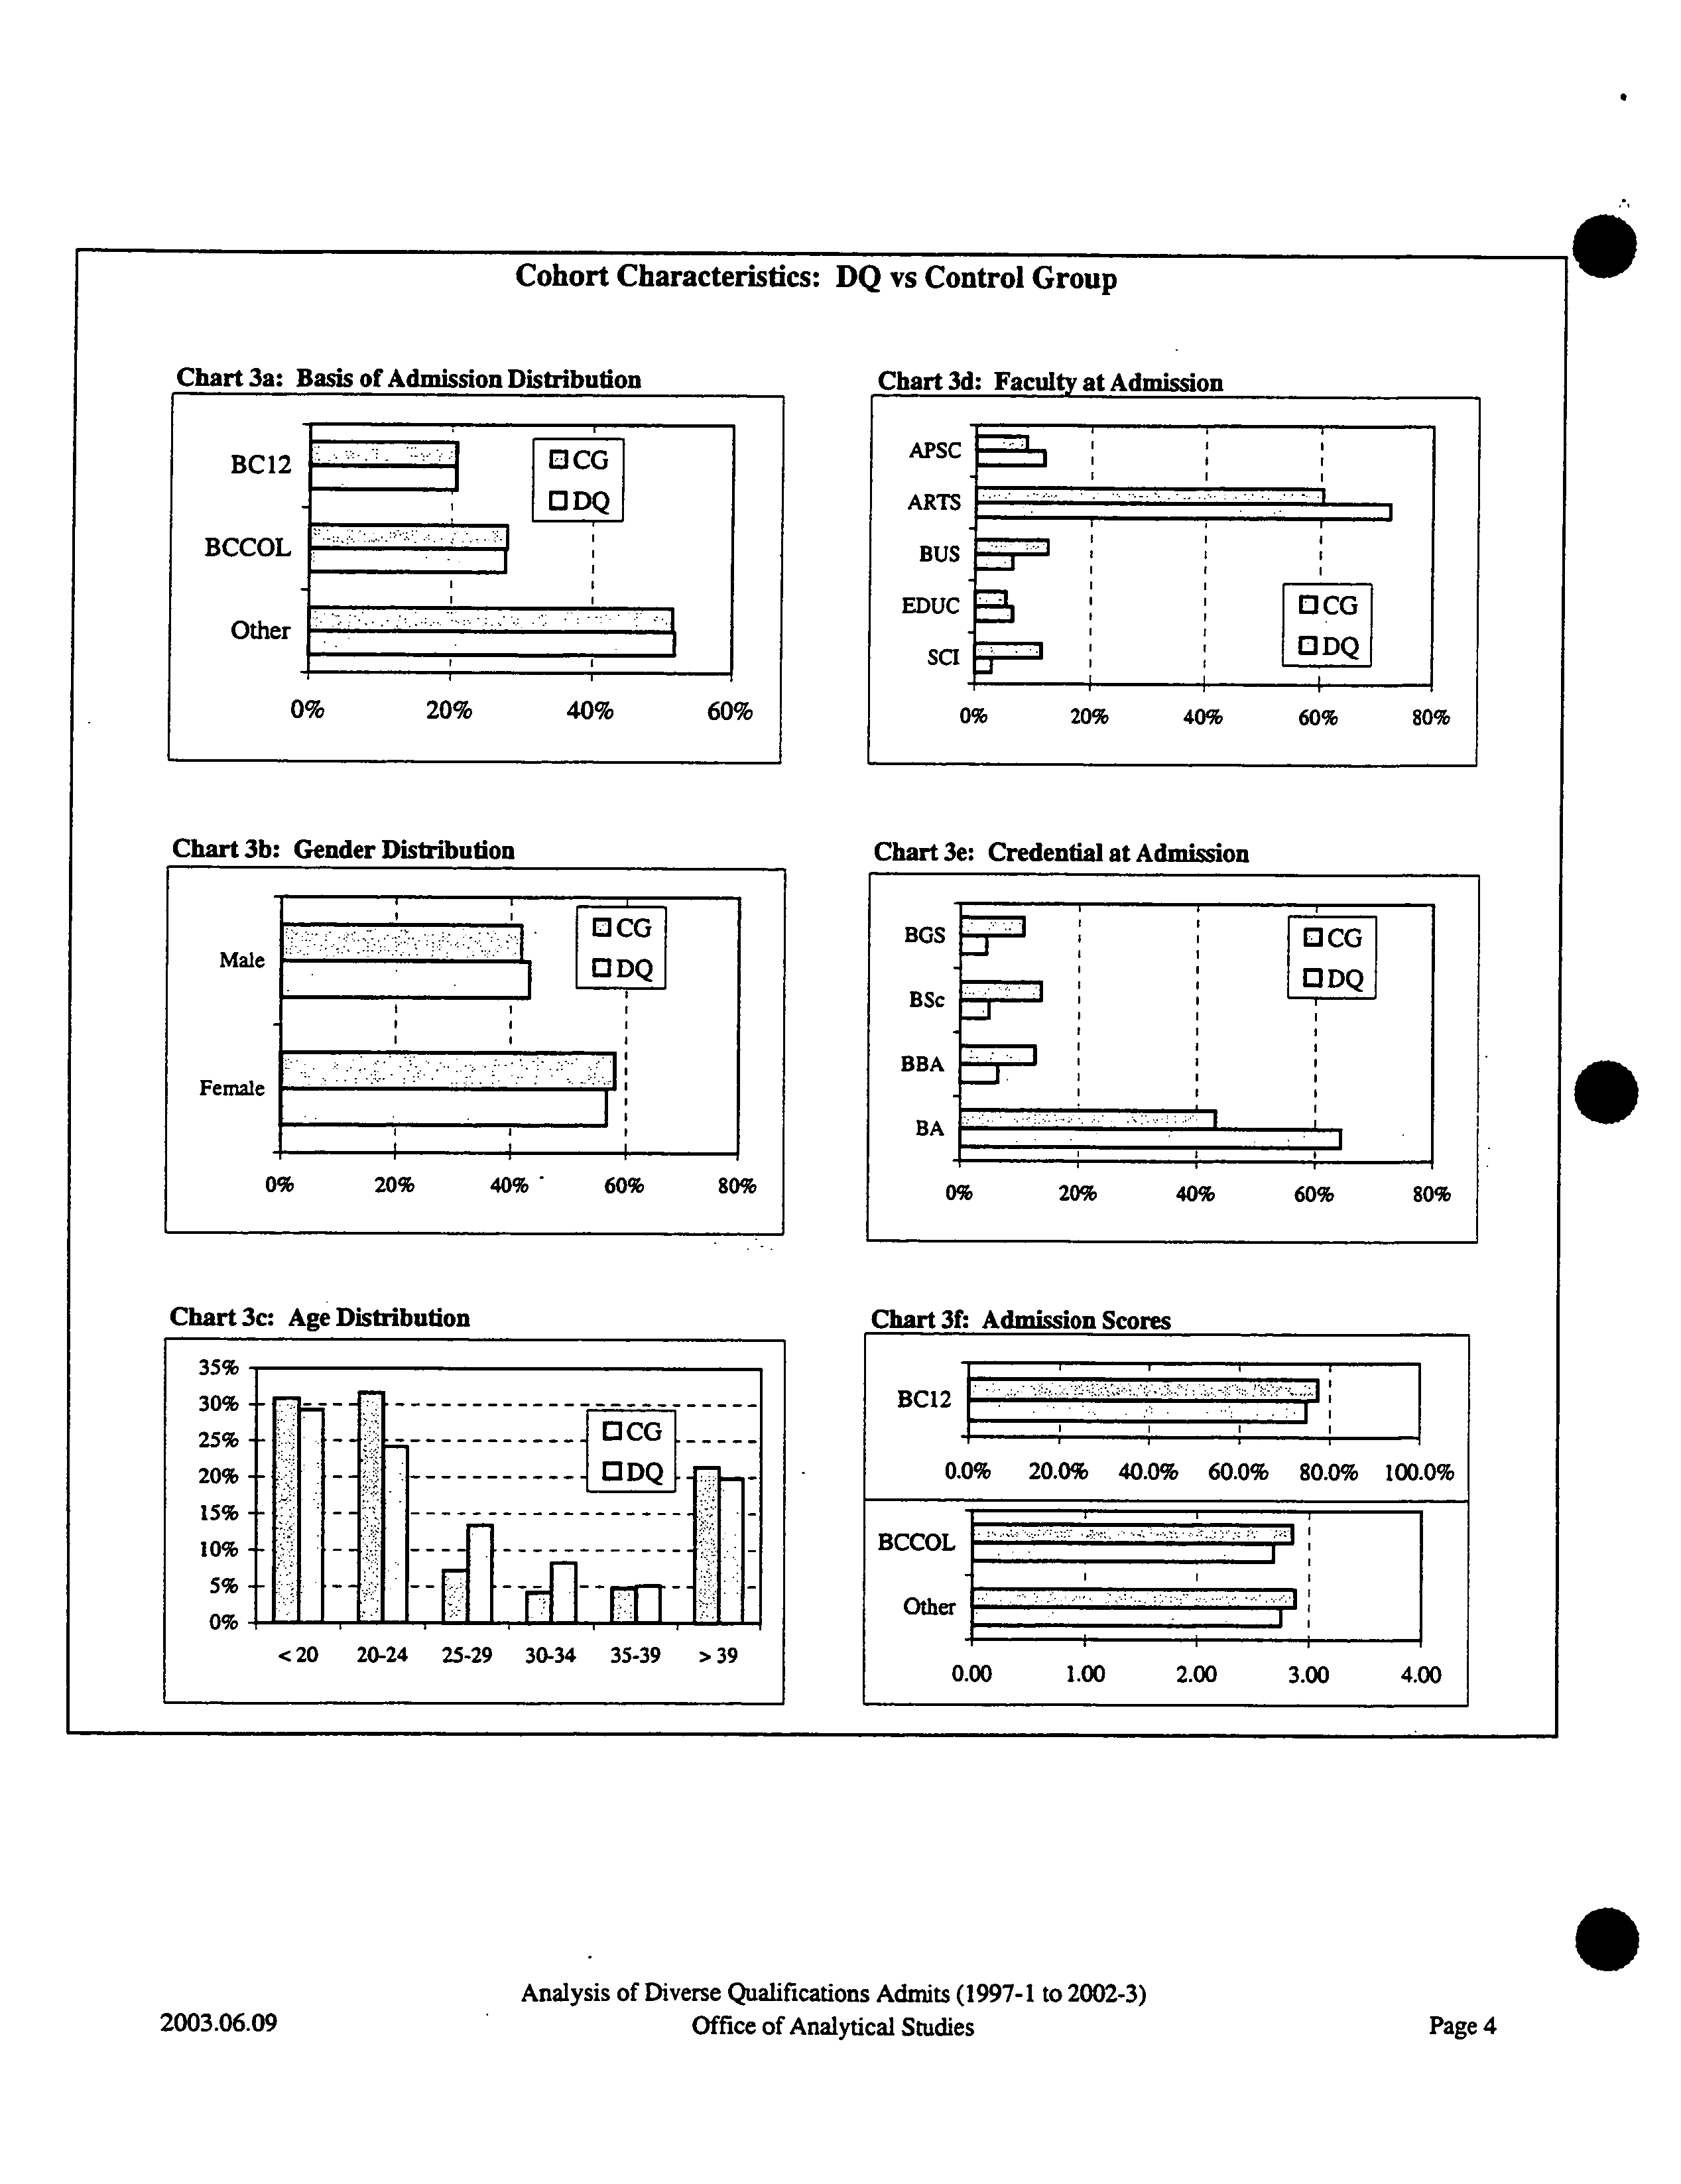
To begin the analysis, it is important to ensure that students in the DQ group and the
control group have similar characteristics in terms of basis of admission, admission score,
gender, age, faculty and credential sought. Charts 3a to 3f show that the DQ cohort and
the control group are comprised of students with similar academic and program
characteristics.
One difference between the two groups is the higher proportion of DQ students who
entered the Faculty of Arts (72% of the DQ cohort versus 60% for the control group).
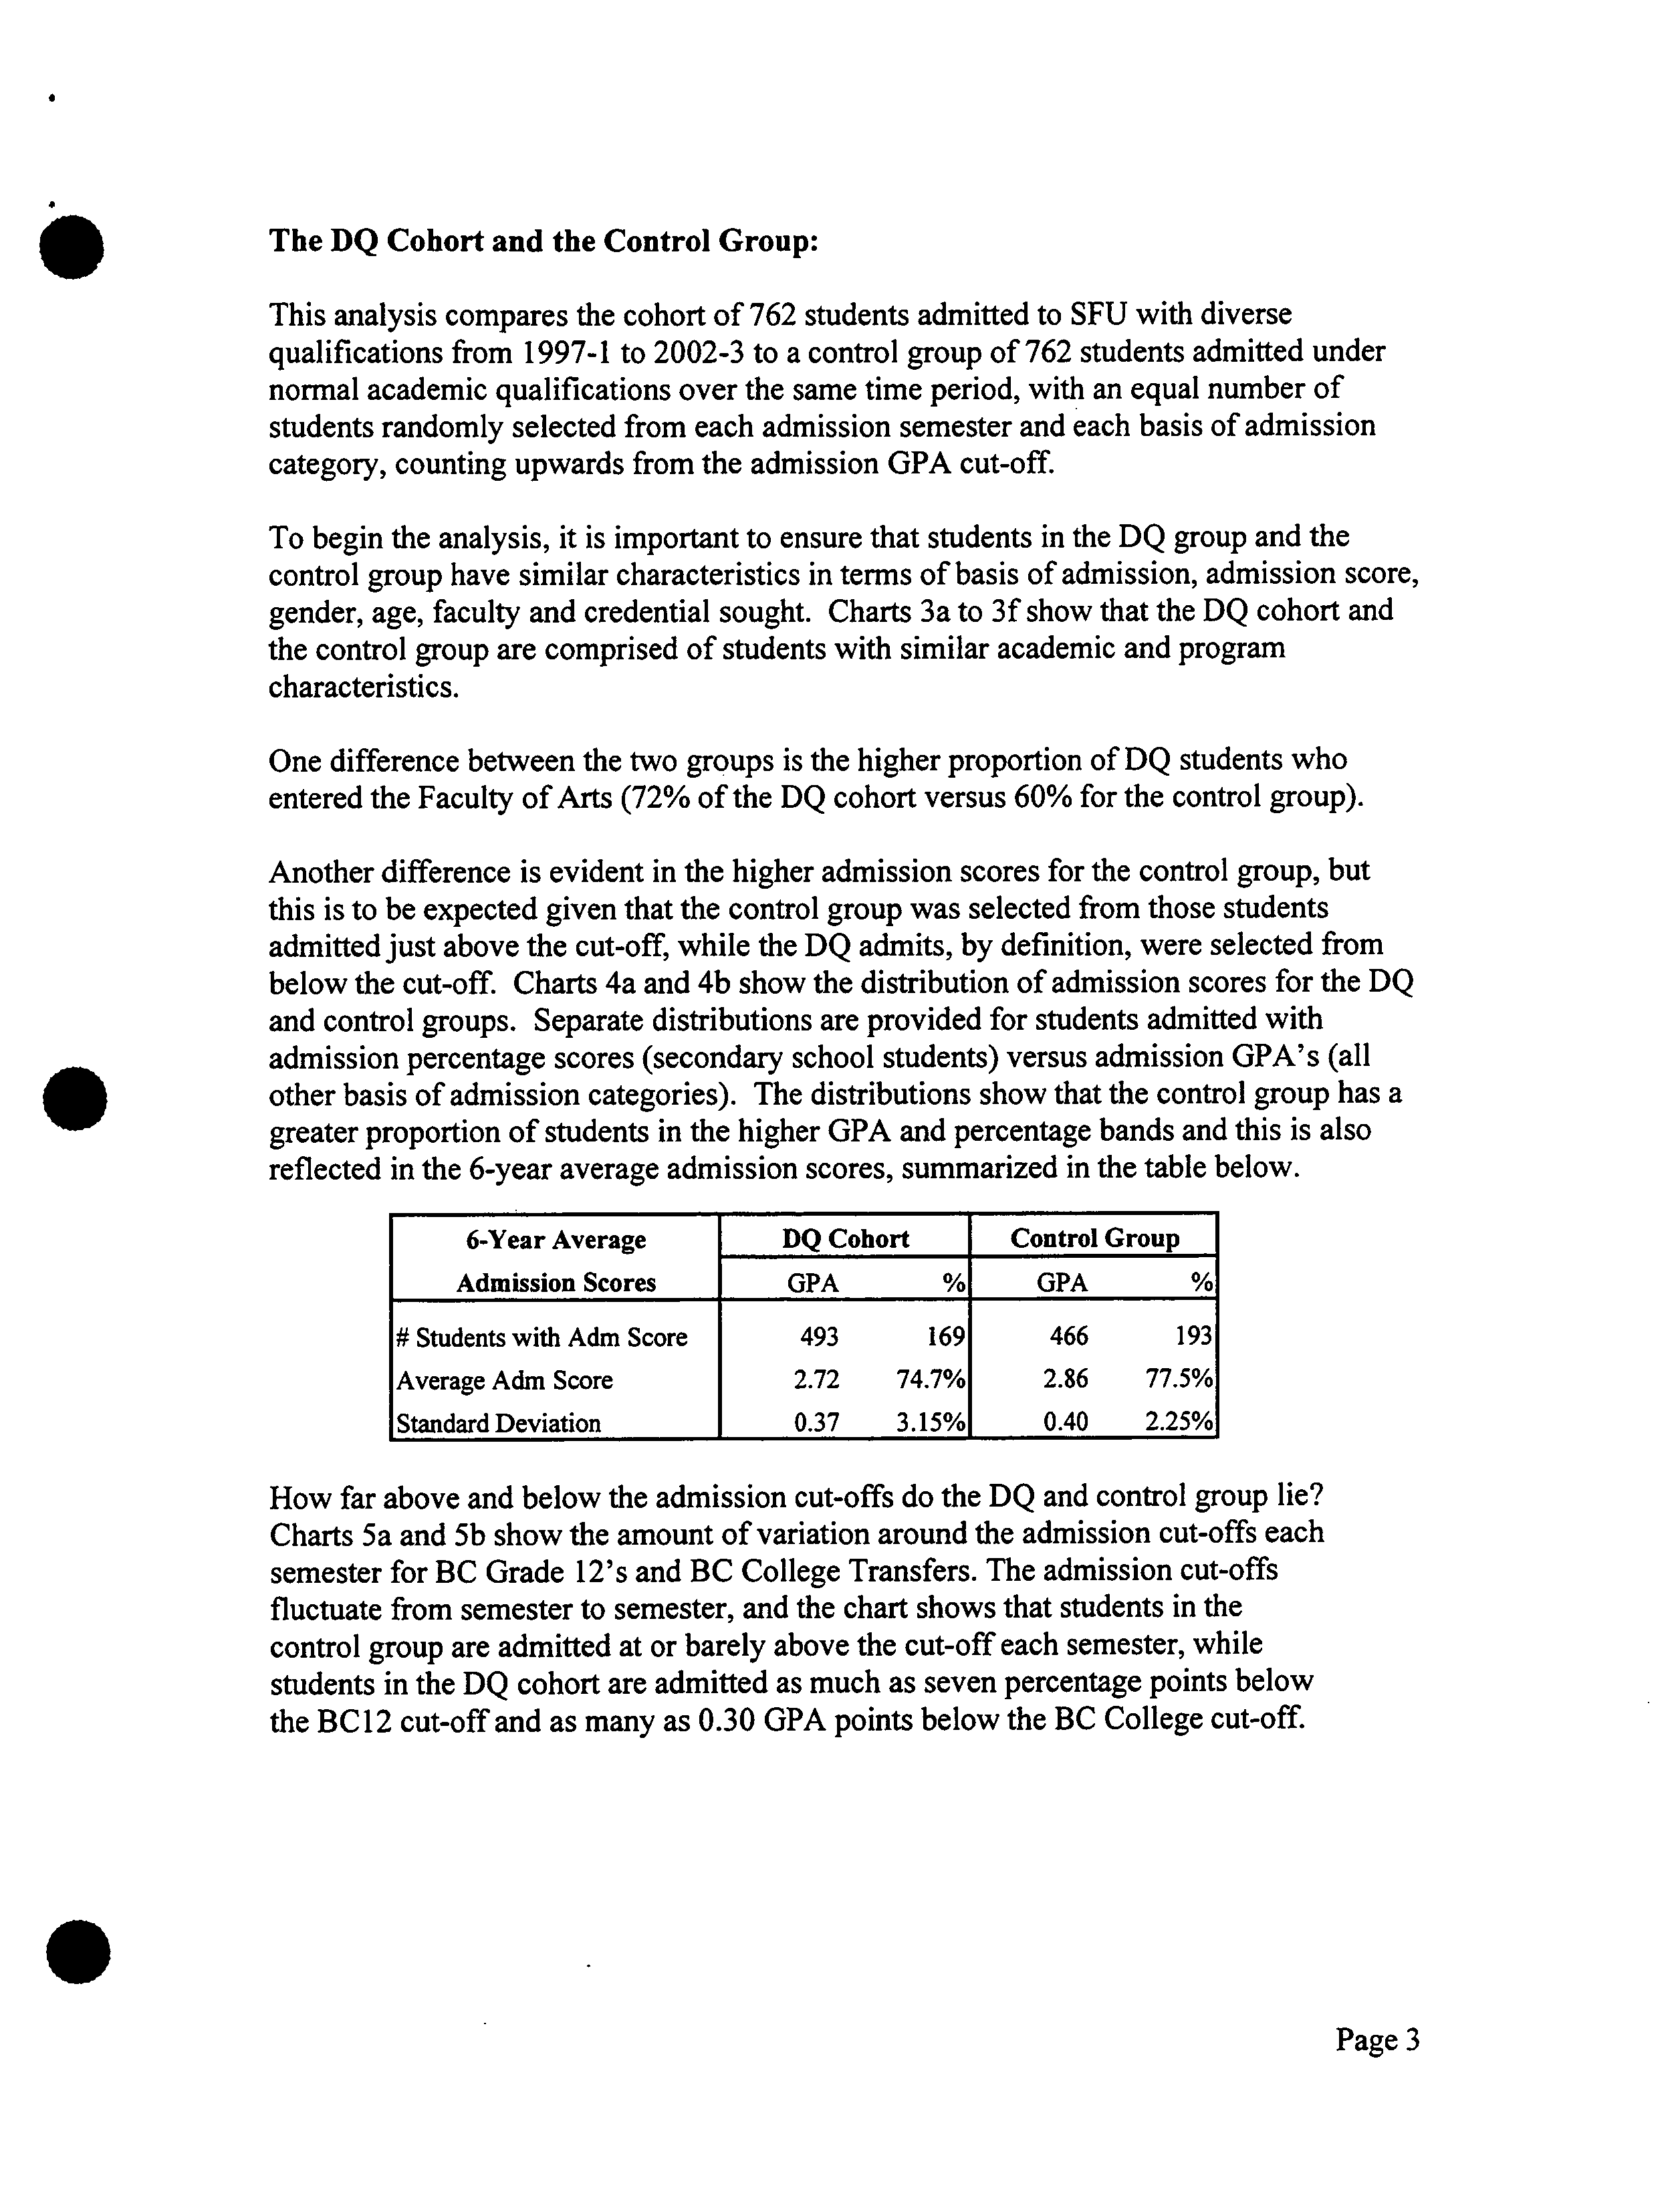
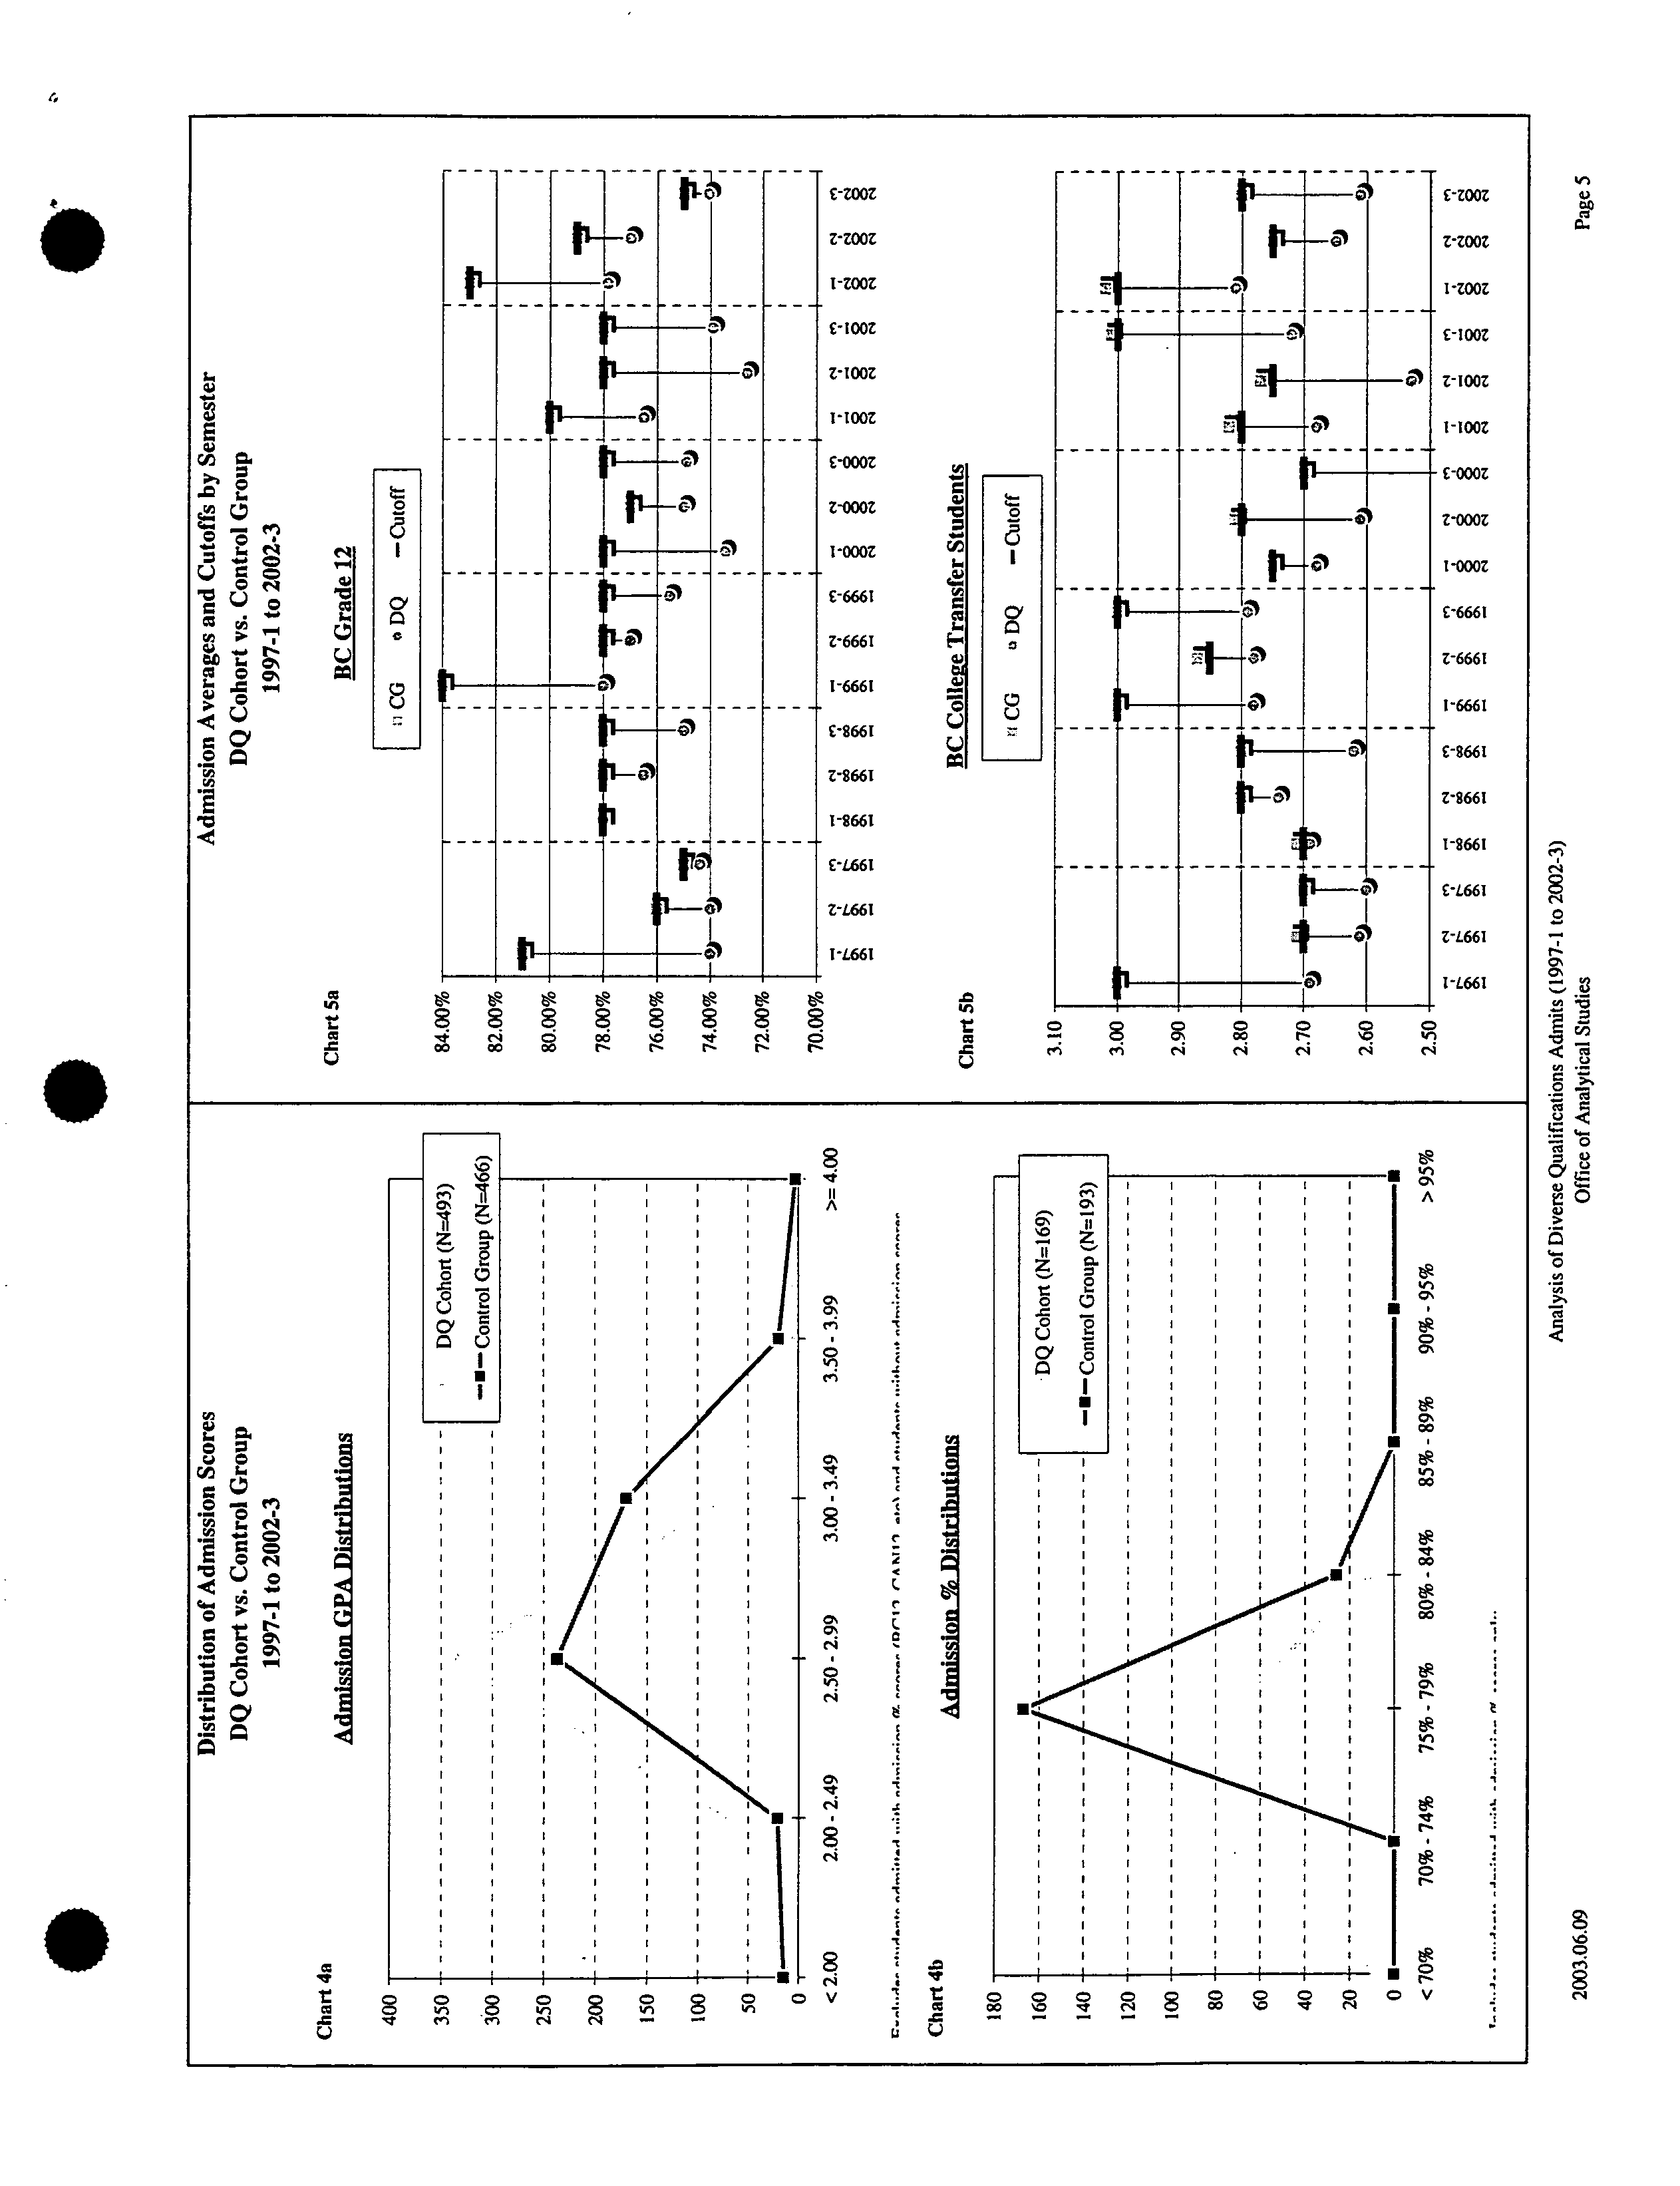
Another difference is evident in the higher admission scores for the control group, but
this is to be expected given that the control group was selected from those students
admitted just above the cut-off, while the DQ admits, by definition, were selected from
below the cut-off. Charts 4a and 4b show the distribution of admission scores for the DQ
and control groups. Separate distributions are provided for students admitted with
• ?
admission percentage scores (secondary school students) versus admission GPA's (all
other basis of admission categories). The distributions show that the control group has a
greater proportion of students in the higher GPA and percentage bands and this is also
reflected in the 6-year average admission scores, summarized in the table below.
6-Year Average
Admission Scores
DQ Cohort
Control Group
GPA ?
% GPA ?
%
# Students with Adm Score
493 ?
169
466
?
193
Average Adm Score
2.72
?
74.7%
2.86 ?
77.5%
Standard Deviation
0.37 ?
3.15%
0.40 ?
2.25%
How far above and below the admission cut-offs do the DQ and control group lie?
Charts 5a and 5b show the amount of variation around the admission cut-offs each
semester for BC Grade 12's and BC College Transfers. The admission cut-offs
fluctuate from semester to semester, and the chart shows that students in the
control group are admitted at or barely above the cut-off each semester, while
students in the DQ cohort are admitted as much as seven percentage points below
the BC12 cut-off and as many as 0.30 GPA points below the BC College cut-off.
S
Page 3
Cohort Characteristics: DQ vs Control Group
Chart
3a:
Basis
of
Admission
Distribution
o
20% ?
40% ?
60% ?
80%
Chart
3
ty at
Admission
APSC
ARTS
BUS
EDUC
DCG
?
__
?
DDQ
-j
?
I ?
I
?
.
BSc
BBA
20-24 25-29 30-34 35-39
20%
15%
Chart
3b: Gender Distribution
?
Chart
3e: Credential at
Admission
20% ?
40% - ?
60% ?
80%
?
20%
?
40% ?
60% ?
80%
^
Chart
3c: Age Distribution
?
Chart
3!:
Admission Scores
Analysis
of Diverse
Qualifications Admits
(1997-I
to 2002-3)
2003.06.09 ?
Office of Analytical Studies
?
Page 4
E
Cl)
—
-
0
—
I
e
-
•
g
66
C.,
U
—
0,
0,
-©
• 0,_
I .
-
I-
U
II]
Iuj
e
I
i
I
I
-I
I
t
II
•[O
0
.0
U
8
I
N
8
0
In
CV
i
-
tC
0
U
?
-
III,
£-ZOOZ
z-zooz
J
'loot
'loot
----------
t
—
—
z-,00z
I
I_loot
GI
--
£-000Z
11-
-
C,
Z-00oz
I—
------ ---
1100Z
---
—
I—
£-6661
Z-6661
I—
1-6661
-
£1661
Z-2661
I
-----
1-2661
tL661
ZL661
1L661
N
?
0
00
?
co ?
00
00
-
?
10
S
S
?
NS
??
0
S
P
C
?
-
0
cI
-
?
I
0,
- ?
r
U
In
U
C,
,•, ?
-'
4
L
r
C,
0
N
0•
N
C'
N
N
! ?
£iOOZ
I
i----
— z
1-zooz
- ——
?
£-IOOZ
-Iooz
1-Iooz
1-
I
—.
Z-666l
£666I
-------------
.,11661
ZL661
Z1661
£1661
C-L661
1-2661
1L661
o 0
0 ?
0
0 ?
0
CO
?
0
I-:
?
0
V
0
N N N N N
I ?
I ?
I
?
I
I ?
I ?
I ?
I ?
I ?
I ?
A
I
?
I
?
I
?
I
?
I
?
V z
?
I ?
I
I
?
I ?
I ?
I ?
I
?
0. ?
I ?
I ?
I ?
I ?
I
?
2 ?
I
"-I
o
?
Q
?
I
?
I
?
I
.0 ?
-
?
I ?
I ?
I
?
I
o ?
2
?
I
U
?
,
?
I
?
t ?
I ?
0
0 ?
?
0 ?
I ?
I ?
I ?
I ?
I
o ?
U
?
i ?
i ?
i ?
i ?
I ?
I
?
I
?
I ?
I ?
I ?
I
?
• ?
I ?
I
?
I ?
I ?
I
?
I ?
I ?
I
?
I ?
I
?
I
I ?
I
?
I ?
00
?
____ ?
I
?
II
?
?
I
?
I ?
I
I
?
U
I
e
71
I ?
I ?
I ?
I ?
I ?
/ ?
In
CO
It
I ?
I ? t ?
I
?
I
?
I
?
I ? I
I ?
I ?
I ?
I ?
/
?
I ? I ?
I ?
I
?
I ?
I
?
I ?
I
?
I
CO
0
CO
C'
V.,
iThH41.
I ?
I
I ?
I ?
I ?
I ?
I ? I
0 ?
?
I ?
I
?
I
?
I ?
-._
?
I ?
I ?
I
I
?
I
?
I ?
I
?
I
I
?
I ?
I
?
I ?
I ?
I
I
?
I
?
I ?
I
I ?
I ?
I ?
I ?
I
•o
I-
0
V
?
0 0 2 0
00
0
'0
0
VN
0 0 V
0
0
Iq
S
It
oI
V
V
>
in
0
0
0
I..,
N
When all intake semesters are combined over the six-year period, the mean
difference from the cut-off among the DQ cohort was -3.02% for BC 12's and
-0.16 grade points for BC College Transfer students. By comparison, the mean
difference from the cut-off for the control group was much smaller (0.00% for
BC 12's and 0.01 for BCCOL). Since the control group was selected from a larger
sample of students with admission scores at or above the cut-off, there is less
variation from the cut-offs among the control group scores than the DQ group.
The mean control group scores are almost identical to the admission cut-offs each
semester.
The next step in the analysis is to assess the academic performance of the DQ
cohort as compared to the control group.
Performance Comparison (DQ Cohort vs. Control Group):
There are several ways in which we can assess the academic performance of the DQ
admits. First, we will look at the
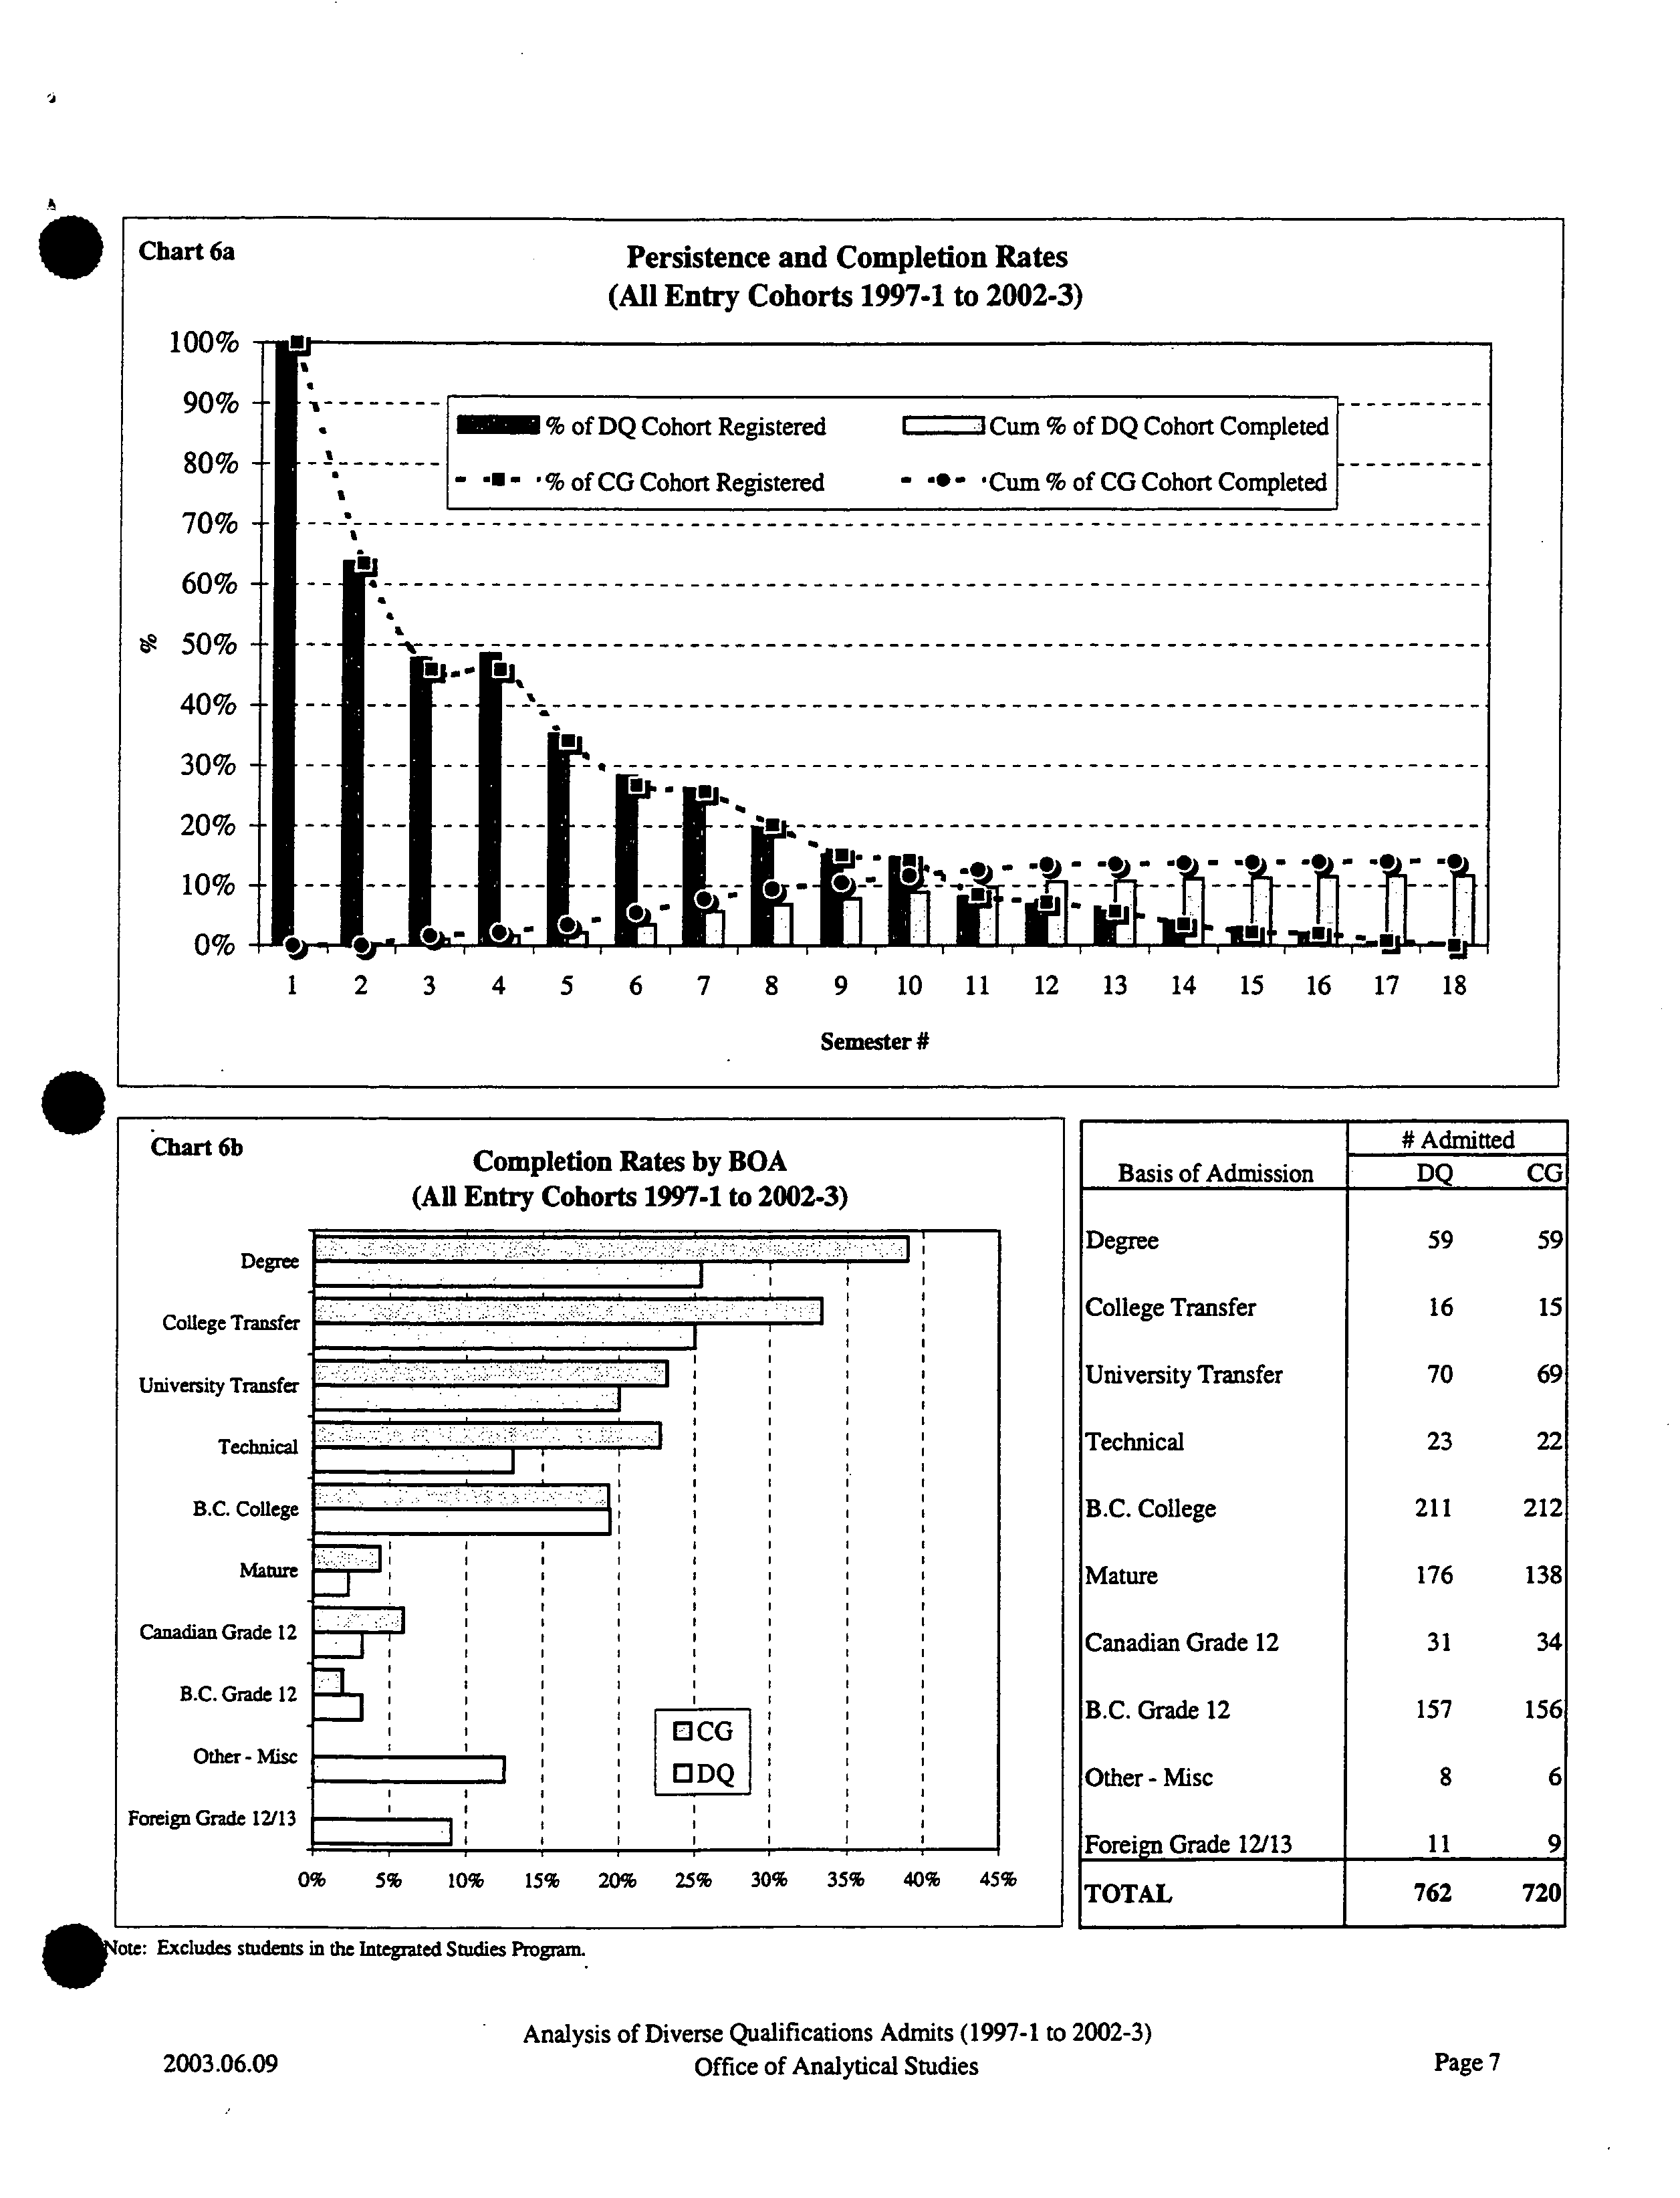
persistence and completion rates.
As shown in Chart
6a, the persistence rate (proportion of admitted students who registered) and the
completion rate (proportion of admitted students who completed a degree or certificate at
SFU) are very similar for both the DQ and control groups over the 6-year period. Upon
closer inspection, it was noted that the control group has a slightly higher completion rate
at 14.0% when compared to the DQ cohort at 11.7%.
The completion rate is based on the cumulative total number of completers divided by the
total number of students admitted over the 6-year period. Therefore, students admitted 6
years ago have a greater opportunity to complete than students admitted only one year
ago and students admitted with no transfer credit (i.e. secondary school students) would
have a lower completion rate than students admitted with some transfer credit. As a
result, there is significant variation in the completion rates by basis of admission (see
Chart 6b). In both the control group and the DQ cohort, students admitted with some
post-secondary experience generally achieved higher completion rates than students
admitted to SFU from a secondary school. In addition, the higher completion rates for
the control group are reflected in the individual basis of admission categories, except
among the approximately two hundred BC College transfer students where the
completion rates for the DQ cohort and the control group were equal.
Since the above completion rates are based on all entry cohorts over the six years, it does
not allow enough time for students who were admitted in the most recent semesters to
graduate, and thus under-estimates the completion rate. To accommodate this limitation,
the persistence and completion rates for those students admitted from 1997-1 to 1998-3
were examined. The chart of the persistence and completion rates of the two groups
again appear similar (Chart 7a), but with the control group completion rate again slightly
higher at 24.9%, compared to 22.0% for the DQ cohort.
.
Page 6
o
Chart 6a
?
Persistence and Completion Rates
(All Entry Cohorts 1997-1 to 2002-3)
• ?
- % of DQ Cohort Registered ?
I ?
1
Cum % of DQ Cohort Completed
11 ? - -
% of CO Cohort Registered
?
- - Cum % of CG Cohort Completed
j
U
--
1 ?
2 ?
3 ?
4 ?
5 ?
6 ?
7 ?
8 ?
9 ?
10 ?
11 ?
12 ?
13 ?
14 ?
15 ?
16 ?
17 ?
18
Semester #
100%
90%
80%
70%
60%
50%
40%
30%
20%
10%
0%
Chart 6b
Completion Rates by BOA ?
(All Entry Cohorts 1997-1 to 2002-3)
0% ?
5% ?
10% 15% 20% 25% 30% 35% 40% 45%
*Zte: Excludes students in the Integnted Studies
Pmgrain.
#
Admitted
DQ
CG
Basis of Admission
Degree
59
59
College Transfer
16
15
University Transfer
70
69
Technical
23
22
B.C. College
211
212
Mature
176
138
Canadian Grade 12
31
34
B.C. Grade 12
157
156
Other - Misc
8
6
Foreign Grade 12113
11
9
TOTAL
762
720
Degree ?
College Transfer
?
University Transfer
?
Technical
?
B.C. College ?
mature ?
Canadian Grade 12
?
B.C. Grade 12
?
Other - Misc
?
Foreign Grade 12113
Analysis of Diverse Qualifications Admits (1997-1 to 2002-3)
2003.06.09
?
Office of Analytical Studies
?
Page 7
Completion Rates by BOA
?
(All Entry Cohorts
1997-1 to 1998-3)
Chart 7b
University Transfer
?
College Transfer ?
B.C. College
?
Canadian Grade 12
?
B.C. Grade 12 ?
Other - Misc ?
Technical ?
Foreign Grade 12/13
DCO7
DDQ
0% ?
20%
?
40% ?
60% ?
80%
?
100% ?
120%
Chart 7a
100%
90%
80%
70%
60%
50%
40%
30%
20%
10%
0%
o
Persistence and Completion Rates
(Entry Cohorts 1997-1 to 1998-3)
?
% of DQ Cohort Registered
?
I ?
'Cum % of DQ Cohort Completed
---------
?
- - % of CO Cohort Registered
?
- - Cum % of CO Cohort Completed
.
-
l
-
-------------------------------------------------------------
I
--
-
- ! j.
_
-
--
-- ?
--
?
--
?
--
. ?
.
.- .-
._ ?
flu
._ ?
U
1 ?
2 ?
3 ?
4 ?
5 ?
6 ?
7
?
8 ?
9 ?
10 ?
11 ?
12 ?
13 ?
14 ?
15 ?
16
?
17 ?
18
?
Semester
#
S
#
Admitted
DQ
CO
Basis of Admission
Degree
15
15
College Transfer
7
7
University Transfer
20
20
Technical
7
5
B.C. College
63
65
Mature
37
22
Canadian Grade 12
13
13
B.C. Grade 12
35
35
Other - Misc
1
1
Foreign Grade l2ll3
2
2
TOTAL
200
185
.
Analysis of Diverse Qualifications Admits (1997-1 to 2002-3)
2003.06.09 ?
Office of Analytical Studies
?
Page 8
The slightly higher completion rate for the control group can be partially explained by the
fact that the DQ cohort completed an average of five more credits in total than the control
group. With SFU credits and transfer credit combined, of those students who graduated
with a degree, the DQ cohort completed 128 hours on average while the control group
completed 123.
In relation to completion rates, the second indicator we will examine is the
time to
degree completion.
This is a simple count of the number of semesters from the point of
admission until the graduation semester. Of those students who completed a degree at
SFU and were admitted between 1997-1 and 1998-3, both the DQ students and the
control group took approximately three years on average to complete their bachelor's
degree (10 semesters for the DQ cohort and 9 semesters for the control group). Note that
both cohorts entered SFU with an average of nearly one year of transfer credit.5
The third indicator of interest when looking at degree completers is the extent of
switching between faculties --
whether the completers received their credential from the
same faculty they were initially admitted to. Almost all completers from each cohort
received their credential from the same faculty into which they were admitted (93% for
the DQ cohort and 92% for the control group). In other words, among the completers,
there was a minimal amount of switching between faculties before completion. We can
drill down further and look at the extent of switching between credentials among the
completers, and again there is little difference between the two groups (88% of the DQ
• ?
completers finished the same credential they started versus 89% of the control group).
A fourth performance measure is the
semester GPA,
the grade point average calculated
on courses completed each semester. Chart 8 shows that students in the DQ cohort had
higher semester GPA's than the control group in each of the first four semesters;
subsequent semesters showed similar semester GPA's between the DQ and control group
until the 9
th
and
10th
semester when the DQ cohort again showed higher semester GPA's.
By the 11
th
semester of registration, there are not enough students registered to make
reliable comparisons of the GPA's. Although, it is evident that those few students in the
DQ cohort who continued to register beyond the
13th
semester experienced declining
semester GPA's.
A fifth performance measure is the
cumulative grade point average
(CGPA) calculated
on all courses completed since admission to SFU. Chart 9 shows that, on average,
students in the DQ cohort achieved higher CGPA's after the first semester, compared to
the control group, but both groups performed equally as well, with the control group
performing slightly better than the DQ cohort in the second year at SFU. By the
11th
semester or 4
th
year, the number of students registered becomes too small to draw valid
conclusions about their relative academic performance. Only those students registered in
the semester are included in Chart 9.
Depending upon each student's pace and the number of credits they transferred to SFU, some completed
in less time and others completed in more time. It was not possible to examine the time to completion for
• ?
students without any transfer credits. An insufficient number of students had graduated after entering SFU
without transfer credits, but given a longer time horizon, this would be possible in a future analysis.
Page 9
Chart 8
# DQ Registered
o
# CG Registered
DQ Cohort Sem GPA
Control Group SemGPA
Semester GPA by Semester ?
(DQ vs. Control)
3.50
3.30
3.10
2.90
270
I
2.10
1.90
1.70
1.50
Chart 9
3.50
3.30
3.10
2.90
2.70
CIO
ç 2.50
2.30
2.10
1.90
1.70
1.50
fl]
-
?
--- - ?
-- ?
- - -----------------------------------------------
TI
1 2 3 4
5 6 7
8 9 10 11 12 13 14 15 16 17 18
Semester #
*
Note: Excludes students not registered in the semester.
I
Cumulative GPA by Semester ?
#DQ Registered
# CG Registered
(DQ vs. Control) ?
- -
DQ Cohort CGPA ?
I
Control Group CGPA
I
iiii
IIIIIIII ?
IIIIIII 1111
•
?
:1:
1 2 3 4
5 6 7
8 9 10 11 12 13 14 15 16 17 18
Semester
#
*
Note: Excludes students not re
g
istered in the semester.
DIX
800
700
600
500 ._
300
200
100
0
.
900
800
IAA
'
600
f,Ii-
400
300•
200
'Is"-
0
[I
Analysis of Diverse Qualifications Admits (1997-1 to 2002-3)
?
2003.06.09 ?
Office of Analytical Studies ?
Page 10
Chart 10 provides another perspective on the CGPA of the DQ and control groups. This
chart compares the CGPA of the DQ and control groups, but only in their last semester of
registration. One noteworthy observation is that nearly 400 students from each of the DQ
and control group were still registered at SFU in the Fall of 2002, with CGPA's of 2.64
and 2.56 respectively. Given that each cohort is comprised of 762 students, these
CGPA's in 2002-3 are derived from approximately one-half of the students in the
respective cohorts. The other observation from this chart is the general upward trend in
CGPA's of both the DQ cohort and the control group. The mean CGPA of those students
who last registered prior to 2001 is approximately 0.40 grade points below those who last
registered in 2002-3. A comparison of the mean CGPA across all 762 students in each
cohort shows that the cumulative academic performance of the DQ cohort is almost one
tenth of a grade point above the control group (2.49 versus 2.40).
Comparing CGPA's after each semester of registration or in the last registered semester
does not compare students at equally comparable stages of progress in their SFU
program, since students do not all register for the same number of hours each semester.
Therefore, Chart 11 shows the cumulative GPA' s after each of 15 SFU credit hour
increments. DQ students who completed fewer than 15 credit hours or more than 75
credit hours attained higher CGPA's than the control group. Again, there is a general
upward trend in CGPA among both the DQ and control group: the more hours a student
completes at SFU, the higher the CGPA. In fact, when comparing the mean CGPA's of
those who completed ninety or more credit hours versus those who completed fewer then
fifteen hours, we see that the increase in CGPA is 0.64 among the DQ cohort and almost
one full grade point (0.94 grade points) among the control group.
A sixth performance measure is the students'
academic standing
at the end of their last
registered semester. This academic standing determines whether a student is eligible to
re-register in the following semester. A student is eligible to re-register if their academic
standing is one of the following:
Blank - not evaluated, or
GAS - good, or
OAP - on academic program (CGPA <2.00), or
CAP - continued academic probation.
All other academic standings indicate a student is performing unsatisfactorily and
therefore ineligible to re-register. Chart 12 shows the proportion of students in each
cohort by academic standing. As at their last registered semester, 93% of the DQ cohort
were eligible to re-register, compared to 91% of the control group.
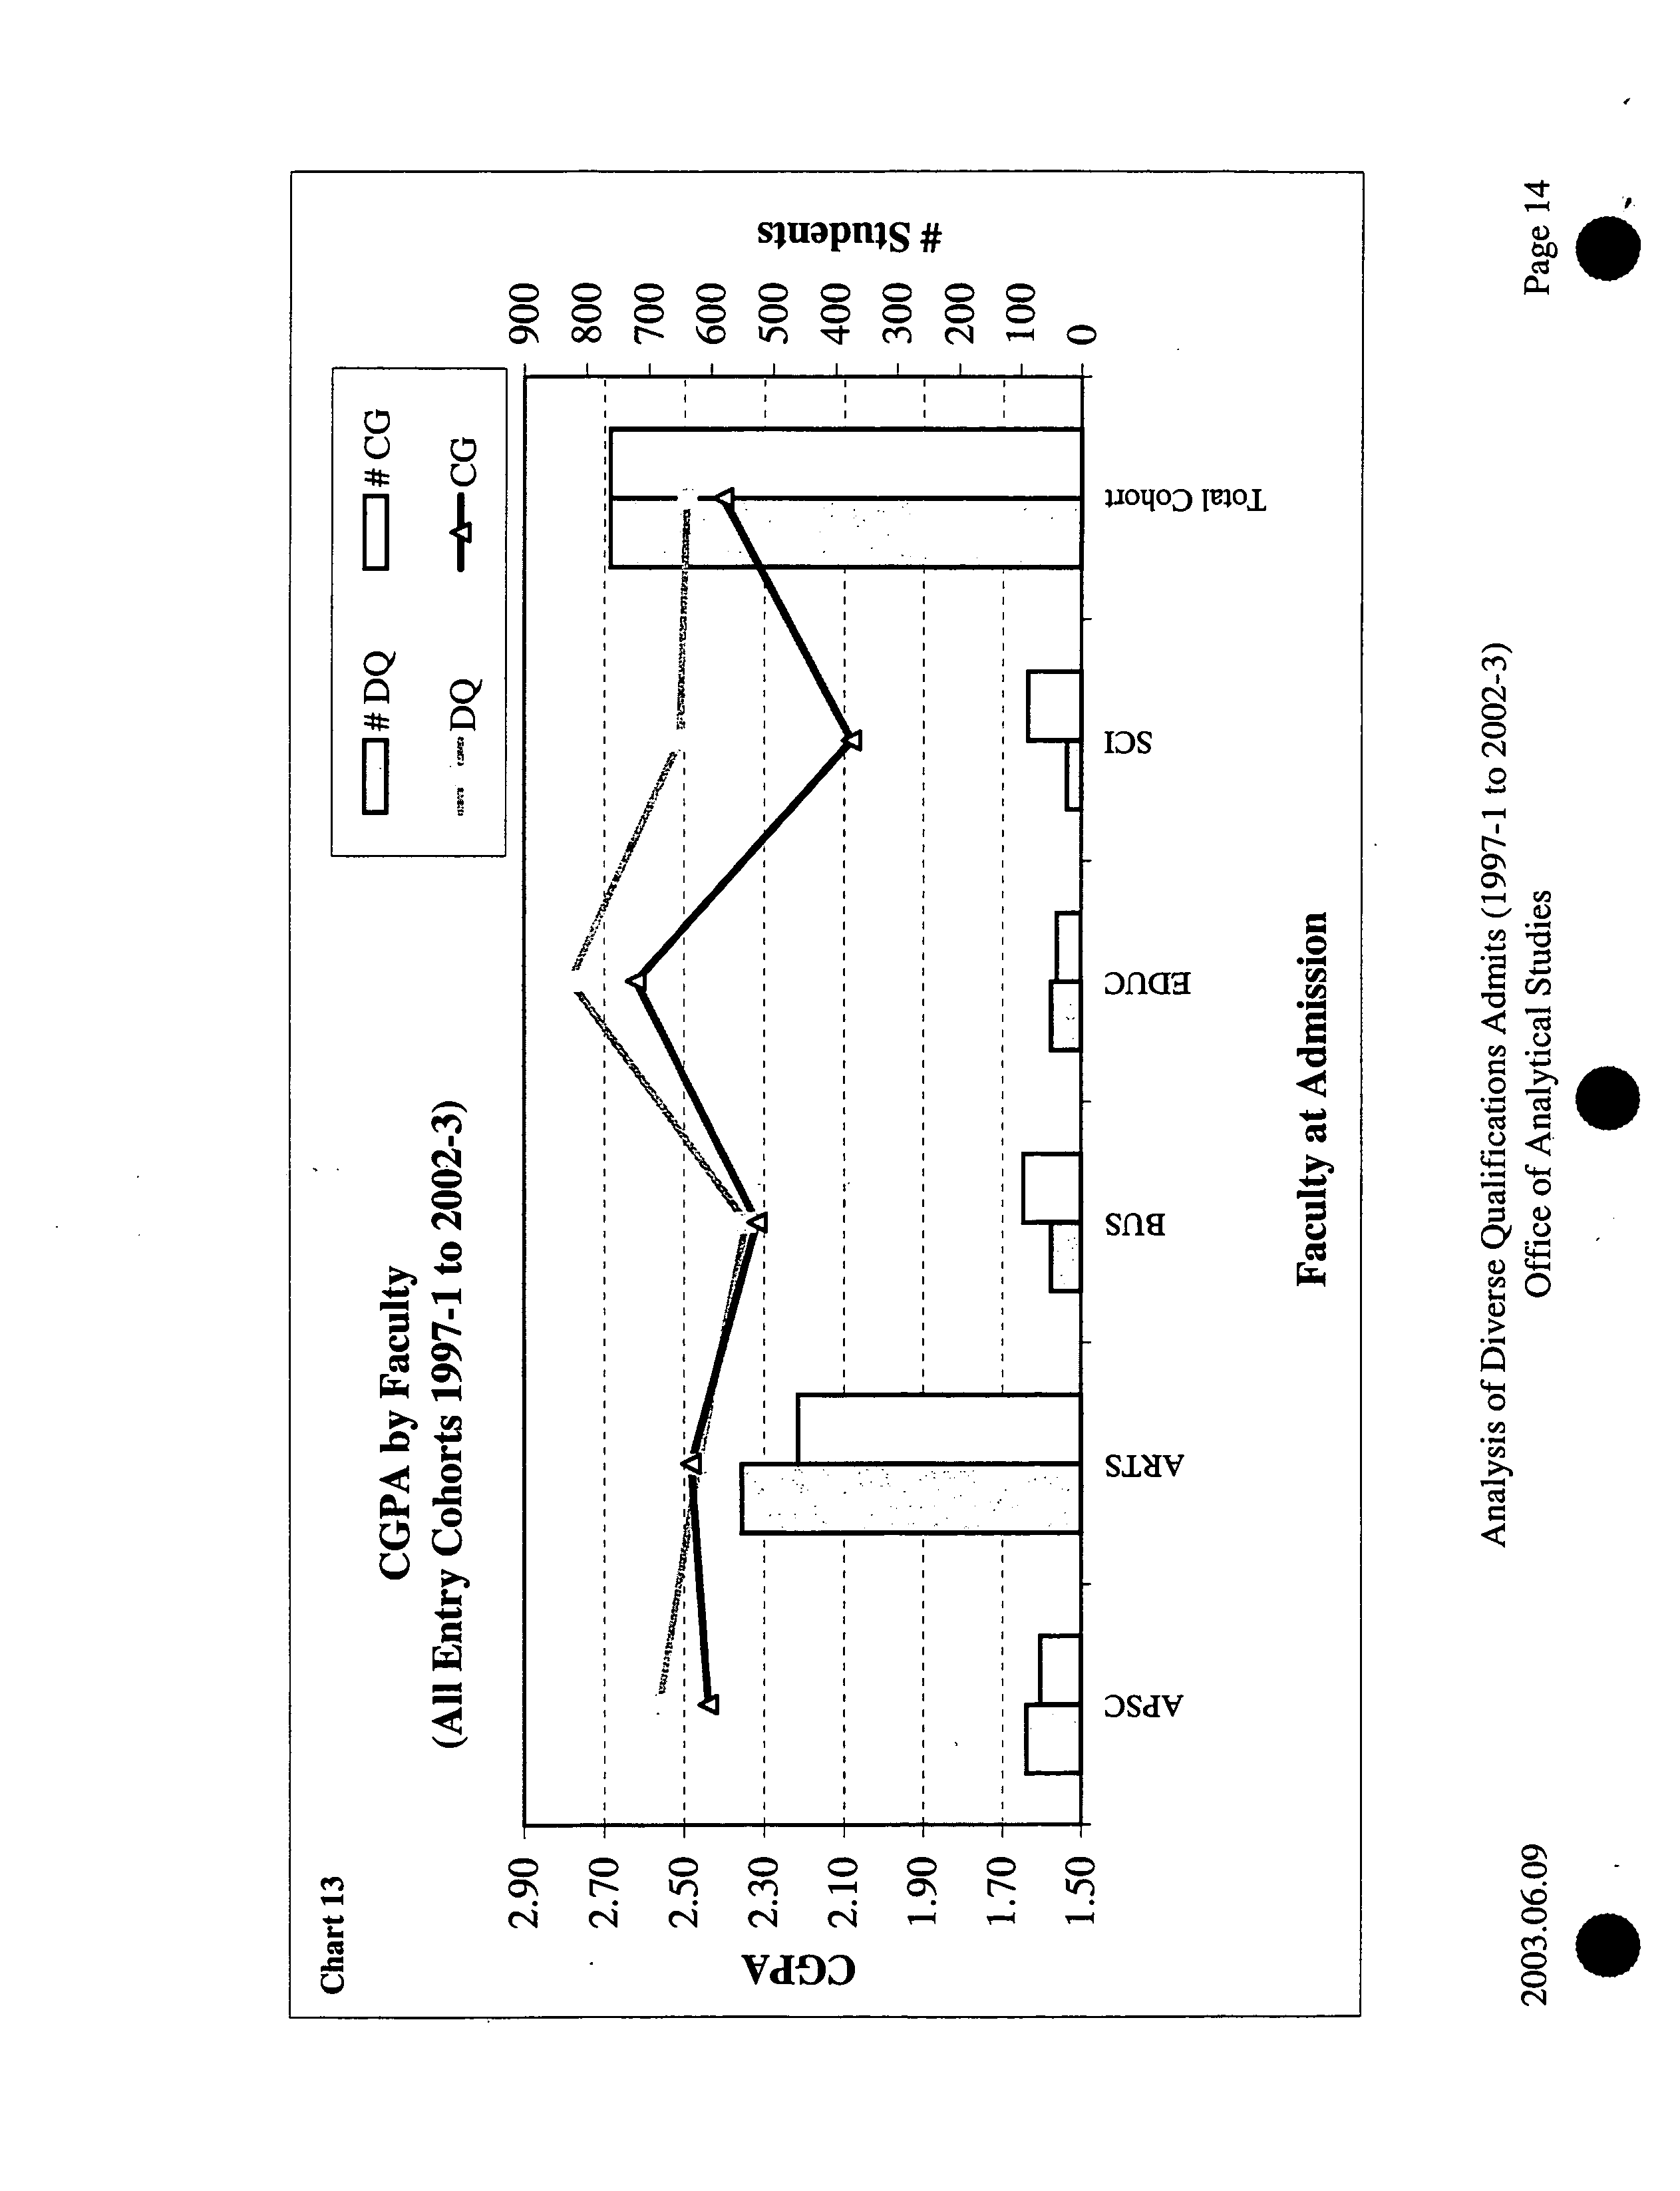
A seventh and final performance measure looks at the performance of students by Faculty
of admission. The measurement for comparison between the DQ cohort and the control
group is the
cumulative grade point average by Faculty.
As shown in Chart 12,
students admitted to the Faculty of Arts and Business Administration performed equally
well, while Applied Science, Education and Science students in the DQ cohort performed
better than the control group.
.
Page 11
Chart 10
2.9
2.7
2.5(
2.3(
2.1(
1.9(
1.7(
1.5(
o
Cumulative GPA by
?
Last Registered Semester
?
(DQ vs. Control)
Iiii:iiIII:::jI:IjIiIZIIIIIj:I -
I
?
rnm
400
350
300 E
250
200
150
100 •
50
0
# DQ Registered
# CG Registered
—
—
DQ Cohort CGPA
ó Control Group CGPA
C 1
4
?
C4 ?
N
Last Registered Semester
Chart!!
CGPA by SFU Hours Passed ?
(All
Entry Cohorts 1997-1 to 2002-3)
3.10
2.90
2.70
2.50
2.30
C)
2.10
1.90
1.70
1.50
0%
?
0%
Ill ?
N
en
V
0
SITU Hours Passed
#DQ ?
#CG ?
—::—DQ CGPA
?
—ô—CGCGPA
.5UU
250
200
150
PC
100 rJ:J
1*:
50
0
ON
?
0
00 ? 0%
'I-)
N
S
- -
IizIiIflhziifflziiiF1Iiiii
Analysis of Diverse Qualifications Admits (1997-1 to 2002-3) ?
2003.06.09 ?
Office of Analytical Studies ?
Page 12
o
S
Chart 12
Academic Standing in Last Registered Semester
?
I ?
I ?
P
Subtotal: Eligible to Re-Register
9%
I ?
I ?
I ?
I ? I ?
I ?
I
?
GAS - Good
?
I
I ?
I
I ?
I ?
I ?
J ?
I ?
I
I ?
I ?
I
I ?
I ?
I ?
I
I ?
S ?
I ?
I ?
I
?
Blank - Not evaluated ?
91
I
I ?
I ?
I ?
I
?
I ?
I ?
I ?
I ?
I
?
I ?
I
?
I
?
I ?
I ?
I ? I ?
I
I ?
I ?
I ?
I
?
I ?
I ?
I ?
I ?
I
I ?
I ?
I ?
I
?
I ?
I
I ? I ?
I ? I
?
OAP - On Acad. Probation (CGPA
< ?
I
I ? I ? I
2.00)
I ?
I ?
I ?
I
?
I
?
I
I ?
I ?
I
I ?
I
?
I ?
I
I ? I ?
I ?
I
?
I
?
I ?
I ?
I ?
I
I ?
I ?
I
I
?
I
?
I
?
I ?
I
?
I ?
I
?
CAP - Continued Academic Probation
?
I ?
:
I ?
I ?
I ?
I
I ?
I ?
I ?
I ?
I ?
I
?
I
?
I ?
I ?
I
?
I ?
I
?
9
II; ?
I ?
I
I ? I ?
I ?
I
I ?
I ?
I ?
I ?
I
?
I
?
Subtotal: Ineligible to Re-Register ?
I
?
I ?
I ?
I
?
I
?
I
?
I ?
I ?
I ? I ?
I
I ?
I
?
I
?
I
?
I ?
I
?
I
?
I
I ?
I ?
I ? t ?
I
I ?
I ?
I ?
I
?
I
?
I ?
I ?
I
?
I
?
I
?
I
?
I ?
I ?
I
?
I
?
I ?
I ?
I ?
I
I ?
I
RTW - Required to Withdraw
?
I ?
I ?
I ?
I ?
I
I ?
I ?
I
I ?
I ?
I ?
I ?
I
I ?
I ?
I ?
I ?
I
?
I
?
I ?
I
?
I ?
I ?
I ?
I ?
I ?
I
I ?
I ?
I ?
I ?
I ?
I
ING - CGPA < 1.00 Last 2 sems
I ?
I
?
I ?
I ?
I
?
I
?
I ? I
?
I ?
I ?
I
I ?
I ?
I
?
I ?
I ?
I
?
I ?
I ?
I ?
I
I
?
I ?
I ?
I
I ?
I
?
I
INF - NIF Grade(s) Last 2 sems
I ?
I
?
DCGH
I
I ?
I
?
I ?
I ?
I ?
I
?
I
DDQH
?
?
INW - Withdrew 3 sems in a row
?
I ?
I
I ?
I ?
I ?
I
?
I ?
I
I ?
I ?
I ? I
I ?
I ?
I ?
I ?
I ?
I ?
I ?
I
I ?
I ?
I ?
I
?
I ?
I
0% 10% 20% 30% 40%
50%
60% 70% 80% 90% 100
%
.
Analysis of Diverse Qualifications Admits (1997-1 to 2002-3)
?
2003.06.09 ?
Office of Analytical Studies
?
Page 13
0
N
0
CN
cn
rn
o
cl
ci
rn
e ?
C.)
DS
.-
I
DncL
SflH
p
S
WP
fl
3S #
?
II.)
0 CD
Ol
0'
OT
en
PLO
I ? I ? I
I
?
I ?
I
I ? I
I ? I
ffi ?
I ?
I
HH
1
1OT 4 0 D woi
sflIv
ol
DSdV
-- ?
-.
I
I
HE
2
C.
CIN
C.
N
0 0 0 0 0 0
N N N N N '
VdOD
Conclusion:
After comparing the 762 DQ admits to the control group, the following conclusions can
be drawn:
1)
The persistence and completion rates of both groups are roughly equal. Although
the completion rate for the control group is slightly higher (14% versus 12%), the
difference becomes less significant when we recognize that the DQ completers
finished with five more credits on average than the control group.
2) Both groups entered SFU with an average of one year of transfer credit and
completed, on average, within three years of entering SFU.
2) The DQ cohort shows higher semester GPA' s than the control group in the first
and third year at SFU, but semester GPA performance beyond the 5
th
year tends to
decline.
3)
Among the completers in both the DQ cohort and the control group, there was
very little switching between faculties. Only 6% of the DQ cohort and 7% of the
control group switched faculties from the time of admission to the time of
completion.
4)
On average, students in the DQ cohort attained a CGPA of 2.49 versus 2.40
among the control group. Approximately one-half of the students in each of the
DQ and control group were registered in 2002-3. Of those who were registered in
Fall 2002, their mean CGPA's were 2.64 among the DQ cohort and
2.56
among
the control group. For both groups, the more hours a student completes at SFU,
the higher the CGPA.
5) Based on the academic standing in their last registered semester, 93% of the DQ
cohort (versus 91% of the control group) were eligible to re-register in the
following semester.
6) Students admitted to the Faculty of Arts and Business Administration performed
equally well, while Applied Science, Education and Science students in the DQ
cohort performed better than the control group.
Overall, the Diverse Qualifications Admissions Policy appears to be working very well -
it allows students to be admitted to SFU who would not otherwise be qualified and these
students perform academically on par with those admitted at the cut-off margins under
normal academic qualifications.
Page 15