S.06-141
4
5
a,iertcic
• ?
SIMON FRASER UNIVERSITY
?
&evfz
1
4
D
e-
c
-
0(6
MEMORANDUM
To: ?
Senate
From: ?
B.
Krane, Chair
Senate Committee on Undergraduate Studies
Subject: ?
Literacy Admissions Criteria
(SCUS Reference 06-38)
Date: ?
22 November 2006
Action undertaken by the Senate Committee on Undergraduate Studies at a meeting held
November 7, 2006 gives rise to the following motion:
MOTION
That Senate approve the proposed revisions to the literacy admissions criteria as
follows:
B+ and above
(75%+)
English l2IEnglish Lit 12: admitted
—B-and
Lvluw
(s73%)English 12/English Lit 12: admitted, register in Foundations
of Academic Literacy course (PAL), or submit an acceptable LPI score (LPI
4/50% or higher) to obtain FAL equivalency
Below C (<60%) English 12: not admitted.
S
L.
:t
'/e (O'/)
These revisions would take effect for the Spring 2007 admissions.
Rationale: Based on preliminary data from the Fall 2006 admissions cycle, there is an
immediate need to simplify the Literacy Admissions criteria to support successful
recruitment. The proposal is intended to streamline the use of LPI test scores, and to
adjust the threshold scores in English 12. SCUS will review this policy within 3 years.
0
SCUS 06-38
SIMON FRASER UNIVERSITY
Nello Ange11i, Associate Vice-President ?
8888 UNIVERSITY DRIVE
Students and International ?
BURNABY, BRITISH COLUMBIA
Student Services
?
-
?
CANADA V5A 1S6
Telephone: (604) 291-3583
Fax: (604) 291- 4341
October 31, 2006
To: SCUS Members
Please find attached a proposal to amend the current Literacy Admissions criteria. Based
on preliminary data from the Fall 2006 admissions cycle, there is an immediate need to
simplify the Literacy Admissions criteria to support successful recruitment. The proposal
is intended to streamline the use of LPI test scores, and to adjust the threshold scores in
English 12. A full rationale is provided in the attached.
Recommendation: ?
That SCUS approve the revised literacy requirements
0 ?
effective January 2007 (Spring 2007).
Nello Angerilli, Associate Vice-President
Students & International and Acting Registrar
IN
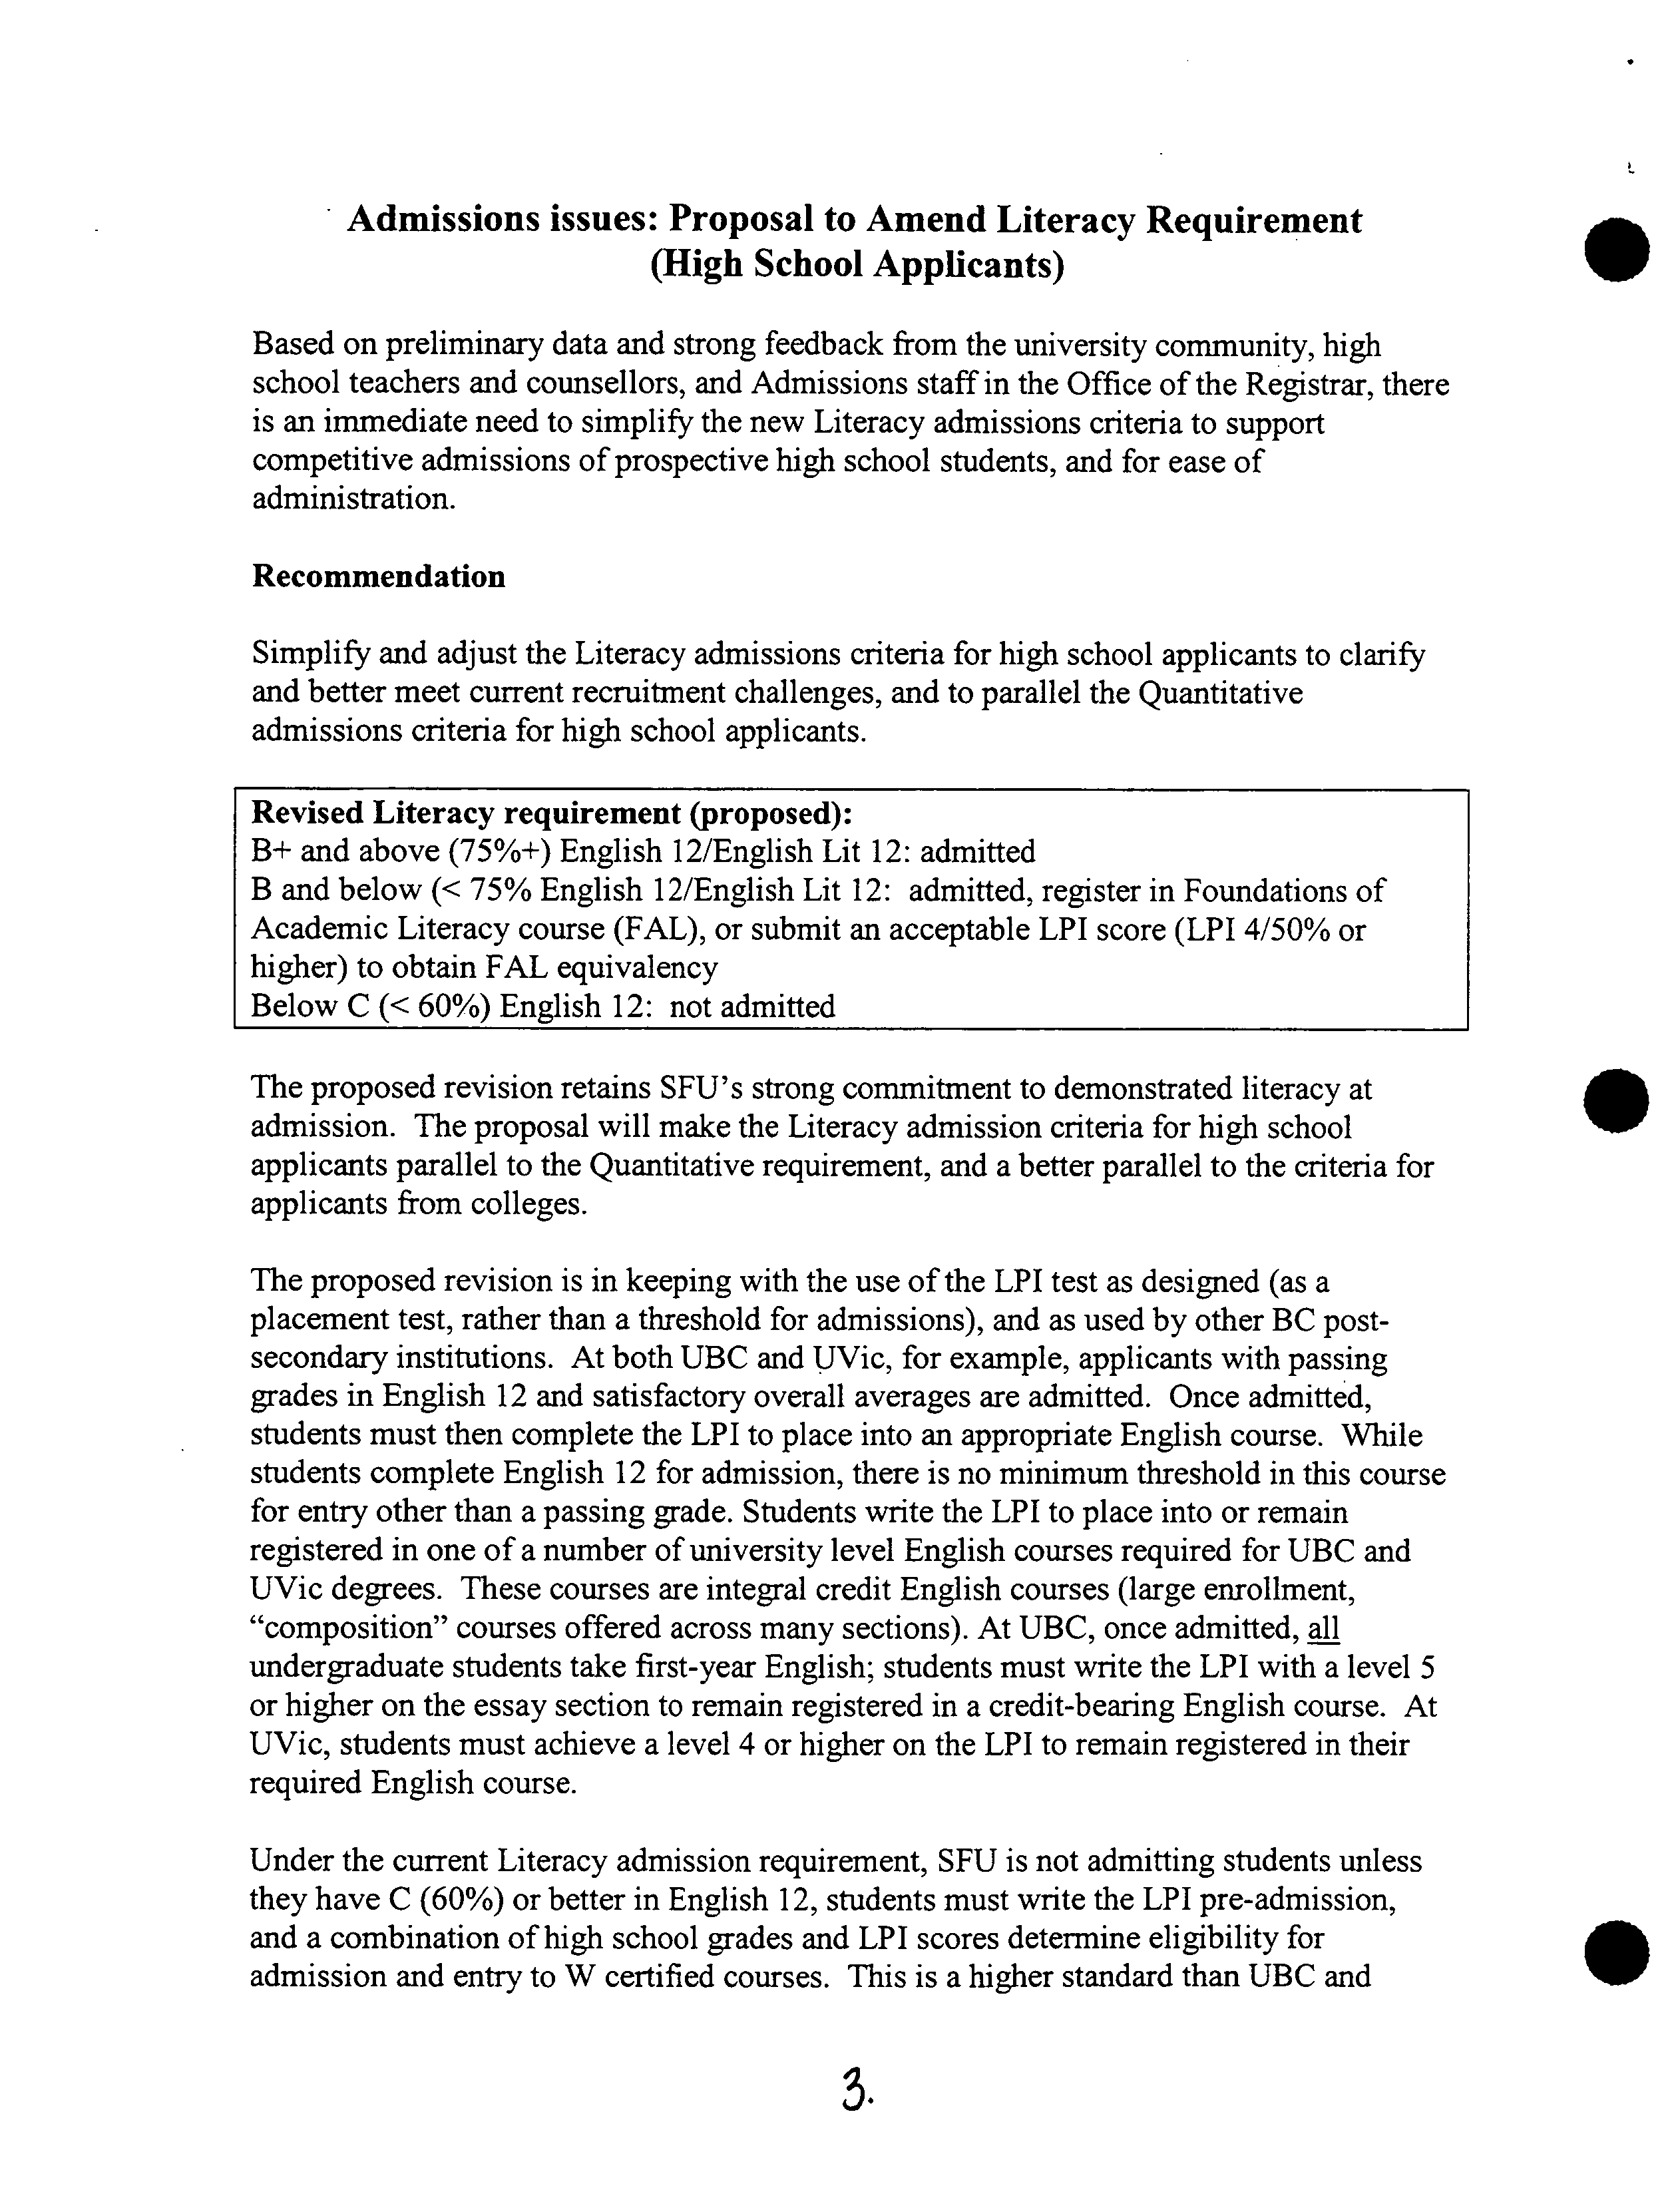
Admissions issues: Proposal to Amend Literacy Requirement
(High School Applicants)
?
0
Based on preliminary data and strong feedback from the university community, high
school teachers and counsellors, and Admissions staff in the Office of the Registrar, there
is an immediate need to simplify the new Literacy admissions criteria to support
competitive admissions of prospective high school students, and for ease of
administration.
Recommendation
Simplify and adjust the Literacy admissions criteria for high school applicants to clarify
and better meet current recruitment challenges, and to parallel the Quantitative
admissions criteria for high school applicants.
Revised Literacy requirement (proposed):
B+ and above
(75%+)
English 12/English Lit 12: admitted
B and below (<
75%
English 12/English Lit 12: admitted, register in Foundations of
Academic Literacy course (FAL), or submit an acceptable LPI score (LPI
4/50%
or
higher) to obtain FAL equivalency
Below C (<60%) English 12: not admitted
The proposed revision retains SFU's strong commitment to demonstrated literacy at
admission. The proposal will make the Literacy admission criteria for high school
applicants parallel to the Quantitative requirement, and a better parallel to the criteria for
applicants from colleges.
The proposed revision is in keeping with the use of the LPI test as designed (as a
placement test, rather than a threshold for admissions), and as used by other BC post-
secondary institutions. At both UBC and UVic, for example, applicants with passing
grades in English 12 and satisfactory overall averages are admitted. Once admitted,
students must then complete the LPI to place into an appropriate English course. While
students complete English 12 for admission, there is no minimum threshold in this course
for entry other than a passing grade. Students write the LPI to place into or remain
registered in one of a number of university level English courses required for UBC and
UVic degrees. These courses are integral credit English courses (large enrollment,
"composition" courses offered across many sections). At UBC, once admitted, all
undergraduate students take first-year English; students must write the LPI with a level
5
or higher on the essay section to remain registered in a credit-bearing English course. At
UVic, students must achieve a level 4 or higher on the LPI to remain registered in their
required English course.
Under the current Literacy admission requirement, SFU is not admitting students unless
they have C (60%) or better in English 12, students must write the LPI pre-admission,
and a combination of high school grades and LPI scores determine eligibility for
admission and entry to W certified courses. This is a higher standard than UBC and
3.
•
?
UVicin that SFU has a minimum grade requirement in English 12. This proposal is to
amend use of the LPI to use post admission, to place into or out of FAL. It is important
to note that FAL is not an English composition course, but an additive credit "university
writing" course equivalent to UBC's non-credit, full fee remedial writing course. FAL
credit does not count towards degree credit totals while UBCs English courses do.
The proposal includes modification of "threshold" admission grades to use the full range
of values for the high school grade of B+
(75%
to
85%)
in English 12 (or the more
challenging English Literature 12). This is a reasonable adjustment given the
correspondence between this grade level and the likelihood of achieving an LPI essay
score of 4. Based on discussions with the agency administering the LPI and SFU Fall
2006 admissions data, high school students achieving B+ grades in the range of
75%-
79% in English 12 are as likely to score a 4 on the LPI as are those with 80%-85% in
English 12.
Furthermore, because of the difference in grading notation at the high school level, SFU
must "translate" letter grades used by high schools into a percentage, and then to a grade
point on SFU's scale. If a B+ high school grade ranges from
75%
to
85%
(3.33 SFU
equivalent), it is an arbitrary practice to set the threshold at the median value in the range,
rather than the lowest value in the range. In other words, picking the mid-range value of
80% means that SFU is effectively disqualifying or second-guessing some B+ high
school grades as less valid than other B+ grades. SFU should not be disadvantaging or
discouraging high school applicants as a result of an imperfect system of grade
correspondences.
Setting a threshold above a B+, or not fully utilizing the full B+ range for English 12, was
found in the 2006 admissions cycle to significantly and negatively impact recruitment
efforts at a time of highly competitive recruitment across universities and colleges. SFU
had (and will continue to have) a harder time than UBC attracting quality students with
higher averages in all other academic subjects (eg. Science and Applied Science
disciplines) who have B+ grades in the
75-79%
range in English 12. These students were
less apt to attend SFU after application. Furthermore, a significant proportion of admits
in the lower B+ range of
75-79%
chose to delay writing the LPI, likely hoping that their
English 12 grade would rise to 80% or above. While these students did subsequently
write the LPI and achieve satisfactory scores, such delays significantly hampered their
enrollment options and again, made SFU a less attractive option
Under the proposed revision, parallel with the Q admissions criteria, students receiving a
grade below the B+ threshold in English 12 would be required to register in FAL unless
they subsequently achieve an LPI score that grants "FAL equivalency".
Basing offers of admission on interim grades received in May from the Ministry of
Education supports the early admission process at this time of competitive recruitment,
provides more certainty for applicants and the university, and allows students better
access to course selection in the early July registration period.
If.
SFU's recruitment publications have been printed and were distributed to schools this
Fall. The proposed revision to the Literacy criteria is still in keeping with the spirit of the
printed material promoting competence in high school English and encouraging students
to write the LPI as early as possible. Prospective students know that SFU places a
premium on literacy and quantitative preparation, and that the university looks closely at
both high school Math and English in order to make offers of admission.
The proposed revision to the Literacy admissions criteria will continue to allow sufficient
lead-time every semester to ensure capacity in FAL 099 to accommodate students who
require this course immediately upon admission, and those students who may still write
the LPI following admission and later register in FAL. FAL or FAL equivalency will
continue to act as a de facto prerequisite for W certified courses, the minimum standard
for literacy previously approved by Senate is crucial and would be retained, and, taken
together the elements of the proposed changes will continue to ensure that students are
still well-prepared for SFU' s commitment to writing across the curriculum.
0
5.
0
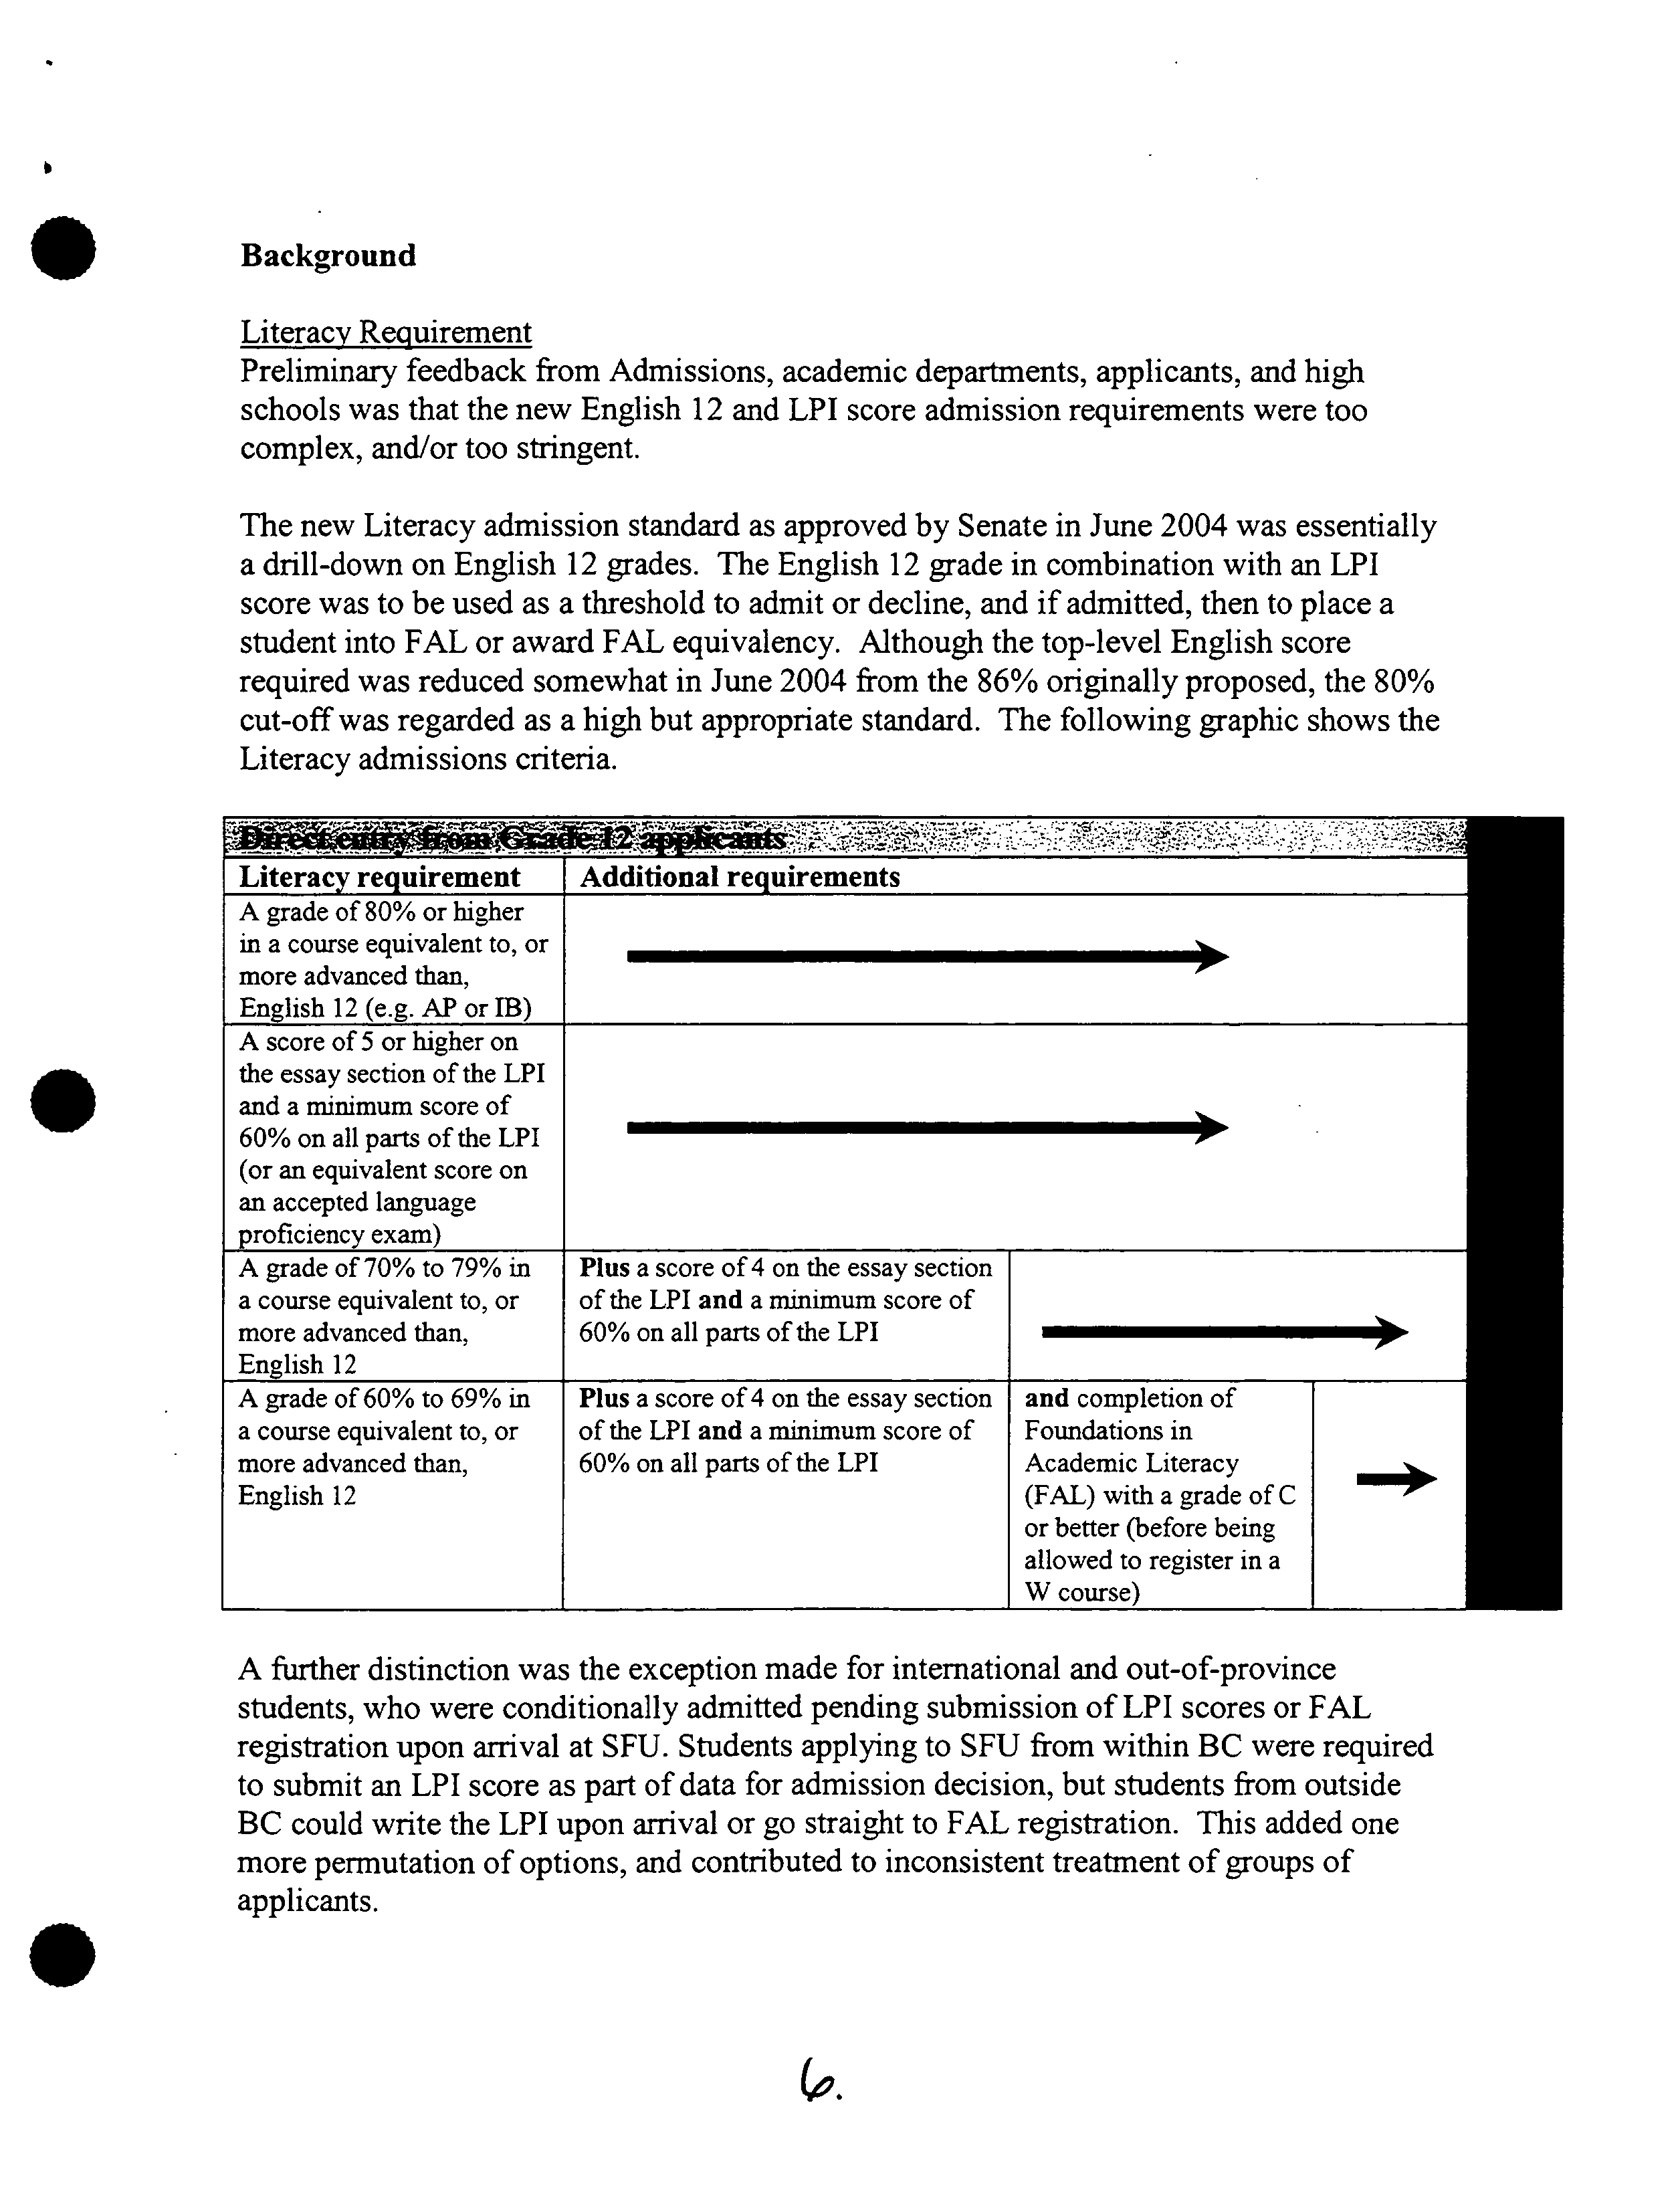
Background
Literacy Requirement
Preliminary feedback from Admissions, academic departments, applicants, and high
schools was that the new English 12 and LPI score admission requirements were too
complex, and/or too stringent.
The new Literacy admission standard as approved by Senate in June 2004 was essentially
a drill-down on English 12 grades. The English 12 grade in combination with an LPI
score was to be used as a threshold to admit or decline, and if admitted, then to place a
student into FAL or award FAL equivalency. Although the top-level English score
required was reduced somewhat in June 2004 from the 86% originally proposed, the 80%
cut-off was regarded as a high but appropriate standard. The following graphic shows the
Literacy admissions criteria.
.
Literacy requirement
Additional requirements
A grade of 80% or higher
in a course equivalent to, or
more advanced than,
English 12 (e.g. AP or IB)
A score of
5
or higher on
the essay section of the LPI
and a minimum score of
60% on all parts of the LPI
(or an equivalent score on
an accepted language
proficiency exam)
A grade of 70% to 79% in
Plus
a score of 4 on the essay section
a course equivalent to, or
of the LPI
and
a minimum score of
more advanced than,
60% on all parts of the LPI
English 12
A grade of 60% to 69% in
Plus
a score of 4 on the essay section
and
completion of
a course equivalent to, or
of the LPI
and
a minimum score of
Foundations in
more advanced than,
60% on all parts of the LPI
Academic Literacy
English 12
(FAL) with a grade of C
or better (before being
allowed to register in a
W course)
A further distinction was the exception made for international and out-of-province
students, who were conditionally admitted pending submission of LPI scores or FAL
registration upon arrival at SFU. Students applying to SFU from within BC were required
to submit an LPI score as part of data for admission decision, but students from outside
BC could write the LPI upon arrival or go straight to FAL registration. This added one
more permutation of options, and contributed to inconsistent treatment of groups of
applicants.
0
In addition to the complexity of the literacy admission criteria as approved, in the
2005/06 academic year, it quickly became apparent that in BC the competition for new
students entering post-secondary education had increased significantly, for a number of
reasons:
• Declining population of 17-24 year olds
• Increase in the number of post-secondary seats (gov't access targets)
• Increase in the number of degree granting institutions
• Rising tuition fees
• Improving economy resulting in higher employment
As the 2005/06 admissions cycle unfolded, it became clear that a lower-than-predicted
number of high school applicants had written the LPI in the Fall 2005 period. This
delayed the submission of test scores during the early admissions period in Spring 2006.
A further difficulty arose in April 2006 when the LPI test administration office
experienced high volume and technical difficulties sending test scores to institutions.
This was particularly problematic for SFU in that the test scores were to be used for
determining admissibility rather than placement.
Delays with receipt of LPI scores and lower-than-expected "conversion" rates of
applicants in the Spring 2006 admission period led to the creation of a temporary process
for accepting students on a "conditional" basis, somewhat parallel to the process for out-
of-province students. The requirement to submit an LPI score early was suspended for
Fall 2006 applicants on their SIMS checklists, which enabled these applicants to be
conditionally admitted pending receipt of LPI scores once they became available. Emails
were sent to applicants explaining that they were conditionally admitted but still were
required to meet the Literacy requirement by various means prior to courses beginning in
September.
Although well intentioned, great confusion was created for applicants and the university
community due to the adoption of this amended process late in the admissions cycle.
Although an expanded group of students received offers of admission, earlier applicants
at these levels may have been rejected at the same standard, and it became clear that there
were complications in determining who would retain offers of admission if final grades
had dropped from earlier self-reported or interim grades. It also became clear later in the
summer that, due to confusion, the process had been applied more broadly than originally
discussed, advancing conditional offers to students falling into the lowest English 12
band of 60%-69%. The end result for a small number of students was revocation of their
admission offers after being led to believe they had gained admission. This was upsetting
for the students, and frustrating to programs struggling to meet enrollment targets.
For students who retained admission, there was confusion about the use of final grades
and the impact of these grades on course registration; due to staffing issues, the business
process in Admissions was not adaptable to using the final grades received in late July to
fully update student status regarding the Literacy criteria. This latter issue will continue
to present problems until reorganization of Student Services is completed.
?
0
• ?
As a related issue, consideration was given to admitting fully (not conditionally) on
interim grades only, rather than waiting for final grades. In the past, admission based on
interim grades provided some remedy to the problem of Admissions' limited capability to
update student records with final English (and Math) grades from Ministry TRAX data.
However, this remedy did not address the question of whether some offers of admission
should be revoked when there is a significant drop between interim and final grades. Nor
did it address the fact that some students exempted from FAL or FAN should have been
taking those courses based on final grades, while other students directed to take those
courses should have been exempted if final grades were considered. It continues to be
challenging for Admissions to update student records in a timely way due to current
business processes and staffing limitations.
To summarize, pure application of the original Literacy criteria was found to be too
stringent and hampered conversion of applicants, but conditional application of the
criteria in the manner adopted was been found too complex and created new problems.
O ptions
Considered
1.
Use the LPI as intended, as a placement instrument, and require students with interim
grades in English 12 below a set level to register in FAL immediately (in their first
semester). They will then be prepared early for higher-level W work, and will experience
no delays in their remaining degree requirements. This solution will allow Admissions to
•
?
admit students on the basis of interim English 12 grades, and those students whose final
grades fall below the threshold could also be directed into FAL.
This solution will not resolve the bottleneck issue for programs such as Engineering
Science, which has certified a required first-semester course as W. All W courses have
FAL or FAL equivalency as a prerequisite. Engineering Science should consider
removing the W from ENSC 100/101; this was advised when the certification was first
requested. TechOne has used this solution, removing the W from TECH 100, but
retaining it on TECH 101 (second semester required course). Discussions will also begin
soon as to the feasibility of newly admitted students taking FAL immediately prior to the
beginning of the official "admit term".
2.
Abandon the use of the LPI altogether and base admission solely on English 12 grades,
e.g. students entering with a certain grade range in English 12 go directly into FAL. At
present, modifications to SIMS are frozen pending an upgrade to Version 8.9, which
would make removal of the LPI requirement from the admissions modules (and
consequential changes to other modules) problematic. Further, the LPI has proven to be a
useful instrument at other universities for placement into differentiated English or writing
courses.
3.
Stay the course for a pre-determined number of admissions cycles and let programs
struggle with enrollments, in the hopes that FTEs will adjust as applicants and the
internal community adjust to the new requirements. If predictions of ongoing recruitment
g.
challenges for the coming years are accurate, this is not advisable and would result in
significant cost (monetary and reputational) to the university.
?
0
4. Without changing the criteria as written, allow Admissions more discretion to admit
around the margins (low final English or low LPI scores). The numbers of students
entering SFU with low English and/or LPI scores would fluctuate year to year, resulting
in more students admitted with weak backgrounds in more competitive recruitment years.
More students admitted in this way would result in more students delayed in taking W
courses in their first semesters, and potentially higher downstream attrition for students
who cannot subsequently pass FAL at the required grade level. FAL capacity would
have to be adjusted year-to-year on short notice, making enrollment planning difficult.
Demands for academic supports would likely also fluctuate. Unless Admissions could
significantly and quickly improve business processes and communications, this would
not be a transparent or smooth process for applicants or for the university community. It
would require more manual processing, and given the likelihood of high variability in
exceptions made admitting students on a case-by-case basis, it would be difficult to track
or assess the real impacts of the new requirements.
Quantitative Requirements
Complications arising from the adoption of the Quantitative admissions criteria have not
been apparent. Some early issues arose regarding overlaps between material covered in
Math 100 and FAN 099, but these were quickly resolved.
Math 100 and FAN interaction
• FAN content addressed weaker background as defined by new requirements;
• Math 100 was originally designed for students with good grades in Math 11 but
who need to ramp-up to calculus and programs that require calculus at the Math
12 level (ApSci, some Sci, Bus. Admin, Physical Geog.);
• Math 100 was certified as Q, and in some respects was equivalent to FAIN, but
students needed FAN to register in this Q course. It would have been problematic
to remove the Q from this course due to college transfer admissions and the large
number of college courses that articulate to this course thereby providing a means
for students to meet the Q admissions criteria;
• Math 100 was better suited as a prerequisite course than FAN for students with
less than 70% in Math 12 (FAN required for above programs), and more than
70% in Math 11;
• Math 100 enrollments fell by about
50%
with FAN prereq. in place.
Mathematics was given permission to waive FAN to register some students directly into
Math 100 provided they had appropriate grades in Math 11. This was communicated to
the Registrar's Office, advisors, and those departments directly impacted. Enrollments in
Math 100 were subsequently reinstated close to expected levels, and students in Math 100
requiring FAN will be given the Q test as a final exam in Math 100 in order to meet FAN
equivalency.
0
• ?
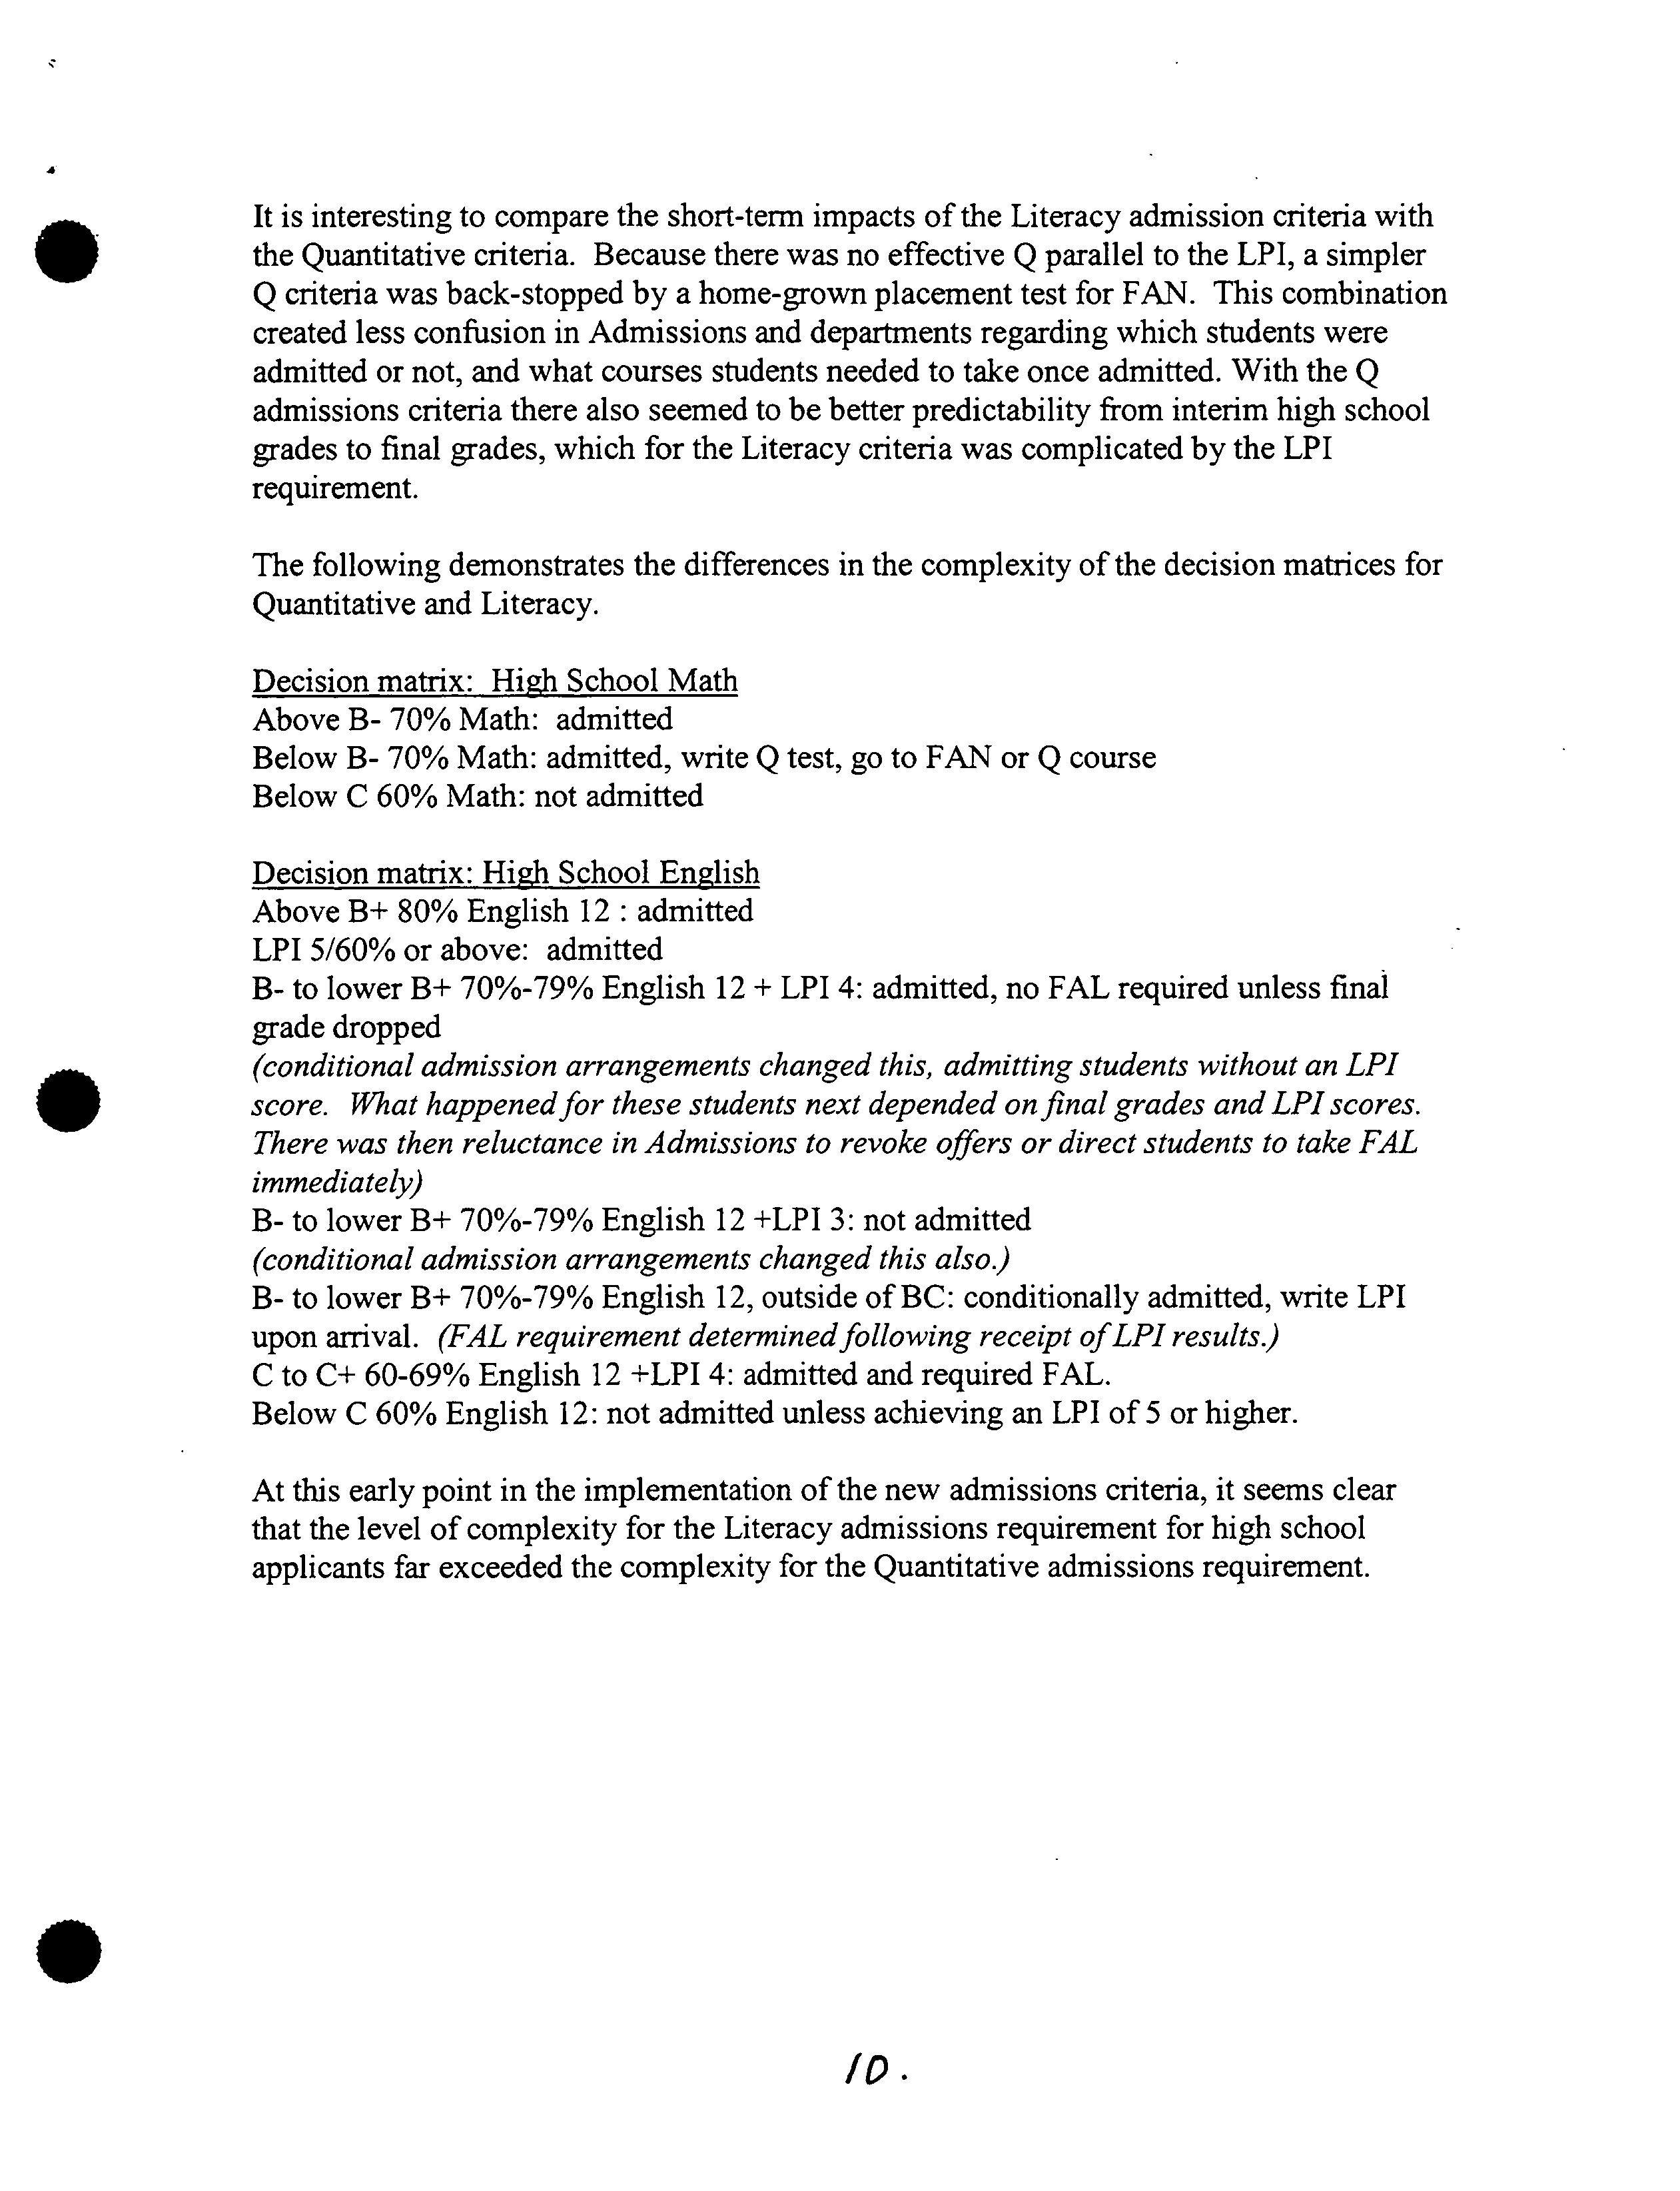
It is interesting to compare the short-term impacts of the Literacy admission criteria with
the Quantitative criteria. Because there was no effective Q parallel to the LPI, a simpler
Q criteria was back-stopped by a home-grown placement test for FAN. This combination
created less confusion in Admissions and departments regarding which students were
admitted or not, and what courses students needed to take once admitted. With the Q
admissions criteria there also seemed to be better predictability from interim high school
grades to final grades, which for the Literacy criteria was complicated by the LPI
requirement.
The following demonstrates the differences in the complexity of the decision matrices for
Quantitative and Literacy.
Decision matrix: Hig h School Math
Above B- 70% Math: admitted
Below B- 70% Math: admitted, write Q test, go to FAN or Q course
Below C 60% Math: not admitted
Decision matrix: Hi
g
h School English
Above B+ 80% English 12: admitted
LPI
5/60%
or above: admitted
B- to lower B+ 70%-79% English 12+ LPI 4: admitted, no FAL required unless final
grade dropped
• ?
(conditional admission arrangements changed this, admitting students without an LPI
score. What happened for these students next depended on final grades and LPI scores.
There was then reluctance in Admissions to revoke offers or direct students to take FAL
immediately)
B- to lower B+ 70%-79% English 12 +LPI 3: not admitted
(conditional admission arrangements changed this also.)
B- to lower B+ 70%-79% English 12, outside of BC: conditionally admitted, write LPI
upon arrival. (FAL requirement determined following receipt of LPJ results)
C to C+ 60-69% English 12 +LPI 4: admitted and required FAL.
Below C 60% English 12: not admitted unless achieving an LPI of 5 or higher.
At this early point in the implementation of the new admissions criteria, it seems clear
that the level of complexity for the Literacy admissions requirement for high school
applicants far exceeded the complexity for the Quantitative admissions requirement.
ID.
The Efficacy of the LPI in predicting success in First Year
?
English at the University of British Columbia
?
June 23, 2005
Prepared by Sham Pendleton ?
and Walter Sudmant?
for the Faculty of Arts, UBC
.
1/.
702 student (16%)
4
168 (4 9 /6) below 65%
637(151/6)
students ?
T
L
0 ?
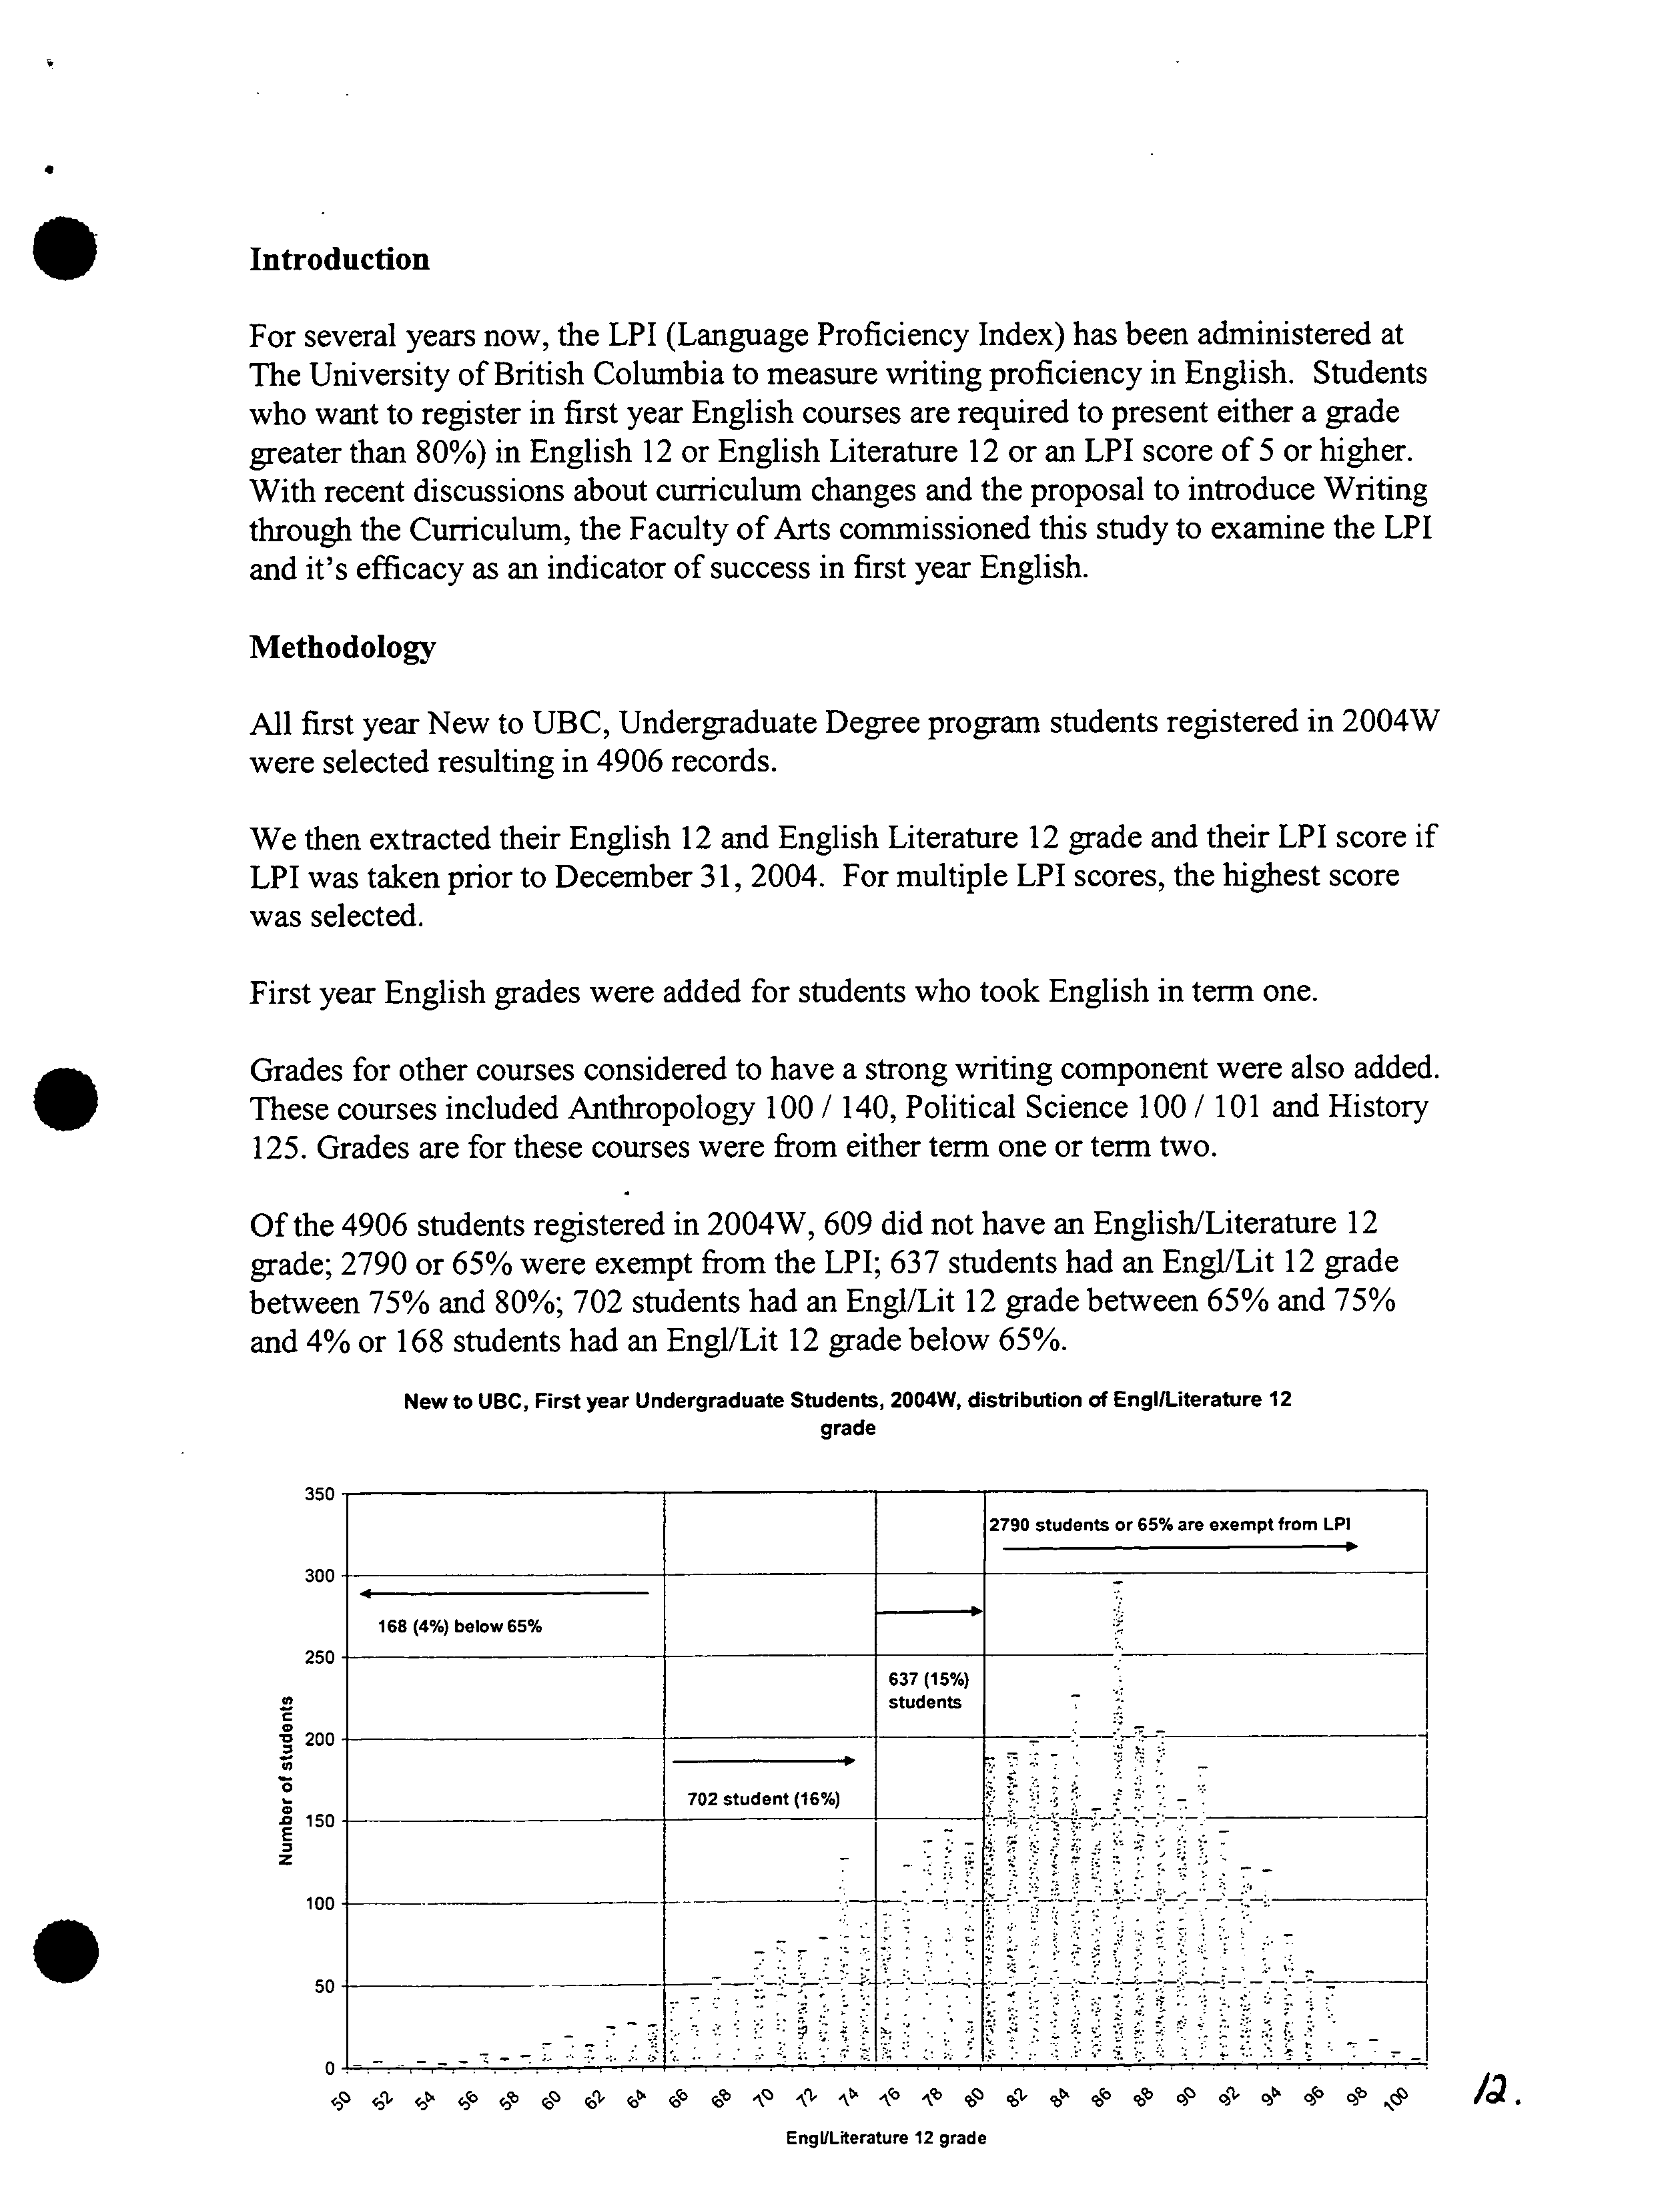
Introduction
For several years now, the LPI (Language Proficiency Index) has been administered at
The University of British Columbia to measure writing proficiency in English. Students
who want to register in first year English courses are required to present either a grade
greater than 80%) in English 12 or English Literature 12 or an LPI score of
5
or higher.
With recent discussions about curriculum changes and the proposal to introduce Writing
through the Curriculum, the Faculty of Arts commissioned this study to examine the LPI
and it's efficacy as an indicator of success in first year English.
Methodology
All first year New to UBC, Undergraduate Degree program students registered in 2004W
were selected resulting in 4906 records.
We then extracted their English 12 and English Literature 12 grade and their LPI score if
LPI was taken prior to December 31, 2004. For multiple LPI scores, the highest score
was selected.
First year English grades were added for students who took English in term one.
• Grades for other courses considered to have a strong writing component were also added.
These courses included Anthropology 100 /140, Political Science 100 /101 and History
125. Grades are for these courses were from either term one or term two.
Of the 4906 students registered in 2004W, 609 did not have an English/Literature 12
grade; 2790 or
65%
were exempt from the LPI; 637 students had an EngllLit 12 grade
between
75%
and 80%; 702 students had an Engl/Lit 12 grade between
65%
and
75%
and 4% or 168 students had an Engi/Lit 12 grade below
65%.
New to UBC, First year Undergraduate Students, 2004W, distribution of EngI/Literature 12
?
grade
350
students or 65% are exempt from LPI
300
250
0
200
1
100
.
?
50
0
EngllLiterature 12 grade
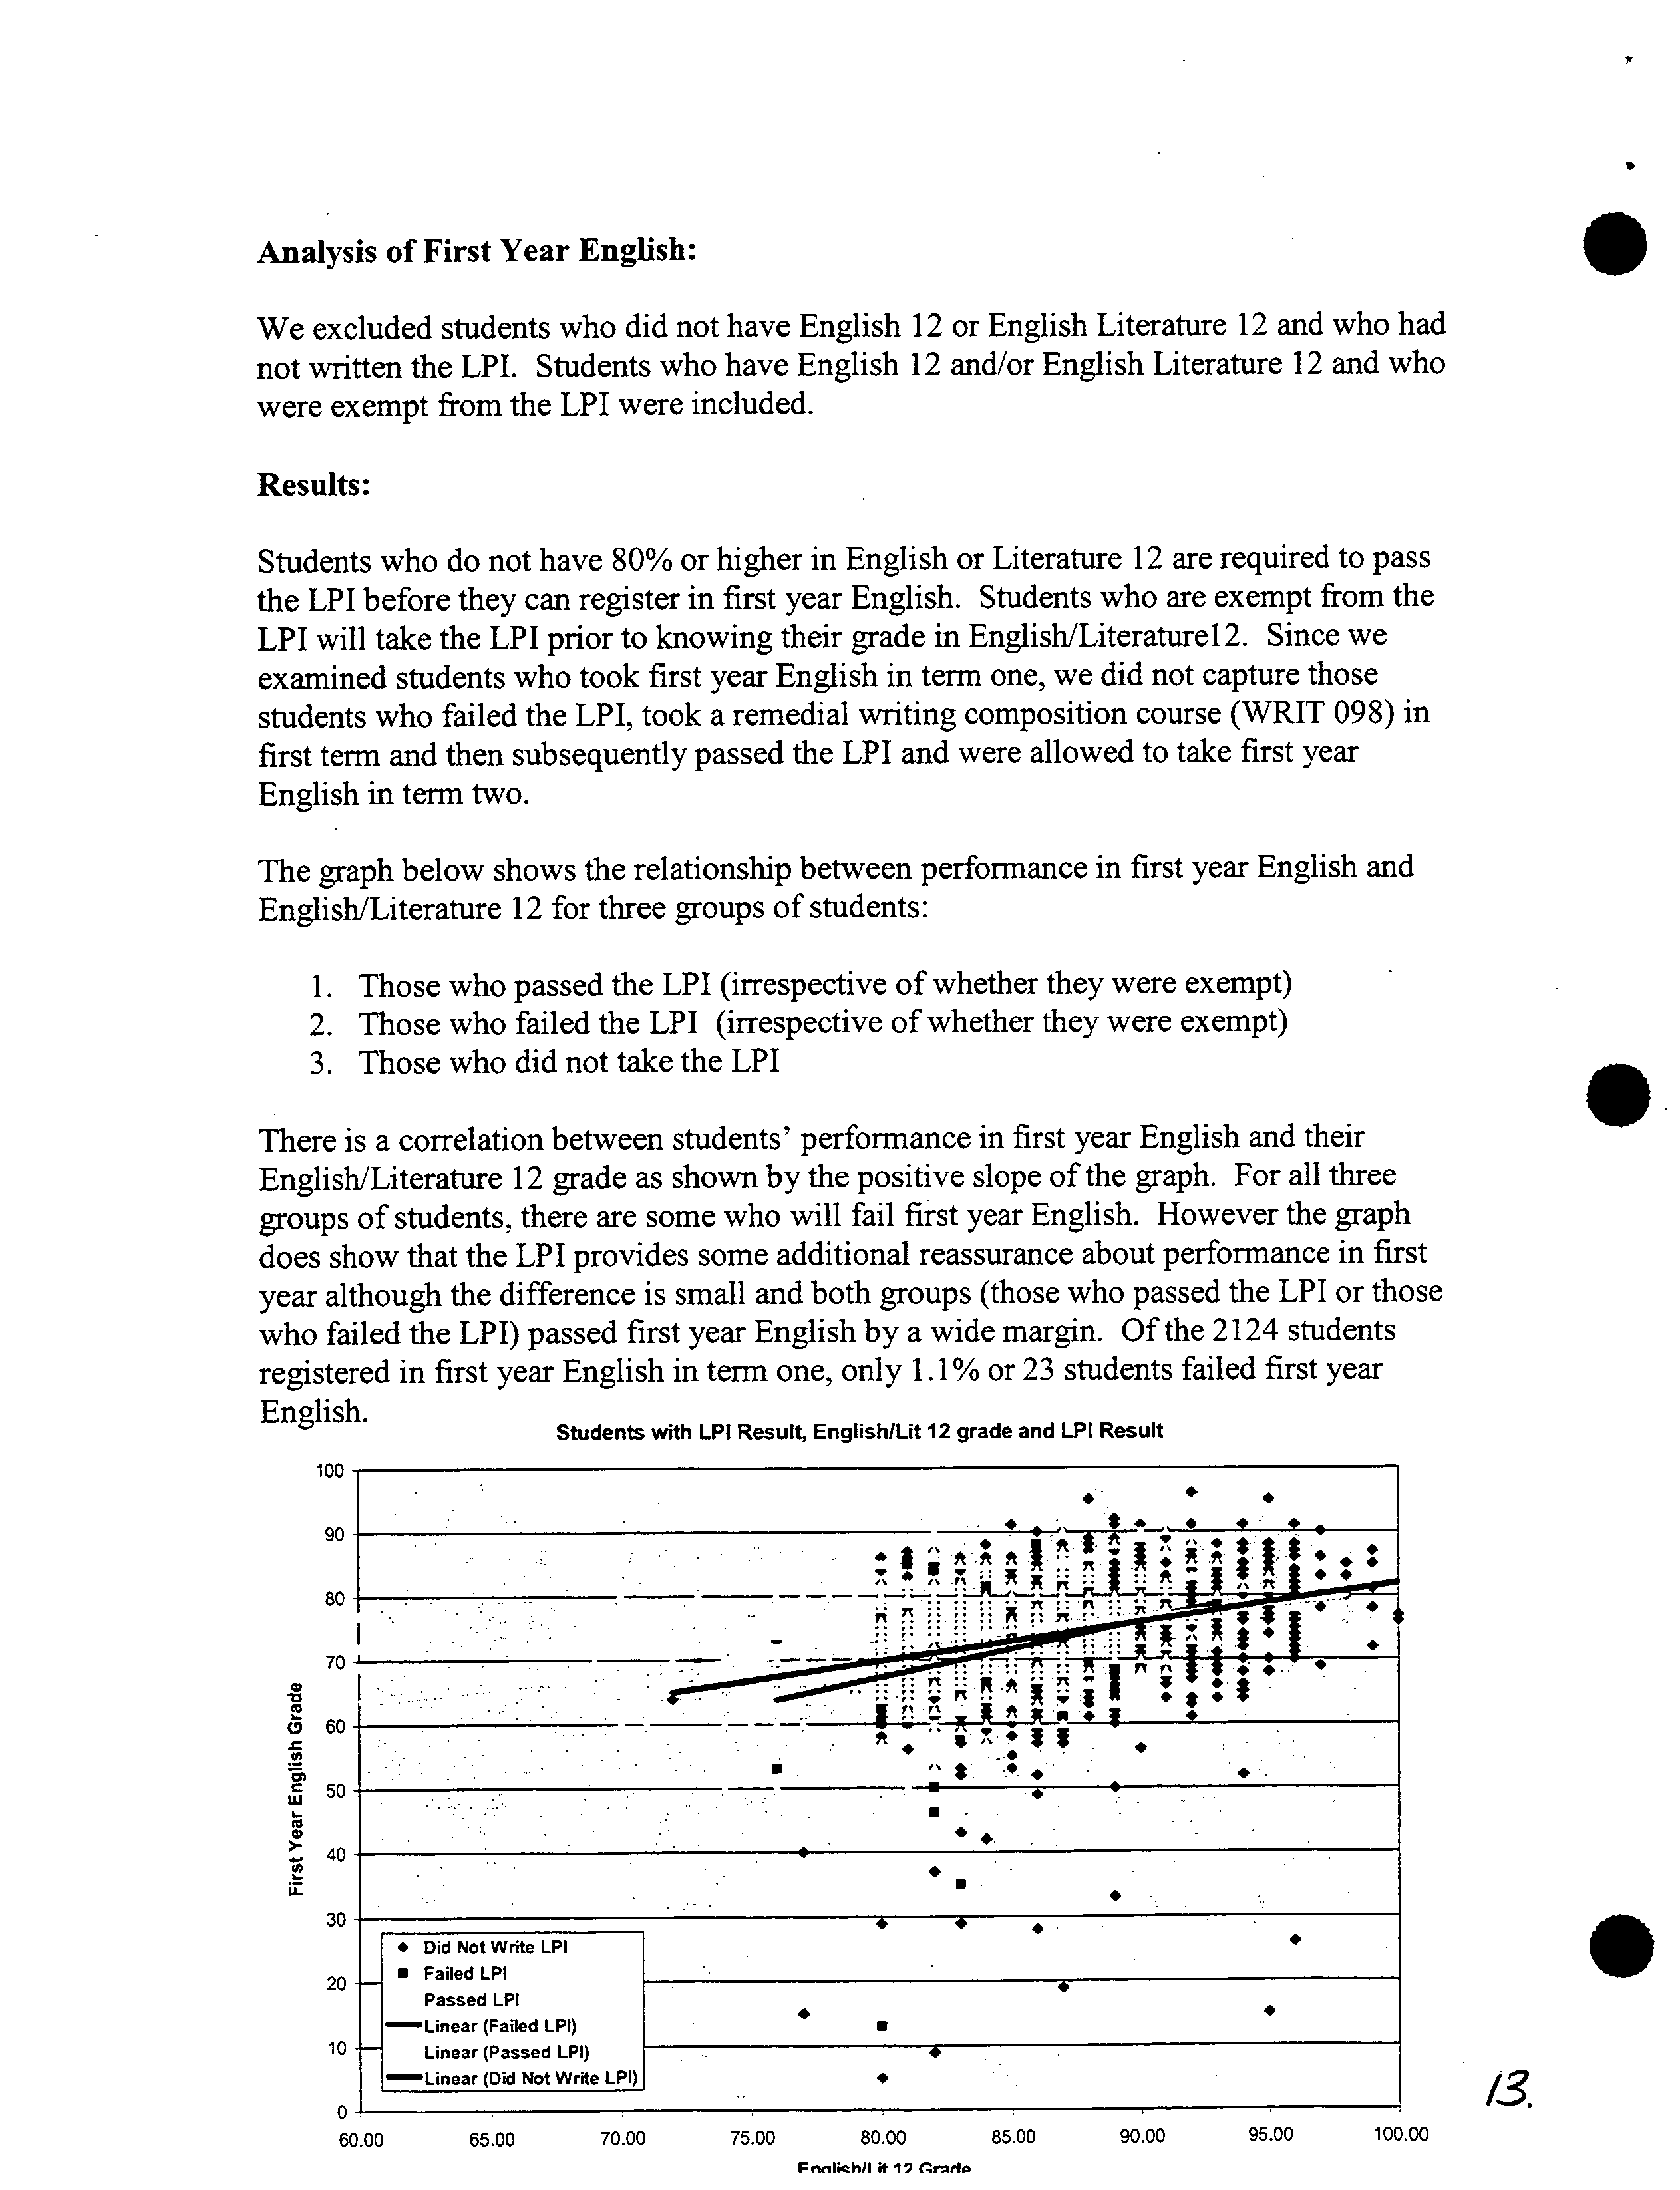
Analysis of First Year English:
We excluded students who did not have English 12 or English Literature 12 and who had
not written the LPI. Students who have English 12 and/or English Literature 12 and who
were exempt from the LPI were included.
Results:
Students who do not have 80% or higher in English or Literature 12 are required to pass
the LPI before they can register in first year English. Students who are exempt from the
LPI will take the LPI prior to knowing their grade in EnglishlLiteraturel2. Since we
examined students who took first year English in term one, we did not capture those
students who failed the LPI, took a remedial writing composition course (WRIT 098) in
first term and then subsequently passed the LPI and were allowed to take first year
English in term two.
The graph below shows the relationship between performance in first year English and
English/Literature 12 for three groups of students:
1.
Those who passed the LPI (irrespective of whether they were exempt)
2.
Those who failed the LPI (irrespective of whether they were exempt)
3.
Those who did not take the LPI
There is a correlation between students' performance in first year English and their
English/Literature 12 grade as shown by the positive slope of the graph. For all three
groups of students, there are some who will fail first year English. However the graph
does show that the LPI provides some additional reassurance about performance in first
year although the difference is small and both groups (those who passed the LPI or those
who failed the LPI) passed first year English by a wide margin. Of the 2124 students
registered in first year English in term one, only 1.1% or 23 students failed first year
English.
Students with LPI Result, English/Lit 12 grade and LPI Result
JLj'.
•_._,
I
?
?
$e_
I ?
-'
• ?
•
1 7 , ?
•.
• :
______________-
- -
____________________ ______ - -
• ?
-
______I___i_.l_!_
'$ ?
•. ?
?
•
I ?
•
•
S
_________________
- ?
•
•
•.
•
•
•
LPI
(Did
NIWIJT
InIr
65.00 ?
70.00 ?
75.00 ?
80.00 ?
85.00 ?
90.00 ?
95.00 ?
100.00
FnntiohII if
1
(ro,Io
.
.
.
/3.
100
90
80
70
0
0
60
U)
50
U)
0
40
U)
U.
30
20
10
0
60.00
Type Ill Sum of
Mean
Source
Squares
df Square
F ?
Sig
Corrected
Model
16562.4
2
8281.199 128.0436
Intercept
3940.874
1
3940.874 60.93365
finaleng
13189.2
1
13189.2
203.931
LPIENGL
1201.526
1
1201.526
18.57796
Error
137110.7 2120
64.67484
Total
11645814
2123
Corrected
Total
153673.1
2122
a
R Squared = .108 (Adjusted R Squared ?
.107)
Partial Eta
Squared
0.00
0.11
0.00
0.03
0.00
0.09
0.00
0.01
0
S
Students who have taken English or Literature 12 with LPI scores
Exempt
Failed L
Passed L
English/Lit 12
Count
2804
580
685
Mean
87
70
Minimum
60
50
60
Maximum
100
79
79
Median
86
71
76
**Passing the LPI
is consistent with a higher English or Literature 12 grade
Is the data statistically
significant?
We examined students who were registered in first
year English and their LPJ score and found that the
LPI has a statistically significant effect on
first year English grades but the effect size is only 1/10th that of English/Literature 12. Hence the
predictive power of the LPI is relatively small, but is statistically significant.
Tests of Between-Subjects Effects
Dependent Variable: First year English grade
Controlling for English/Literature 12 (i.e. for the same grade in English/Literature 12) a failure in
LPI results in a first year English grade which is lower on average by -2.9 points.
Parameter Estimates
Dependent Variable: First year English Grade
Std. ? 95% Confidence ?
Partial Eta
Parameter
?
B ?
Error
?
t ?
Sig. ?
Interval ?
Squared
Lower
Bound
Upper Bound
21.03
33.09 ?
0.04
0.50
0.66 ?
0.09
(4.28)
(1.60) ?
0.01
.
Intercept
finaleng
[LPIENGLExempt
[LPIENGLPassed LPI
a
27.06
3.07
8.80
0.00
0.58
0.04
14.28
0.00
(2.94)
0.68
(4.31)
0.00
0. ?
. ?
.
This parameter is set to zero because it is redundant.
/171.
C
Performance in non English courses.
?
0
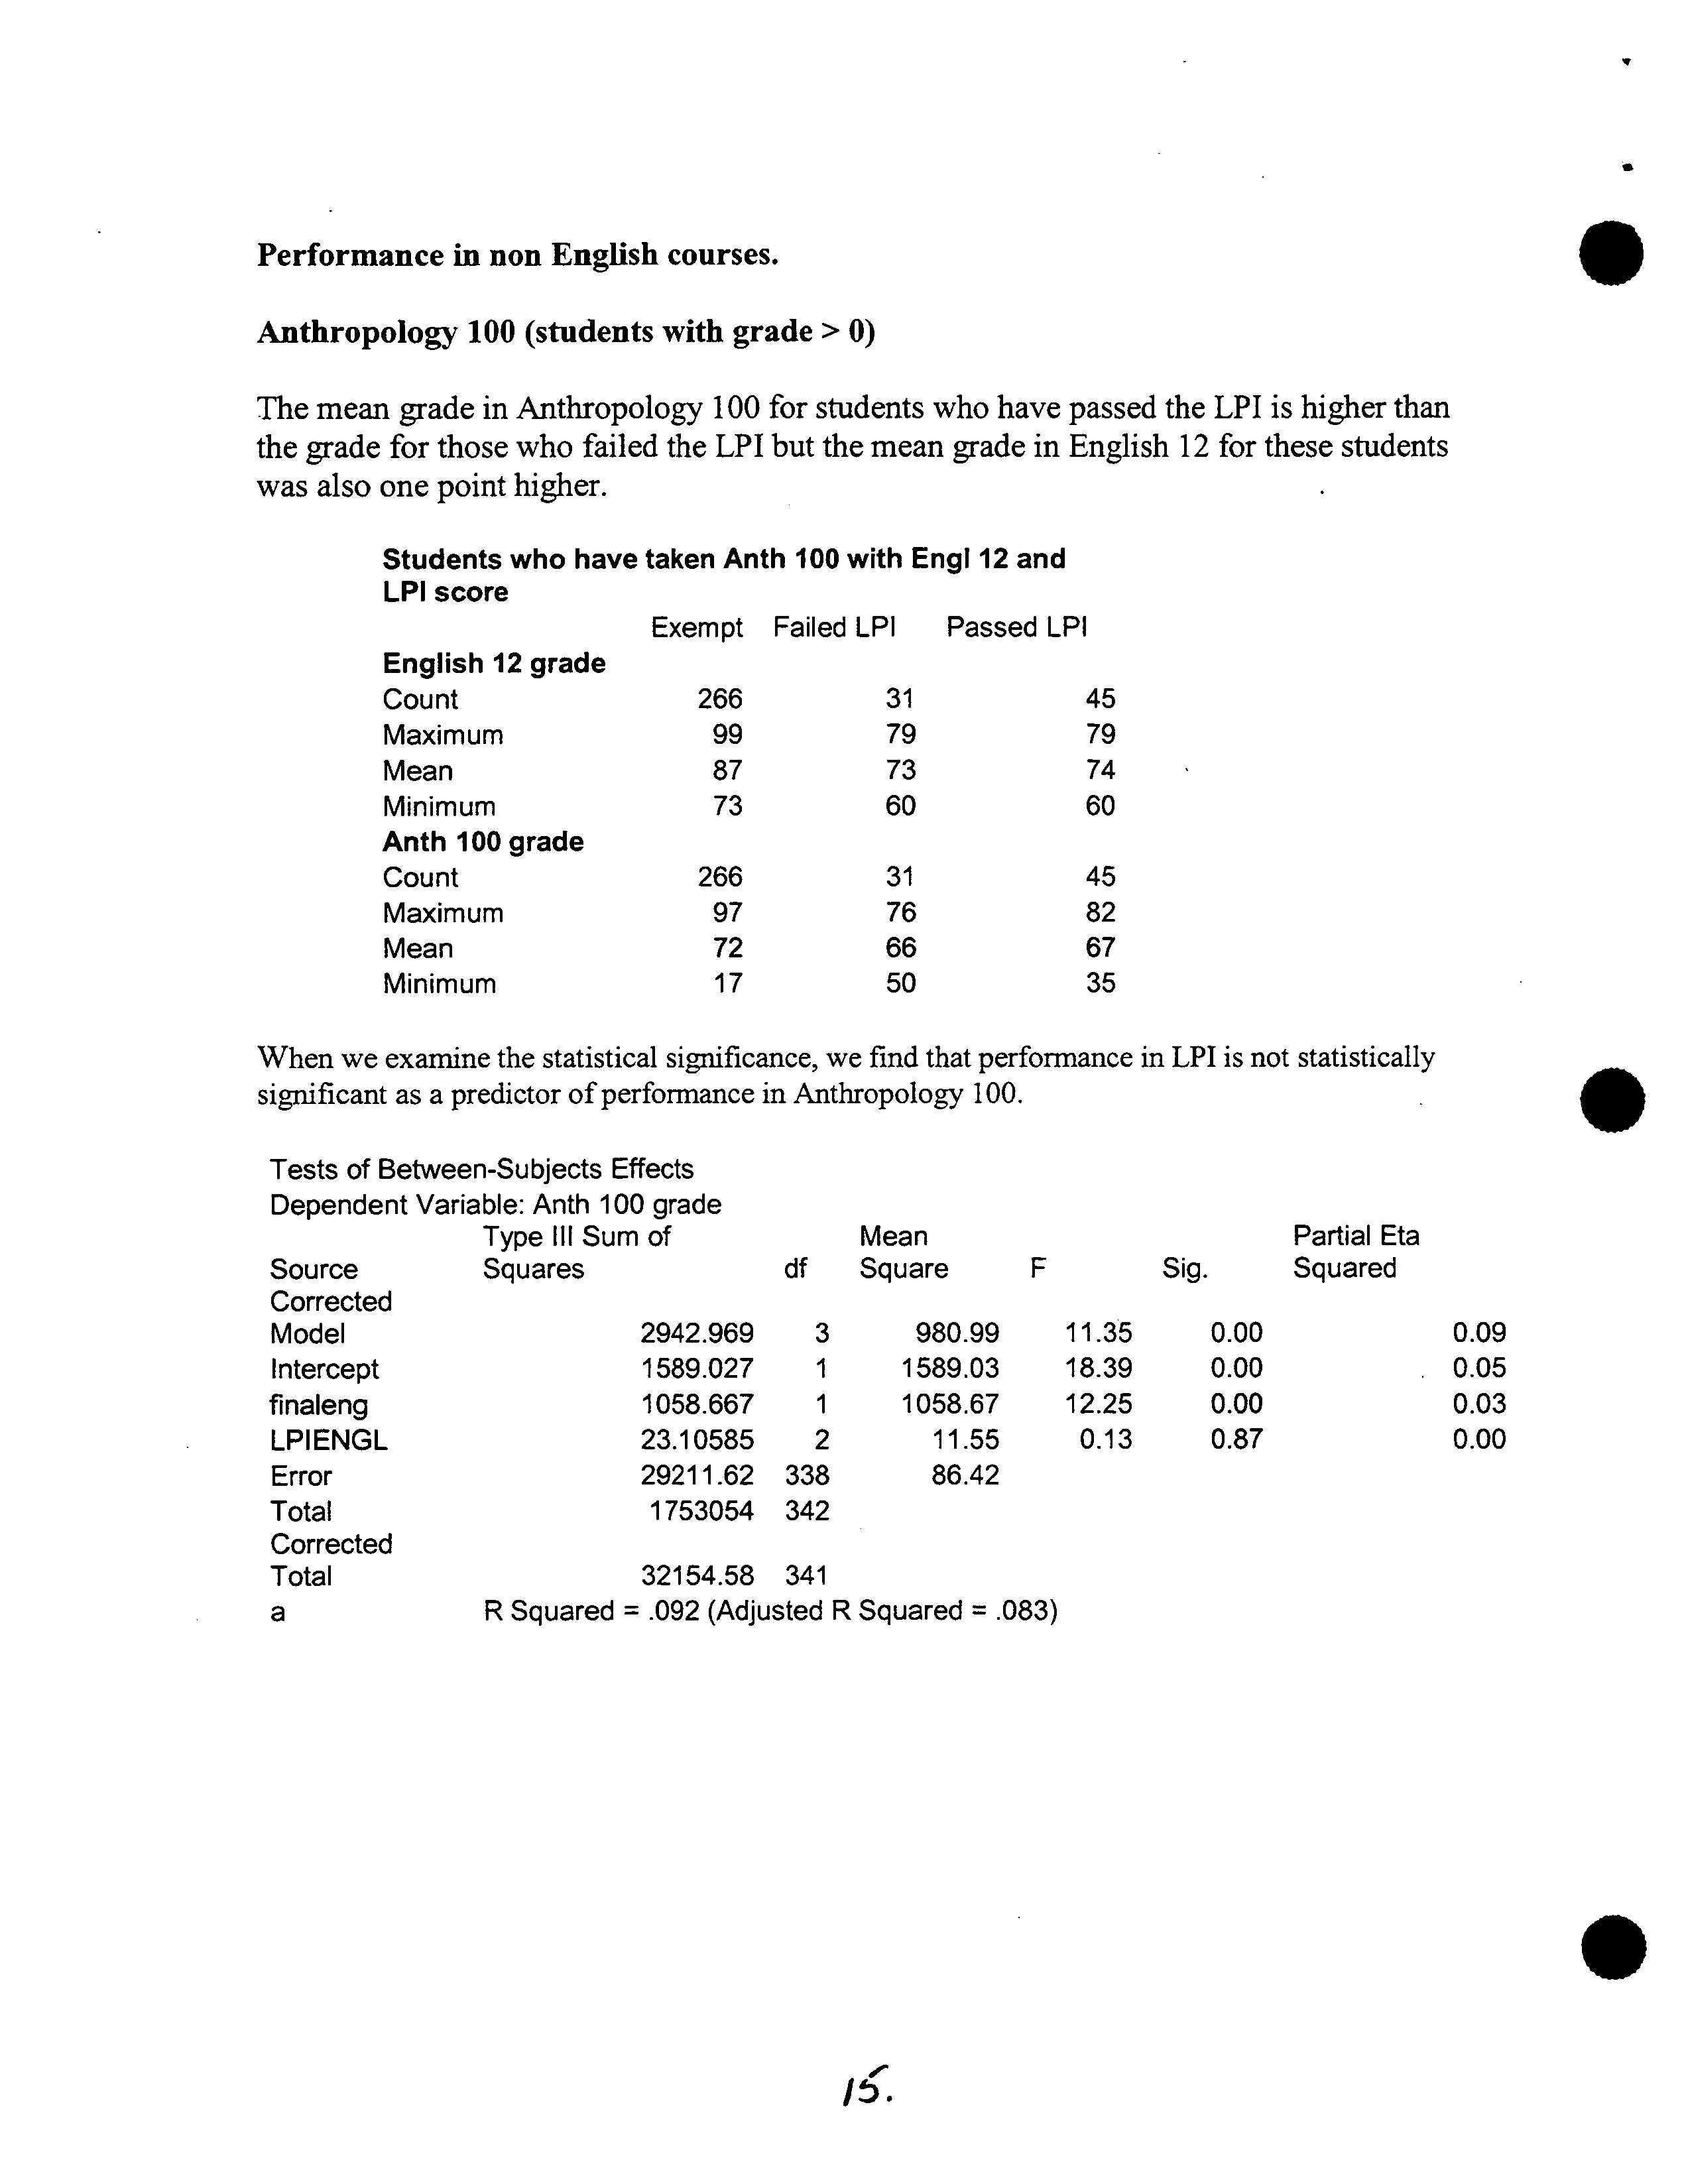
Anthropology 100 (students with grade > 0)
The mean grade in Anthropology 100 for students who have passed the LPI is higher than
the grade for those who failed the LPI but the mean grade in English 12 for these students
was also one point higher.
Students who have taken Anth 100 with EngI 12 and
LPI score
Exempt Failed LPI ?
Passed LPI
English 12 grade
Count ? 266 ?
31
45
Maximum ?
99 ?
79
79
Mean
?
87 ?
73
74
Minimum ? 73 ?
60
60
Anth 100 grade
Count ?
266 ?
31
45
Maximum ?
97 ?
76
82
Mean ?
72 ?
66
67
Minimum ?
17 ?
50
35
When we examine the statistical significance, we find that performance in LPI is not statistically
significant as a predictor of performance in Anthropology 100.
Tests of Between-Subjects Effects
Dependent Variable: Anth 100 grade
Type Ill Sum of
Mean
Partial Eta
Source
Squares
df Square ?
F
Sig. ?
Squared
Corrected
Model
2942.969
3
980.99
11.35
0.00
0.09
Intercept
1589.027
1
1589.03
18.39
0.00
0.05
finaleng
1058.667
1
1058.67
12.25
0.00
0.03
LPIENGL
23.10585
2
11.55
0.13
0.87
0.00
Error
29211.62
338
86.42
Total
1753054 342
Corrected
Total
32154.58 341
a
R Squared = .092 (Adjusted
R Squared = .083)
.
If,.
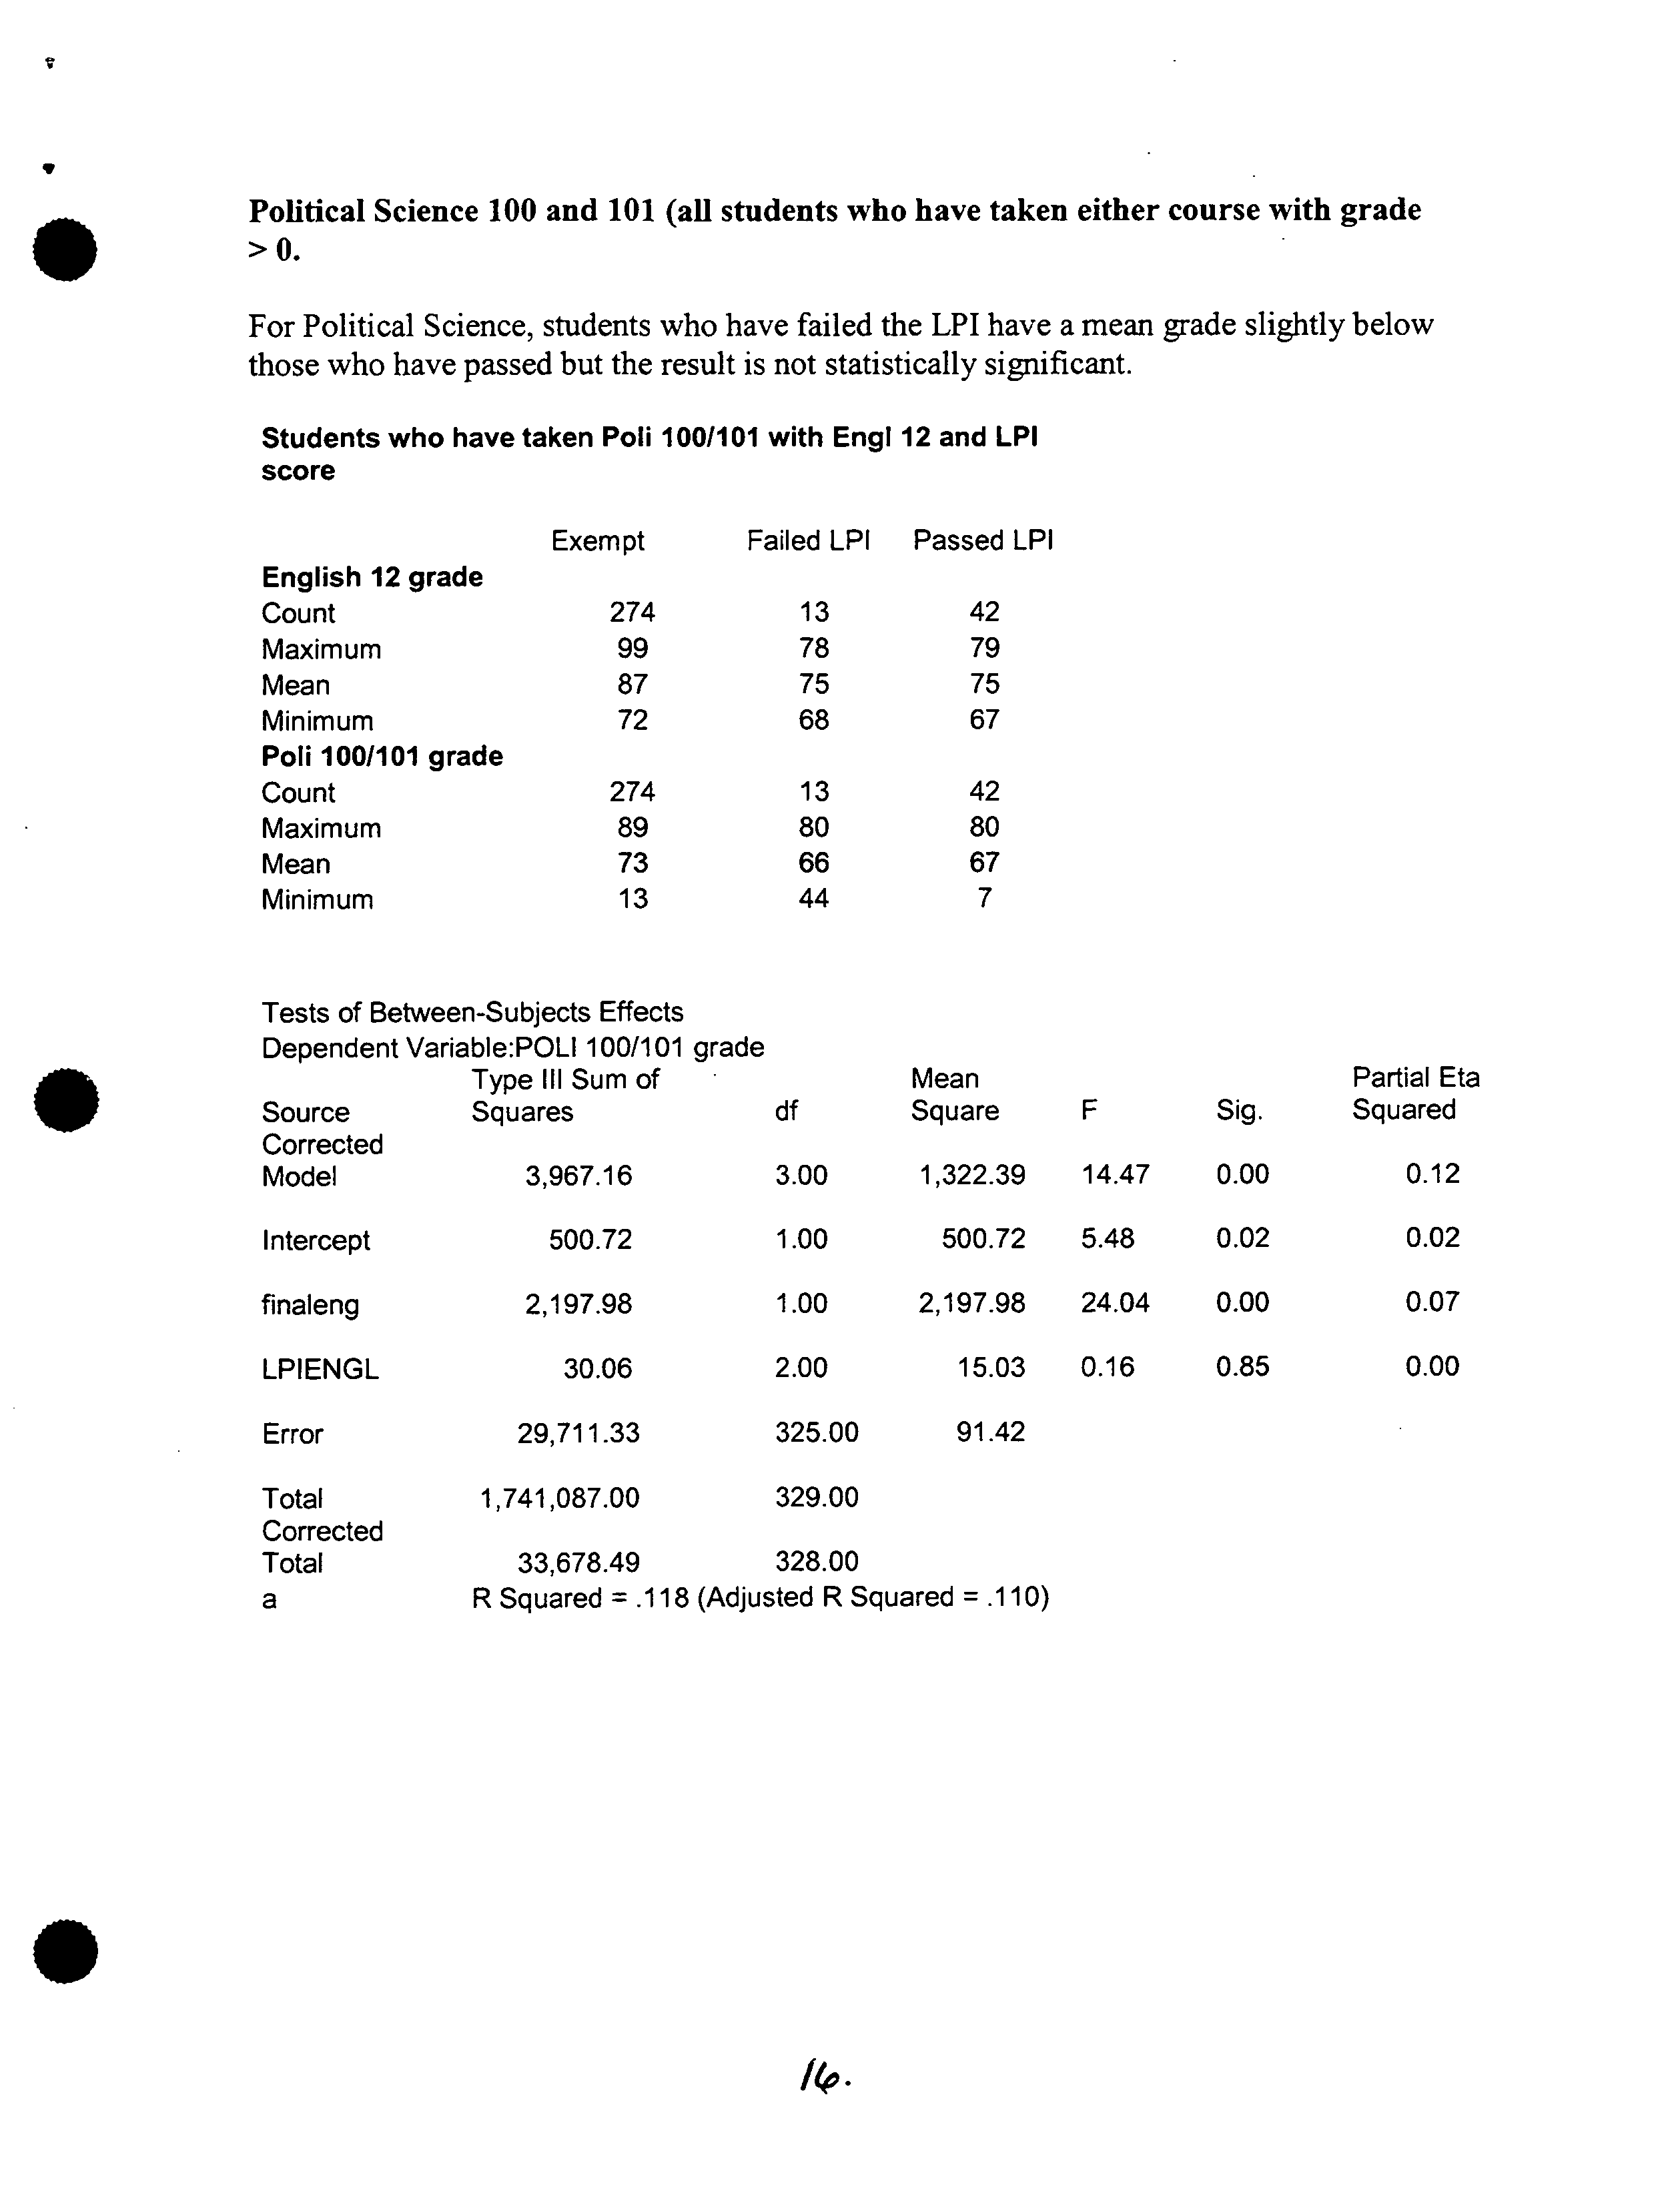
Political Science 100 and 101 (all students who have taken either course with grade
•
>0.
For Political Science, students who have failed the LPI have a mean grade slightly
below
those who have passed but the result is not statistically significant.
Students who have taken Poli 100/101 with EngI 12 and LPI
score
Exempt ?
Failed LPI ?
Passed LPI
English 12 grade
Count ?
274 ?
13 ?
42
Maximum ?
99 ?
78 ?
79
Mean
?
87 ?
75 ?
75
Minimum ?
72 ?
68 ?
67
Poli 100/101 grade
Count ?
274 ?
13 ?
42
•
Maximum ?
89 ?
80 ?
80
Mean ?
73
?
66
?
67
Minimum ?
13 ?
44 ?
7
Tests of Between-Subjects Effects
Dependent Variable:POLI 100/101 grade
Type Ill Sum of ?
Mean
Partial Eta
.
Source
?
Squares
?
df ?
Square ?
F
?
Sig.
Squared
Corrected
Model
?
3,967.16 ?
3.00 ?
1,322.39 ?
14.47 ?
0.00
0.12
Intercept
?
500.72 ?
1.00 ?
500.72 ?
5.48 ?
0.02
0.02
finaleng ?
2,197.98 ?
1.00
?
2,197.98 ?
24.04 ?
0.00
0.07
LPIENGL ?
30.06 ?
2.00 ?
15.03 ?
0.16 ?
0.85
0.00
Error ?
29,711.33
?
325.00 ?
91.42
Total ?
1,741,087.00 ?
329.00
Corrected
Total ?
33,678.49 ?
328.00
a
?
R Squared = .118 (Adjusted R Squared =
.1 10)
•
/4'.
Partial Eta
F
Sig.
Squared
6.49
0.00
0.12
11.27
0.00
0.07
1.93
0.17
0.01
2.87
0.06
0.04
U
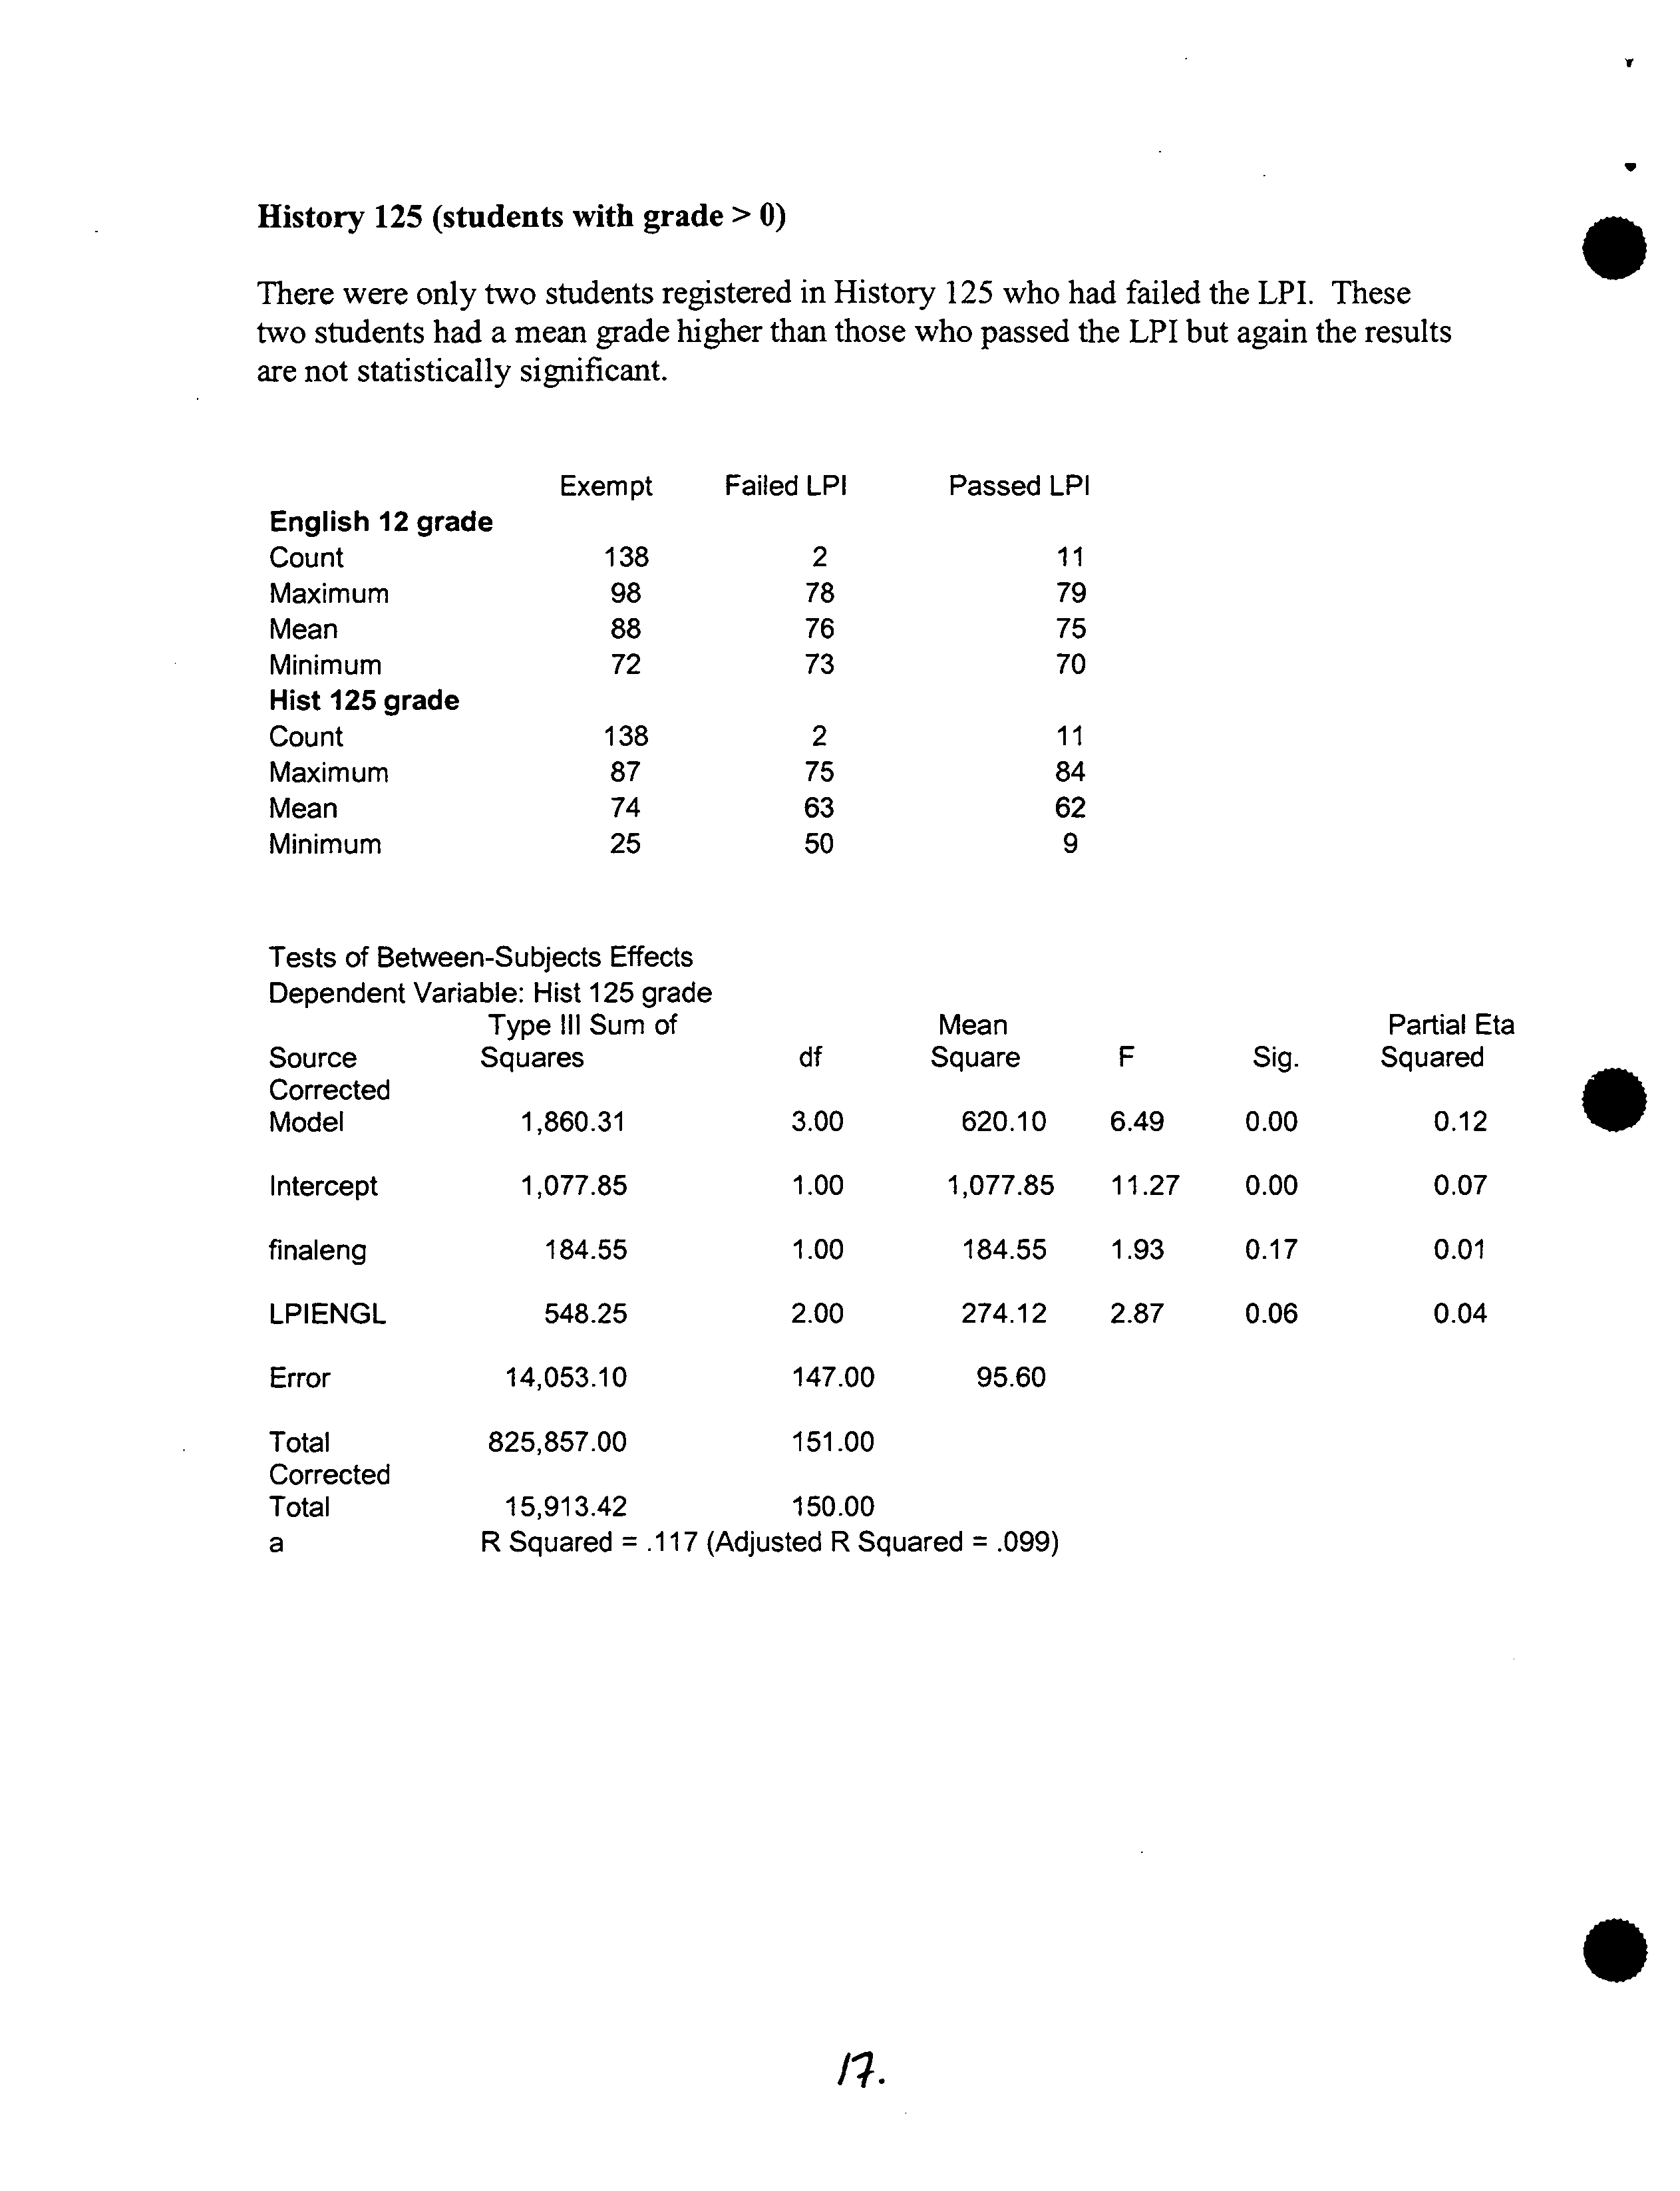
History 125 (students with grade> 0)
There were only two students registered in History 125 who had failed the LPI. These
two students had a mean grade higher than those who passed the LPI but again the results
are not statistically significant.
Exempt
Failed LPI
Passed LPI
English 12 grade
Count
138
2
11
Maximum
98
78
79
Mean
88
76
75
Minimum
72
73
70
Hist 125 grade
Count
138
2
11
Maximum
87
75
84
Mean
74
63
62
Minimum
25
50
9
Tests of Between-Subjects Effects
Dependent Variable: Hist 125 grade
Type Ill Sum of
Mean
Source
Squares
df
Square
Corrected
Model
1,860.31
3.00
620.10
Intercept
1,077.85
1.00
1,077.85
finaleng
184.55
1.00
184.55
LPIENGL
548.25
2.00
274.12
Error
14,053.10
147.00
95.60
Total
825,857.00
151.00
Corrected
Total
15,913.42
150.00
a
R Squared ?
.117 (Adjusted R Squared = .099)
S
S
/1.
0 ?
Conclusion:
The predictive power of the LPI in determining writing proficiency is weak given that
performance in first year is correlated with students' grades in English 12 or English
Literature 12. Failure on the LPI is related to a small decrease in first year English
performance but not related at all to performance in any of the other courses which
require writing. While the LPI does provide some additional reassurance about
performance in first year English, it should be noted that most students seem to pass first
year English at UBC.
For the bulk of UBC's first year students, the LPI requirement is arduous, requires testing
at a separate agency and does not provide much additional information beyond the
English 12 or English Literature 12 grade. The high schools in B.C. seem to be doing a
good job in grading for writing ability and final grades in English 12 or English
Literature 12 should provide sufficient reassurance to the University of writing
proficiency in English.
Furthermore, administering the LPI is labour intensive for the First Year English office,
results are often not available until late August and placement in first year English which
is a requirement for most students is not determined until September causing anxiety
among students. Interim English 12 or English Literature 12 grades are available as early
. ?
as January and final grades are available in July for B.C. High School students. Course
planning and placement for first year English can be accomplished well in advance of
course start dates.
The data would suggest that a grade of 75% in English/Literature 12 is sufficient for
determining success in first year writing intensive courses as well as in first year English.
Students below
65%
in English 12 or its equivalent would appear to lack the English
language skills necessary to succeed at UBC and should not even be admitted to the
University. Those between
65%
and
75%
may require remediation byway of a writing
intensive course (Writing 098/099 or alternative) prior to being allowed to register in first
year English.
Further investigation will be required to determine what the role of the LPI should be for
international students or for those who do not present an equivalent grade for
English/Literature 12. There are 609 students in this category. The TOEFL may provide
sufficient data and should be examined for its reliability as a predictor for success at
UBC.
.
/1.
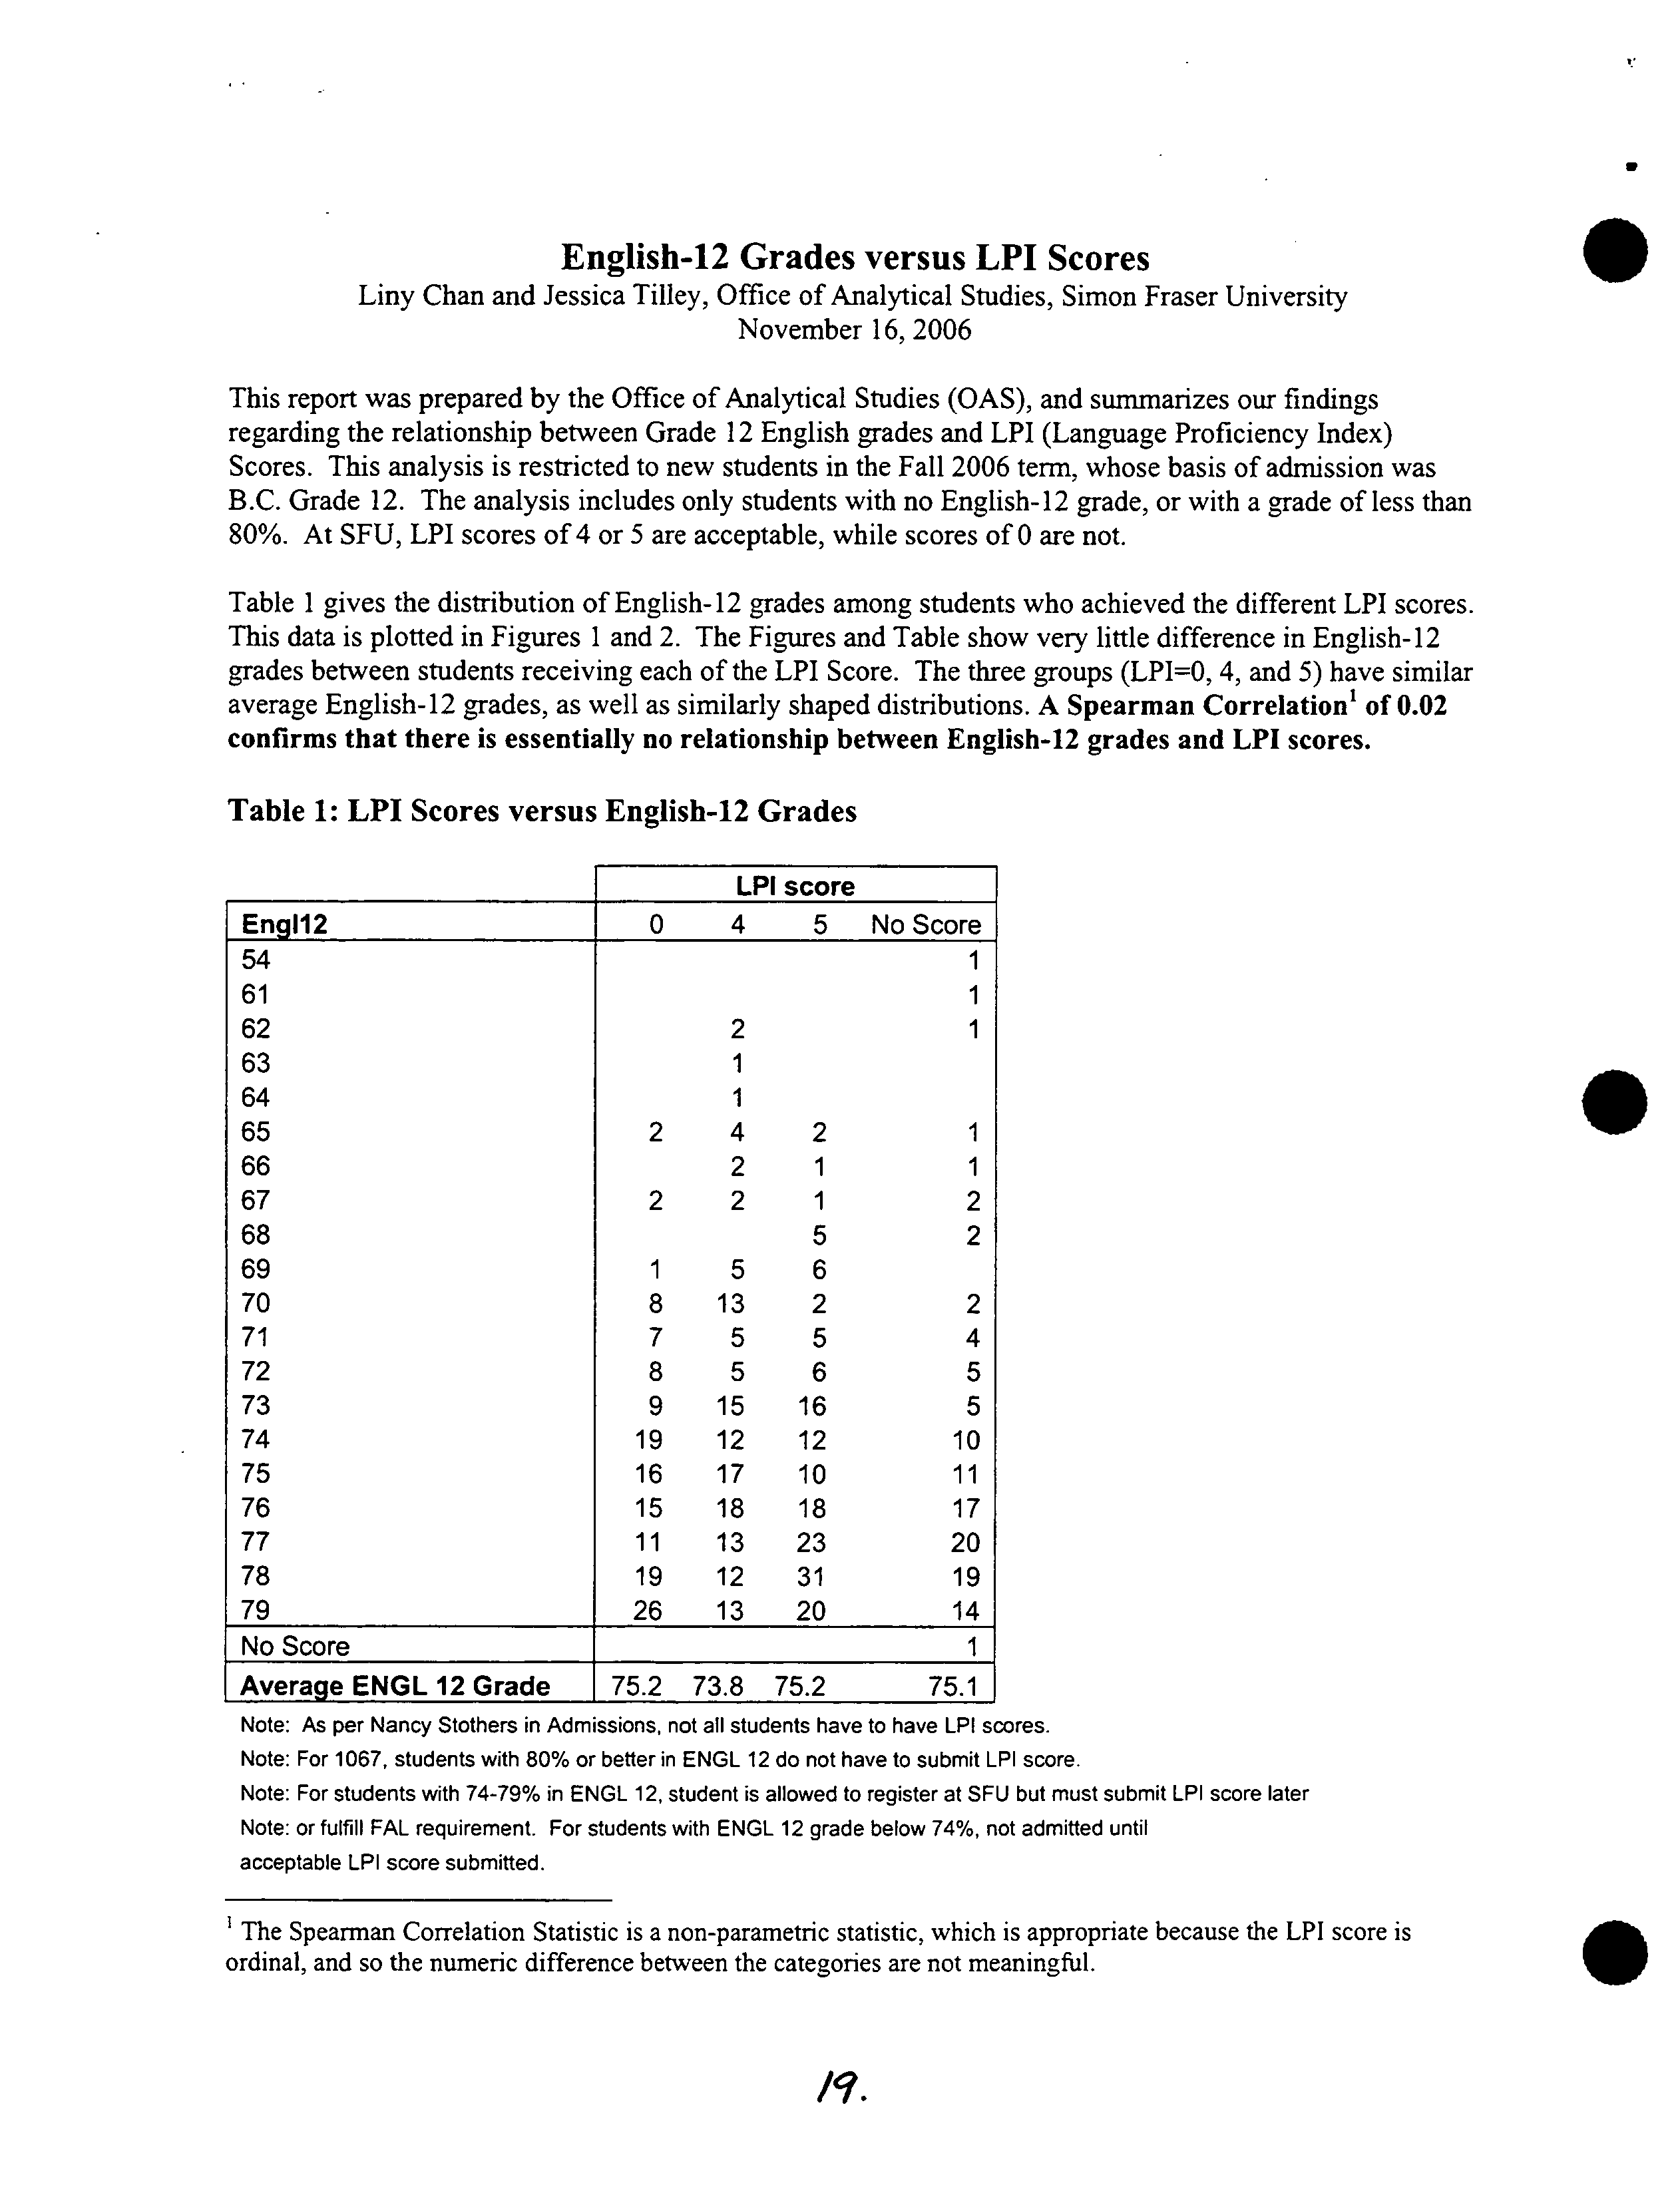
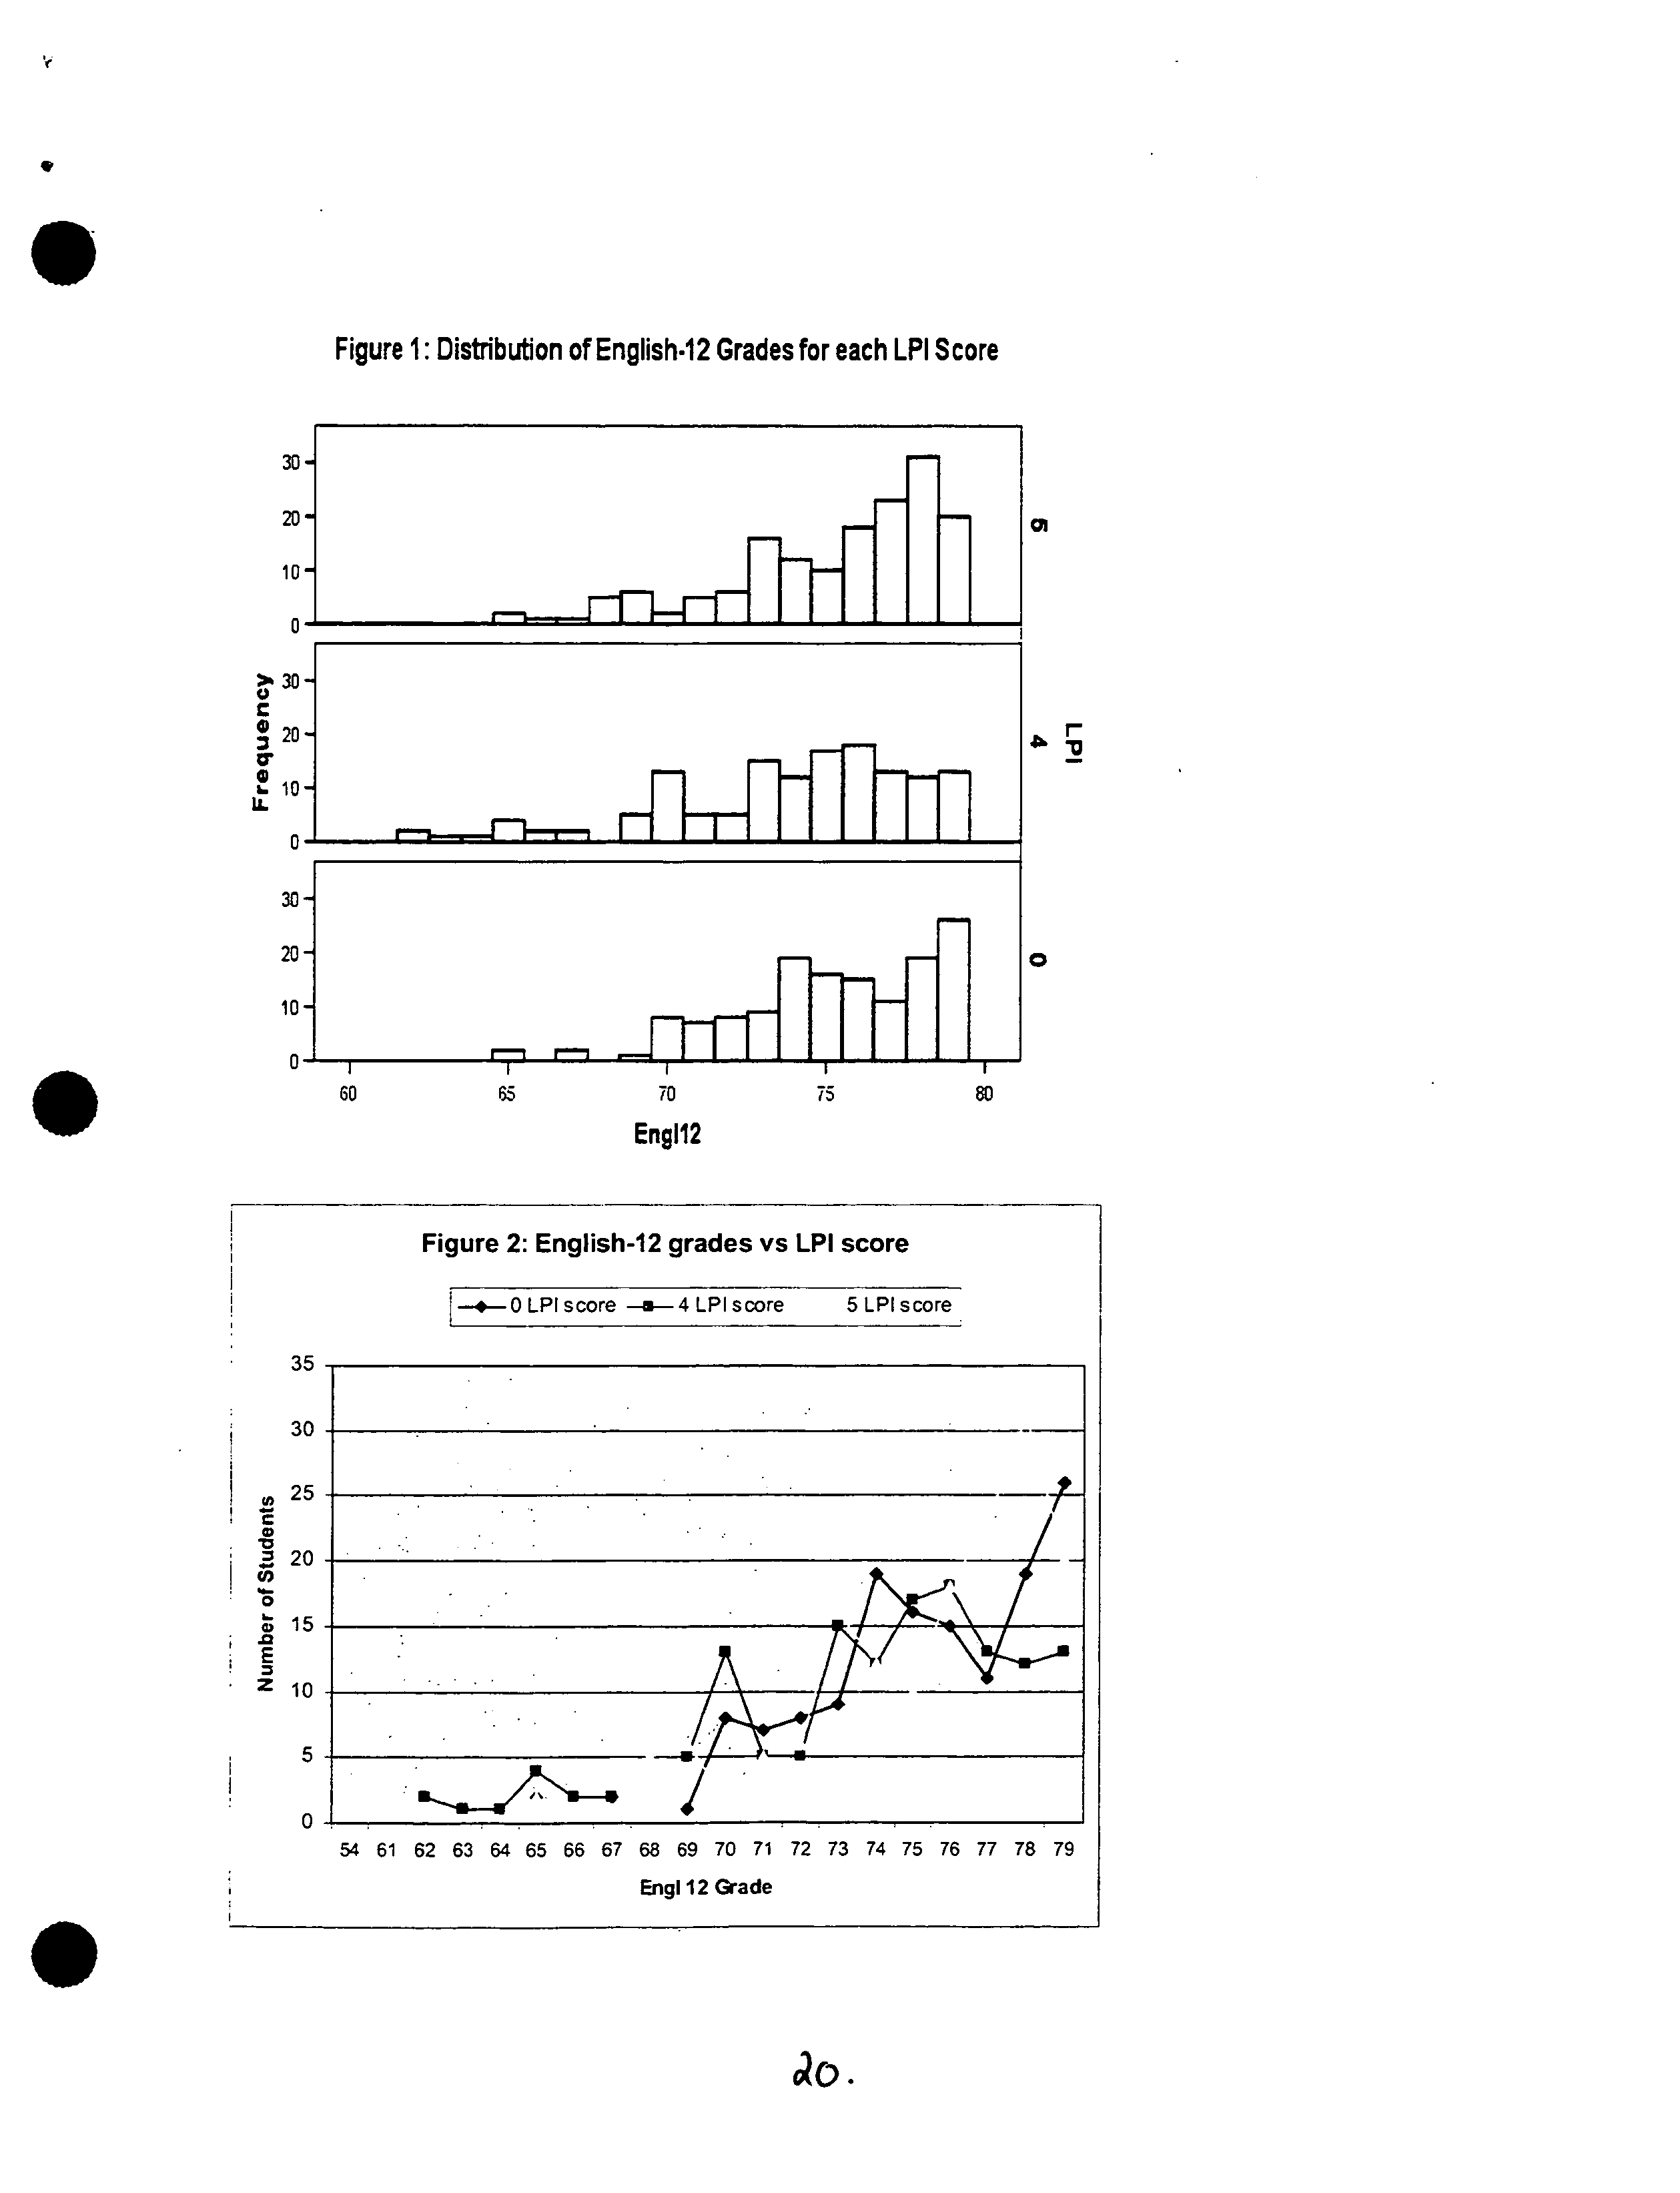
English-12 Grades versus LPI Scores
Liny Chan and Jessica Tilley, Office of Analytical Studies, Simon Fraser University
?
November 16, 2006
This report was prepared by the Office of Analytical Studies (OAS), and summarizes our findings
regarding the relationship between Grade 12 English grades and LPI (Language Proficiency Index)
Scores. This analysis is restricted to new students in the Fall 2006 term, whose basis of admission was
B.C. Grade 12. The analysis includes only students with no English-12 grade, or with a grade of less than
80%. At SFU, LPI scores of 4 or
5
are acceptable, while scores of 0 are not.
Table 1 gives the distribution of English-12 grades among students who achieved the different LPI scores.
This data is plotted in Figures 1 and 2. The Figures and Table show very little difference in English-12
grades between students receiving each of the LPI Score. The three groups (LPI=0, 4, and
5)
have similar
average English-12 grades, as well as similarly shaped distributions.
A Spearman Correlation' of 0.02
confirms that there is essentially no relationship between English-12 grades and LPI scores.
Table 1: LPI Scores versus English-12 Grades
LPI score
EngI12
0
4 ?
5
No
Score
54
1
61
1
62
2
1
63
1
64
1
65
2 4 ?
2
1
66
2 ?
1
1
67
2 2 ?
1
2
68
5
2
69
1
5
?
6
70
8
13
?
2
2
71
7
5 ?
5
4
72
8 5 ?
6
5
73
9
15 ?
16
5
74
19 12
?
12
10
75
16 17
?
10
11
76
15
18 ?
18
17
77
11
13 ?
23
20
78
19 12
?
31
19
79
26 13
?
20
14
No
Score
1
Average ENGL 12 Grade
75.2
73.8
?
75.2
75.1
Note: As per Nancy Stothers in Admissions, not all students have to have LPI scores.
Note: For 1067, students with 80% or better in ENGL 12 do not have to submit LPI score.
Note: For students with 74-79% in ENGL 12, student is allowed to register at SFU but must submit LPI score later
Note: or fulfill FAL requirement. For students with ENGL 12 grade below 74%, not admitted until
acceptable LPI score submitted.
.
The Spearman Correlation Statistic is a non-parametric statistic, which is appropriate because the LPI score is
ordinal, and so the numeric difference between the categories are not meaningful.
?
0
/9.
S
Figure 1: Distribution of English-12 Grades for each LPI Score
60 ?
65 ?
70 ?
75 ?
80
EngIl2 ?
Figure 2: English-12 grades vs LPI score
— ._
OLPI score --4LPIscore
?
5LPlscore
35
30 ?
S
?
--
25
?
5:
20
z 10
0S
J
54 61 62 63 64 65 66 67 68 69 70 71 72 73 74 75 76 77 78 79 ?
EngI12Grade
.1
30
20
10
0
30
C
20
C.
.
10
IL
0
30
20
10
0
.
al
r
0
'o.
Summary of English-12 Grade Study
Jessica Tilley, Office of Analytical Studies, Simon Fraser University
?
is
November 16, 2006
INTRODUCTION
This report summarizes the analyses undertaken thus far by the Office of Analytical Studies (OAS) in
support of the Senate Committee on Undergraduate Studies' (SCUS) recommendation to Senate to revise
the literacy requirements for admission to SFU. To that end, the OAS has examined the relationship
between Grade- 12 English grades and student performance at SFU.
METHODOLOGY
The dataset for the analysis consists of students admitted to SFU directly from a B. C. Secondary School
in the Fall terms of 2000 to
2005.
The students are followed up to the Summer 2006 term. The primary
group of interest is 2,201 students admitted to SFU with English-12 grades of 75-79%. The dataset also
includes a secondary group of 2,201 students with English-12 grades below
75%
(67-74%), and a control
group of 2,201 students with English-12 grades above 79% (8084%)1.
The following performance measures are included in the analysis:
• CGPAs at first term, 30-credits, 60-credits, and graduation
• Academic Standing: % OAP (On Academic Probation) and % RTW (Required To Withdraw)
within 2 years of admission to SFU
• 5-Year Graduation Rates
• 60-Credit Survival Rates
Average performance is compared across the three groups of students (based on English-12 grades). The
relationship between performance and English- 12 grades is also graphed, to determine whether a natural
cut-off presents itself. For each performance measure, a regression model is then fit, which controls for
the following baseline student characteristics: sex, entry Faculty, admission GPA, and average creditload.
Although there are 6603 students in the dataset, not all students are included in all analyses. For example,
the analyses of 60-credit GPA include only those students who have completed at least 60 credits at SFU,
and analyses of 5-year graduation rates are restricted to students admitted at least five years ago.
RESULTS
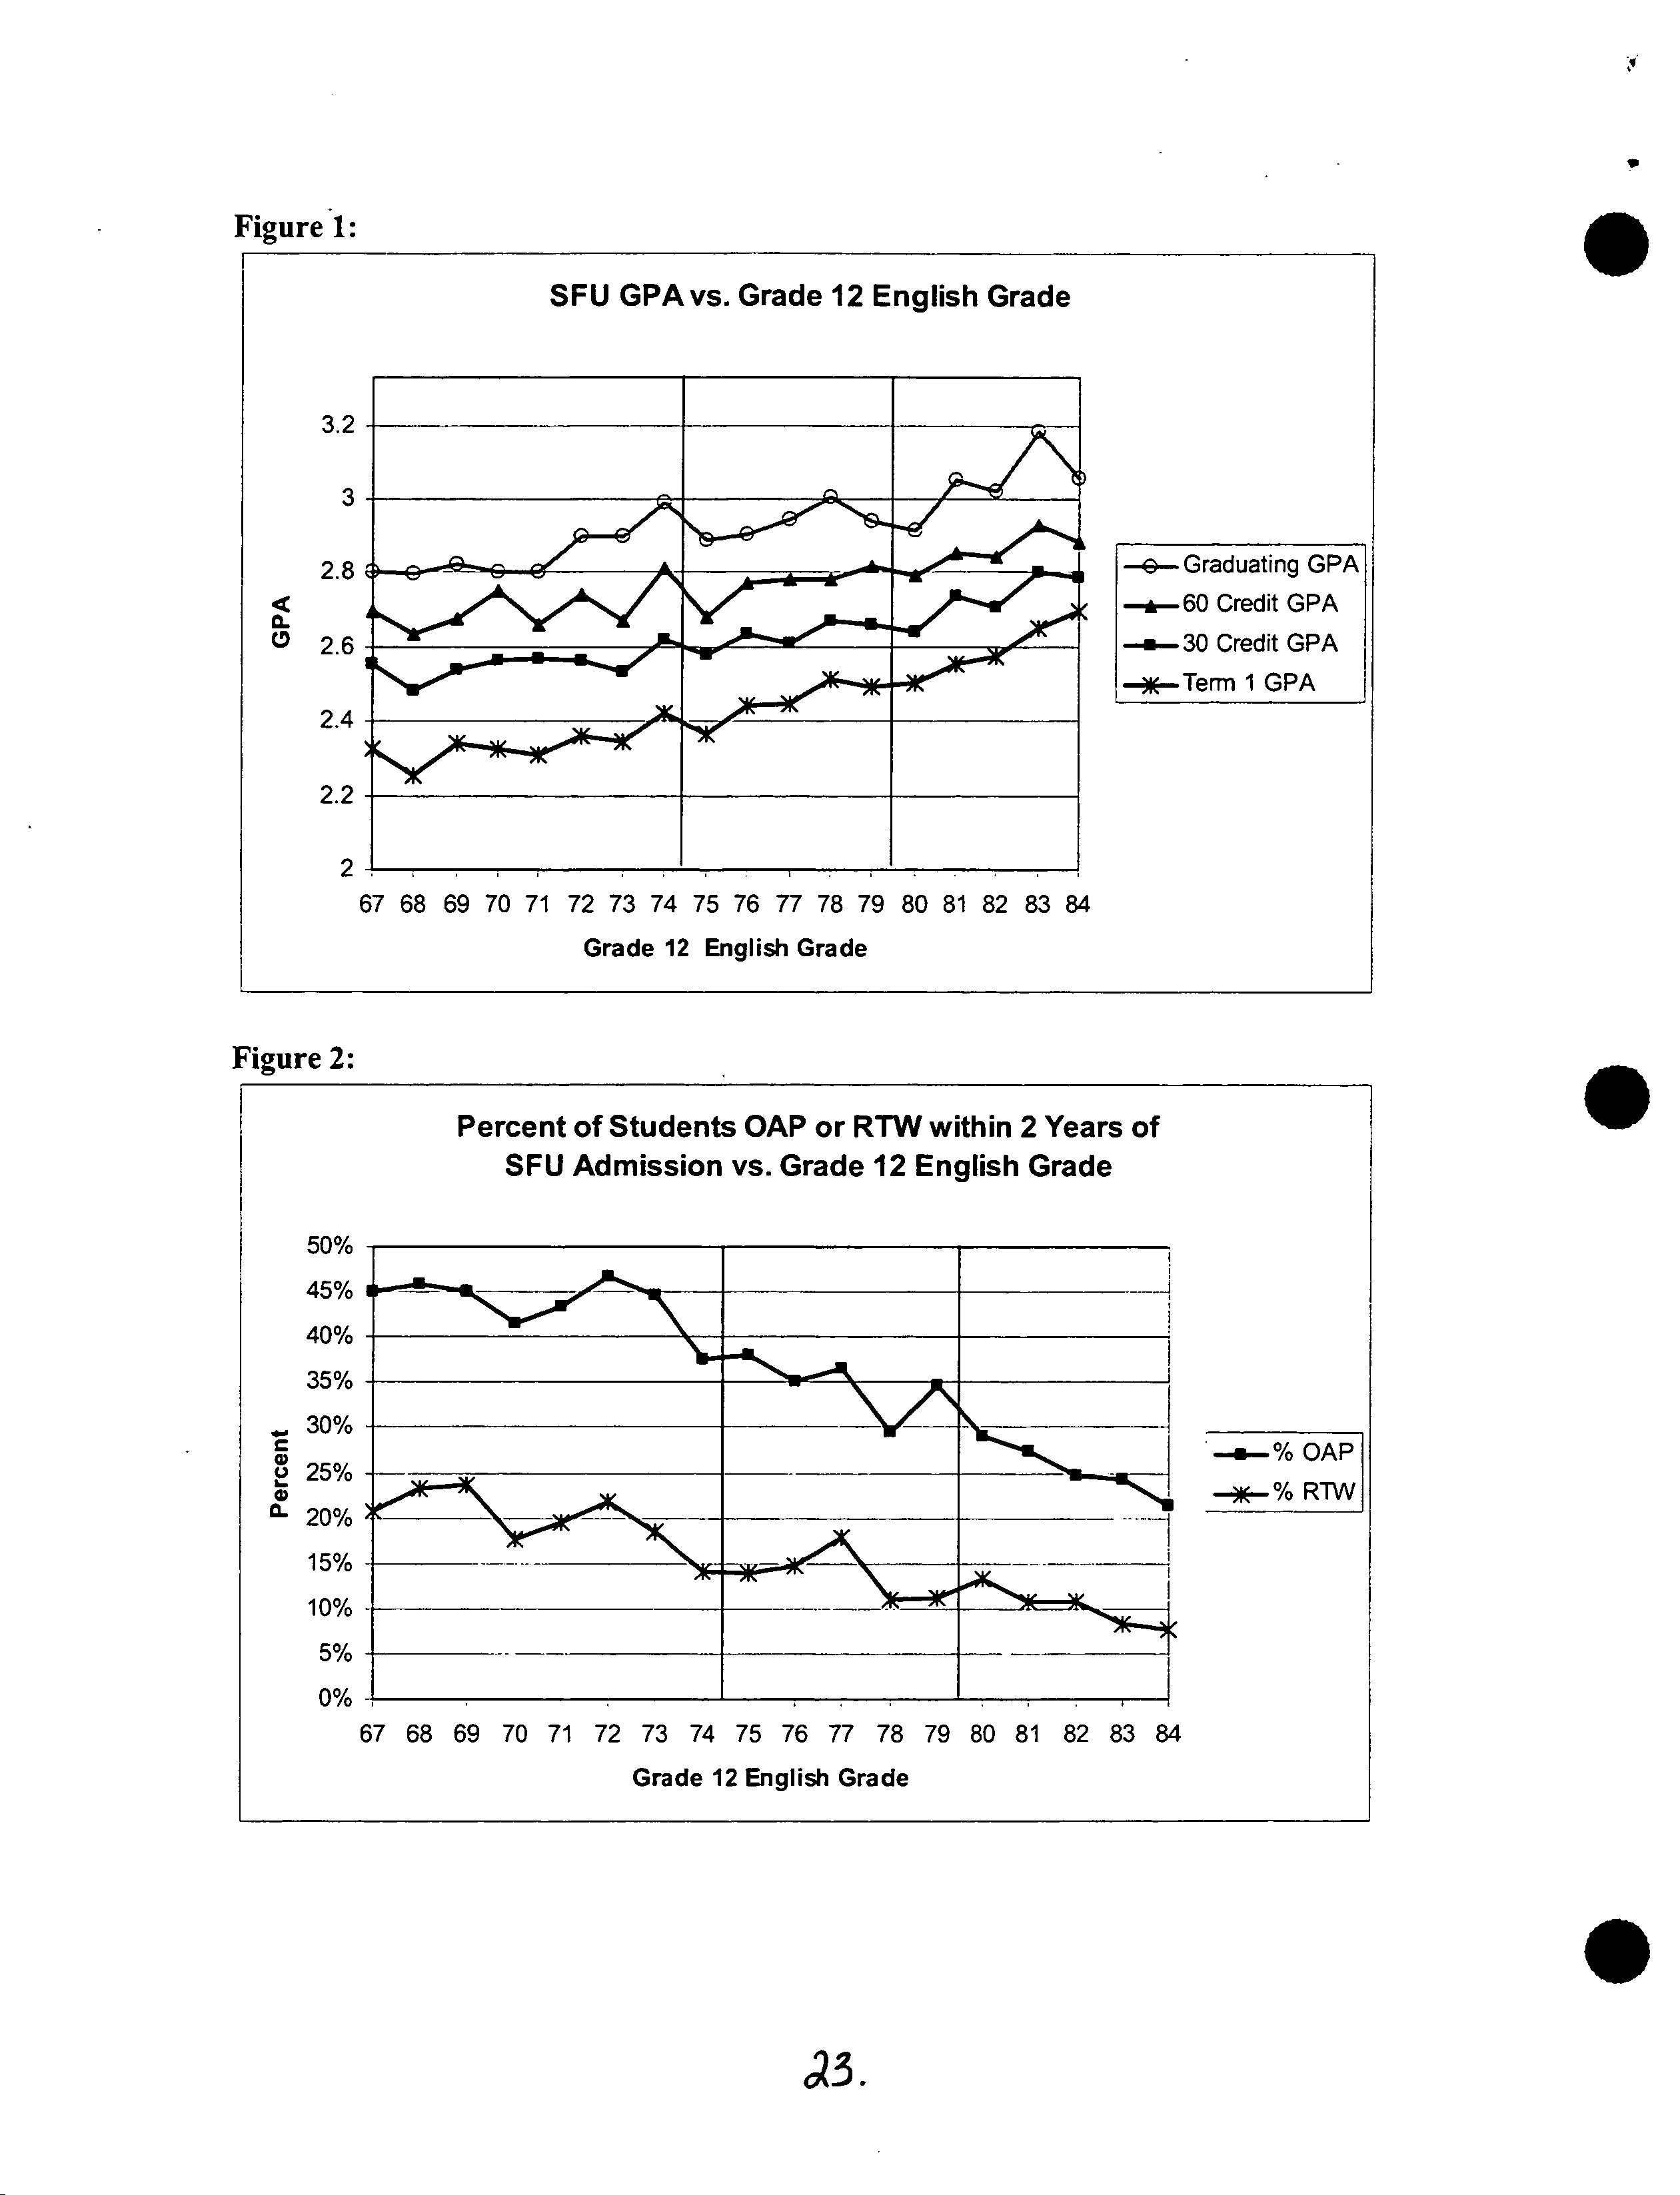
GPA (See Table 1 and Fi
gure 1):
All four GPA measures show an increase in GPA with increasing English-12 grades. In all cases,
the differences between the three groups of students is statistically significant. However, these
differences are quite small.
For example, when you control for baseline student characteristics, students
who enter SFU with English-12 grades of 75-79% have graduating GPAs that are on average only 0.08
lower than the average graduating GPAs of students who had English-12 grades of 80-84%. Even in the
raw comparisons 2 the difference is only 0.11.
These groups were created by selecting an equal number of students as close as possible above and below the cut-
offs of the primary group of interest (75% and 79%).
2
Raw comparisons are those in which we have not controlled for baseline student characteristics through regression
models.
?
0
Academic Standing: OAP/RTW (See Table 2 and Fi
gure 2):
Students admitted to SFU with higher English-12 marks are less likely to be put on academic
probation or required to withdraw from the university.
Students in the
75-79%
group have 1.4-times
the odds of being put on academic probation over students in the 80-84% group. Students in the 67-74%
group perform even worse, with 1.9-times the odds of being OAP over those entering with English-12
grades of 80-84%.
There is no statistical difference in the odds of being RTW between students in the 75-79% group
and those in the 80-84% group.
However, the 67-74% group has 1.6-times the odds of being RTW over
the 80-84% group.
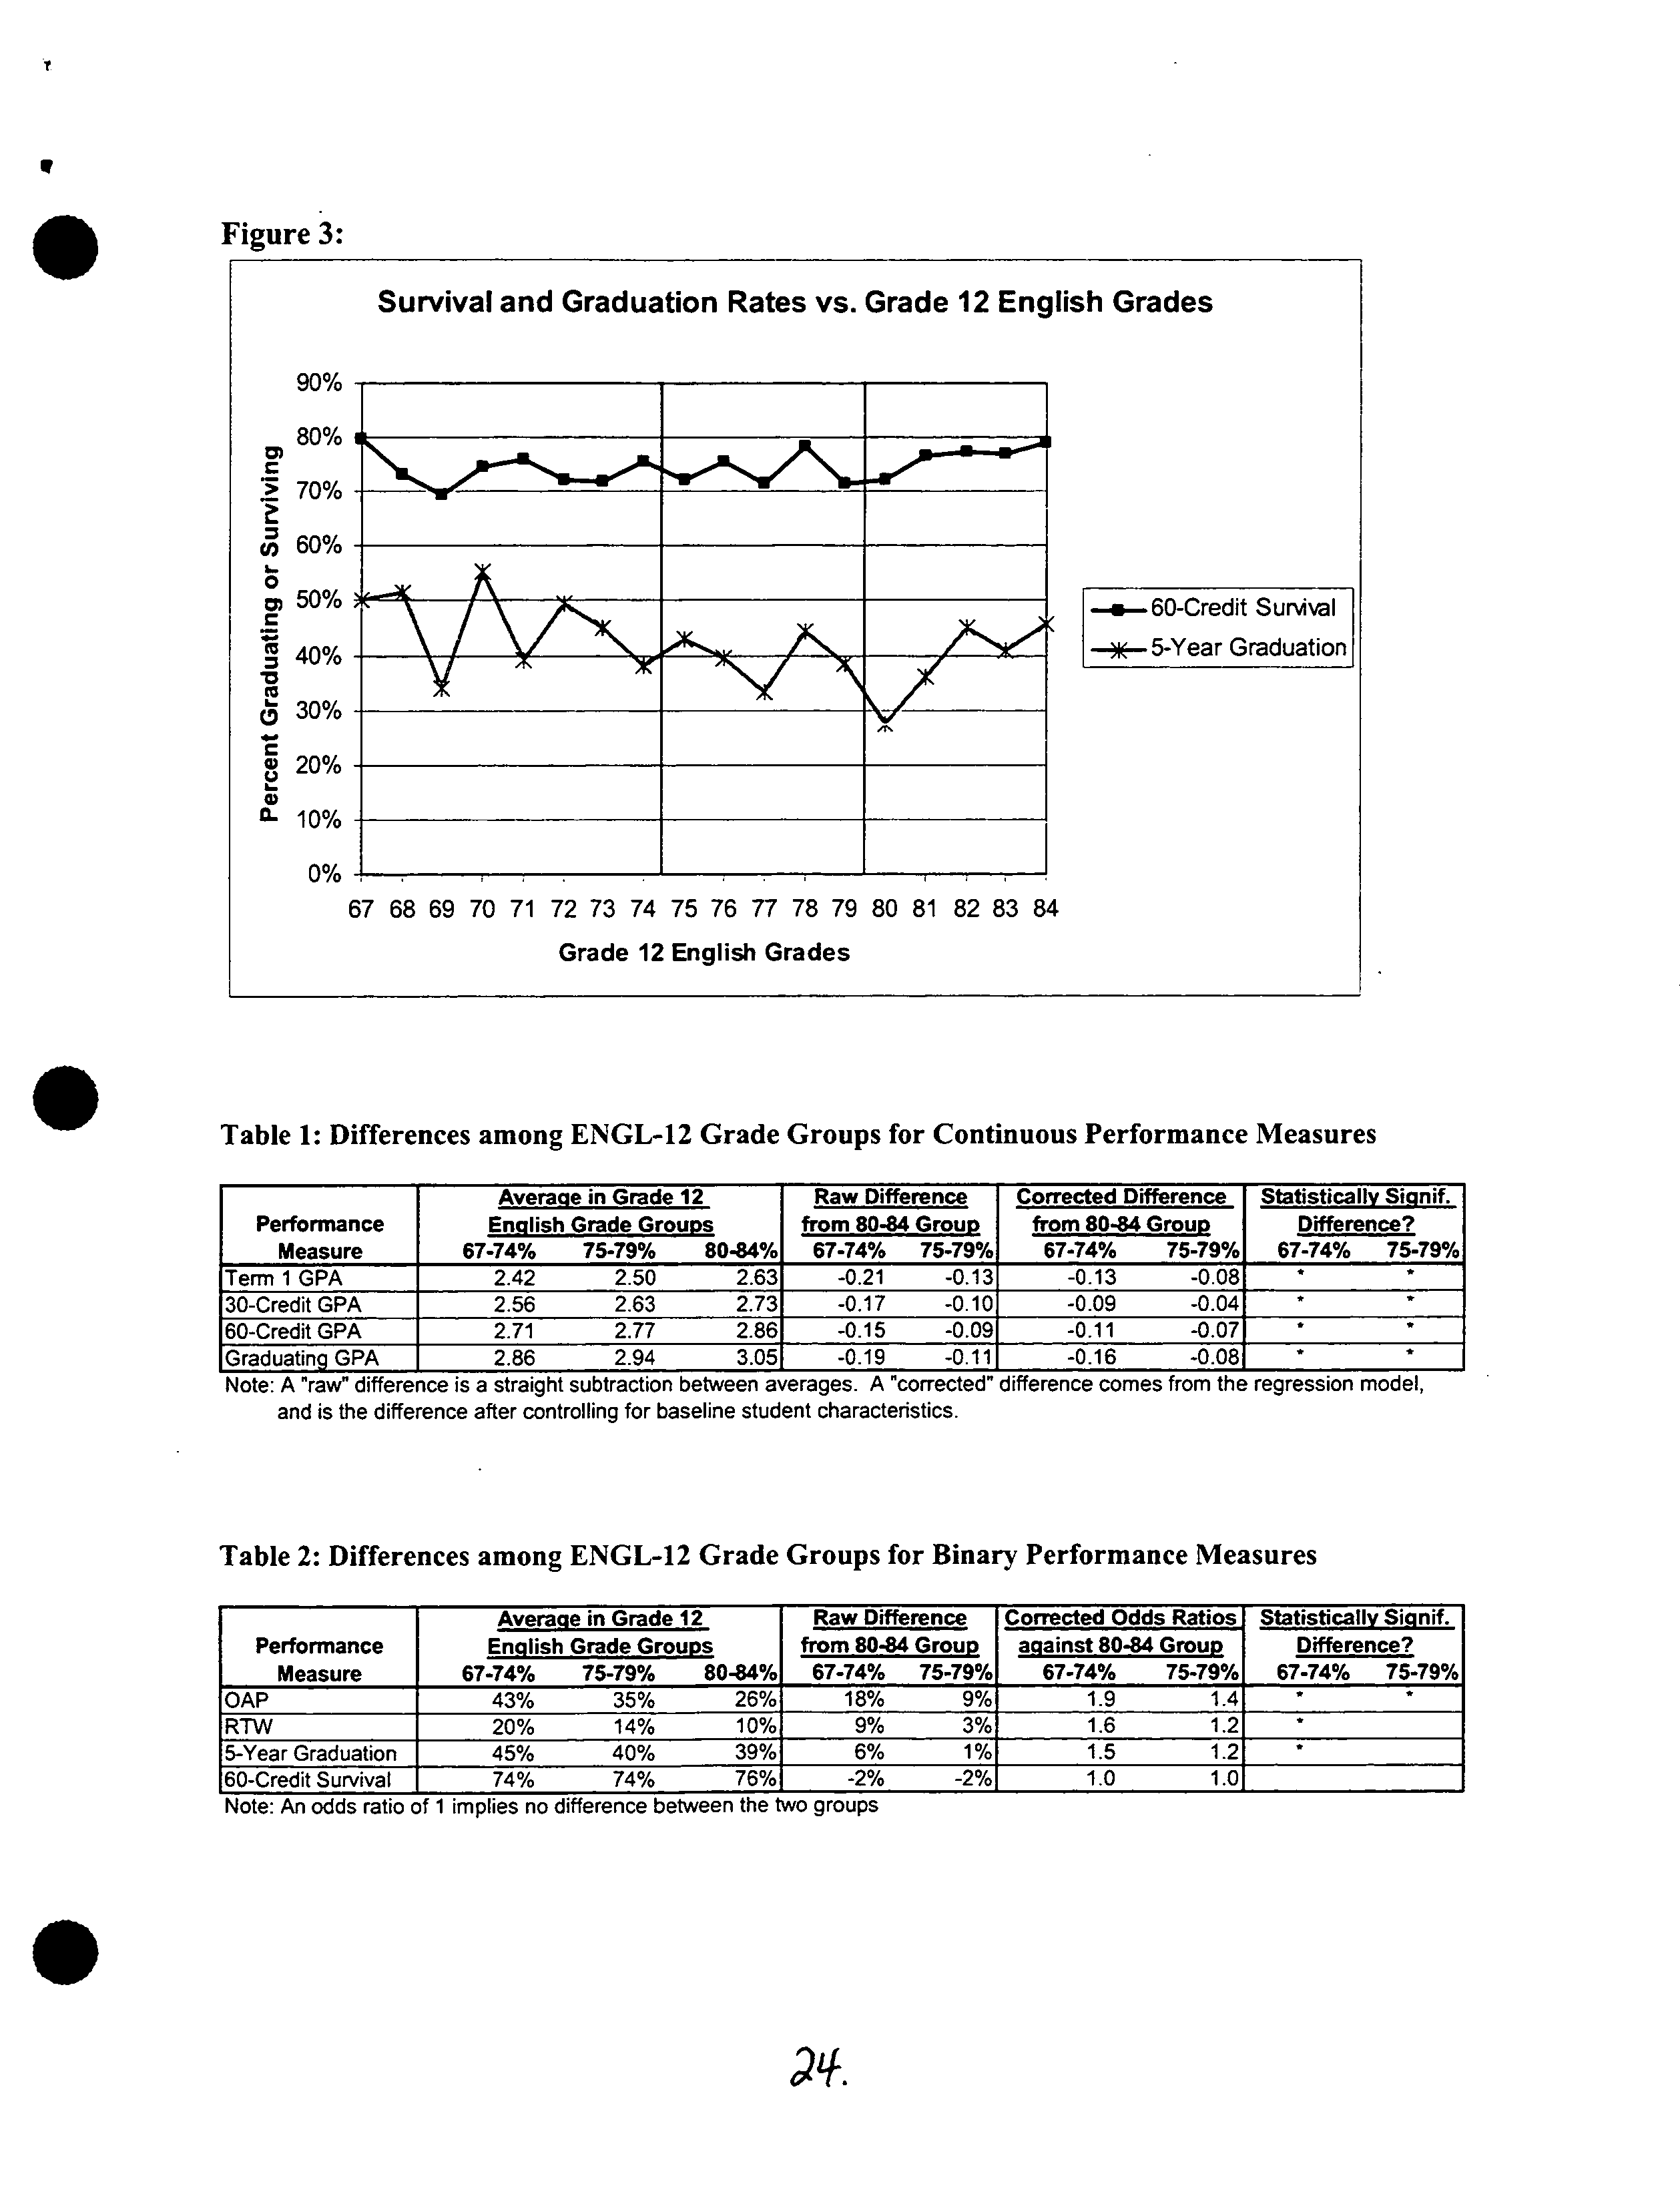
Survival/Graduation (See Table 2 and Fi
g ure 3):
60-credit survival rates are quite stable across different English-12 grades. There are no
statistically significant differences in this performance outcome among the grade groups.
Figure 3 suggests that
5-year graduation rates decrease slightly as English-12 grades increase.
This
seems counterintuitive. It may be that students coming in with higher grades are more likely to be
qualified for co-op or honours programs, which would cause them to take longer to finish their degree.
The differences between the 75-79% group and the 80-84% group are not statistically significant,
while students in the 67-74% group are more likely to graduate within five years of admission.
Natural Cut-Off for En
g lish-12 Grades:
.
?
Figures 1-3 illustrate that
there is no natural cut-off for English-12 grades that is common to all
performance measures.
For example, graduating GPA splits the students into three natural groups based
on English- 12 grades: <=71%, 72-80%, >80%. However, OAP rates improve fairly continuously with
increasing English- 12 grades (with a possible cut-off at —72%).
CAVEATS AND FURTHER STUDY
Some of the models exhibit poor fit. This suggests that there are important variables related to
performance that we are unable to capture in our models, such as whether the student is a financial aid
recipient, or whether the student is employed. It is possible that including such variables could change
our conclusions about the relationship between English- 12 grades and performance at SFU.
Also, it is possible that students who were admitted to SFU with English-12 grades below 80% are not
representative of all applicants below 80%. Students who were
admitted
with lower English- 12 grades
may have had high grades in other Grade-12 courses
3
. It is important to note that we are analyzing
admitted
students, but we wish to generalize our results to all
applicants.
The Office of Analytical Studies is pursuing a further analysis of grades achieved by these students in
selected SFU courses (several English, Philosophy, and Communications courses). The results of this
analysis will be available before December 4th.
In fact, we found very little correlation between English-I2 grades and Admission GPA.
.
Figure 1:
SFU GPA vs. Grade 12 English Grade
?
3.2
3
?
_
I
?
2.8 ?
,A
?
aiir ?
9--Graduating GPA
--60 Credit GPA
CL
r
?
2.6 ?
Credit GPA
—*—Term 1GPA
?
2.4
2.2
?
_
2
67 68 69 70 71 72 73 74 75 76 77 78 79 80 81 82 83 84
Grade 12 English Grade
Figure 2:
Percent of Students OAP or RTW within 2 Years of
?
SFU Admission vs. Grade 12 English Grade
50%
40%
- 30%
—.—% OAP
25%
____ ?
___ ________ _____ ?
x
% R
- 20%
15%
10%
5%
0%
67 68 69 70 71 72 73 74 75 76 77 78 79 80 81 82 83 84
Grade 12 English Grade
.
.
'3.
it
Figure 3:
Survival and Graduation Rates vs.
Grade 12 English
Grades
90%
U)
60%
L.
-&-60-Credit
..
SurAal
5-Year Graduation
I
30%
20%
I-
°- 10%
0%
67
68 69 70 71 72 73 74 75 76 77 78 79
80 81 82 83 84
Grade 12 English Grades
.
0
?
Table 1: Differences among ENGL-12 Grade Groups for Continuous Performance Measures
Performance
Measure
Avera g e
in
Grade 12
English Grade Grou p s
67-74%
?
75-79% ?
80-84%
Raw Difference
from 80-84
Group
Corrected Difference
Statistically
Signif.
from
80-84
Grou p
67-74% ?
75-79%
Difference?
67-74% ?
75-79%
67-74% ?
75-79%
Tern, 1 GPA
2.42
2.50
2.63
-0.21
-0.13
-0.13
-0.08
* ?
*
30-Credit GPA
2.56
2.63
2.73
-0.17
-0.10
-0.09
-0.04
* ?
*
60-Credit GPA
2.71
2.77
2.86
-0.15
-0.09
-0.11
-0.07
Graduating GPA
2.86
2.94
3.05
-0.19
-0.11
-0.16
-0.08
* ?
*
Note:
1k
raw cirTerence is a straigni suotracuon oeiween averages. m correctea airrerence comes rrom me regression moael,
and is the difference after controlling for baseline student characteristics.
Table 2: Differences among ENGL-12 Grade Groups for Binary Performance Measures
Performance
Measure
Avera g
e in Grade 12
English Grade Grou p s
67-74% ?
75-79% ?
80-84%
Raw Difference
from 80-84
Group
Corrected Odds
Ratios
Statistically
Signif.
ag ainst
80-84 Grou
p
Difference?
67-74% ?
75-79%
67-74%
?
75-79% 67-74%
?
75-79%
OAP
43% ?
35% ?
26%
18%
?
9%
1.9 ?
1.4
*
RTW
20% ?
14% ?
10%
9%
?
3%
1.6 ?
1.2 *
5-Year Graduation
45% ?
40% ?
39% 6% ?
1%
1.5 ?
1.2 *
60-Credit Survival
1 ?
74% ?
74% ?
76%
-2%
?
-2%1 1.0 ?
1.0
Note: An odds ratio of 1 implies no difference between tne two groups