S.08-54
SIMON FRASER UNIVERSITY
Senate Committee on University Priorities
?
Memorandum
TO:
Senate ?
FROM: ?
John Waterh
Chair, SCUP
Vice Preside t, cademic
RE:
2008/2009 Faculty Renewal Plan
?
DATE: ?
March 17, 2008
(SCUP 08-13)
At its March 12, 2008 meeting SCUP received for information the 2008/2009 Faculty
Renewal Plan. It is attached for the information of Senate.
end.
.
MEMO
SCUP 08-13
OFFICE OF THE VICE-PRESIDENT, ACADEMIC AND PROVOST
?
is
ATTENTION: Senate Committee on University Priorities
FROM: ?
John Waterhouse, Vice President, Academic;
RE: ?
2008/2009 Faculty Renewal Plan
i
DATE: ?
March 4, 2008
Attached is the 2008/09 Faculty Renewal Plan. This document is forwarded to the
Board of Governors and provides a summary of faculty recruitment activity over the
past five years as well as planned hiring for the upcoming academic year. This report
places our academic hiring activity within the context of student enrolment growth,
new strategic initiatives and diversification of the faculty complement.
Cc: Glynn Nicholls, Director, Academic Planning and Budgeting
Gayle Myers, Director, Academic Relations
.
SIMON FRASIR UNIVERSITY
?
THINKING OF THE WORLD
SFU Faculty Renewal Plan/Report
2008/09
.
SIMON FRASER UNIVERSITY
THINKING OF THE WORt.O
.
1
SFU Faculty Renewal Plan/Report
?
2008/09 ?
.
1. INTRODUCTION
The annual Faculty Renewal Plan provides the Academic Operations Committee
and the Board of Governors with an outline of the activities and achievements
around recruiting and retaining faculty. These efforts are essential to ensure that
SFU remains a top ranked institution.
The objectives of this document are to:
briefly describe the context within which faculty recruitment is being
undertaken.
report on the success achieved in the recruitment of faculty in 2007/08
advise on the status of special Chairs (CRC, LEEF).
provide analysis on faculty trends (gender, nationality).
outline the recruitment plan for faculty for 2008/09.
report on the funds required to attract and retain faculty including Market
Differentials and the Retention Fund for 2008/09.
The approval of this plan by the Academic Operations Committee and the Board
of Governors will allow SFU to move ahead on achieving the Academic Goals
contained in the Three Year Academic Plan 2007 - 2010.
2.
PLANNING CONTEXT
a. Enrolment Growth
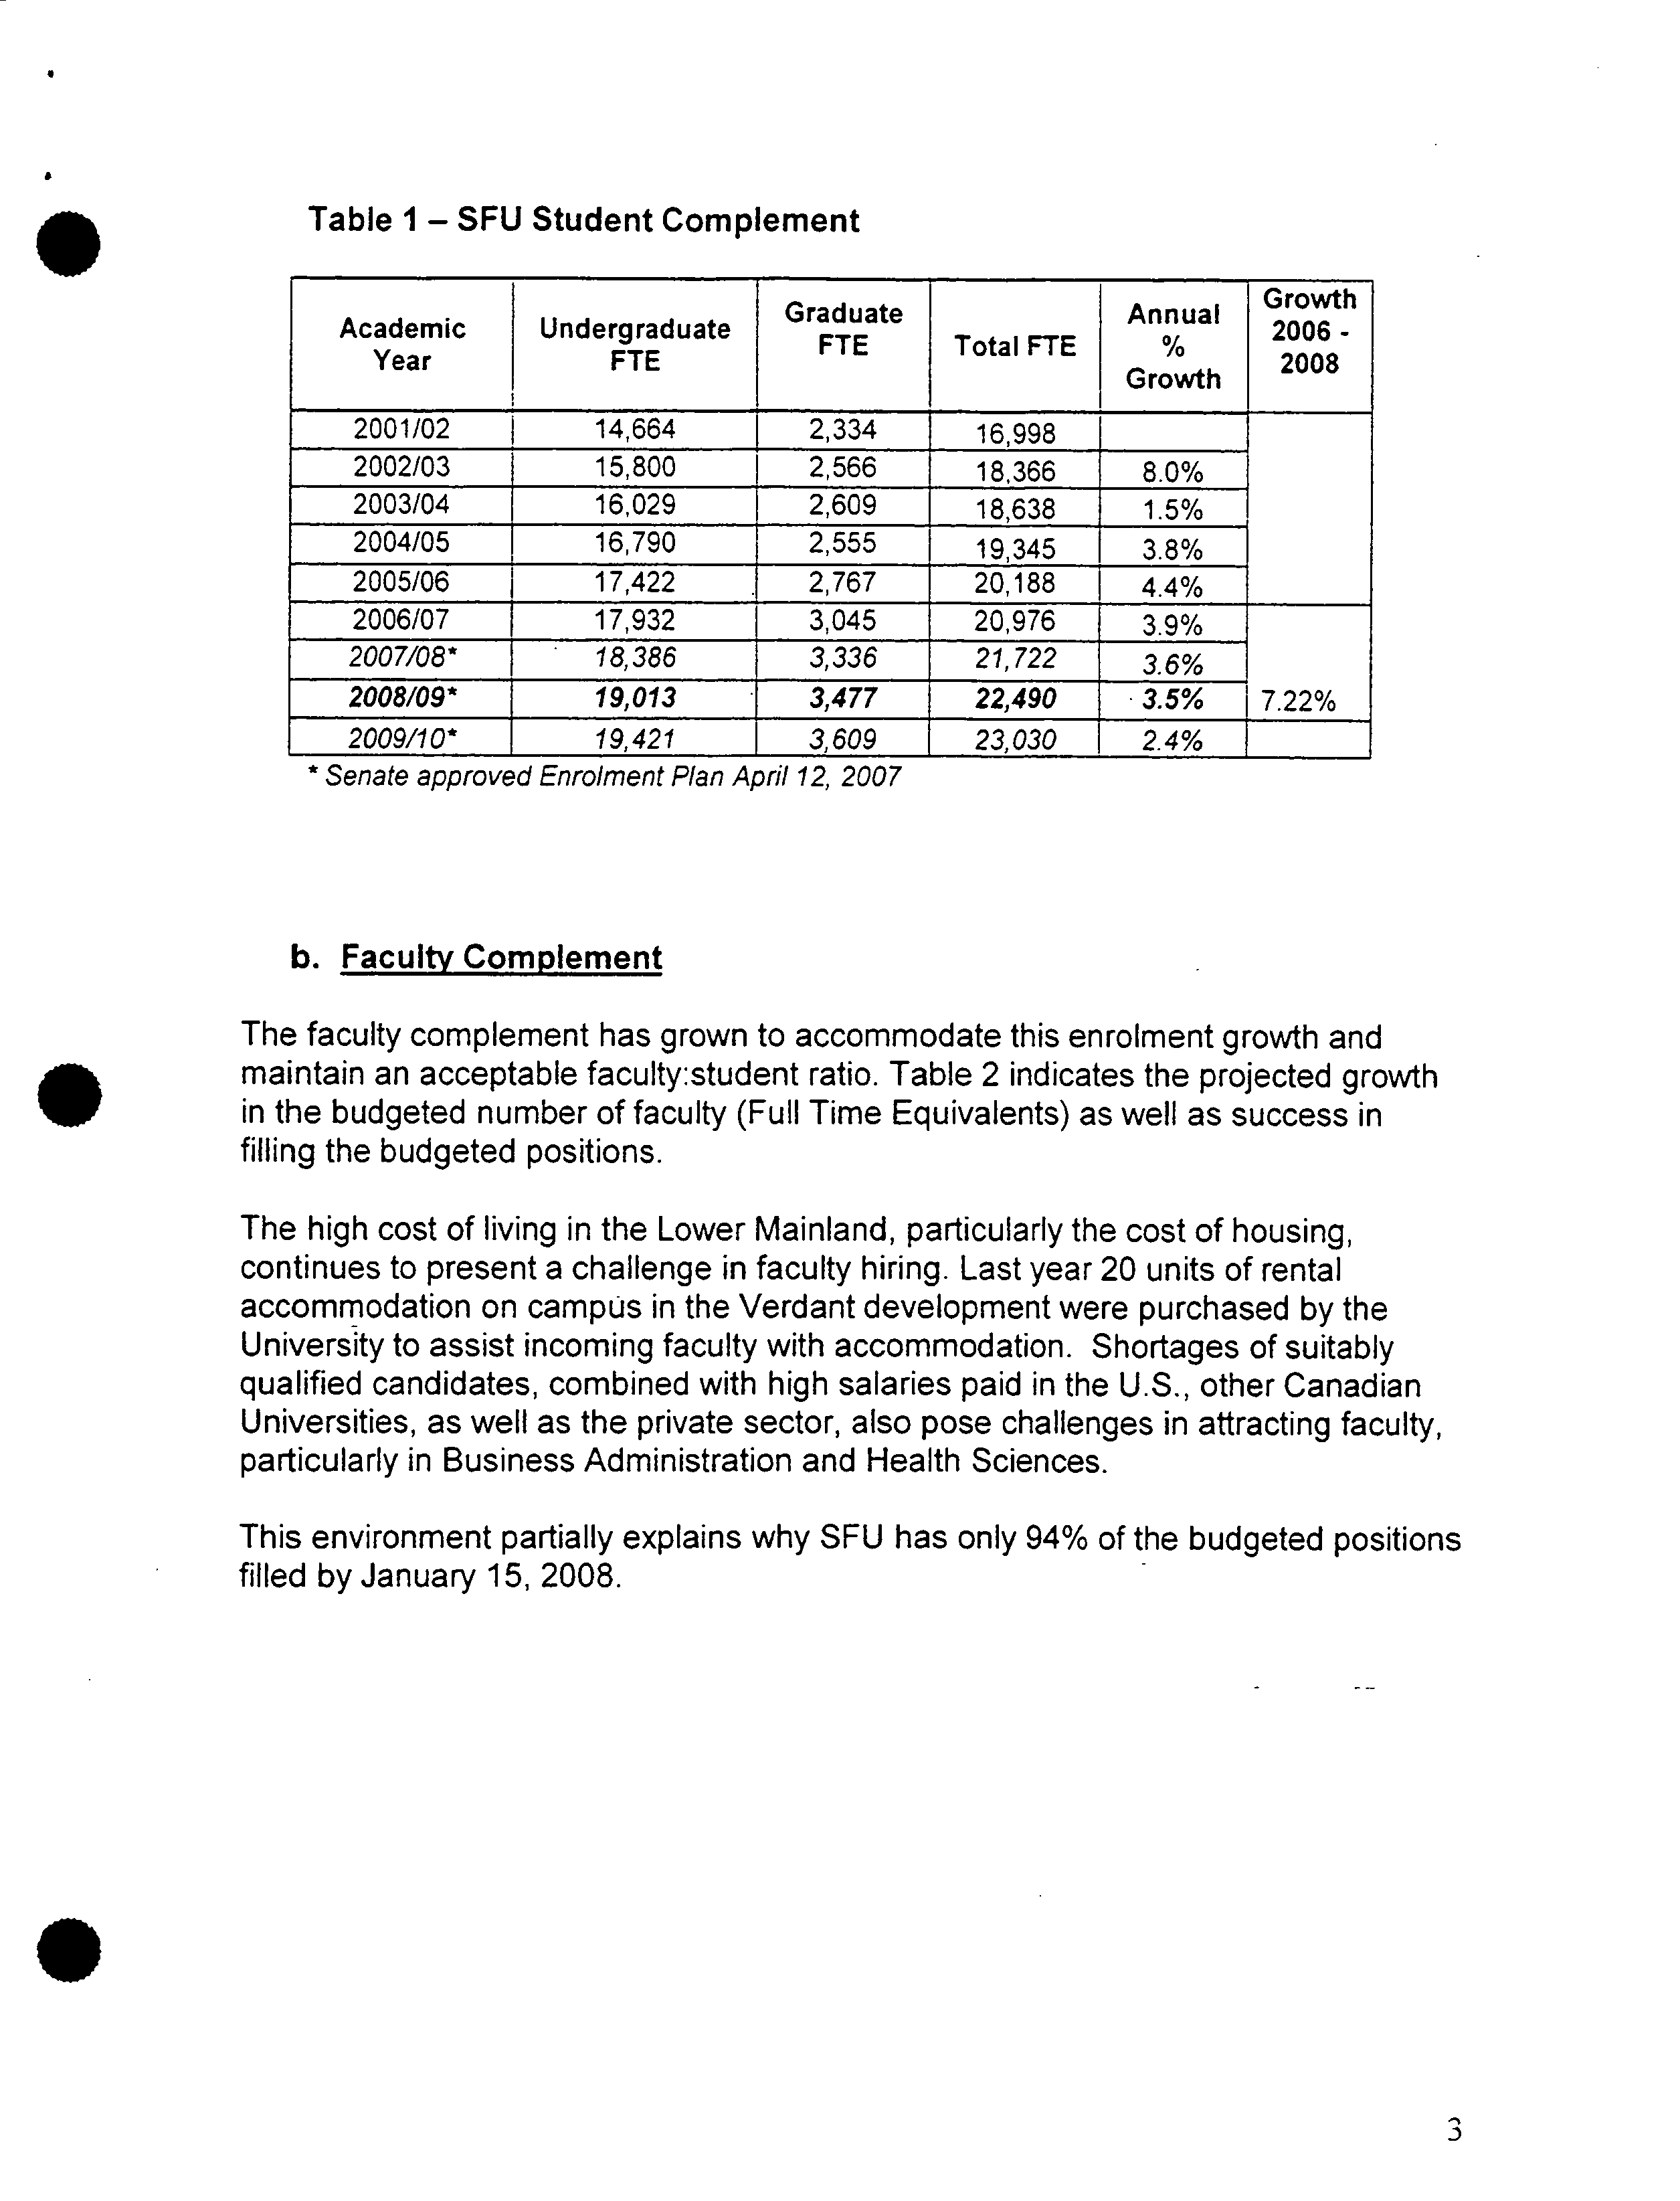
SFU has managed a high level of enrolment growth over the past decade. This
trend is expected to continue into the foreseeable future as a result of the
Provincial enrolment target of an additional 25,000 higher education seats by
2010/11. This growth is reflected in Table 1 where SFU's total Full Time
Equivalent number of students is expected to exceed 22,490 in 2008/09 which
?
?
represents a 7.22% increase over 3 years.
?
-
is
2
Table
I -
SFU Student Complement
Academic
Year
Undergraduate
FTE
Graduate
FTE
Total FTE
Annual
%
Growth
Growth
2006-
2008
2001/02
14,664
2,334
16,998
2002/03
15,800
2,566
18,366
8.0%
2003/04
16,029
2,609
18,638
1.5%
2004/05
16,790
2,555
19,345
3.8%
2005/06
17,422 ?
.
2,767
20,188
4.4%
2006/07
17,932
3,045
20,976
39%
2007108*
18,386
3,336
21,722
3.6%
1
7.22%
2008109*
19,013
3,477
22,490
3.5%
2009110*
19,421
3,609
23,030
2.4%
1
* Senate approved Enrolment Plan April 12, 2007
b. Faculty Complement
The faculty complement has grown to accommodate this enrolment growth and
• ?
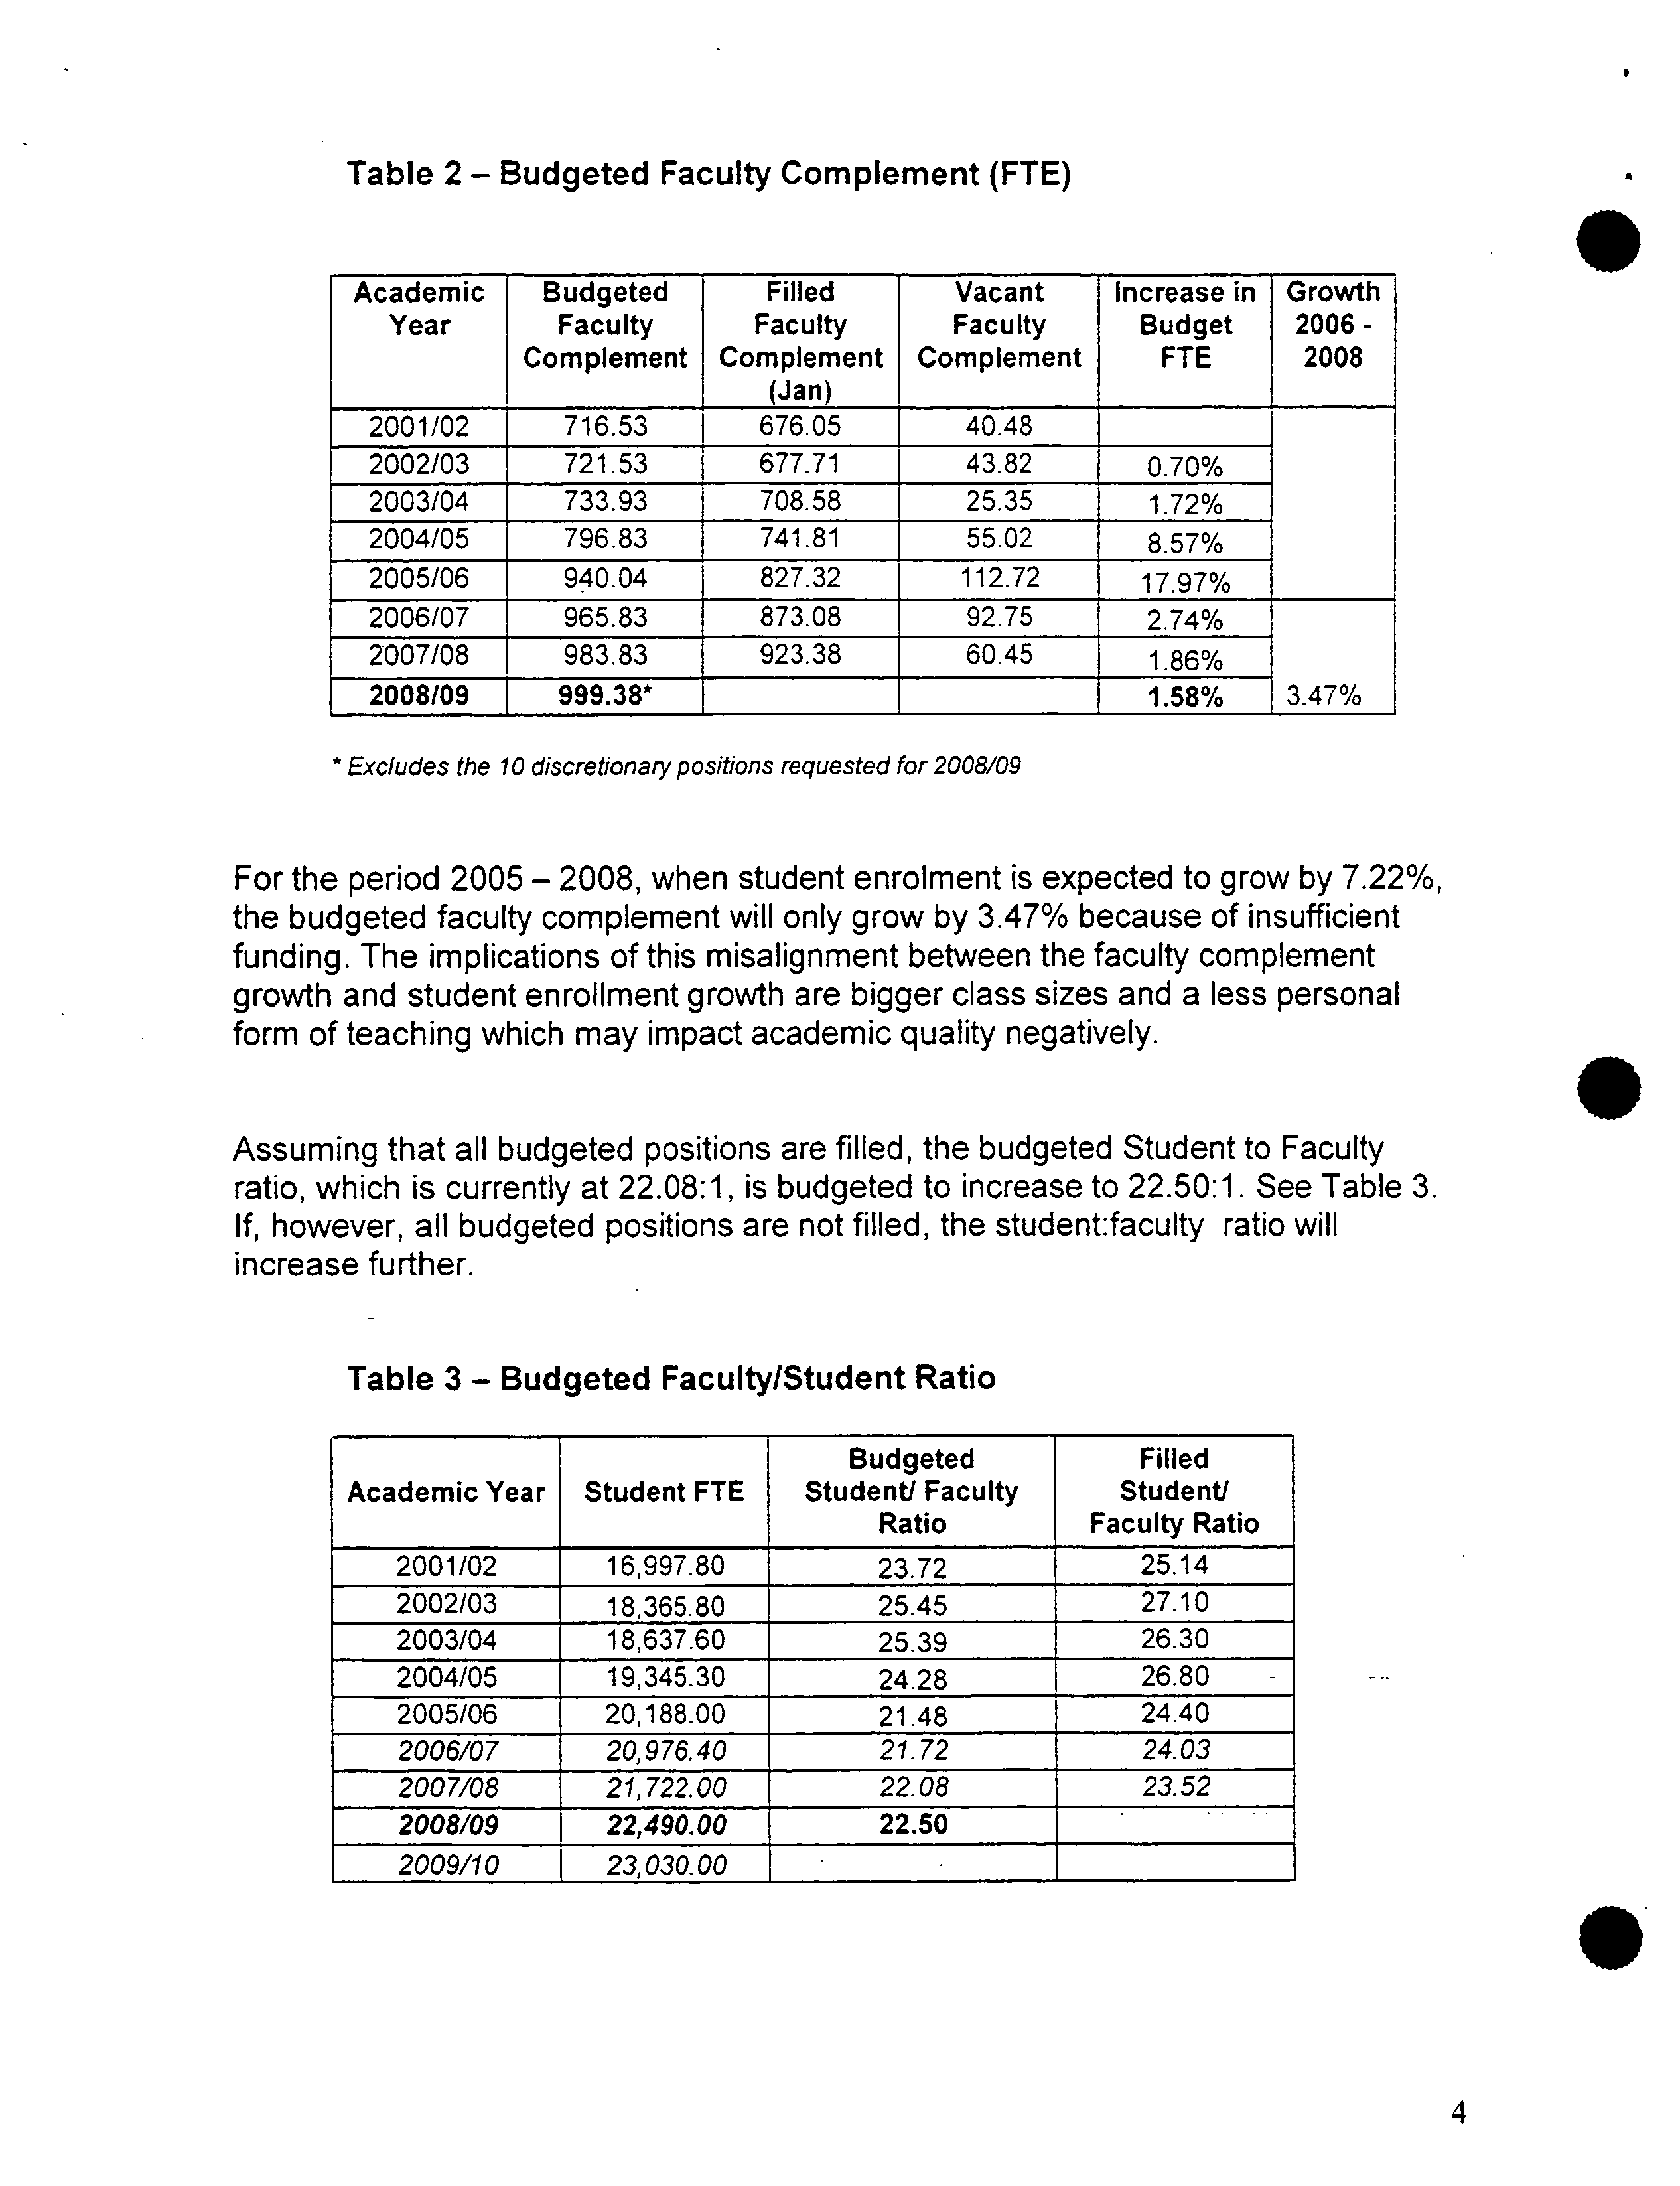
maintain an acceptable faculty:student ratio. Table 2 indicates the projected growth
in the budgeted number of faculty (Full Time Equivalents) as well as success in
filling the budgeted positions.
The high cost of living in the Lower Mainland, particularly the cost of housing,
continues to present a challenge in faculty hiring. Last year 20 units of rental
accommodation on campUs in the Verdant development were purchased by the
University to assist incoming faculty with accommodation. Shortages of suitably
qualified candidates, combined with high salaries paid in the U.S., other Canadian
Universities, as well as the private sector, also pose challenges in attracting faculty,
particularly in Business Administration and Health Sciences.
This environment partially explains why SFU has only 94% of the budgeted positions
filled by January 15, 2008.
I
Table 2- Budgeted Faculty Complement (FTE)
Academic
Year
Budgeted
Faculty
Complement
Filled
Faculty
Complement
(Jan)_____
Vacant
Faculty
Complement
J
Increase
in
Budget
I ?
FTE
Growth
2006-
2008
2001/02
716.53
676.05
4048
2002/03
721.53
677.71
43.82
0.70%
2003/04
733.93
708.58
25.35
1.72%
2004/05
796.83
741.81
55.02
8.57%
2005/06
940.04
827.32
112.72
17.97%
2006/07
965.83
873.08
92.75
2.74%
3.47%
2007/08
983.83
923.38
60.45
1.86%
2008109
999.38*
1.58%
* Excludes the 10 discretionary positions requested for 2008109
For the period 2005 - 2008, when student enrolment is expected to grow by 7.22%,
the budgeted faculty complement will only grow by 3.47% because of insufficient
funding. The implications of this misalignment between the faculty complement
growth and student enrollment growth are bigger class sizes and a less personal
form of teaching which may impact academic quality negatively.
Assuming that all budgeted positions are filled, the budgeted Student to Faculty
ratio, which is currently at 22.08:1, is budgeted to increase to 22.50:1. See Table 3.
If, however, all budgeted positions are not filled, the student-.faculty ratio will
increase further.
Table 3 - Budgeted Faculty/Student Ratio
Academic Year
Student FTE
Budgeted
Student! Faculty
Ratio
Filled
Student!
Faculty Ratio
2001/02
16,997.80
23.72
25.14
2002/03
18,365.80
25.45
27.10
2003/04
18,637.60
25.39
26.30
2004/05
19,345.30
24.28
26.80 ?
-
2005/06
20,188.00
21.48
24.40
2006107
20,976.40
21.72
24.03
2007108
1 ?
21,722.00
1 ?
22.08
23.52
2008109
22,490.00
22.50
2009110
23,030.00
U
.
C
4
C
c.
Retirements and the impact of the abolition of mandatory retirement
As a result of an agreement with the Faculty Association in May 2007 following a
passage of legislation ending mandatory retirement, 14 of the 16 faculty scheduled
to retire in August 2007 elected to continue working. Three of these 14 opted for
'reduced workload' of 50%. Consequently, only 3.5 FTE5 needed to be replaced,
rather than the 16 expected. However, in December 2007 one more expected retiree
did retire.
The timing of these decisions meant that three new faculty members had been hired
into the positions projected to fall vacant due to scheduled retirements.
The impact of these actions had a significant budget impact:
• The savings resulting from retirements in 2007/08 were reduced by
$345,654.
• Budgeted expenses for the Faculties were increased by $539,108 by
having to continue with the existing faculty rather than replace the
retirees at the faculty entry level (aP4).
• The total impact of this legislation in 2007/08 amounted to an increase
of $885,000.
Moving forward in an era with no mandatory retirement will require very careful
planning and monitoring. The new agreement with the Faculty Association requires
that faculty members must give at least 12 months' written notice of retirement or
election of a phased retirement plan. Once received, the notice is irrevocable.
d. Financial Restraint
SFU continues to experience very significant inflationary pressures that are not
being funded either by the provincial grant or tuition increases. These pressures
have a direct impact on our recruitment efforts. A number of actions were agreed to
by the President and Vice Presidents to ensure a balanced budget for 2008/09
including a second consecutive 2.5% budget cut applied directly to the Faculties. All
positions that had been vacant for 2 or more years were eliminated. In addition,
some Faculties have had to adjust their recruitment plans by reducing the number of
vacant and/or new positions they had been planning to fill. This reduced recruitment
level will, unless corrected in the near future, have a negative impact on teaching
quality.
e. Strate g
ic priorities for SFU
The two areas of strategic importance are the growth of the Surrey campus and the
. Faculty of Health Sciences. Student growth is focused in those areas and this
decision has been translated into additional funding for 2008/09, safeguarding
faculty recruitment.
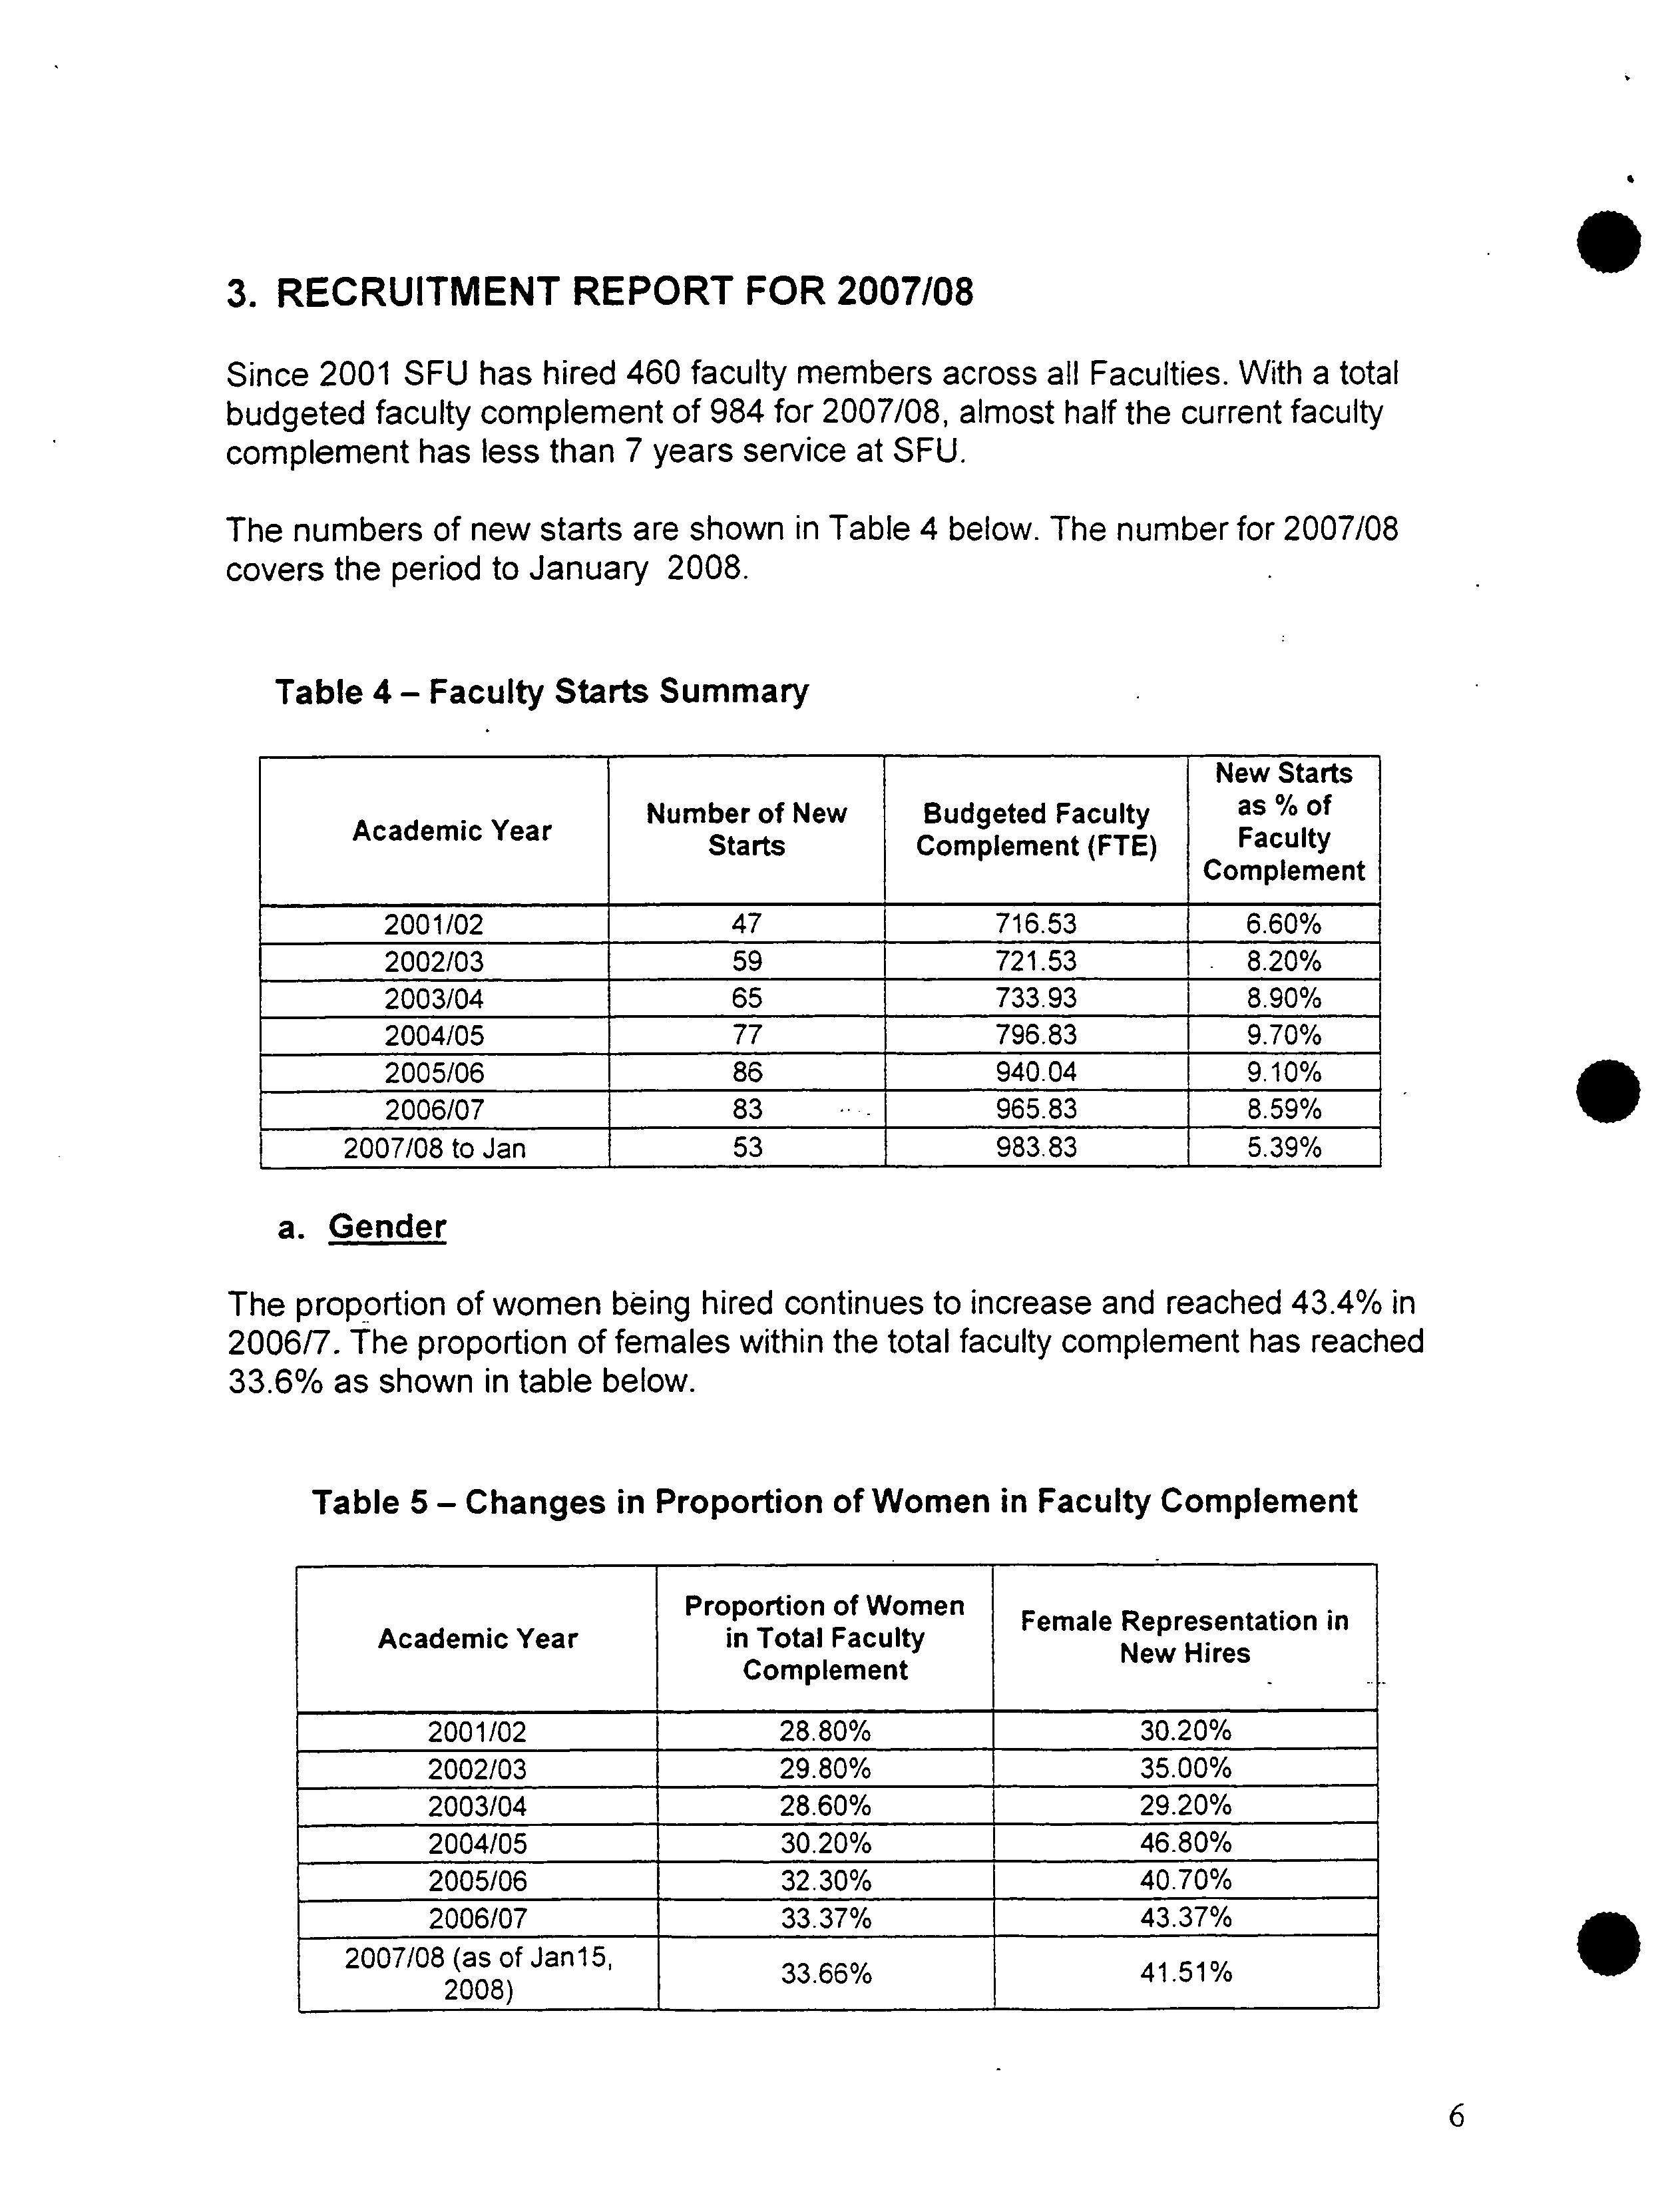
3. RECRUITMENT REPORT FOR 2007/08
Since 2001 SFU has hired 460 faculty members across all Faculties. With a total
budgeted faculty complement of 984 for 2007/08, almost half the current faculty
complement has less than 7 years service at SFU.
The numbers of new starts are shown in Table 4 below. The number for 2007/08
covers the period to January 2008.
.
Table 4— Faculty Starts Summary
Academic Year
Number of New
Starts
Budgeted Faculty
Complement (FTE)
New Starts
as % of
Faculty
Complement
2001/02
47
716.53
6.60%
2002/03
59
721.53
.
?
8.20%
2003/04
65
733.93
8.90%
2004/05
77
796.83
9.70%
2005/06
86
940.04
9.10%
2006/07
83
965.83
8.59%
2007/08 to Jan
53
983.83
5.39%
a. Gender
The proportion of women being hired continues to increase and reached 43.4% in
2006/7. The proportion of females within the total faculty complement has reached
33.6% as shown in table below.
L
Table 5—Changes in Proportion of Women in Faculty Complement
Academic Year
Proportion of Women
in Total Faculty
Complement
Female Representation in
New Hires
2001/02
28.80%
30.20%
2002/03
29.80%
35.00%
2003/04
28.60%
29.20%
2004/05
30.20%
46.80%
2005/06
32.30%
40.70%
2006/07
33.37%
43.37%
2007/08 (as of Jan 15,
2008)
33.66%
41.51%
.
rel
b. International Hires
Due to the shortage in qualified Canadian PhDs, SFU continues to have to go further
a field to attract the best faculty. Table 6 shows the proportion of new hires who are
neither Canadian citizens nor permanent residents. The number of non-Canadian
appointments continues to rise and has now reached 37.74% of all new hires. The
University does, however, remain committed to giving priority to suitably qualified
Canadians/permanent residents.
Table 6 - Proportion of Canadian/Permanent Resident Hiring
.
Academic Year
Work Classification for New Hires by Year of
Appointment
Canadian Citizens/Permanent
Residents
Non-Canadian
2001/02
81.30%
18.80%
2002/03
67.80%
32.20%
2003/04
60.00%
40.00%
2004/05
71.40%
28.60%
2005/06
I ?
69.80%
30.20%
2006/07
63.89%
36.14%
2007/08 (as of
Jan15,2008)
62.26%
37.74%
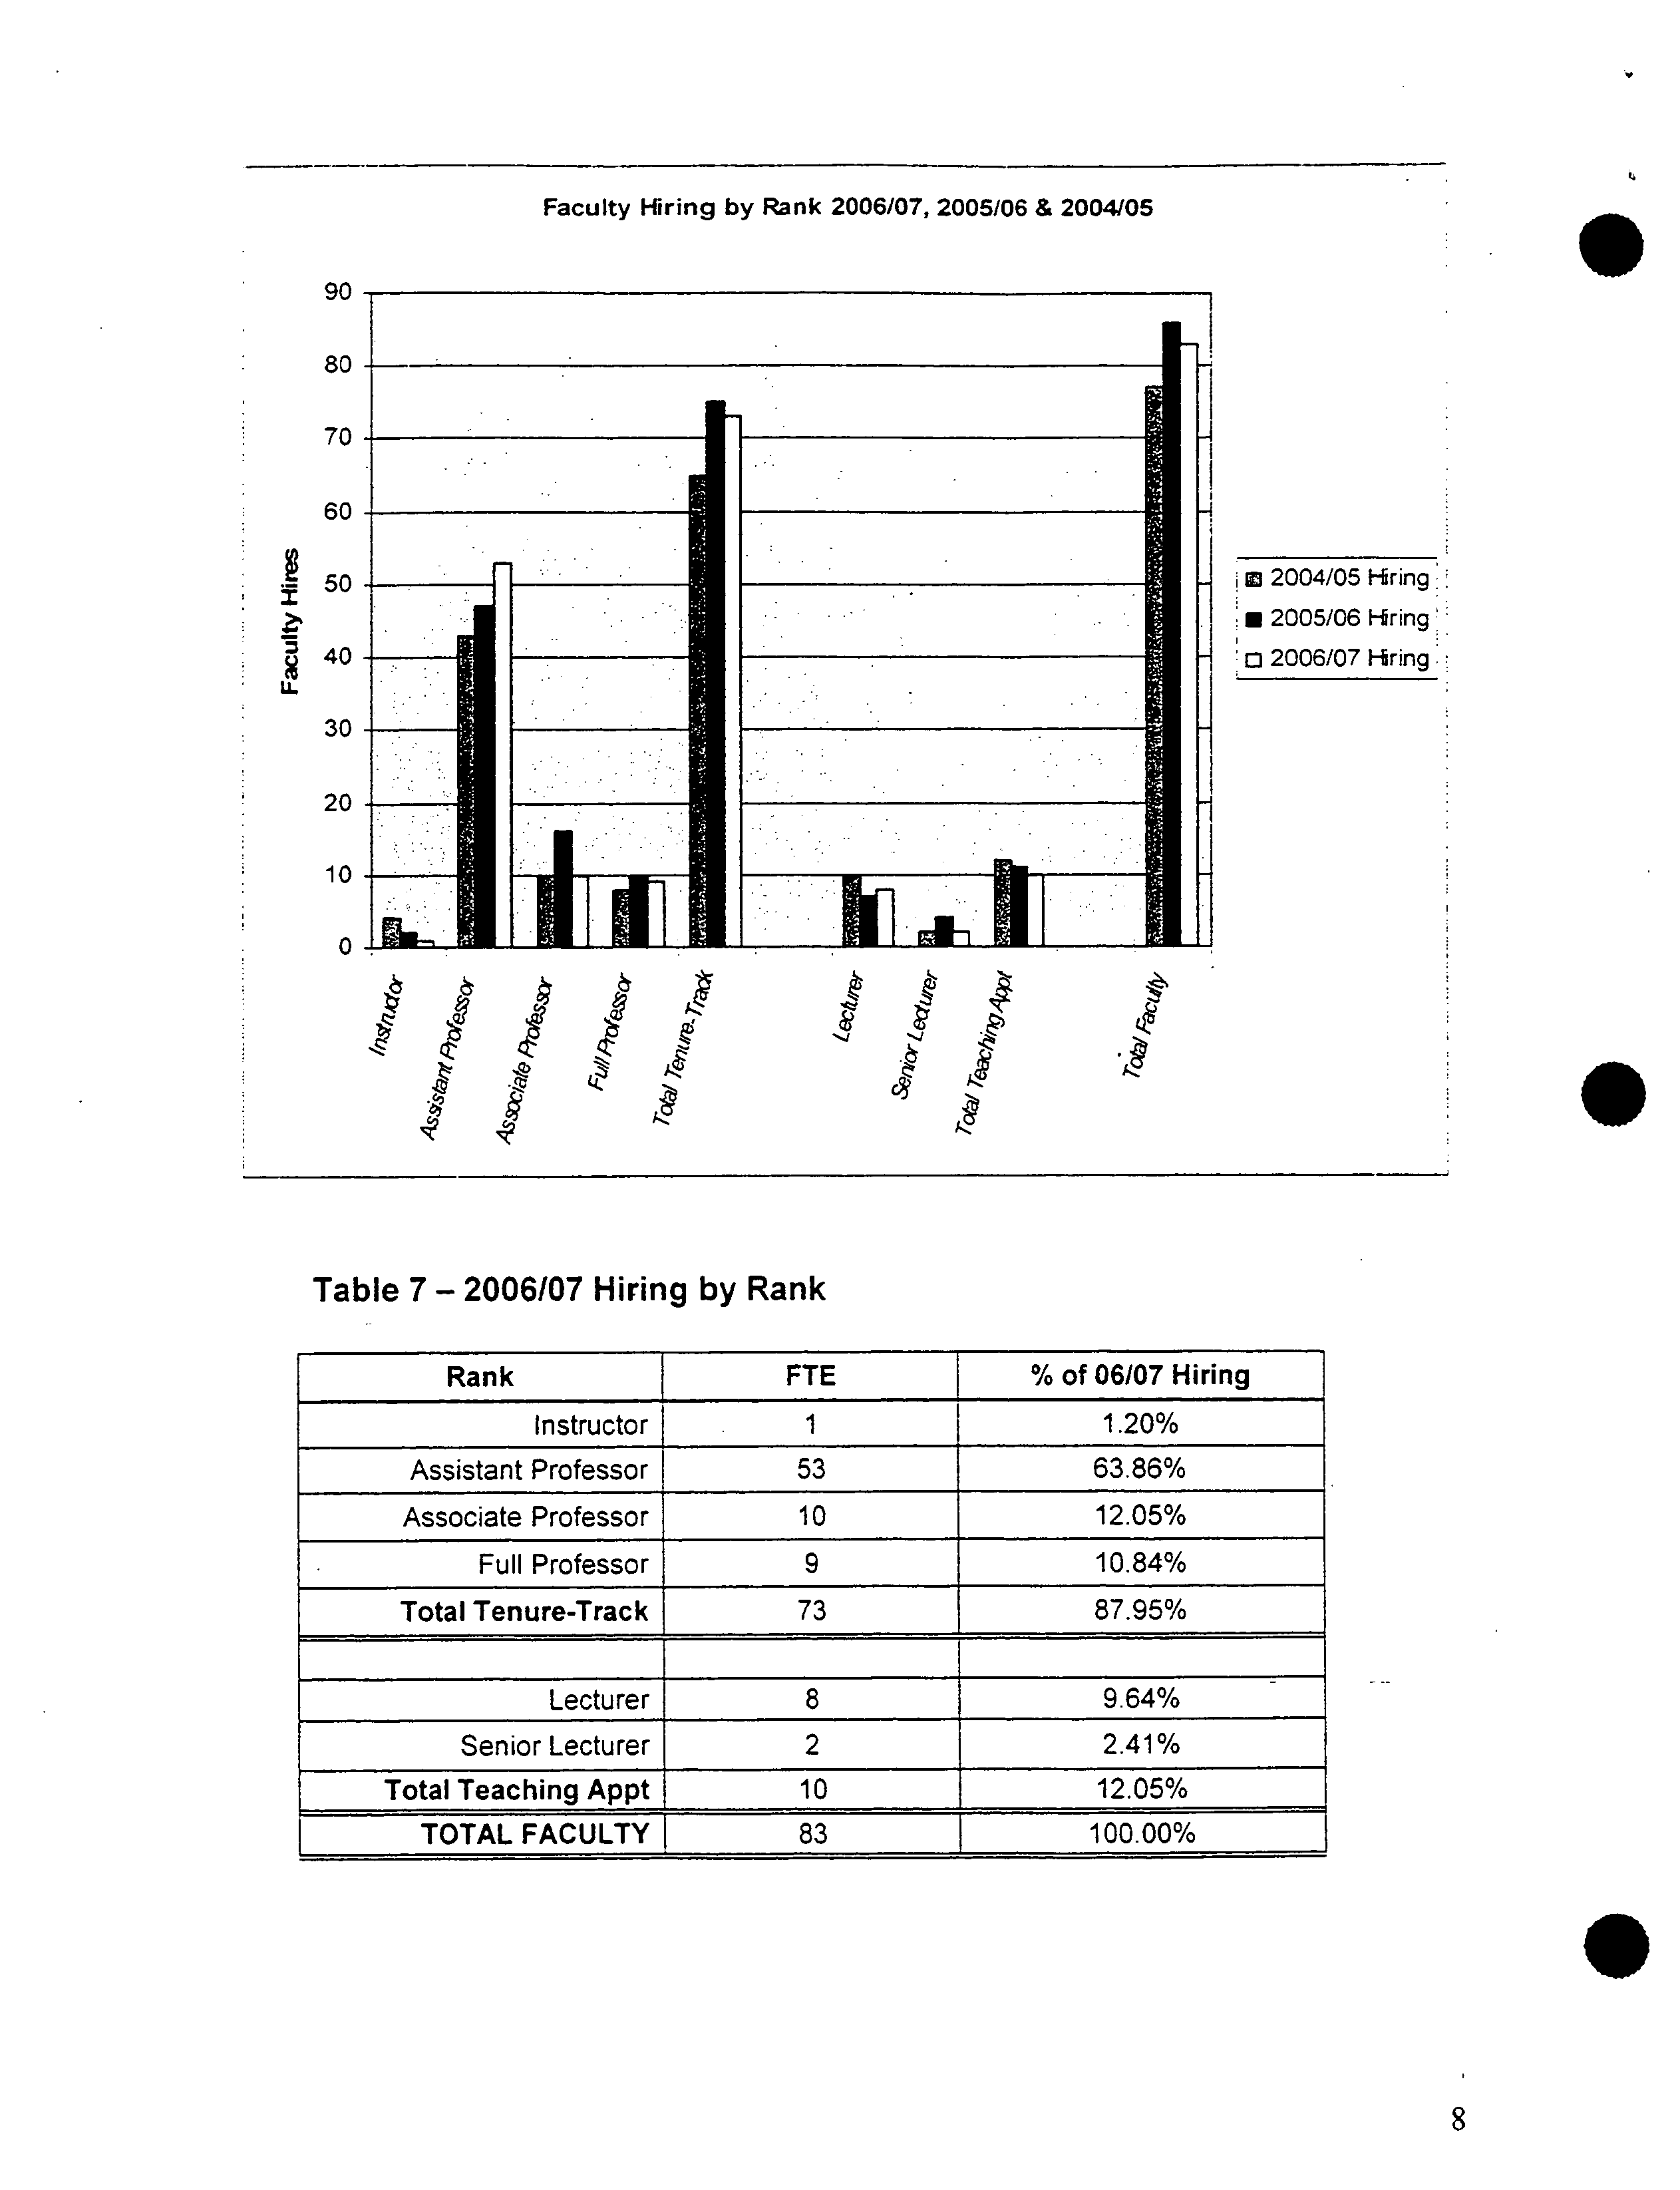
c. Faculty
_
Rank
SFU continues to hire predominantly into the tenure-track ranks (88%) with 64% of
all new hires being at the Assistant Professor level. The chart below shows the hiring
pattern of 2006/07 compared to 2005/06 and 2004/05 and Table 7 indicates the
hiring at each level, both for tenure track and other teaching appointments.
.
7
Faculty Hiring by Rank 2006/07, 2005/06 & 2004105
fin
vv
80
70
60
15°
40
LL
30
O.A
ii
2004/05 Hiring
u
2005/06 Hiring
o
2006/07 Hiring:
Table 7 - 2006107 Hiring by Rank
Rank
FTE
%
of 06/07 Hiring
Instructor
1
1.20%
Assistant Professor
53
63.86%
Associate Professor
10
12.05%
Full Professor
9
10.84%
Total Tenure-Track
73
87.95%
Lecturer
8
9.64% ?
-
Senior Lecturer
2
2.41%
Total Teaching Appt
10
12.05%
TOTAL FACULTY]
83
100.00%
.
8
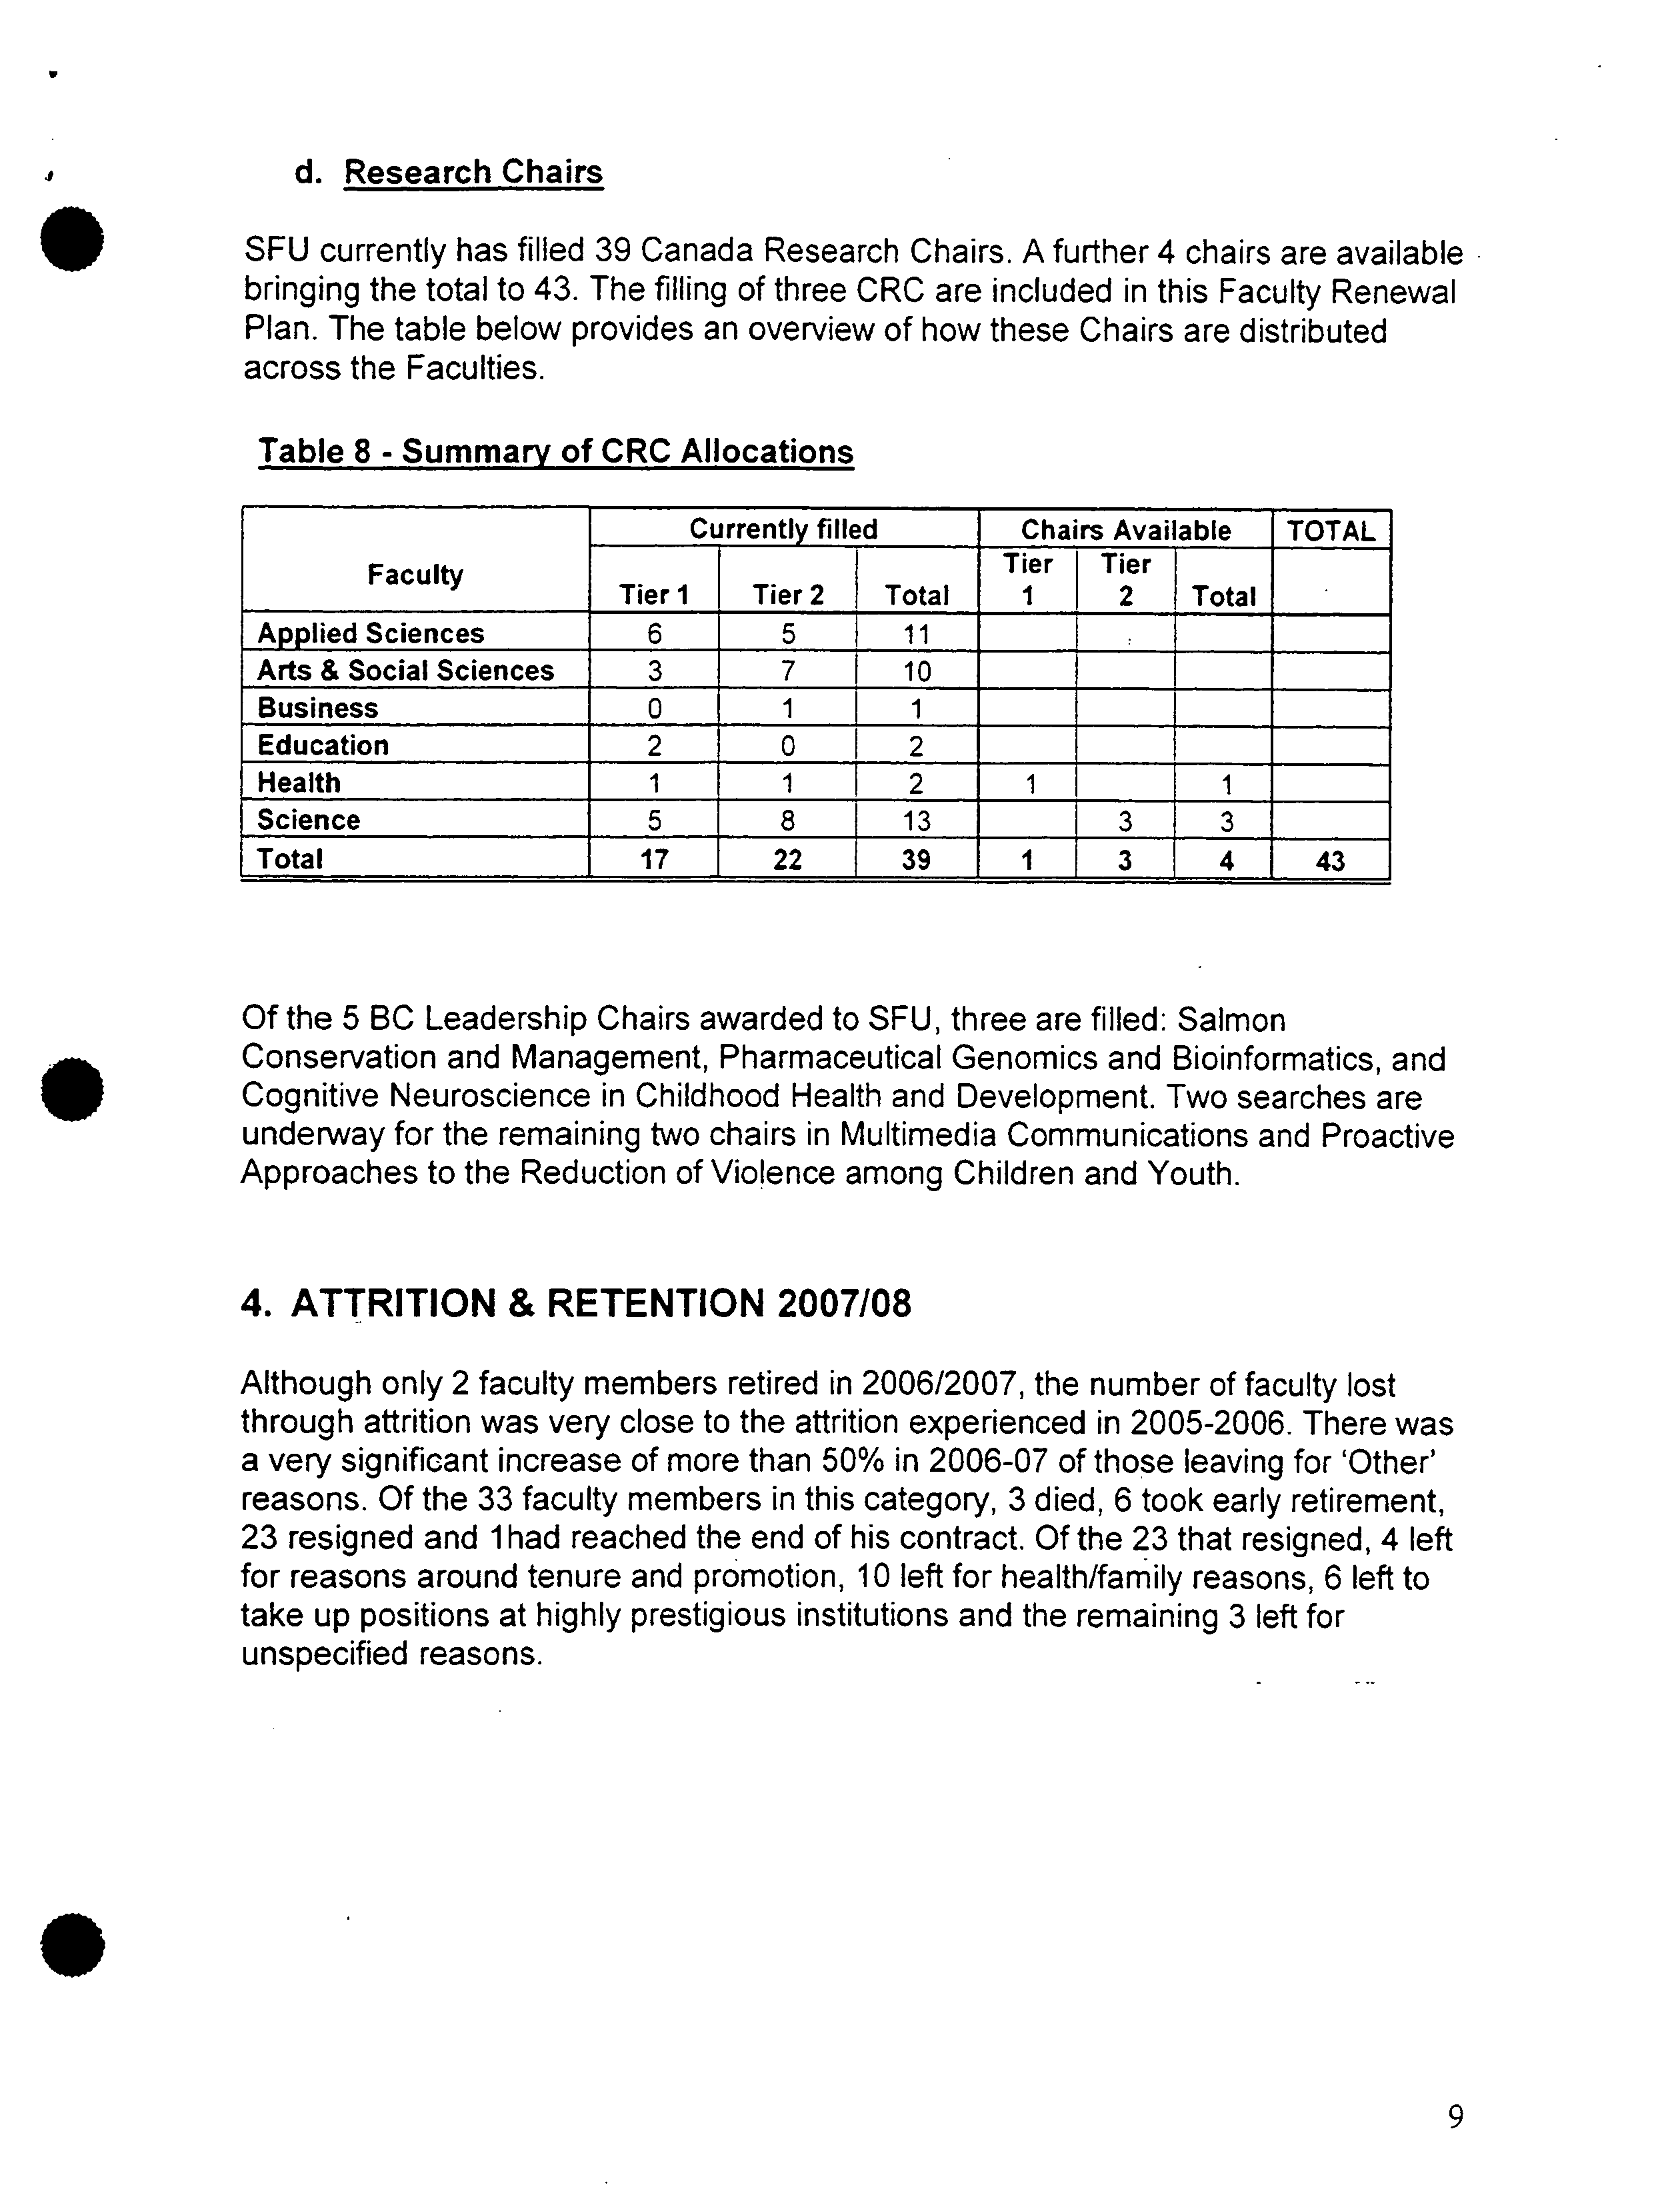
d. Research Chairs
SFU currently has filled 39 Canada Research Chairs. A further 4 chairs are available
bringing the total to 43. The filling of three CRC are included in this Faculty Renewal
Plan. The table below provides an overview of how these Chairs are distributed
across the Faculties.
Table 8 - Summary of CRC Allocations
Faculty
Currently_filled
Chairs Available
TOTAL
Tier I
Tier
2
Total
Tier
1
Tier
2
Total
Applied Sciences
6
5
11
Arts
BusinessHealthEducation&
Social Sciences
2
0
3
1
07
11
10
2
2
1
1
1
1
Science
5
8
13
3
3
Total
17
22
39
1
3
4
__
43
Of the 5 BC Leadership Chairs awarded to SFU, three are filled: Salmon
• ?
Conservation and Management, Pharmaceutical Genomics and Bioinformatics, and
Cognitive Neuroscience in Childhood Health and Development. Two searches are
underway for the remaining two chairs in Multimedia Communications and Proactive
Approaches to the Reduction of Violence among Children and Youth.
4. ATTRITION & RETENTION 2007/08
Although only 2 faculty members retired in 2006/2007, the number of faculty lost
through attrition was very close to the attrition experienced in 2005-2006. There was
a very significant increase of more than 50% in 2006-07 of those leaving for 'Other'
reasons. Of the 33 faculty members in this category, 3 died, 6 took early retirement,
23 resigned and
1
had reached the end of his contract. Of the 23 that resigned, 4 left
for reasons around tenure and promotion, 10 left for health/family reasons, 6 left to
take up positions at highly prestigious institutions and the remaining 3 left for
unspecified reasons.
9
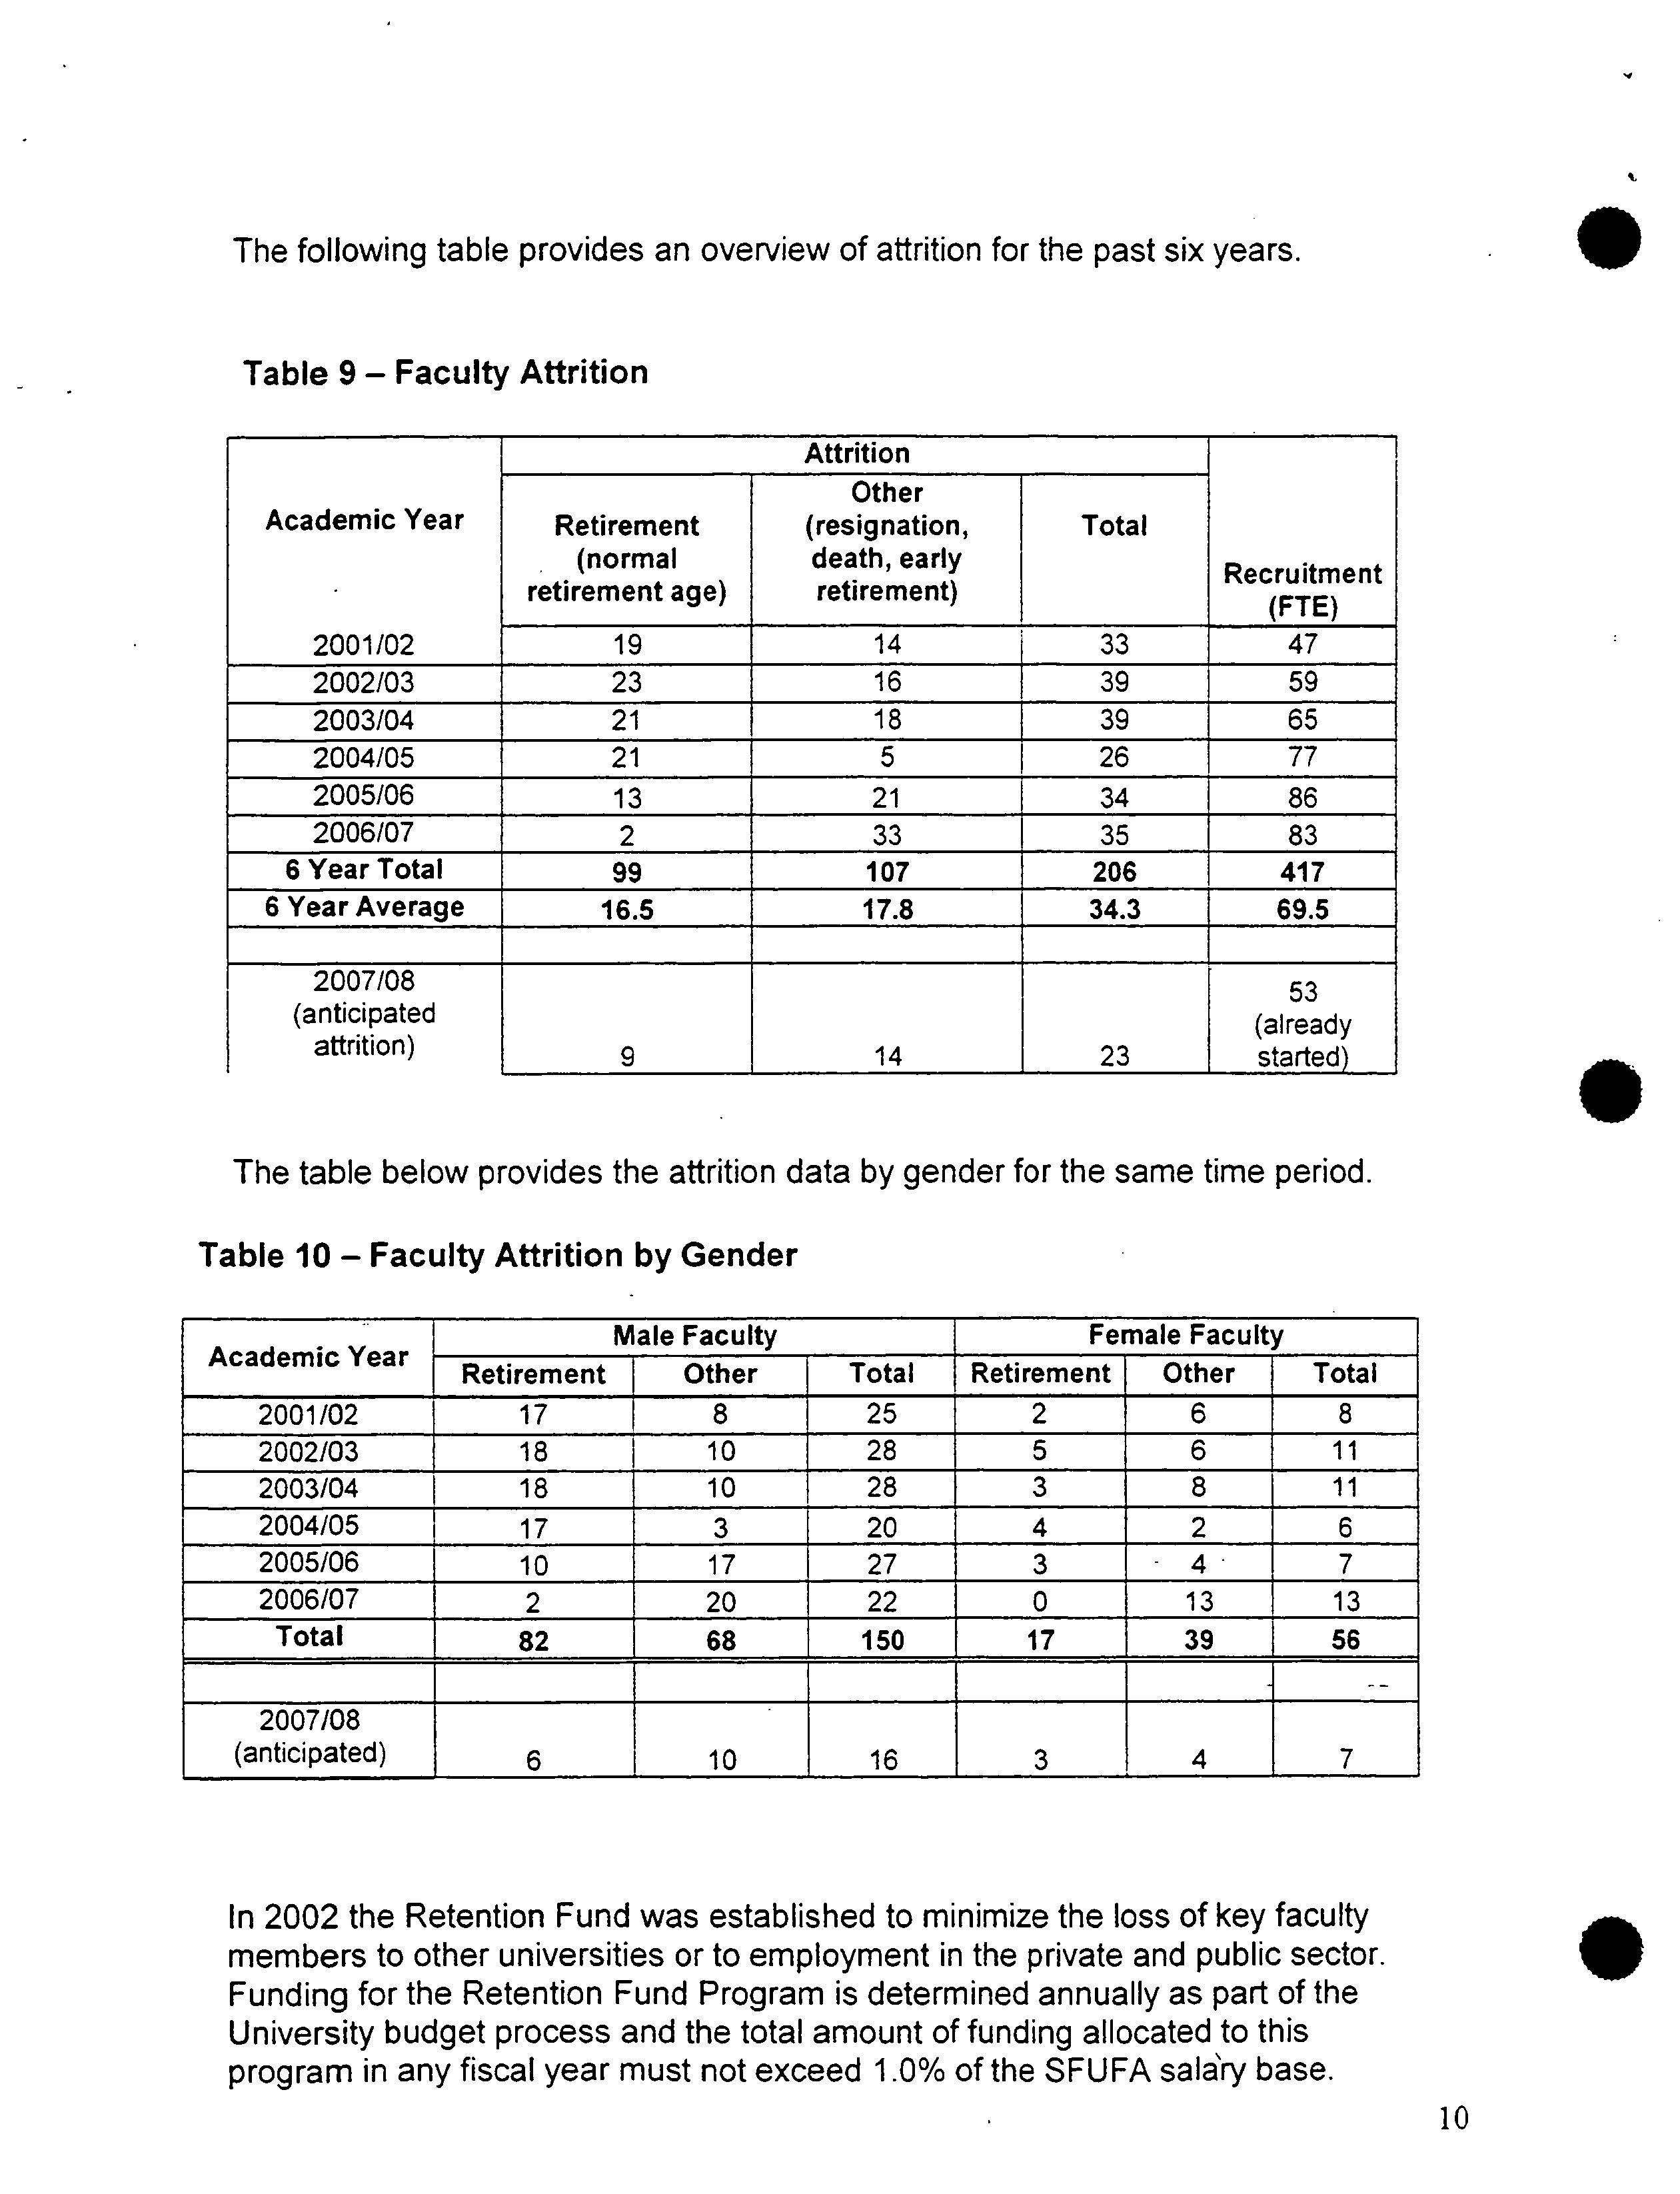
The following table provides an overview of attrition for the past six years.
?
0
Table 9 - Faculty Attrition
Academic Year
2001/02
Attrition
Recruitment
Retirement
(normal
retirement age)
Other
(resignation,
death, early
retirement)
Total
19
14
33
47
2002/03
23
16
39
59
2003/04
21
18
39
65
2004/05
21
5
26
77
2005/06
13
21
34
86
2006/07
2
33
35
83
6
Year Total
99
107
206
417
6 Year Average
16.5
17.8
34.3
69.5
2007/08
(anticipated
attrition)
9
1 ?
14
23
53
(already
started)
The table below provides the attrition data by gender for the same time period.
Table 10 - Faculty Attrition by Gender
Academic Year
Male Faculty
Female
Faculty
Retirement
Other
Total
Retirement
Other
Total
2001/02
17
8
25
2
6
8
2002103
18
10
28
5
6
11
2003/04
18
10
28
3
8
11
2004/05
17
3
20
4
2
6
2005/06
10
17
27
3
4
7
2006/07
2
20
22
0
13
13
Total
82
68
150
17
39
56
2007/08
(anticipated)
6
10
16
3
4
7
In 2002 the Retention Fund was established to minimize the loss of key faculty
members to other universities or to employment in the private and public sector.
Funding for the Retention Fund Program is determined annually as part of the
University budget process and the total amount of funding allocated to this
program in any fiscal year must not exceed 1.0% of the SFUFA sala'ry base.
.
10
•
?
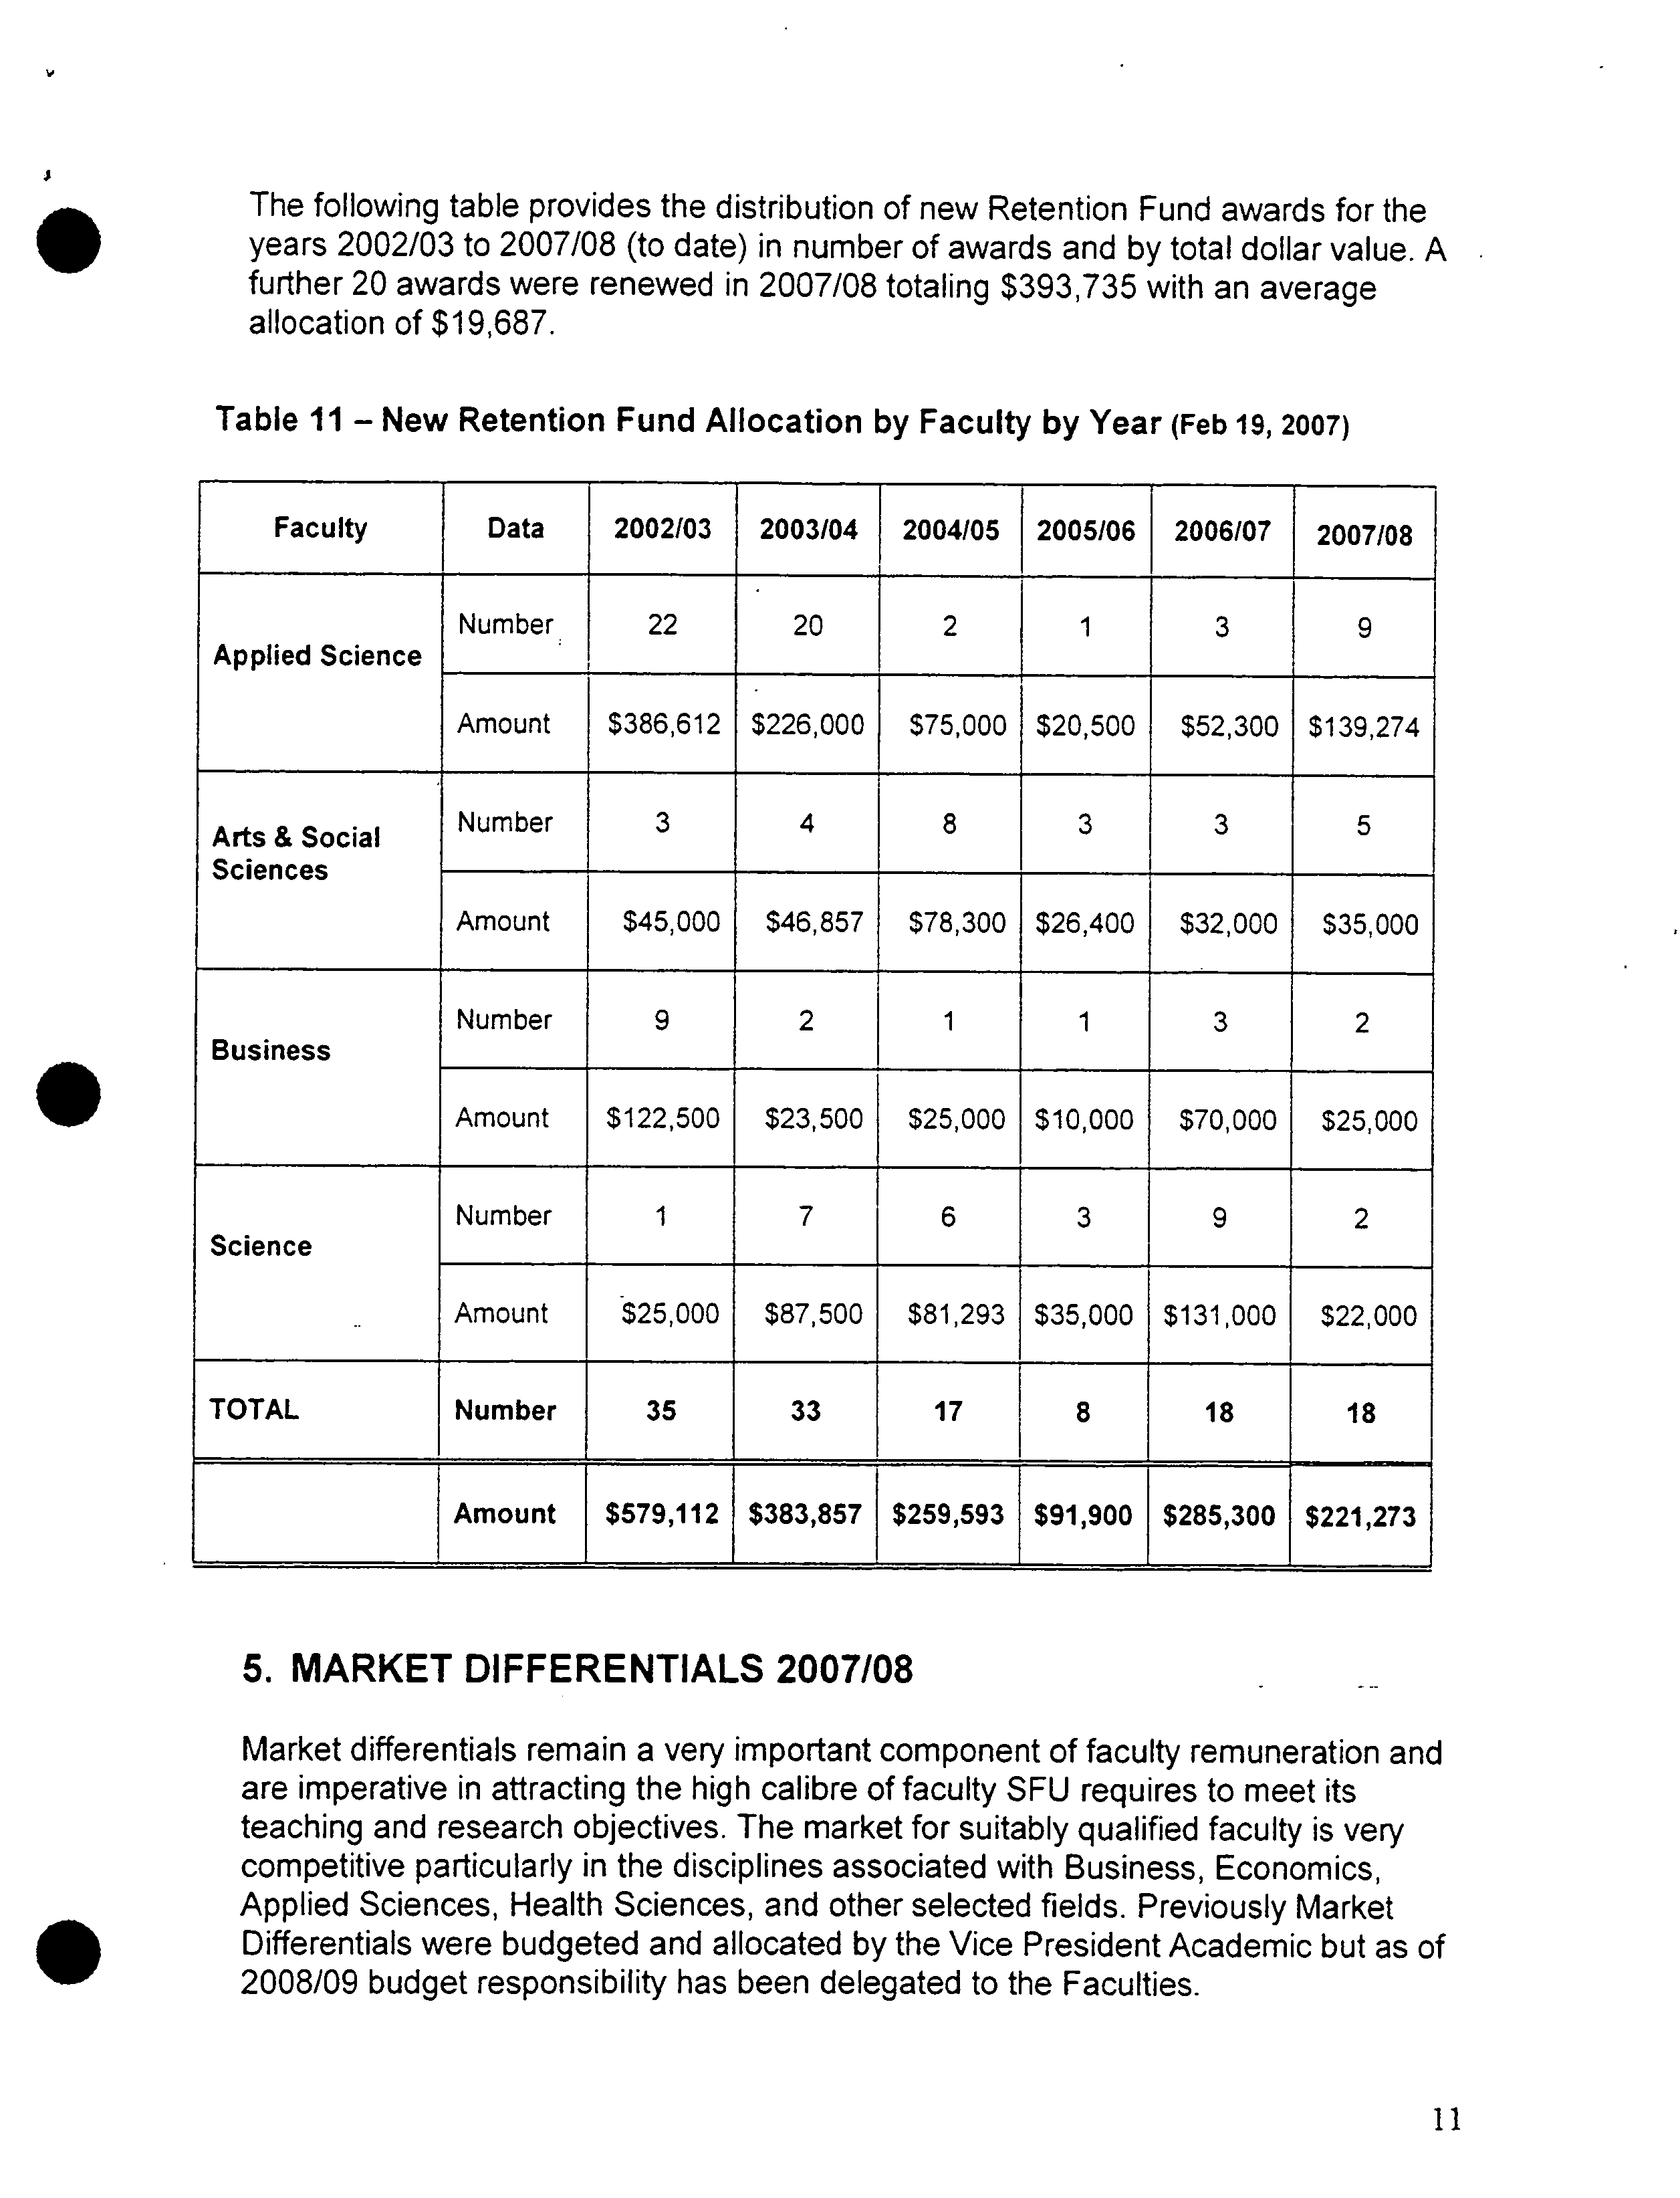
The following table provides the distribution of new Retention Fund awards for the
years 2002/03 to 2007/08 (to date) in number of awards and by total dollar value. A
further 20 awards were renewed in 2007/08 totaling $393,735 with an average
allocation of $19,687.
Table
11 -
New Retention Fund Allocation by Faculty by Year
(Feb
19,
2007)
.
Faculty
Data
2002103
2003/04
2004105
2005/06
2006/07
2007/08
Applied
Science
Number
22
20
2
1
3
9
Amount
$386,612
$226,000
$75,000
$20,500
$52,300
$139,274
Arts & Social
Sciences
Number
3
4
8
3
3
5
Amount
$45,000
$46,857
$78,300
$26,400
$32,000
$35,000
Business
Number
9
2
1
1
3
2
Amount
$122,500
$23,500
$25,000
$10,000
$70,000
$25,000
Science
Number
1
7
6
3
9
2
Amount
$25,000
$87,500
$81,293
$35,000
$131,000
$22000
TOTAL
Number
35
33
17
8
18
18
Amount
$579,112
$383,857
$259,593
$91,900 $285,300
$221,273
5. MARKET DIFFERENTIALS 2007/08
Market differentials remain a very important component of faculty remuneration and
are imperative in attracting the high calibre of faculty SFU requires to meet its
teaching and research objectives. The market for suitably qualified faculty is very
competitive particularly in the disciplines associated with Business, Economics,
Applied Sciences, Health Sciences, and other selected fields. Previously Market
Differentials were budgeted and allocated by the Vice President Academic but as of
2008/09 budget responsibility has been delegated to the Faculties.
11
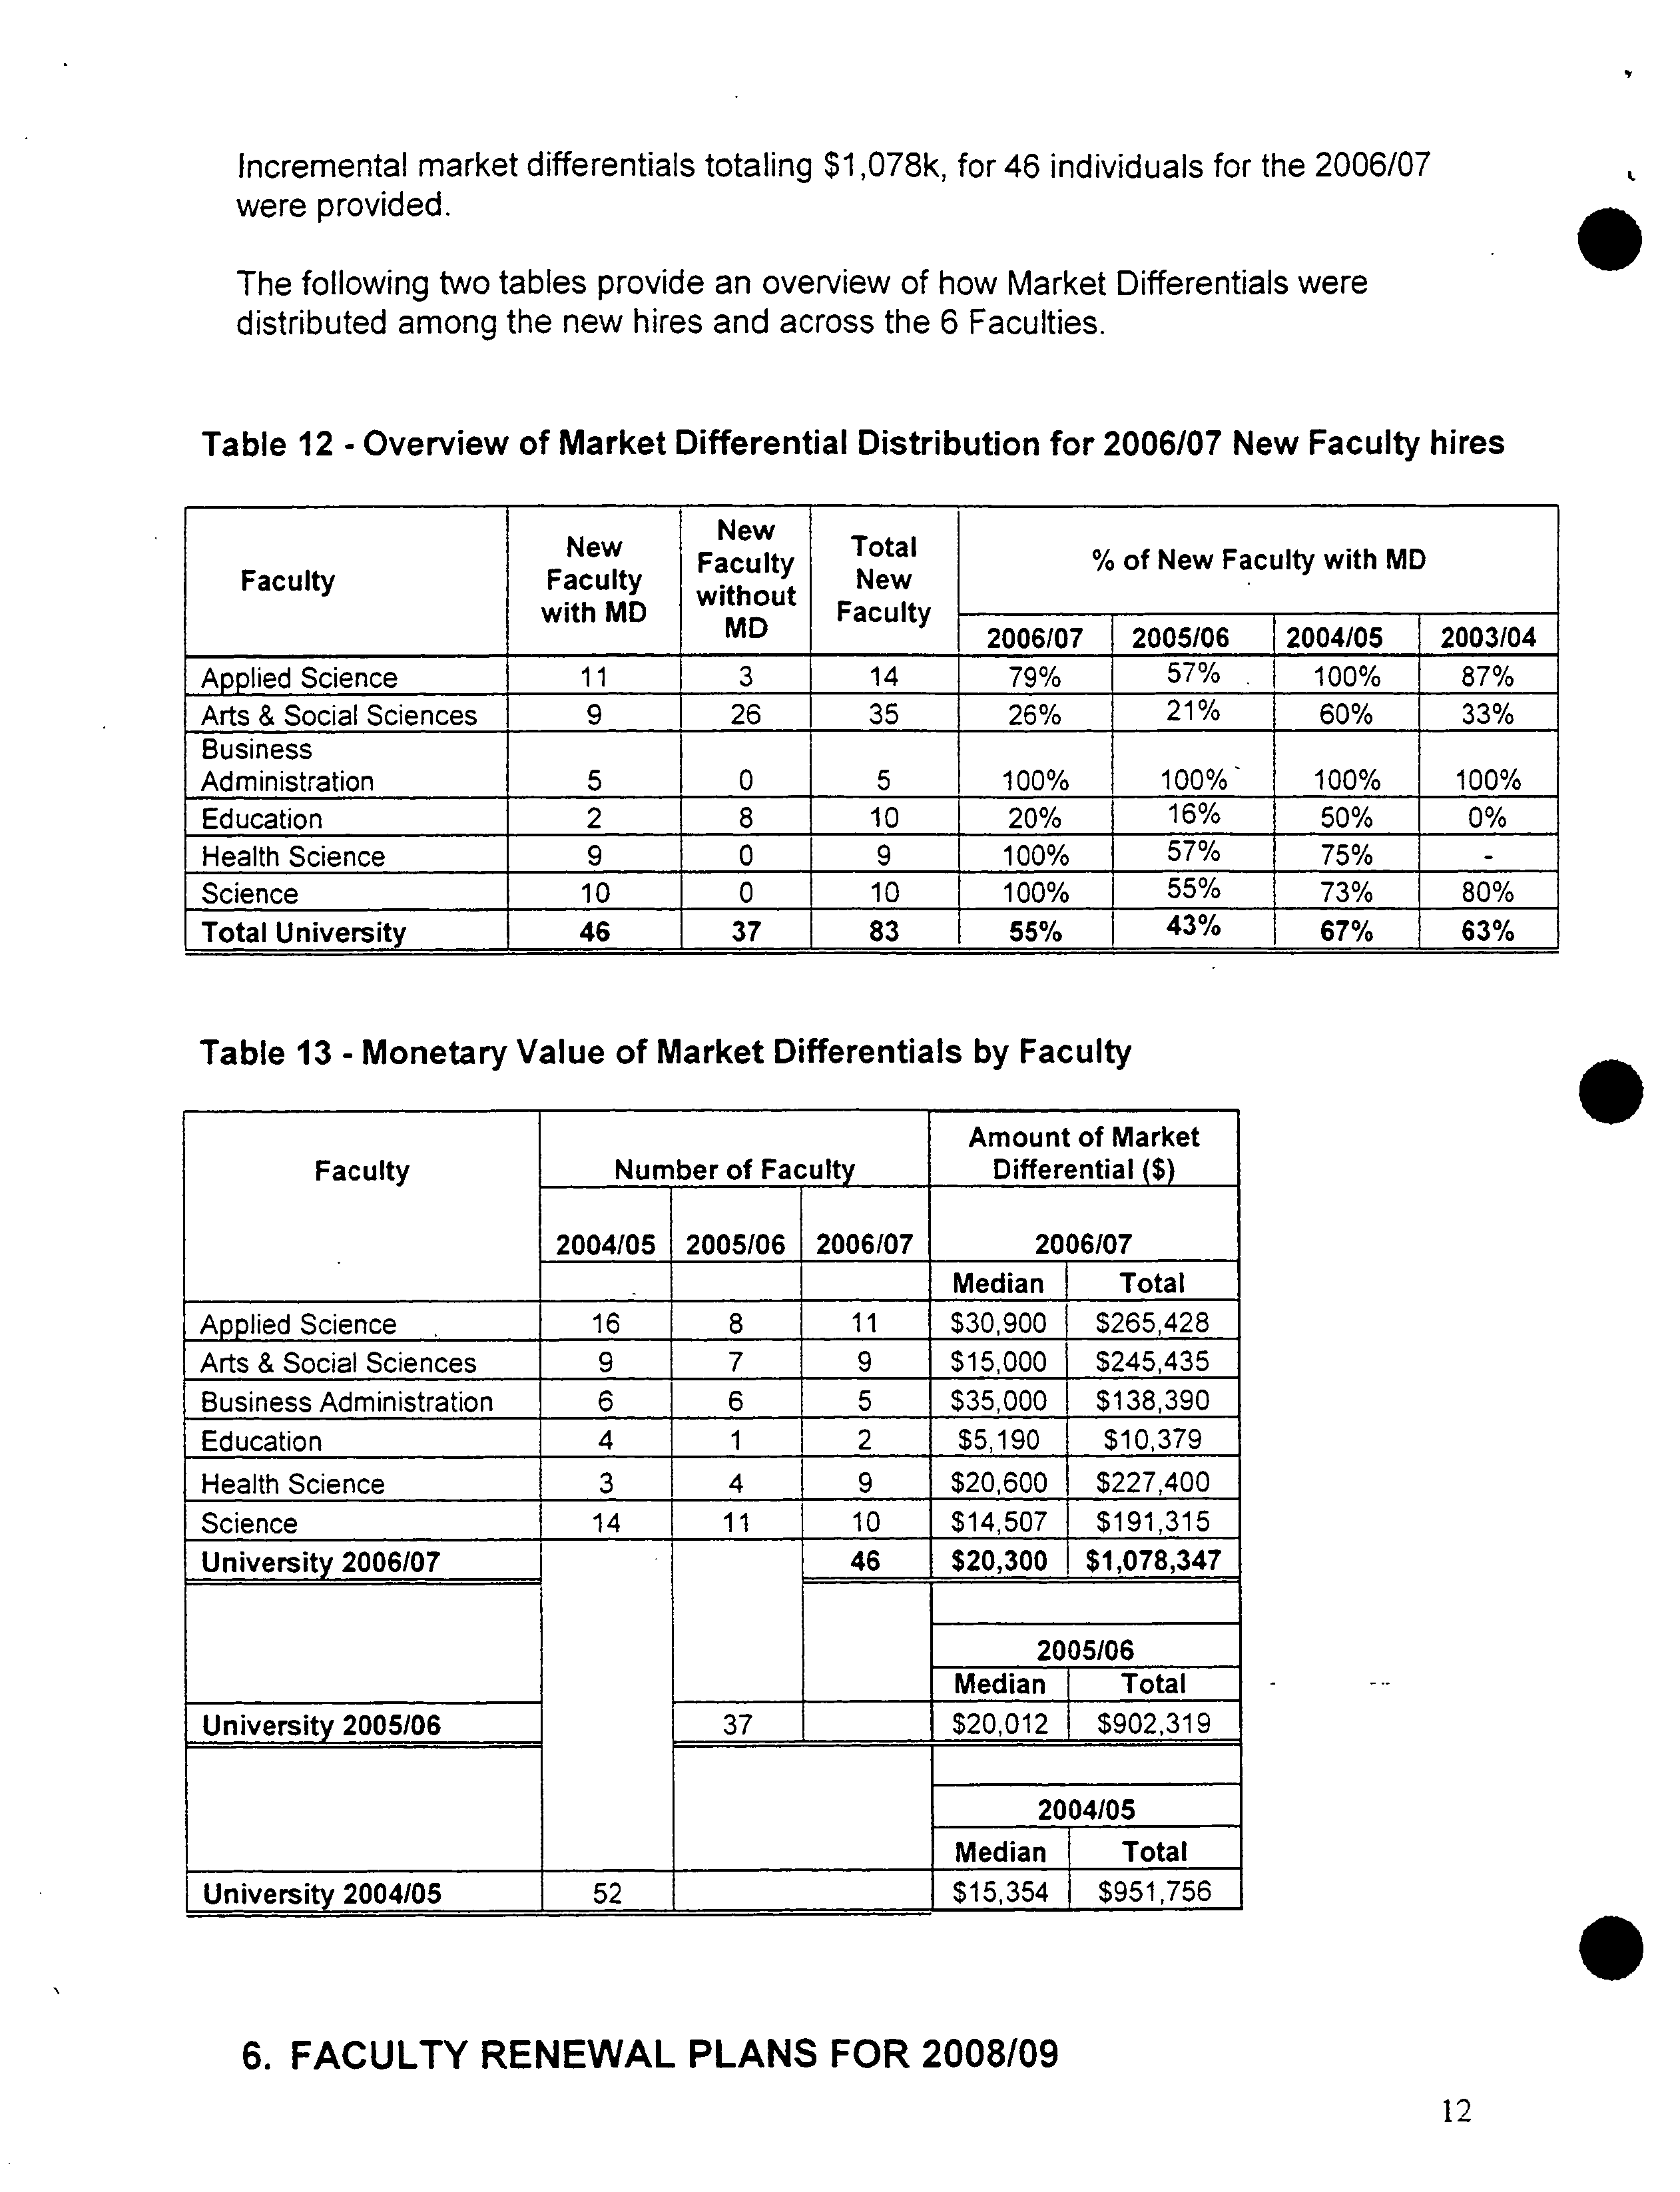
Incremental market differentials totaling $1,078k, for 46 individuals for the 2006/07
were provided.
The following two tables provide an overview of how Market Differentials were
distributed among the new hires and across the 6 Faculties.
Table 12 - Overview of Market Differential Distribution for 2006/07 New Faculty hires
New
New
Faculty
Total
% of New Faculty with MD
Faculty
with
FacultyMD
without
MD
FacultyNew
_________
2006107
2005/06
2004/05
2003104
Applied Science
11
3
14
79%
57%
100%
87%
Arts & Social Sciences
9
26
1 ?
35
26%
21%
60%
33%
Business
Administration
5
0
5
100%
1
?
100%
100%
100%
Education
2
8
10
20%
16%
50%
0%
Health Science
9
0
9
100%
57%
75%
-
Science
10
0
10
100%
55%
73%
80%
Total University
46
37
83
55%
43%
67%
?
1
63%
Table 13 - Monetary Value of Market Differentials by Faculty
Faculty
Number of Faculty
Amount of Market
Differential ($)
2004105 2005106
2006107
2006/07
Median
Total
Applied Science
16
8
11
$30,900
$265,428
Arts & Social Sciences
9
7
9
$15,000
$245,435
Business Administration
6
6
5
$35,000
$138,390
Education
4
1
2
$5,190
$10,379
Health Science
3
4
9
$20,600
$227,400
Science
14
11
10
$14,507
$191,315
University 2006/07
46
$20,300
$1,078,347
2005/06
Median
Total
University 2005/06
37
$20,012
$902,319
2004/05
Median
Total
University 2004/05
52
$15,354
$951,756
.
6. FACULTY RENEWAL PLANS FOR 2008/09
12
• ?
The academic goals contained in the Three Year Academic Plan in 2007 make the
continued recruitment of faculty an imperative for SFU but difficulties in attracting
qualified faculty/are expected to remain for the period covered by this plan.
The Faculty Renewal Plan for 2008/09 has been constructed by adding a number of
hiring categories together. These being;
• 'Previously Approved Positions' that are expected to be filled during the year.
• 'Vacant (or soon to be vacant)' faculty positions that are to be filled during
2008/09.
• 'Growth' related positions. Growth is accommodated in two ways, through new
positions that require additional funding and new positions that are externally
funded.
6.1
Im p
act of the 2.5% bud
g
et cut.
The impact of the 2.5% budget cut to all Faculties resulted in hiring plans being reduced
from 107 positions to the 61 positions included in this report. These cuts are detailed in
the table below.
Table 14 - Positions cut due to budget constraints
S
Faculty Recruitment 2008109
Initial
Post
Budget
Cut
Cut positions as
Faculty
Prediction
Prediction
positions
a % of Initial
(Oct 07)
(Jan 08)
Prediction
Science -•
16
11
5
31.3%
Business
8
4
4
50.0%
Education
7
1
6
85.7%
Arts & Social Sciences
30
18
12
40.0%
Health Science
20
16
4
22.0%
Applied Science
26
11
15
.
?
57.7%
Total
107
61
46
43.01/6
6.2 Previousl
y
Approved Recruitment
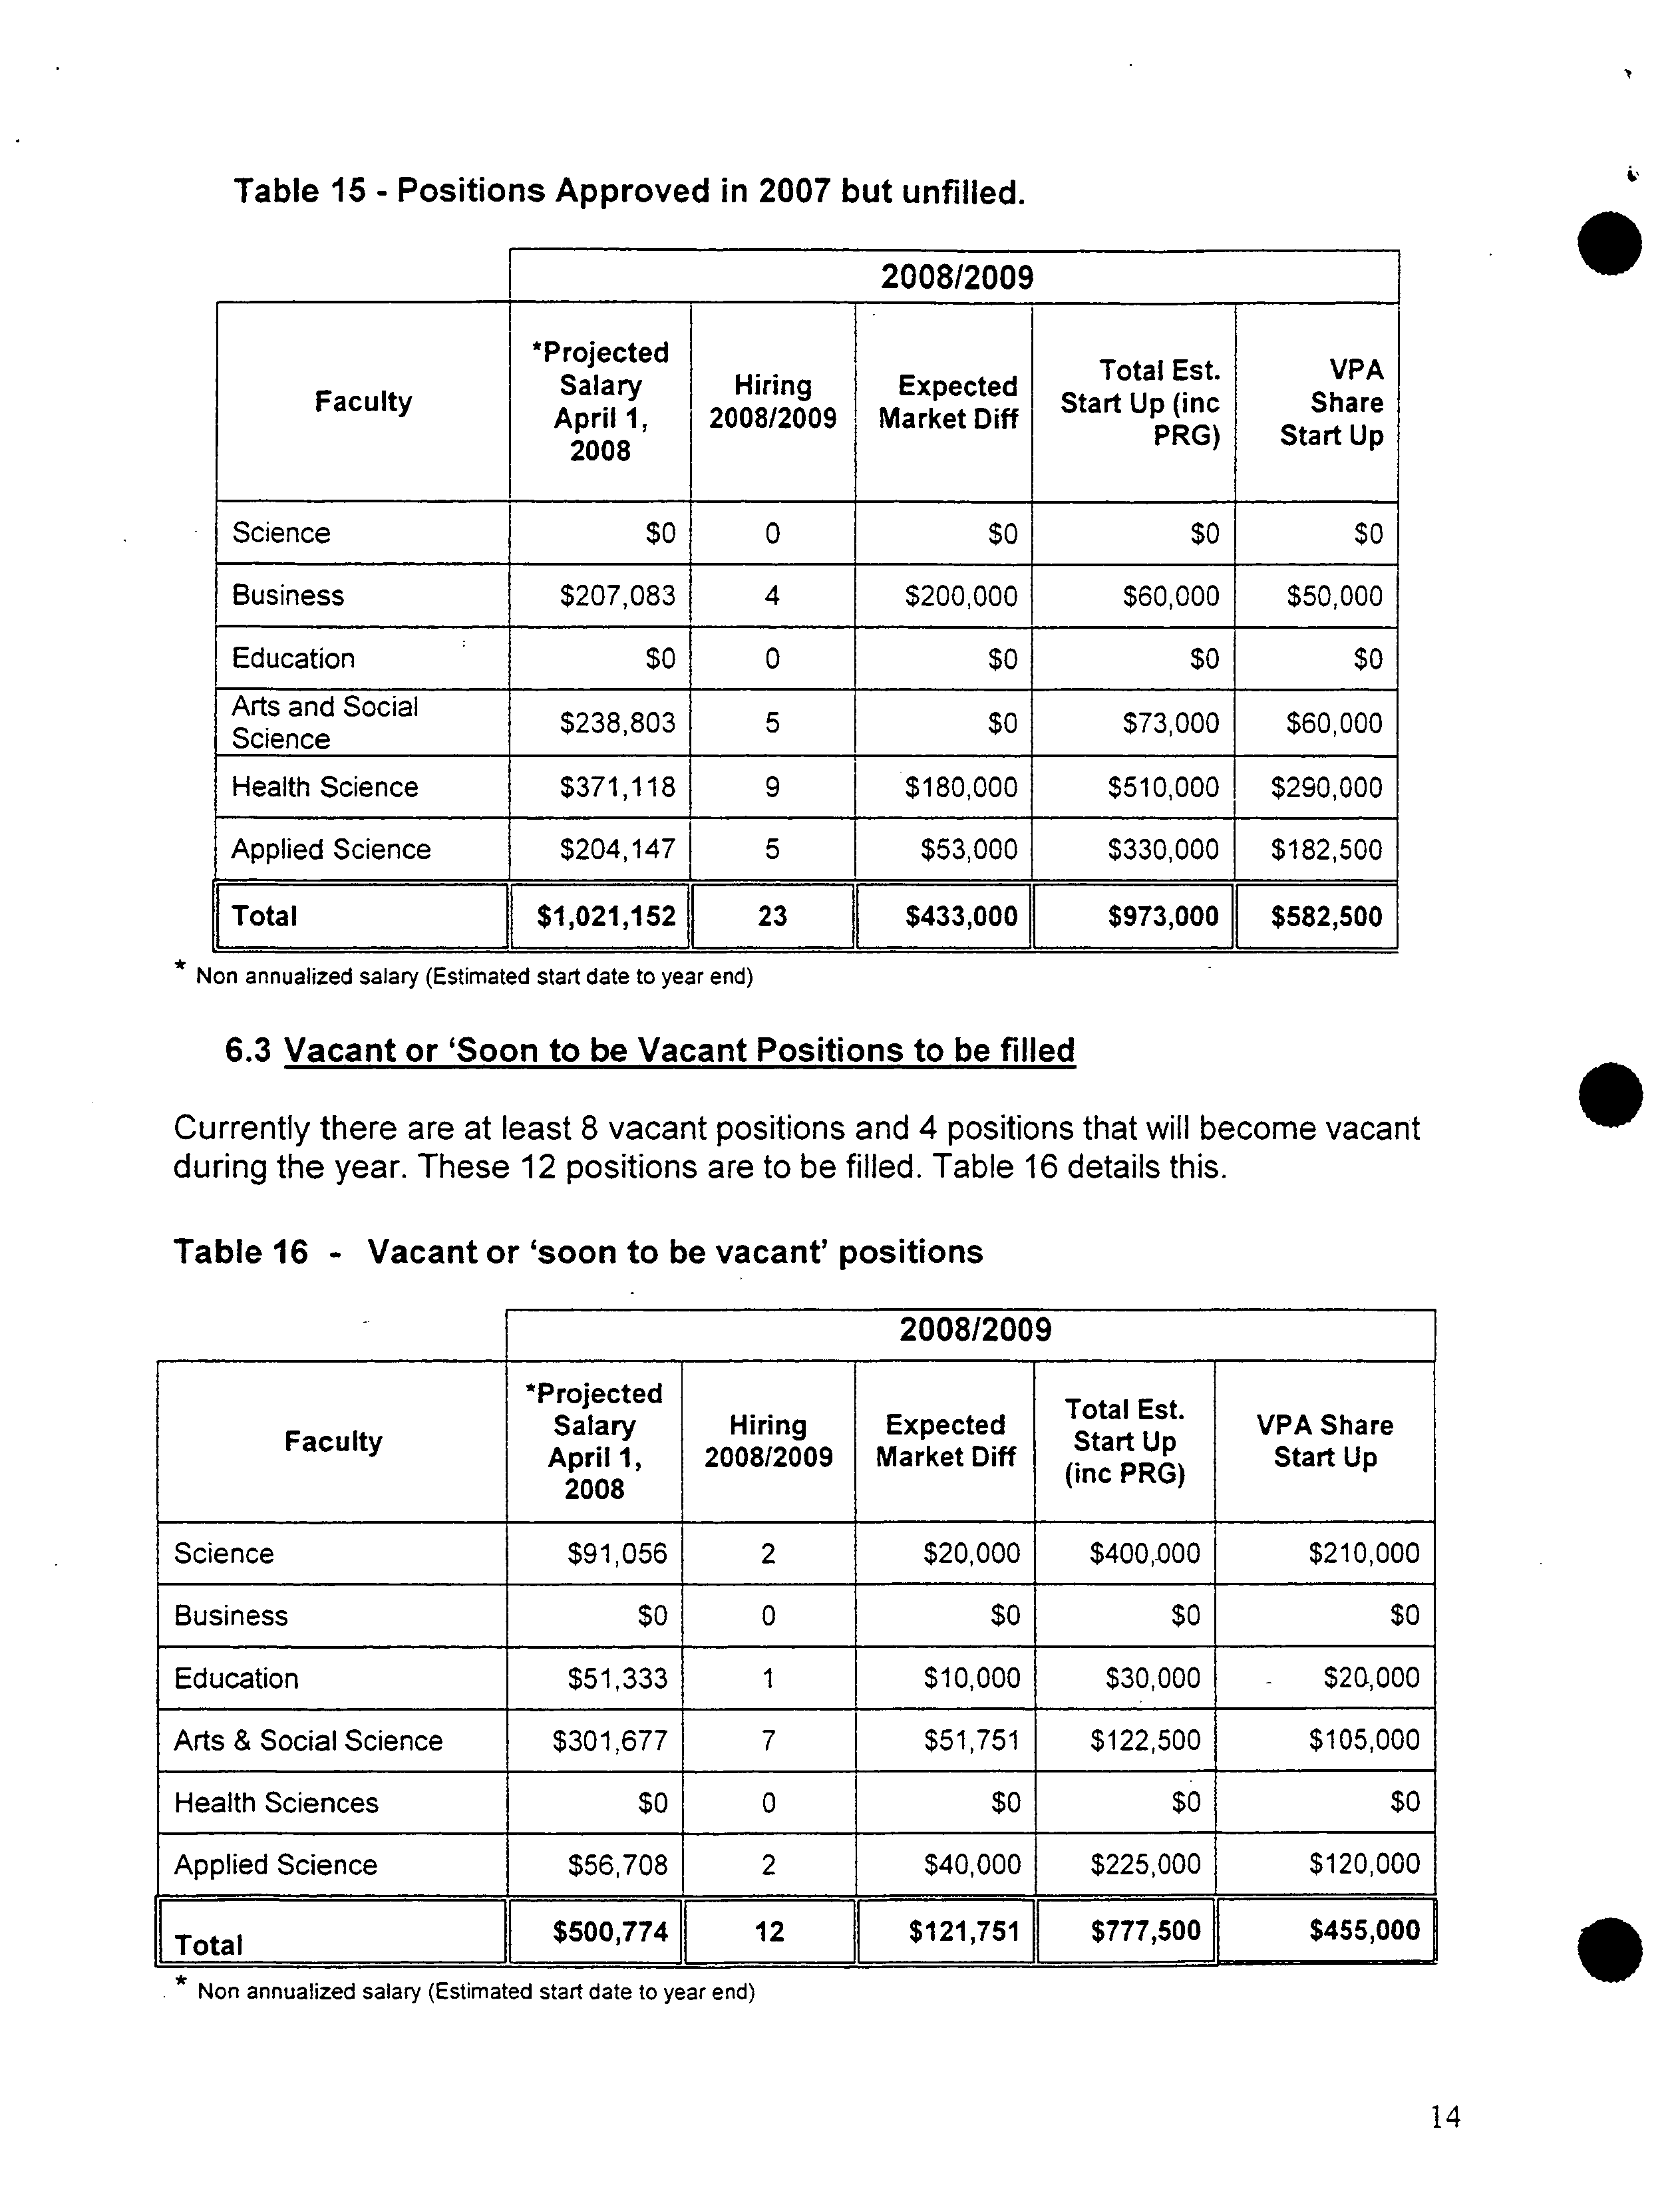
As shown in the Table below at least 23 positions that were either approved by the
Board of Governors or the Vice President Academic for 2007/08 have not been filled to
10 ?
date but will be filled during the balance of 2007/08 or during the 2008/09 year.
Searches for these positions are proceeding.
13
Table 15 - Positions Approved in 2007 but unfilled.
2008/2009
*Projected
Salary
Hiring
Expected
Total Est.
VPA
Faculty
April
1,
2008/2009
Market Duff
Start Up (Inc
Share
2008
PRG)
Start
Up
Science
$0
0
$0
$0
$0
Business
$207,083
4
$200,000
$60,000
$50,000
Education
$0
0
$0
$0
$0
Arts and Social
Science
$238,803
5
$0
$73,000
$60,000
Health Science
$371,118
9
$180,000
$510,000
$290,000
Applied Science
$204,147
5
$53,000
$330,000
$182,500
Total
$1,021,152
J
D
3
$433,000
$973,000
$582,500
*
Non annualized salary (Estimated start date to year end)
.
6.3 Vacant or 'Soon to be Vacant Positions to be filled ?
0
Currently there are at least 8 vacant positions and 4 positions that will become vacant
during the year. These 12 positions are to be filled. Table 16 details this.
Table 16 - Vacant or 'soon to be vacant' positions
2008/2009
*projected
Total Est.
Faculty
Salary
Hiring
Expected
Start Up
VPA Share
April 1,
200812009
Market Duff
(Inc
PRG)
Start Up
2008
Science
$91,056
2
$20,000
$400,000
$210,000
Business
$0
0
$0
$0
$0
Education
$51,333
1
$10,000
$30,000
- ?
$20,000
Arts &Social Science
$301,677
7
$51,751
$122,500
$105,000
Health Sciences
$0
0
$0
$0
$0
Applied Science
$56,708
2
$40,000
$225,000
$120,000
Total
?
IF
$500,774
^I
12
$121,751
$777,500
$455,000
*
Non annualized salary (Estimated start date to year end)
14
6.4 Positions for Growth
S
To support the strategic areas of Health Sciences, the Surrey campus as well as the
new undergraduate curricula (WQB) and the genomic initiative (GSI) a further 14
positions (13 FTE5) are required. It is proposed that these be funded from the
Operating Budget of the Faculties.
Table
17 -
New positions to be funded from the Operating Budget
S
2008/2009
*Projected
Salary
Hiring
Expected
Total Est.
VPA
Faculty
April
1,
2008/2009
Market Duff
Start Up (inc
Share
2008
PRG)
Start Up
Science
$266,595
6
$57,500
$170,000
$115,000
Business
$0
0
$0
$0
$0
Education
$0
0
$0
$0
$0
Arts & Social
Sciences
$119,086
3
$0
$52,500
$45,000
Health Science
$127,000
2
$0
$0
$0
Applied Science
$119,086
3
$90,000
$330,000
$180,000
Total
$631,766
14
$147,500 11
$552,500
$340,000
* Non annualized salary (Estimated start date to year end)
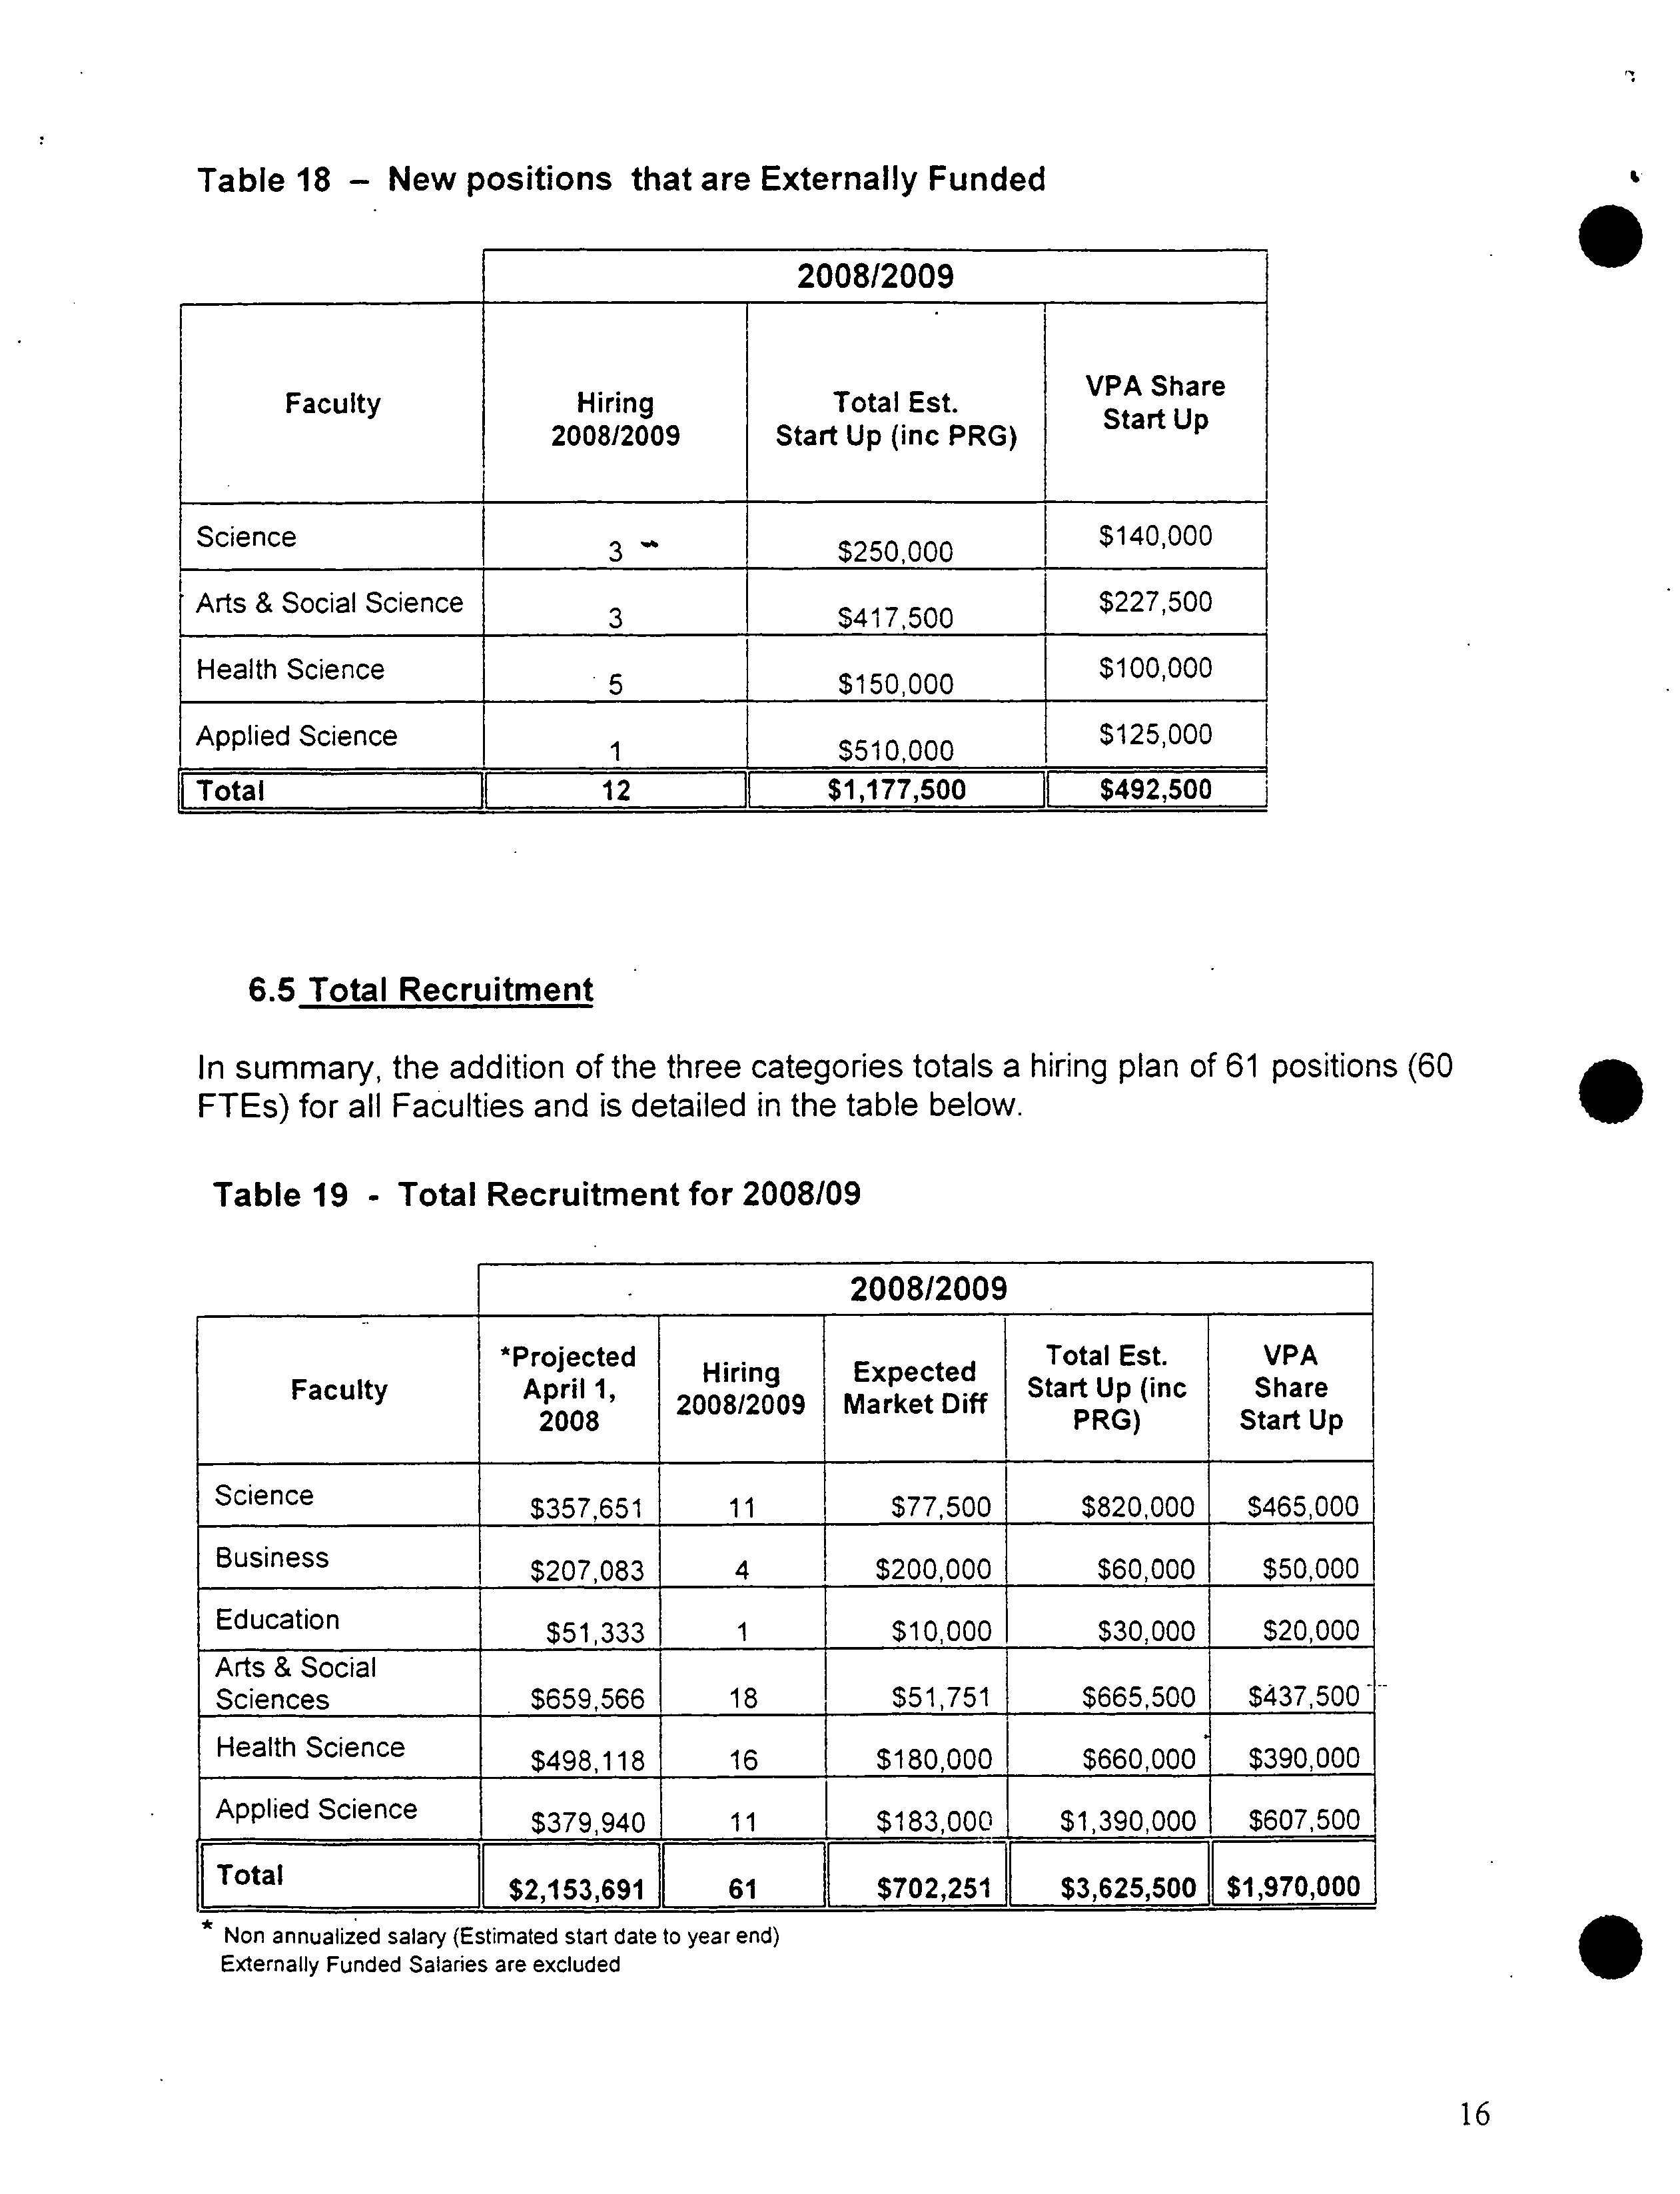
In addition to these 14 a further 12 positions which are externally funded will be
recruited. These positions include 3 Canada Research Chairs, 2 LEEF Chairs, 1 ClEF
Chair and the Autism Chair funded through Health Canada. These are shown by
Faculty in the table below.
15
Table 18 - New positions that are Externally Funded
200812009
Faculty
Hiring
Total
Est.
VPA Share
Start Up
200812009
Start Up (inc PRG)
L
Science
3 _
-
$250,000
$140,000
Arts & Social Science
3
$417500
[ ?
$227,500
Health Science
5
$150,000
$100,000
Applied Science
1
$510,000
$125,000
Total
I ?
12
$1,177,500
$492,500
.
6.5TotalRecruitment
In summary, the addition of the three categories totals a hiring plan of 61 positions (60
FTEs) for all Faculties and is detailed in the table below.
?
0
Table 19 - Total Recruitment for 2008/09
2008/2009
*Projected
Hiring
Expected
Total
Est.
VPA
Faculty
April 1,
2008/2009
Market
Duff
Start Up (inc
Share
2008
PRG)
Start Up
Science
$357,651
11
$77,500
$820,000
$465,000
Business
$207,083
4
$200,000
$60,000
$50,000
Education
$51,333
1
$10,000
$30,000
$20,000
Arts & Social
Sciences
$659,566
18
1 ?
$51,751
$665,500
$437,500
Health Science
$498,118
16
$180,000
$660,000
$390,000
Applied Science
$379,940
11
$183,00O
$1,390,000
$607,500
[Total
$2,153,691
61
$
$3,625,500
$1,970,000
* Non annualized salary (Estimated start date to year end)
Externally Funded Salaries are excluded
S
16
1.
The University is seeking the approval by the Academic Operations
Committee of the Board of Governors to recruit 61
p ositions (60 FTEs),
excluding academic positions associated with the hiring of senior
academic administrators.*
Of these positions:
23 positions (23 FTEs) are positions that were previously approved
but not filled
12 Positions (12 FTEs) are currently vacant or will become vacant
during the year
14 Positions (13 FTEs) are new positions required to support the
strategic interests
12 positions (7 FTE5) are new positions that will be funded
externally
2.
The University is also seeking approval by the Academic Operations
Committee of the Board of Governors to further expand the faculty
complement by up to 6 FTE during the 2007/08 fiscal year should
strategic opportunities arise for the University.*
Such opportunities may include spousal appointments to ensure the
.
?
University is successful in its recruitment activities, unanticipated student
demand in critical areas, or opportunities for prestigious appointments.
This request is supported by the following amounts that have been included in
the Budget for 2008/09, the total being $7.9 million:
Recruitment Costs $ .7 million
Relocation Support $ .7 million
New Market Differentials $ .7 million
Start Up, P R Grants and Renovation Costs $ 3.63 million
Base Salary Cost $ 2.15 million for 2008/09
7. CONCLUSION
One of the main Goals of the Vice President Academic's - Three Year Academic
Plan is to ensure that faculty resources are in place and supported to enable SFU to
meet its research and teaching commitments and objectives. The current financial
situation makes this very difficult and should the revenue of SFU not be increased
substantially our teaching resources may become misaligned with the student
enrolment growth and this may put our teaching quality at risk.
* Approved by Academic Operations Committee March 20, 2008.
17