SFU
To:
Senate
Simon Fraser University
Institutional Research and Planning
From:
S.12-137
Jacy Lee. Director \J^—
'
Institutional Research and
Planning (IRP)
Subject: IRP Reports for Information
Date:
August 22, 2012
At a meeting of Senate held on March 7, 2011, Senator Paul Percival requested that relevant IRP
reports, such as, the annual Grades Report be brought to Senate for information.
Attached are two reports for information:
•
2011/12 Grades Report: This report is prepared once a year and it summarizes
student course grades at the University over a ten year period. The 2011/12 Grades
Report covers the period from 2002/03 to 2011/12. Attached is the Summary Report.
The full report is located at IRP's website at:
http://www.sfu.ca/content/dam/sfu/irp/students/qrades report/qrades.report.pdf
•
2011
Undergraduate Student Survey lUGSS) Report: The UGSS survey is conducted
every fall term. The attached Highlights report presents a summary of key findings
from the Fall 2011 survey. Topics covered are seLected in consultation with Faculties,
Student Services and other administrative units of the University. The topics included:
course availability, teaching and curriculum, student engagement and selected
services, such as Facilities, use of campuses and the Library and Student Learning
Commons. The full report is located at:
http://www.sfu.ca/content/dam/sfu/irp/surveys/uqss/uqss2011report.pdf
Enclosure
liiMJuuion.il K.-Ni-.u.li iiul I'l.iitniiij;. Sinnwi 1r.wi l'ni\iT>ii\. NXSN l'iuu-r.it\ l)n-
e.
Ikui
1 77S.TW.>"»i i 1 TVX/tO.'o'J*'I
\\\\ s|u.t.i iip
K. IK". (..iiu.l.i V5A IS'>
SFU
Simon Fraser University
Institutional Research and Planning
2011/12 Grades Report:
Summary
Historical Distribution of
Undergraduate and Graduate Course Grades
2002/03 to 2011/12
Prepared by
Janice Wiebe, Program Assistant
Jessica Tilley, Analyst
Institutional Research and Planning
Summer 2012
2-
2012-08-22
2011 /12 SFU GRADES REPORT: SUMMARY
Page 3
Table of Contents
Introduction
4
Definitions
and Notes
4
Analysis
5
Undergraduate Course Grades
5
Lower Division
5
Upper Division
9
Undergraduate Course Grades byStudent
Faculty
13
Graduate Course Grades
15
itiillon.il kcM.u:vh .uul l'i.innms!. Shimi I mh". l':m-.TMt\ . SNNS l'ni\ci-r\ I ':i•>••.•. H;ii;i,H-\ . Ill '. ( :.ir..ui.i V.iA IS'
T7"S".V.tol ! I: ",S.7S_V,.Vi>i ^uu.stu.,.. i;p
3
2012-08-22
2011/12 SPU GRAPES REPORT: SUMMARY
Page 4
I - Introduction
This report summarizes student course grades at Simon Fraser University over the ten
year period from 2002/03 to 2011/121. The full report, which presents the full grade distributions
in both tabular and graphical formats, is available online, here:
https://www.sfu.ca/content/dam/sfu/irp/students/qrades report/grades.report.pdf.
II - Definitions and Notes
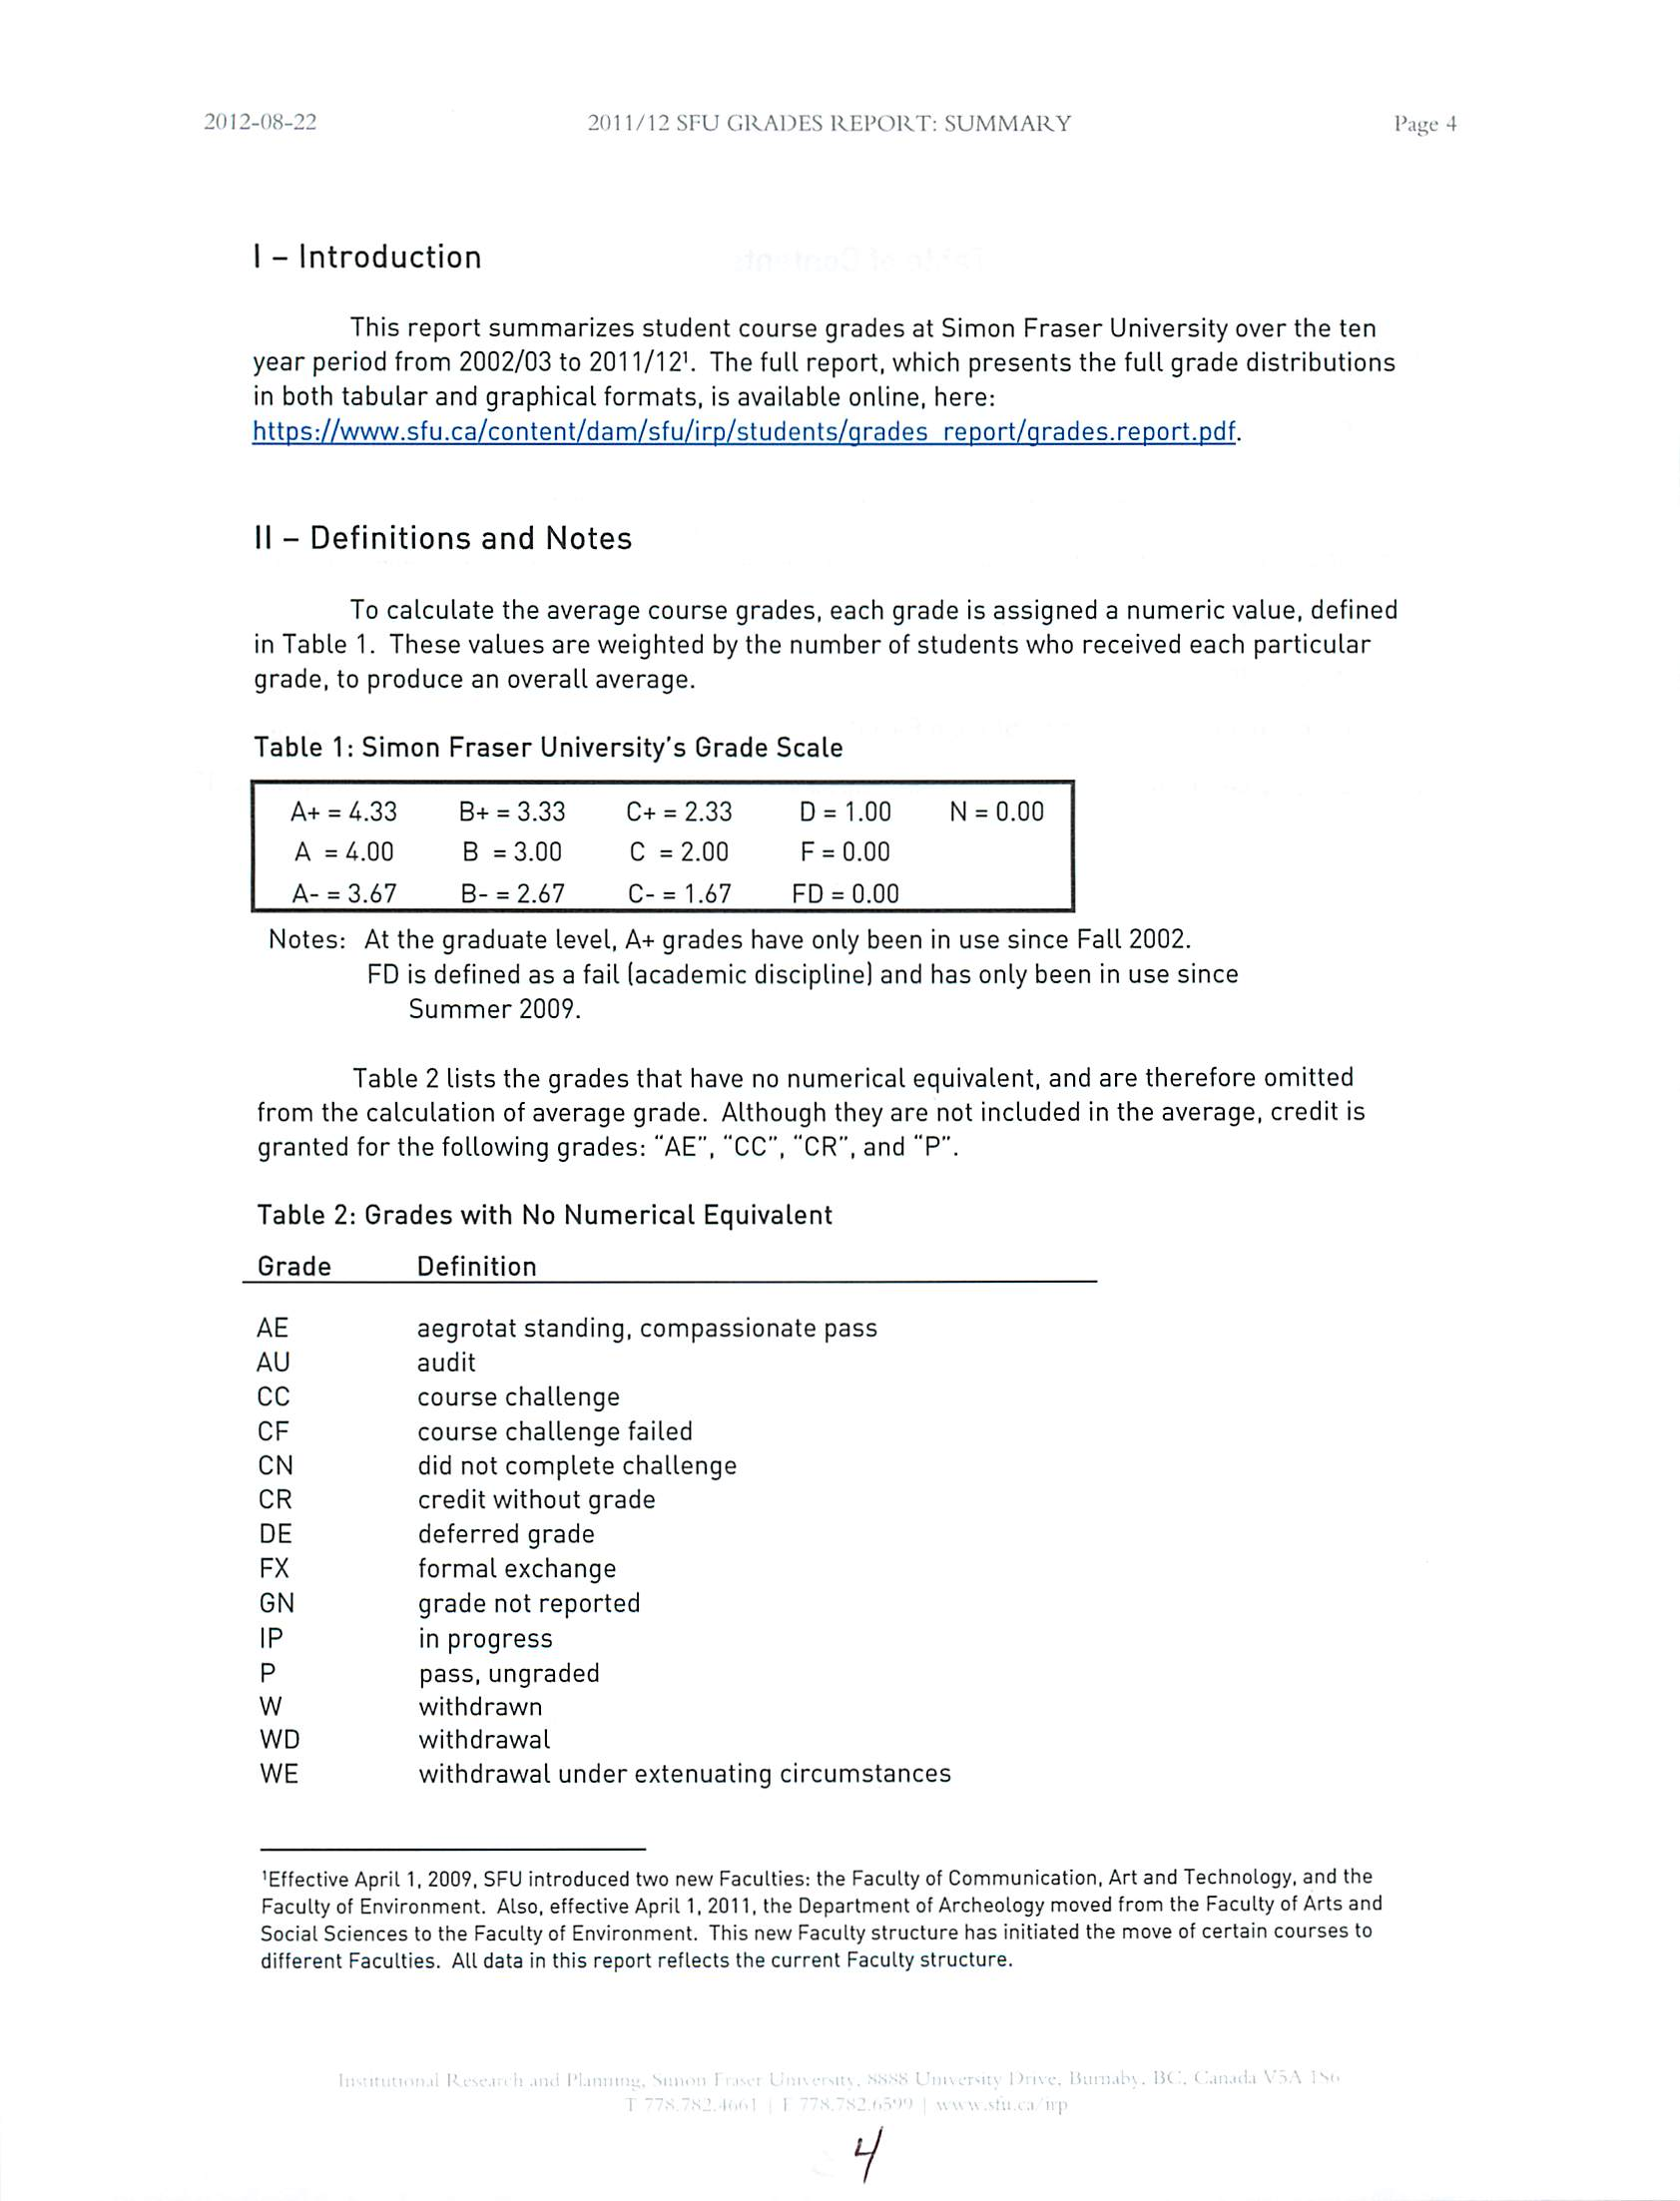
To calculate the average course grades, each grade is assigned a numeric value, defined
in Table 1.
These values are weighted by the number of students who received each particular
grade, to produce an overall average.
Table 1: Simon Fraser University's Grade Scale
A+ = 4.33
B+ = 3.33
C+ = 2.33
D = 1.00
N = 0.00
A =4.00
B =3.00
C =2.00
F = 0.00
A-= 3.67
B- = 2.67
C- = 1.67
FD = 0.00
Notes: At the graduate level, A+ grades have only been in use since Fall 2002.
FDis defined as a fail (academic discipline) and has only been in use since
Summer 2009.
Table 2 lists the grades that have no numerical equivalent, and are therefore omitted
from
the calculation of average grade. Although they are not included in the average, credit is
granted for the following grades: "AE", "CC", "CR", and "P".
Table 2: Grades with No Numerical Equivalent
Grade
Definition
AE
aegrotat standing, compassionate pass
AU
audit
CC
course challenge
CF
course challenge failed
CN
did not complete challenge
CR
credit without grade
DE
deferred grade
FX
formal exchange
GN
grade not reported
IP
in progress
P
pass, ungraded
W
withdrawn
WD
withdrawal
WE
withdrawal under extenuating circumstances
'Effective April1, 2009. SFU introduced two new Faculties: the Faculty of Communication, Art and Technology, and the
Faculty of Environment. Also, effective April 1, 2011, the Department of Archeology moved from the Faculty of Arts and
Social Sciences to the Faculty of Environment. This new Faculty structure has initiated the move of certain courses to
different Faculties. All data in this report reflects the current Faculty structure.
I
'"
> up
i
2012-08-22
2011/12 SFU GRADES REPORT: SUMMARY
Page 5
Among undergraduate courses, "lower division" courses are those numbered from 001 to
299 inclusive. "Upper division" courses are numbered 300 to 499 inclusive.
Data reported on a yearly basis refers to fiscal year. For example, 2010/11 grades are
the grades accumulated over the 2010 Summer term (SFU term code: 1104), the 2010 Fallterm
(SFU term code: 1107), and the 2011 Spring term (SFU term code: 1111).
To protect student privacy, grade distributions based on five grades or fewer are not
reported. Co-op courses, work-terms, and practicums are excluded from this report. Where
they could be identified, courses graded as Pass/Fail are also excluded.
Ill
-
Analysis
lll.A - Undergraduate Course Grades
lll.A. 1 - Lower Division Course Grades (Courses Numbered 001-299 Inclusive}
FACULTY COMPARISONS:
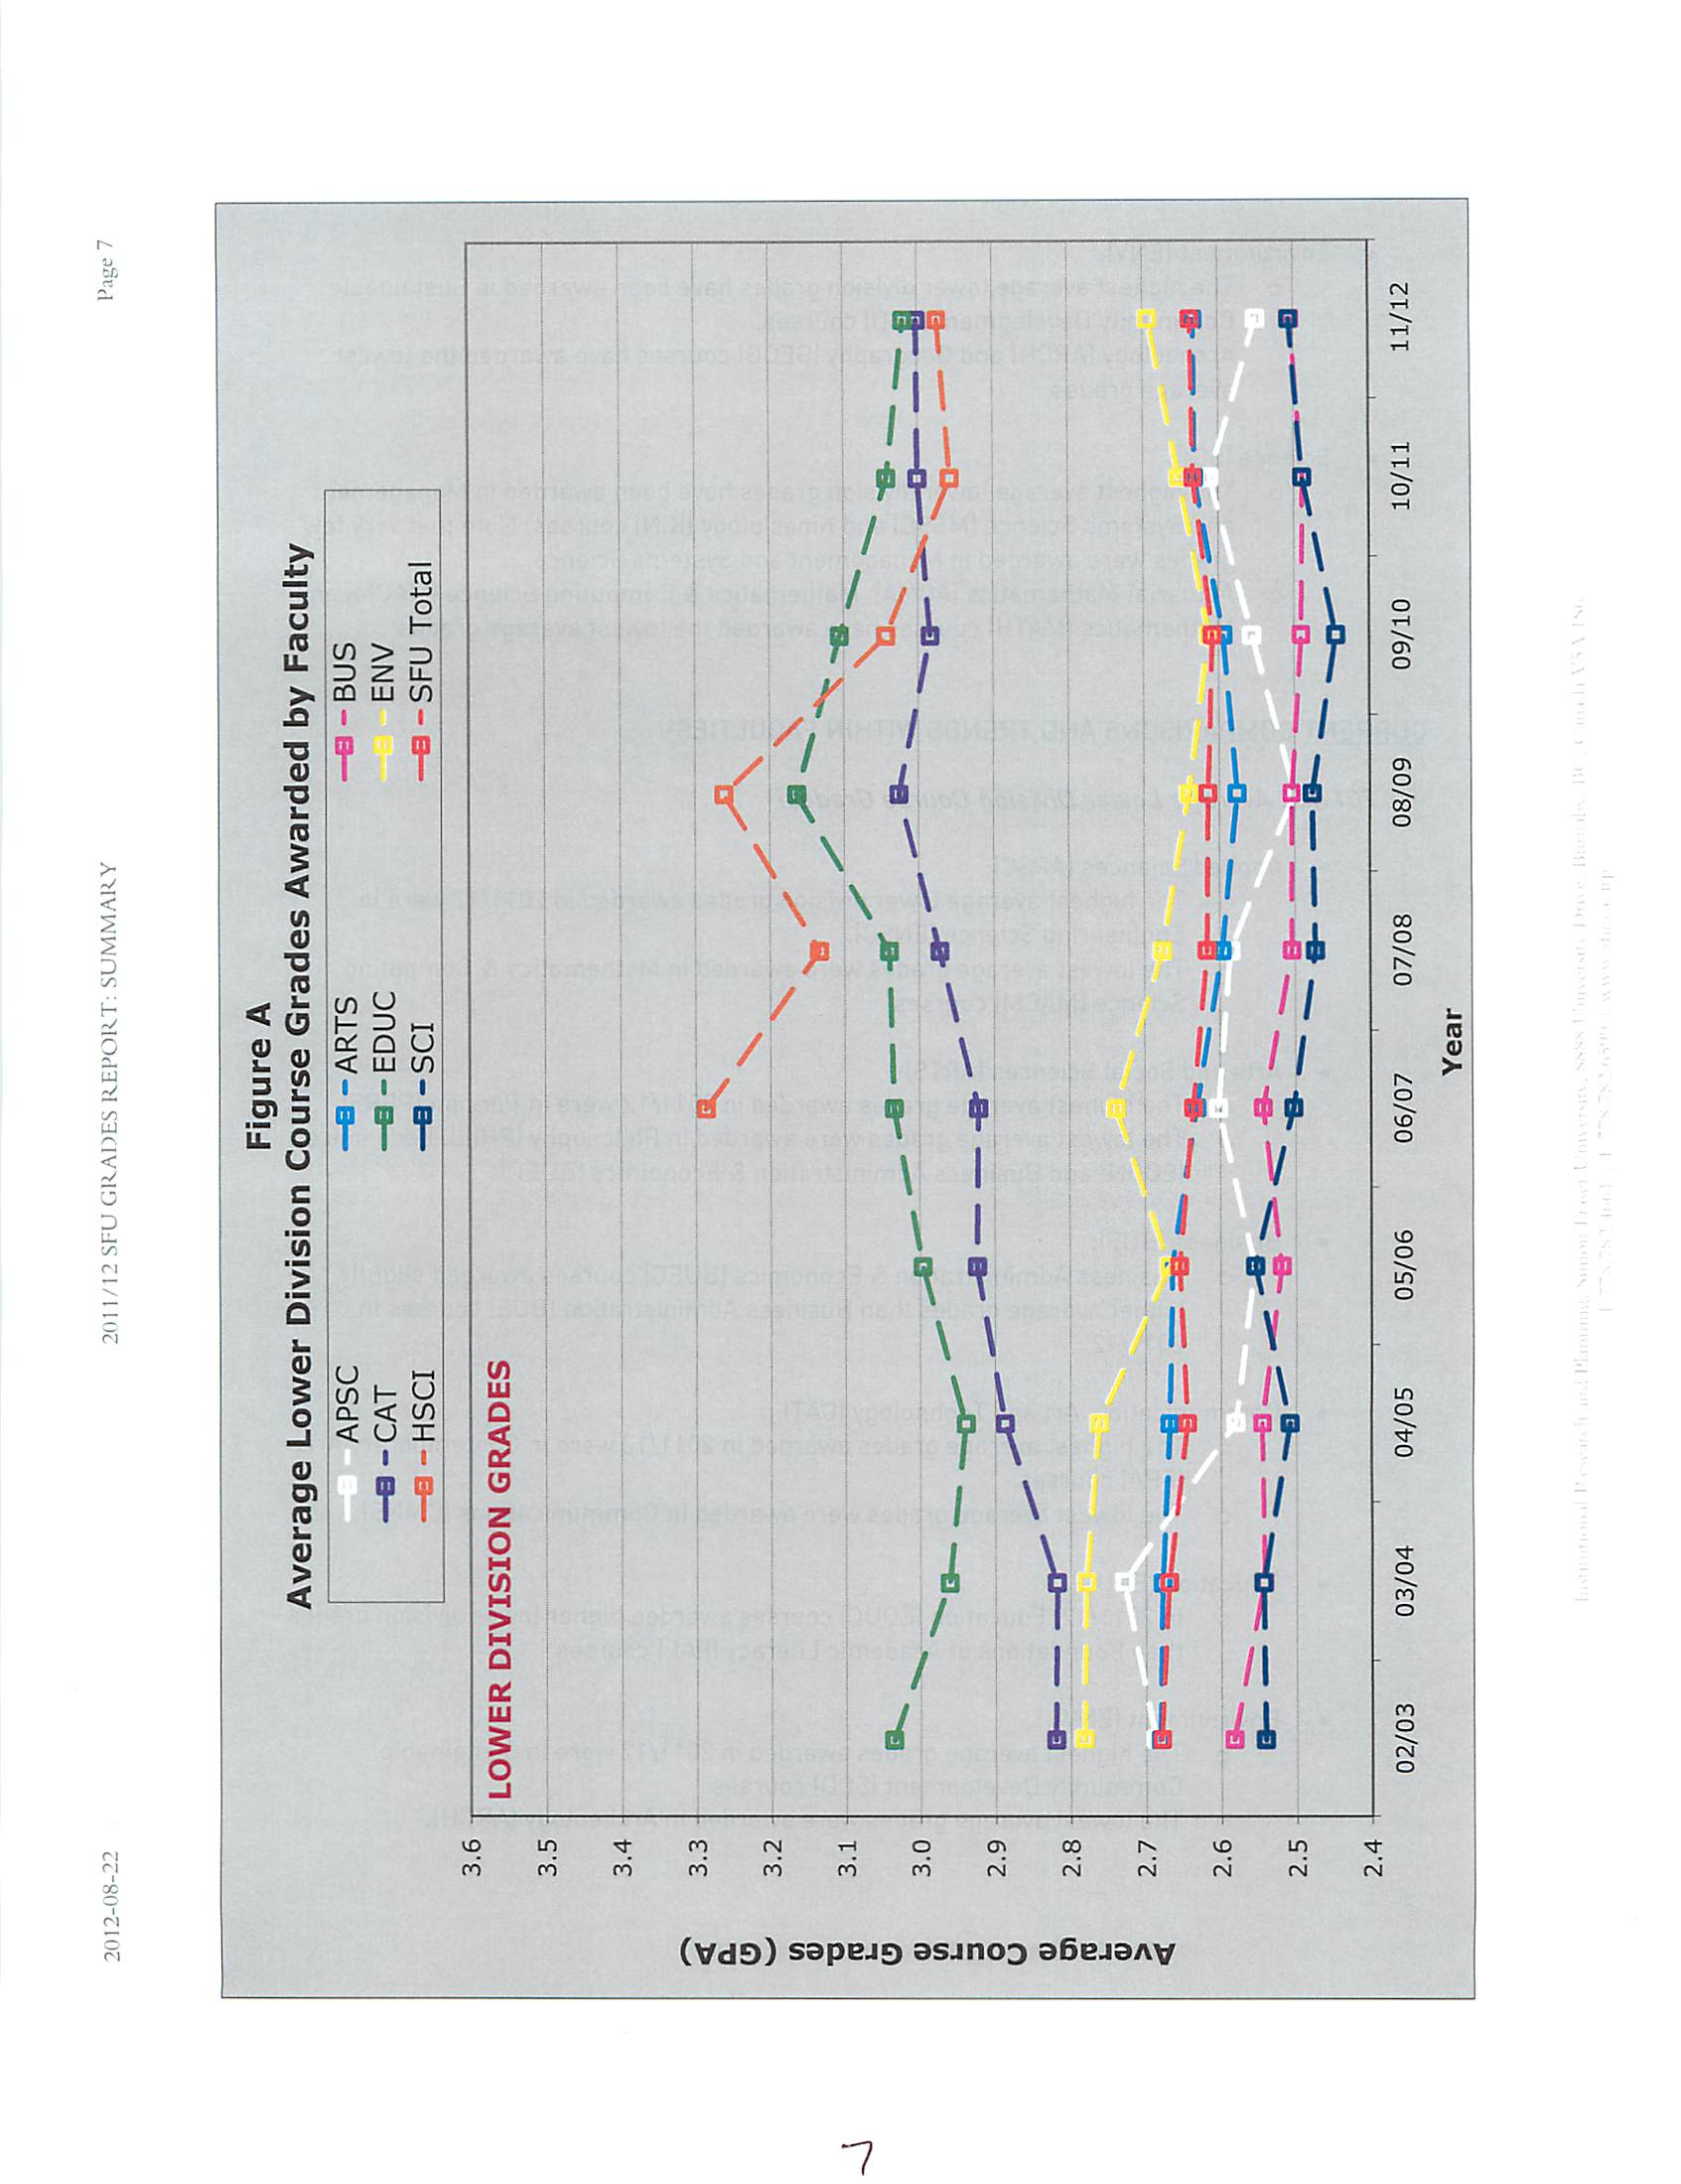
•
The Faculty of Education (EDUC) has awarded the highest average lower division course
grades in seven of the last ten years, with an average awarded grade of 3.04 over the past
decade.
•
In 2006/07, the Faculty of Health Sciences (HSCI) began offering undergraduate courses.
In its first three years, courses in Health Sciences awarded the highest average lower
division grades, and have since remained among the top three Faculties for awarding the
highest average lower division course grades (6-year average of 3.06).
•
The average grades awarded in lower division in the Faculty of Communication, Art and
Technology
(CAT) courses have been increasing over the past decade. This Faculty
awarded the second highest lower division grades for the last two years.
•
All the other Faculties have consistently awarded lower average grades in their lower
division courses. In general, lower division courses in the Faculty of Environment (ENV)
have awarded higher grades than those in Arts and Social Sciences (ARTS) and Applied
Sciences (APSC), while lower division courses in the Beedie School of Business (BUS)
and the Faculty of Science (SCI) have awarded the lowest average grades.
:
•
5"
2012-08-22
201 1/12 SFU GRADES REPORT: SUMMARY
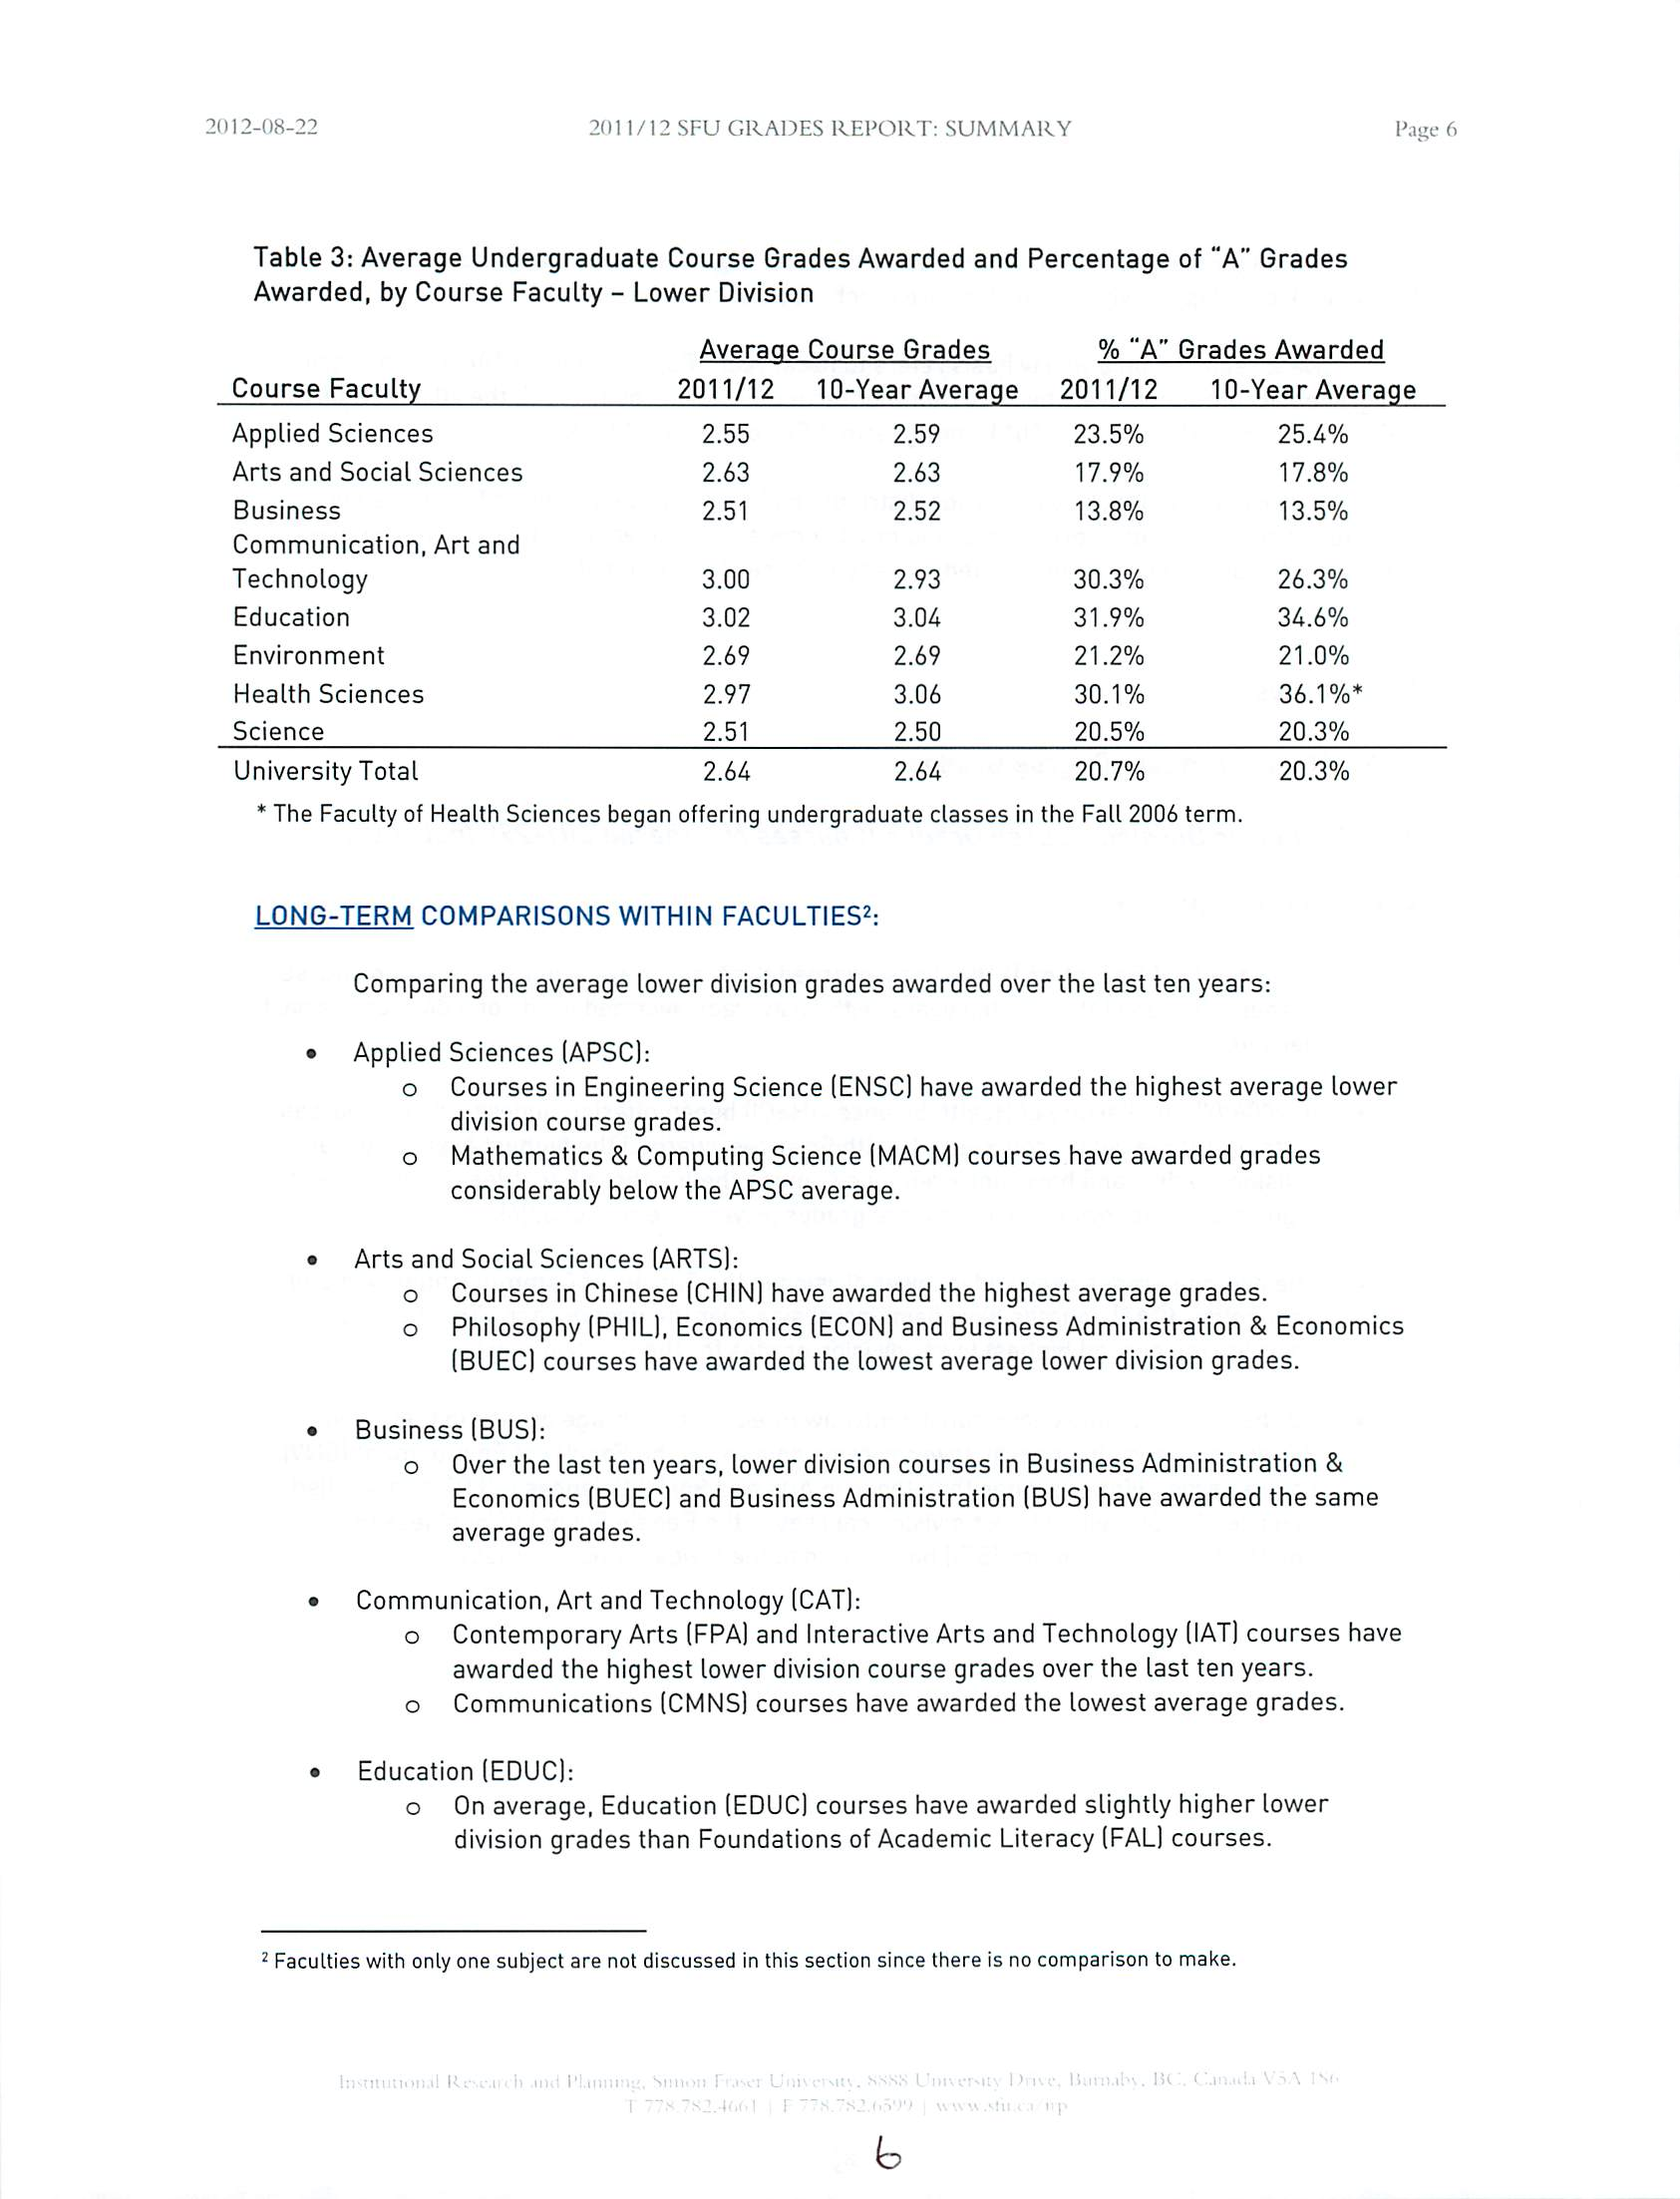
Table 3: Average Undergraduate Course Grades Awarded and Percentage of "A" Grades
Awarded, by Course Faculty - Lower Division
Page 6
Average Course Grades
% "A" Grades Awarded
Course Faculty
Applied Sciences
Arts and Social Sciences
Business
Communication, Art and
Technology
Education
Environment
Health Sciences
Science
2011/12
10-Year Average
2011/12
10-Year Average
2.55
2.63
2.51
3.00
3.02
2.69
2.97
2.51
2.59
2.63
2.52
2.93
3.04
2.69
3.06
2.50
23.5%
17.9%
13.8%
30.3%
31.9%
21.2%
30.1%
20.5%
25.4%
17.8%
13.5%
26.3%
34.6%
21.0%
36.1%*
20.3%
University Total
2.64
2.64
20.7%
20.3%
*The Faculty of Health Sciences began offering undergraduate classes in the Fall 2006 term.
LONG-TERM COMPARISONS WITHIN FACULTIES2:
Comparing the average lower division grades awarded over the last ten years:
•
Applied Sciences (APSC):
o
Courses in Engineering Science (ENSC) have awarded the highest average lower
division course grades,
o
Mathematics & Computing Science (MACM) courses have awarded grades
considerably below the APSC average.
•
Arts and Social Sciences (ARTS):
o
Courses in Chinese (CHIN) have awarded the highest average grades,
o
Philosophy (PHIL), Economics (ECON) and Business Administration & Economics
(BUEC) courses have awarded the lowest average lower division grades.
•
Business (BUS):
o
Over the last ten years, lower division courses in Business Administration &
Economics (BUEC) and Business Administration (BUS) have awarded the same
average grades.
•
Communication, Art and Technology (CAT):
o
ContemporaryArts (FPA) and Interactive Arts and Technology HAT] courses have
awarded the highest lower division course grades over the last ten years,
o Communications (CMNS) courses have awarded the lowest average grades.
•
Education (EDUC):
o
On average, Education (EDUC) courses have awarded slightly higher lower
division grades than Foundations of Academic Literacy (FAL) courses.
Faculties with only one subject are not discussed in this section since there is no comparison to make.
•
b
2012-08-22
2D1
1/12
SFU
GRADES REPORT:
SUMMARY
Figure
A
Average Lower Division
Course
Grades Awarded by Faculty
APSC
-B-ARTS
-a-BUS
-S-CAT
—B-EDUC
ENV
~f3~HSCI
-e-sci
-B-SFU Total
3.6
LOWER
DIVISION GRADES
<
o.
(A
0)
•o
u.
V
(A
L.
3
O
U
en
i-
>
<
3.5 -
3.4
3.3
3.2
3.1
3.0
2.9
2.8
2.7
2.6
2.5
2.4
B^.
02/03
03/04
04/05
\
'N>
-H-
05/06
06/07
07/08
Year
^\
^-\
V
08/09
09/10
10/11
Page 7
--a
—Q
11/12
2012-08-22
201 1/12 SFU GRADES REPORT: SUMMARY
Page 8
Environment (ENV):
o The highest average lower division grades have been awarded in Sustainable
Community Development (SCD) courses,
o
Archeology (ARCH) and Geography (GEOG) courses have awarded the lowest
average grades.
Science (SCI):
o
The highest average lower division grades have been awarded in Management
and Systems Science (MSSC) and Kinesiology (KIN) courses. Note that very few
grades were awarded in Management and Systems Science.
o
Actuarial Mathematics (ACMA), Mathematics & Computing Science (MACM) and
Mathematics (MATH) courses have awarded the lowest average grades.
CURRENT COMPARISONS AND TRENDS WITHIN FACULTIES2:
2011/12 Average Lower Division Course Grades:
•
Applied Sciences
(APSC):
o
The highest average lower division grades awarded in 2011/12 were in
Engineering Science (ENSC).
o The lowest average grades were awarded in Mathematics & Computing
Science (MACM) courses.
•
Arts and Social Sciences (ARTS):
o
The highest average grades awarded in 2011/12 were in Persian (PERS).
o
The lowest average grades were awarded in Philosophy (PHIL), Economics
(ECON) and Business Administration & Economics (BUEC).
•
Business (BUS):
o
Business Administration & Economics (BUEC) courses awarded slightly
higher average grades than Business Administration IBUS) courses in
2011/12.
•
Communication, Art and Technology (CAT):
o
The highest average grades awarded in 2011/12were in Contemporary Arts
(FPA) courses.
o
The lowest average grades were awarded in Communications (CMNS).
•
Education (EDUC):
o
In 2011/12, Education (EDUC) courses awarded higher lower division grades
than Foundations of Academic Literacy (FAD courses.
•
Environment (ENV):
o
The highest average grades awarded in 2011/12 were in Sustainable
Community Development
(SCD) courses,
o
The lowest average grades were awarded in Archeology (ARCH).
.
2012-08-22
2011/12 SFU GRADES REPORT: SUMMARY
Page 9
•
Science (SCI):
o
The highest average grades in 2011/12 were awarded in Management &
Systems Science
(MSSC; note that very few grades were awarded in MSSC
this year)
o
The lowest average grades were awarded in Actuarial Mathematics (ACMA).
Large Changes in 2010/11 to 2011/12 Average Lower Division Grades:
•
The
following subjects have seen large changes (of at least 0.25) in the average lower
division grade awarded from last year to this year:
o
Increases: Environmental Science (EVSC: 2.64 to 2.92) and Management &
Systems Science (MSSC: 3.94 to 4.24; note that very few grades were
awarded in MSSC this year).
o
Decreases: Foundations of Academic Literacy (FAL: 2.93 to 2.63) and Labour
Studies (LBST: 2.99 to 2.68).
III.A.2 - Upper Division Course Grades (Courses Numbered 300-499 Inclusive}
FACULTY COMPARISONS:
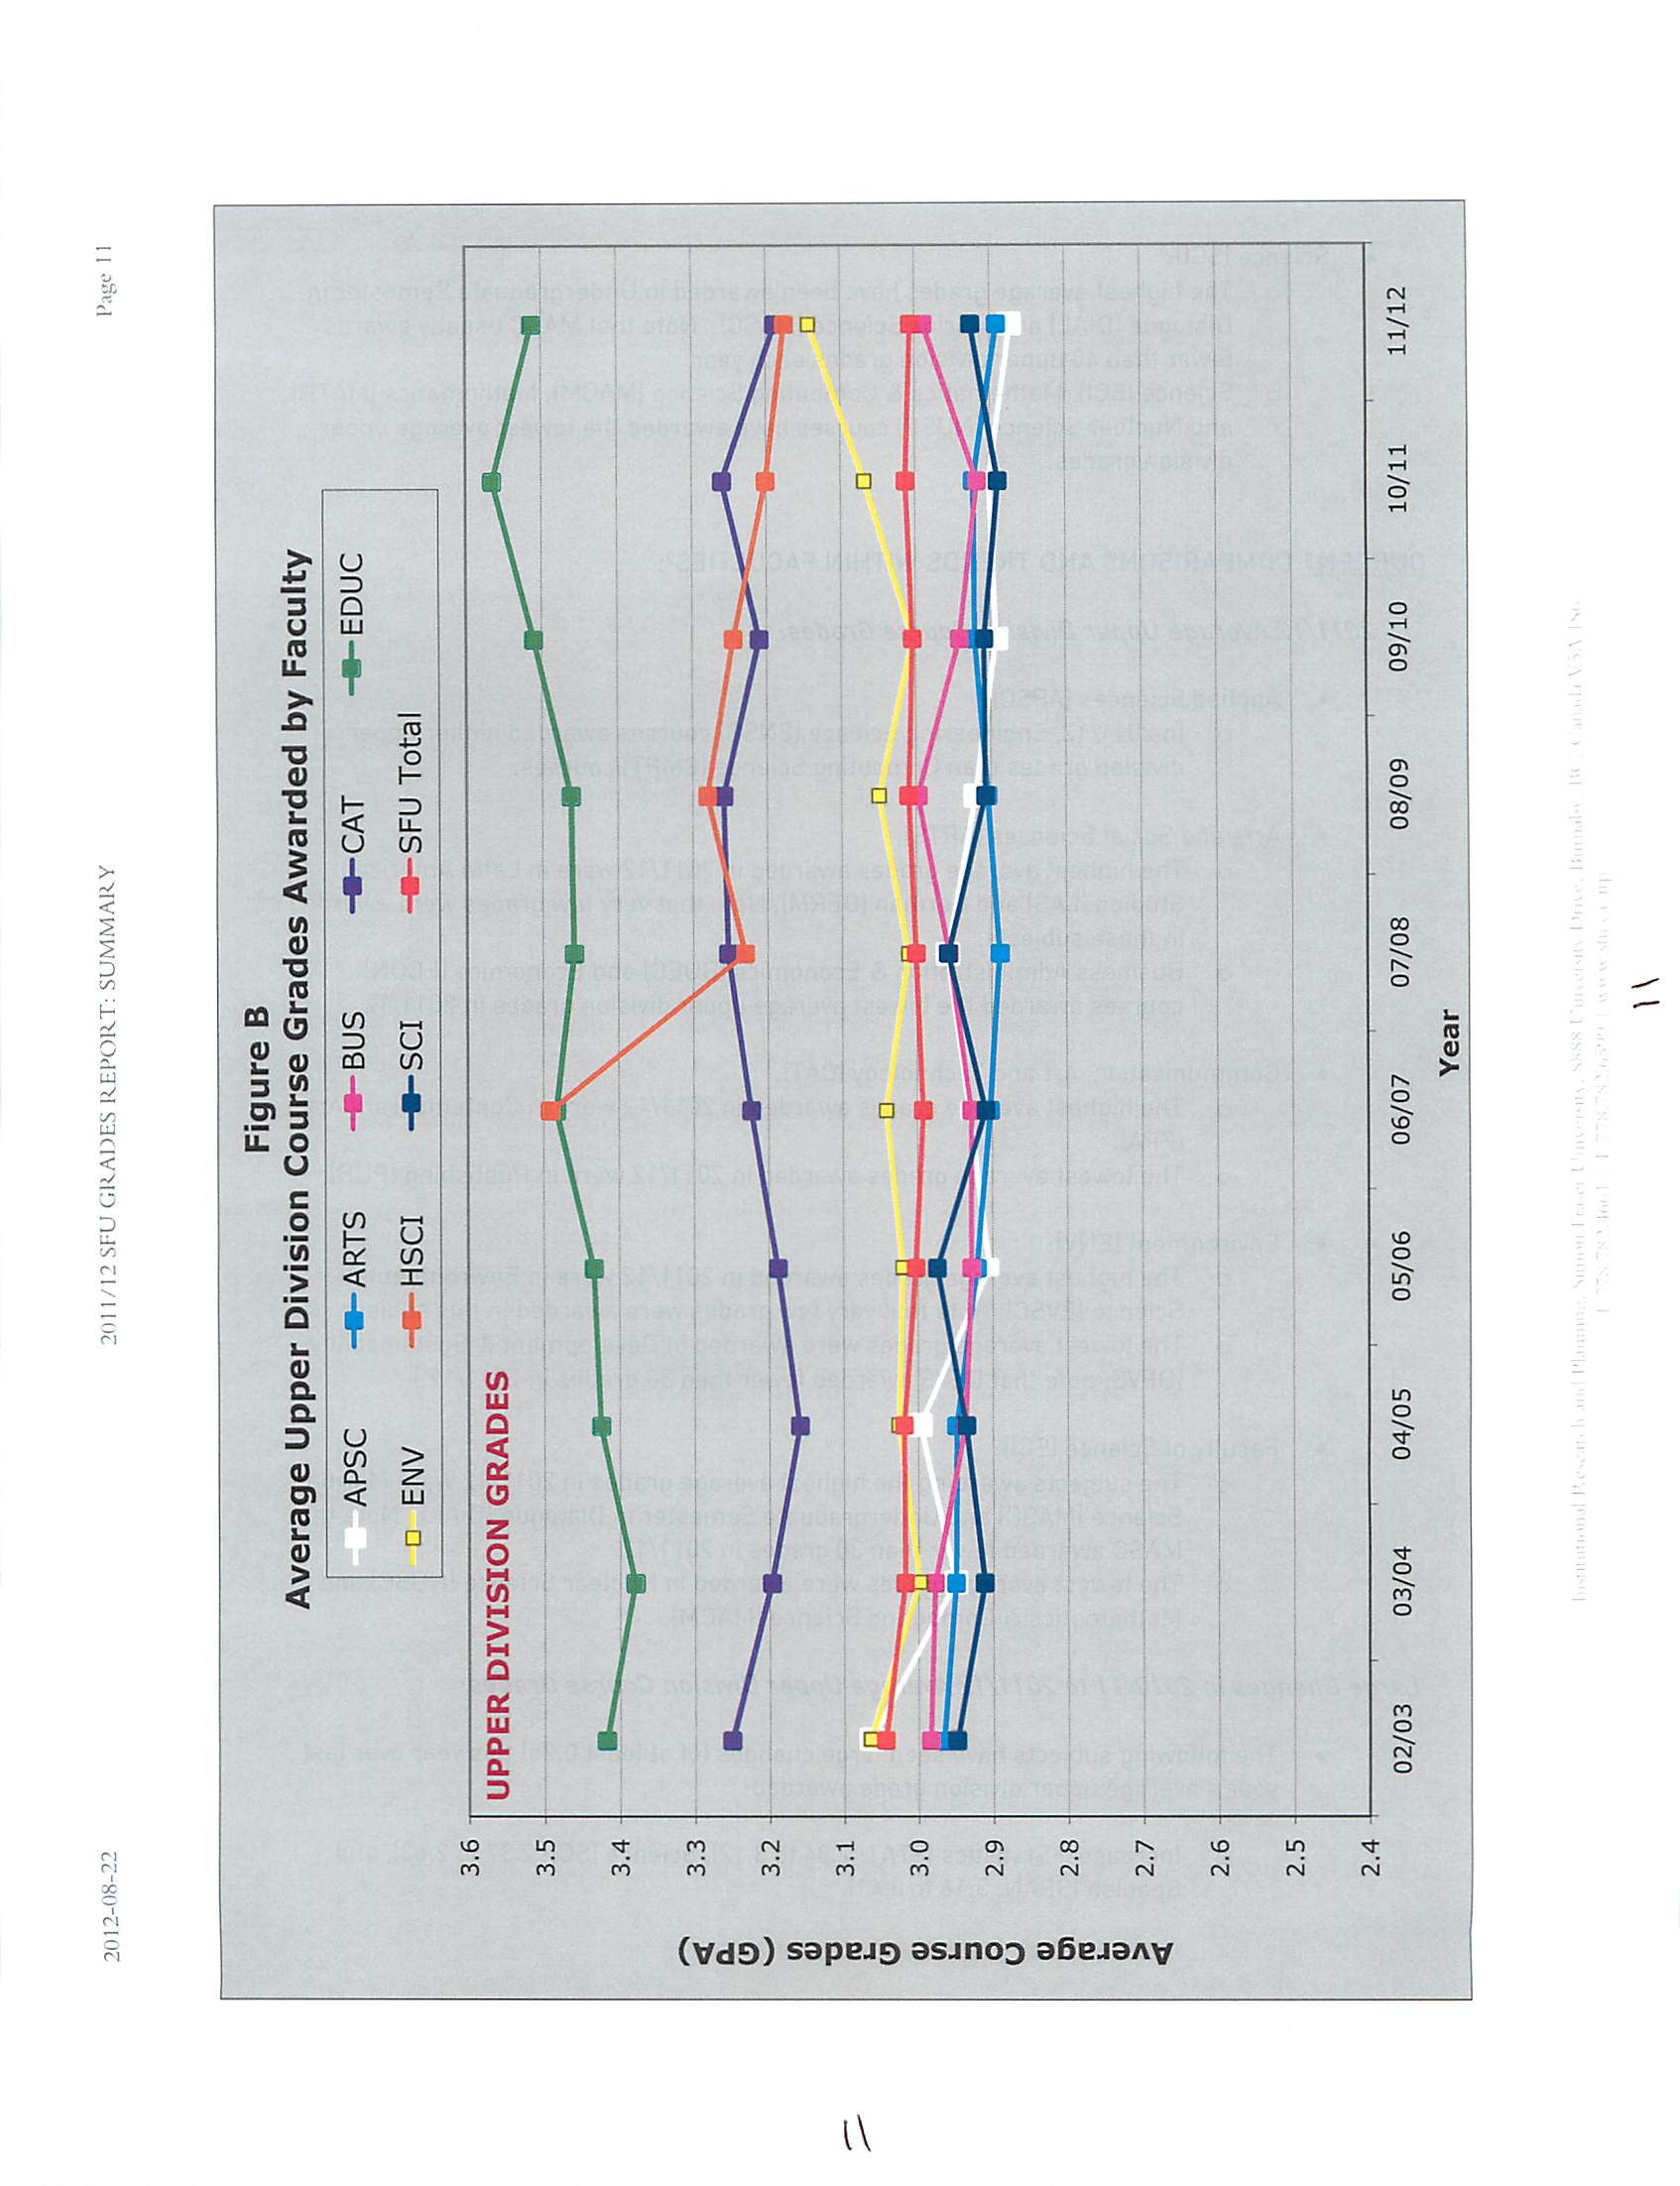
•
With the exception of 2006/07, the Faculty of Education (EDUC) awarded the highest
average upper division course grades in each of the last ten years (average grade
awarded: 3.47).
•
After Education, the Faculties of Communication, Art and Technology (CAT) and Health
Sciences (HSCI) have awarded the highest upper division average grades over the past
ten years (10-year average of 3.21 and 3.22, respectively.) It should be noted that HSCI
has only been offering undergraduate courses for the past six years, and the averages for
its first two years were based on relatively small sample sizes.
•
The remaining Faculties have consistently awarded lower average upper division grades,
averaging in the range of 2.92 to 3.04. However, upper division grades awarded in the
Faculty of Environment
(ENV) have been increasing over the past two years, and are now
nearly as high as those in Communication, Art and Technology (CAT) and Health Sciences
(HSCI).
:'
9
20I2-OS-22
1/12 SFU GRADES REPORT: SUMMARY
age
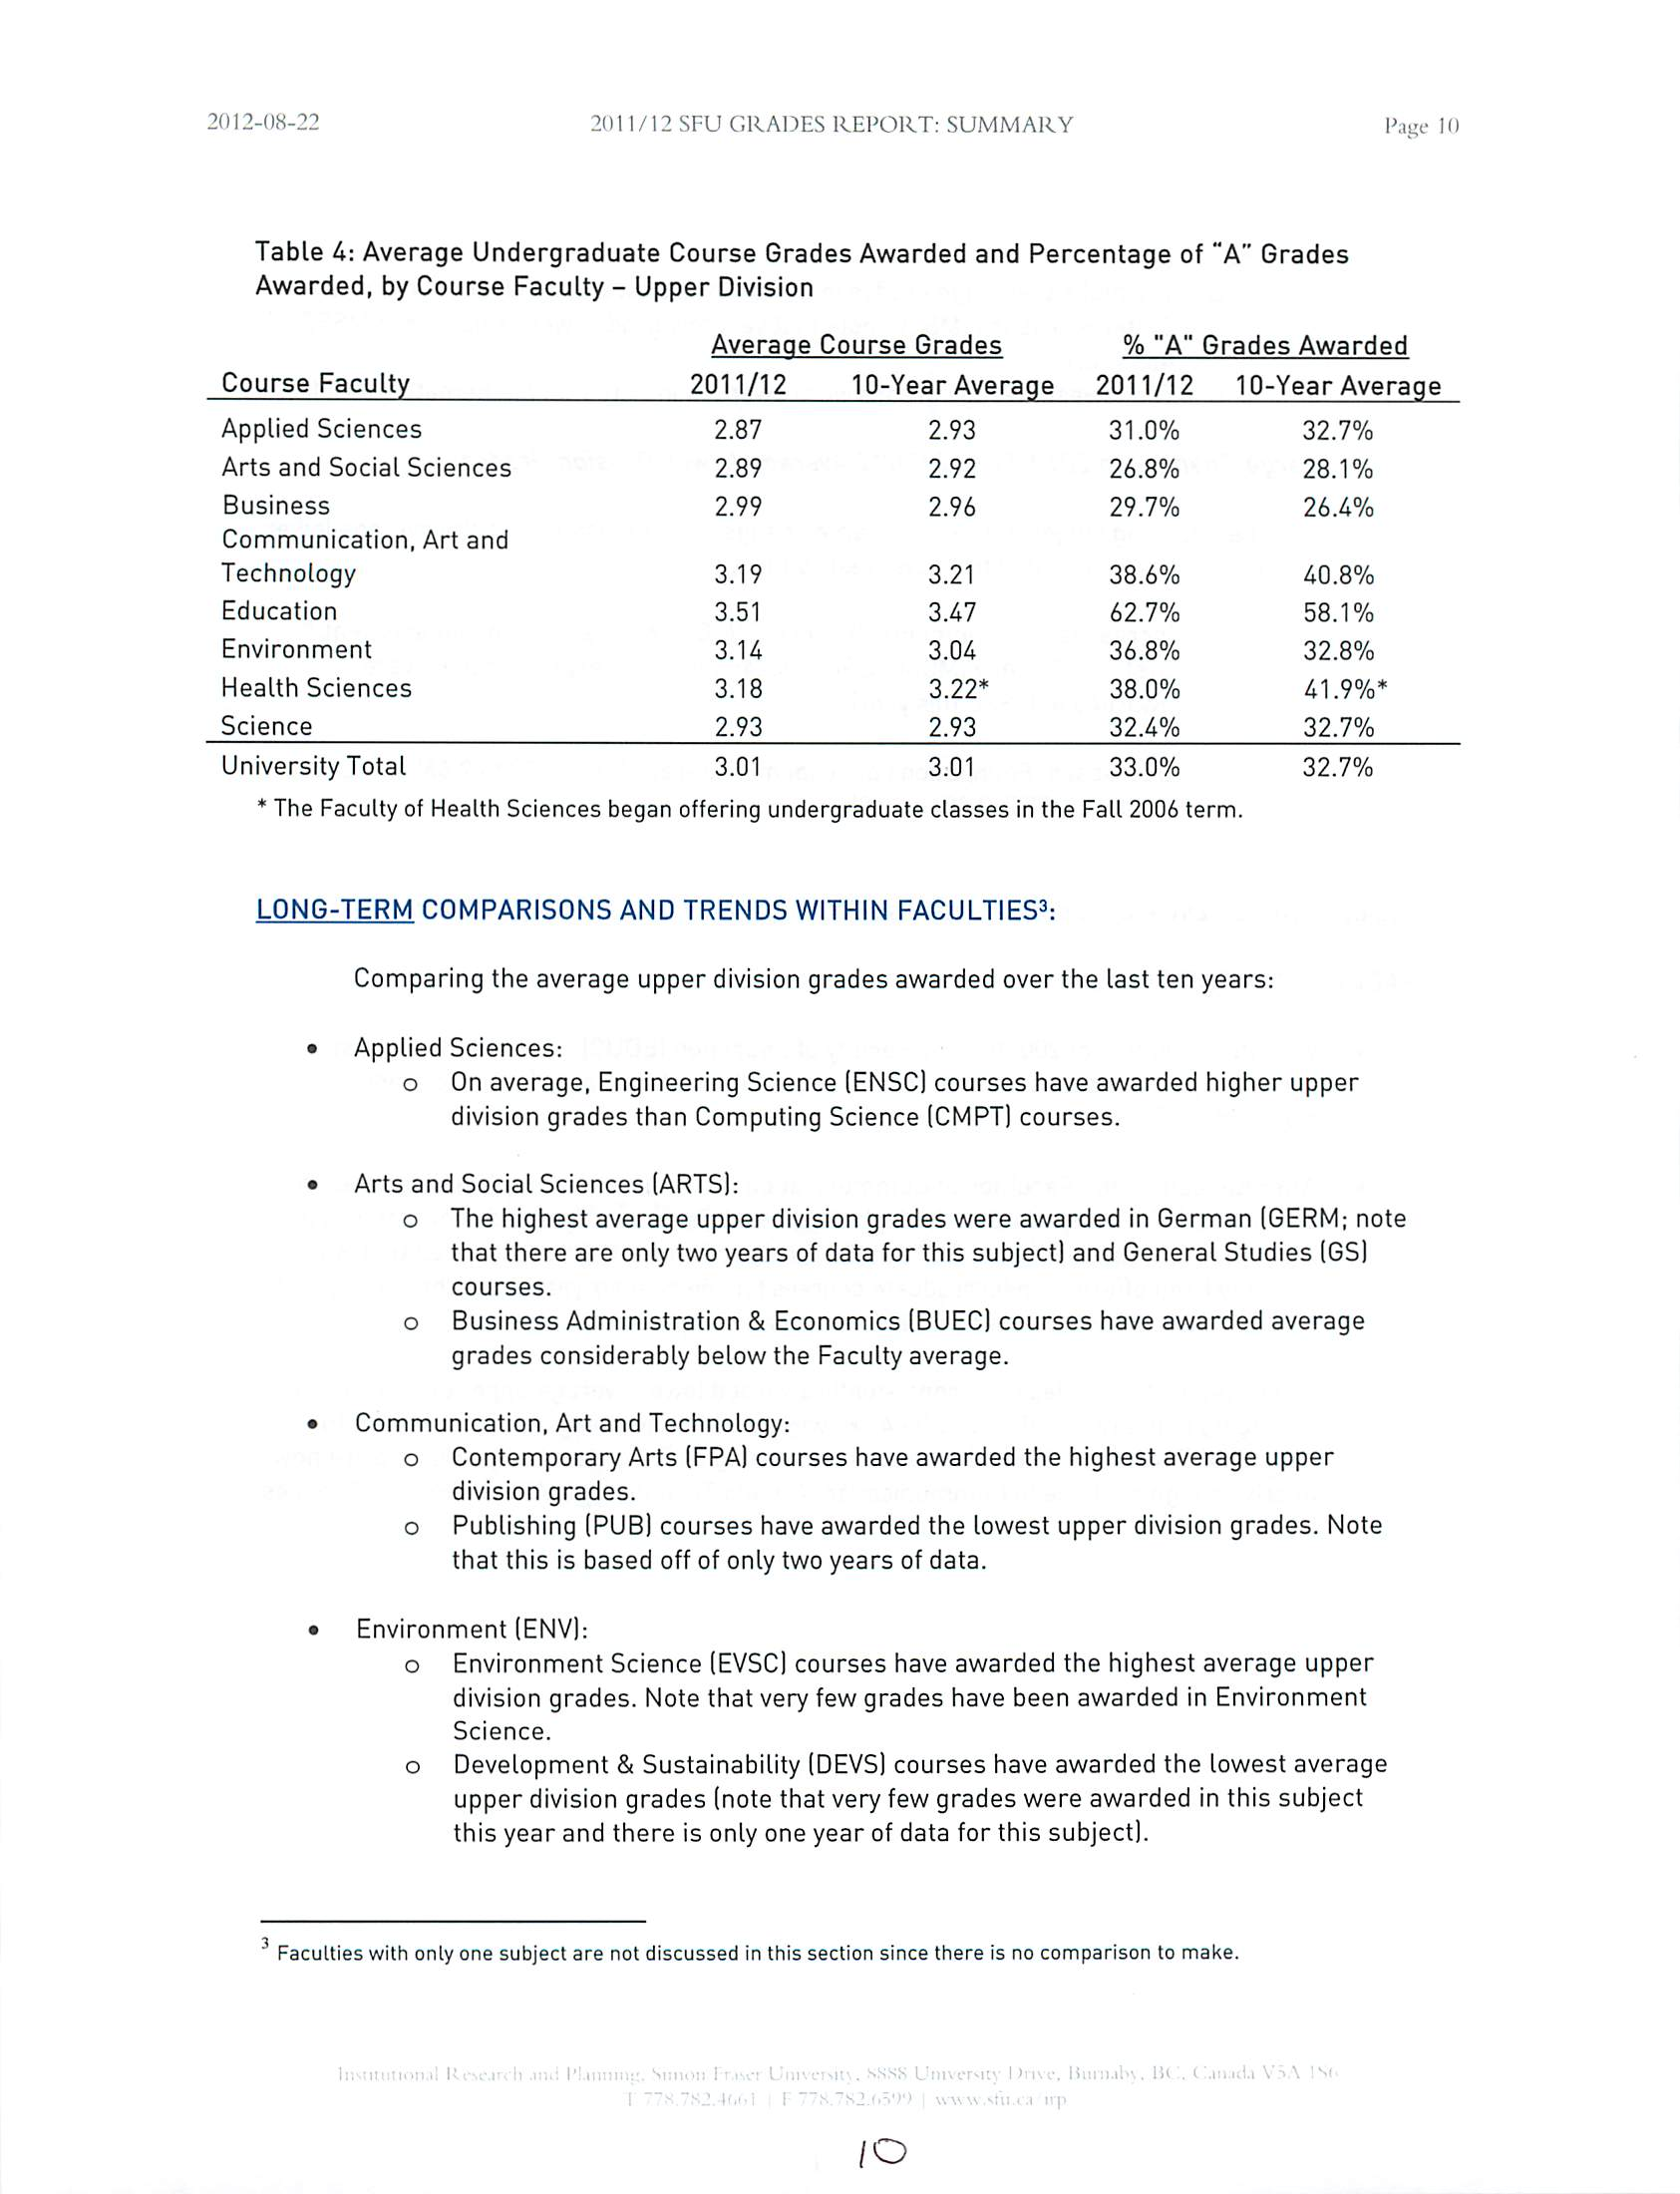
Table 4: Average Undergraduate Course Grades Awarded and Percentage of "A" Grades
Awarded, by Course Faculty - Upper Division
Average
Course Grades
% "A" Grades Awarded
Course Faculty
2011/12
10-Year Average
2011/12
10-Year Average
Applied Sciences
Arts and Social Sciences
Business
Communication, Art and
Technology
Education
Environment
Health Sciences
Science
2.87
2.89
2.99
3.19
3.51
3.14
3.18
2.93
2.93
2.92
2.96
3.21
3.47
3.04
3.22^
2.93
31.0%
26.8%
29.7%
38.6%
62.7%
36.8%
38.0%
32.4%
University Total
3.01
3.01
33.0%
* The Faculty of Health Sciences began offering undergraduate classes in the Fall 2006 term.
32.7%
28.1%
26.4%
40.8%
58.1%
32.8%
41.9%*
32.7%
32.7%
LONG-TERM COMPARISONS AND TRENDS WITHIN FACULTIES3:
Comparing the average upper division grades awarded over the last ten years:
•
Applied Sciences:
o
On average, Engineering Science (ENSC) courses have awarded higher upper
division grades than Computing Science (CMPT) courses.
•
Arts and Social Sciences (ARTS):
o
The highest average upper division grades were awarded in German (GERM; note
that there are only two years of data for this subject) and General Studies (GS)
courses.
o
Business Administration & Economics (BUEC) courses have awarded average
grades considerably below the Faculty average.
•
Communication, Art and Technology:
o
Contemporary Arts (FPA) courses have awarded the highest average upper
division grades,
o
Publishing (PUB) courses have awarded the lowest upper division grades. Note
that this is based off of only two years of data.
•
Environment (ENV):
o
Environment Science (EVSC) courses have awarded the highest average upper
division grades. Note that very few grades have been awarded in Environment
Science.
o
Development & Sustainability (DEVS) courses have awarded the lowest average
upper division grades (note that very few grades were awarded in this subject
this year and there is only one year of data for this subject).
Faculties with only one subject are not discussed in this section since there is no comparison to make.
;
/o
2012-08-22
201 1/12 SFU GRADES REPORT: SUMMARY
Figure B
Average Upper Division Course Grades Awarded by Faculty
APSC
d ENV
ARTS
HSCI
BUS
SCI
•CAT
•SFU Total
EDUC
3.6
UPPER DIVISION GRADES
<
Q.
CD
(A
V
•D
A3
u
(A
J-
3
O
U
01
ro
>
<
2.7
2.6
2.5
2.4 -
02/03
03/04
04/05
05/06
06/07
07/08
Year
08/09
09/10
11
u
Page I 1
10/11
11/12
2012-08-22
2011/12 SFU GRADES REPORT: SUMMARY
Page 12
Science (SCI):
o The highest average grades have been awarded in Undergraduate Semester in
Dialogue (DIAL) and Marine Science (MASC). Note that MASC usually awards
fewer than 40 upper division grades each year.
o
Science (SCI), Mathematics & Computing Science (MACM), Mathematics (MATH),
and Nuclear Science (NUSC) courses have awarded the lowest average upper
division grades.
CURRENT COMPARISONS AND TRENDS WITHIN FACULTIES3:
2011/12Average Upper Division Course Grades:
•
Applied Sciences (APSC):
o
In 2011/12, Engineering Science (ENSC) courses awarded higher upper
division grades than Computing Science
(CMPT) courses.
•
Arts and Social Sciences (ARTS):
o
The highest average grades awarded in 2011/12 were in Latin American
Studies
(LAS) and German (GERM). Note that very few grades were awarded
in these subjects.
o
Business Administration & Economics (BUEC) and Economics (ECON)
courses awarded the lowest average upper division grades in 2011/12.
•
Communication, Art and Technology
(CAT):
o
The highest average grades awarded in 2011/12 were in Contemporary Arts
(FPA).
o
The lowest average grades awarded in 2011/12 were in Publishing (PUB).
•
Environment (ENV):
o
The highest average grades awarded in 2011/12 were in Environmental
Science
(EVSC). Note that very few grades were awarded in this subject.
o The lowest average grades were awarded in Development & Sustainability
(DEVS; note that DEVS awarded fewer than 30 grades in 2011/12.)
•
Faculty of Science
(SCI):
o
The subjects awarding the highest average grades in 2011/12 were Marine
Science
(MASC) and Undergraduate Semester in Dialogue (DIAL). Note that
MASC awarded fewer than 30 grades in 2011/12.
o
The lowest average grades were awarded in Nuclear Science (NUSC) and
Mathematics & Computing Science (MACM).
Large Changes in 2010/11 to 2011/12Average UpperDivision Course Grades:
•
The following subjects have seen large changes (ofat least 0.25) this year over last
year's average upper division grade awarded:
o
Increases: Statistics (STAT: 2.84 to 3.12), Science (SCI: 2.37 to 2.63), and
Spanish (SPAN: 3.16 to 3.41).
C2-
2012-OS-22
2011/12 SFU GRADES REPORT: SUMMARY
Page 13
o
Decreases: Nuclear Science (NUSC: 2.74 to 2.37), Environmental Science
(EVSC: 4.33 to 4.00; note that very few grades were awarded in EVSC), and
Publishing Program
(PUB: 3.09 to 2.79).
lll.A.3 - General Observations (All
Undergraduate
Courses}
•
In 2011/12, the average undergraduate grade awarded was 2.79.
•
The average undergraduate grade awarded over the past ten years is 2.79.
•
Overthe past ten years, upper division courses have consistently awarded higher grades
than lower division courses in all Faculties.
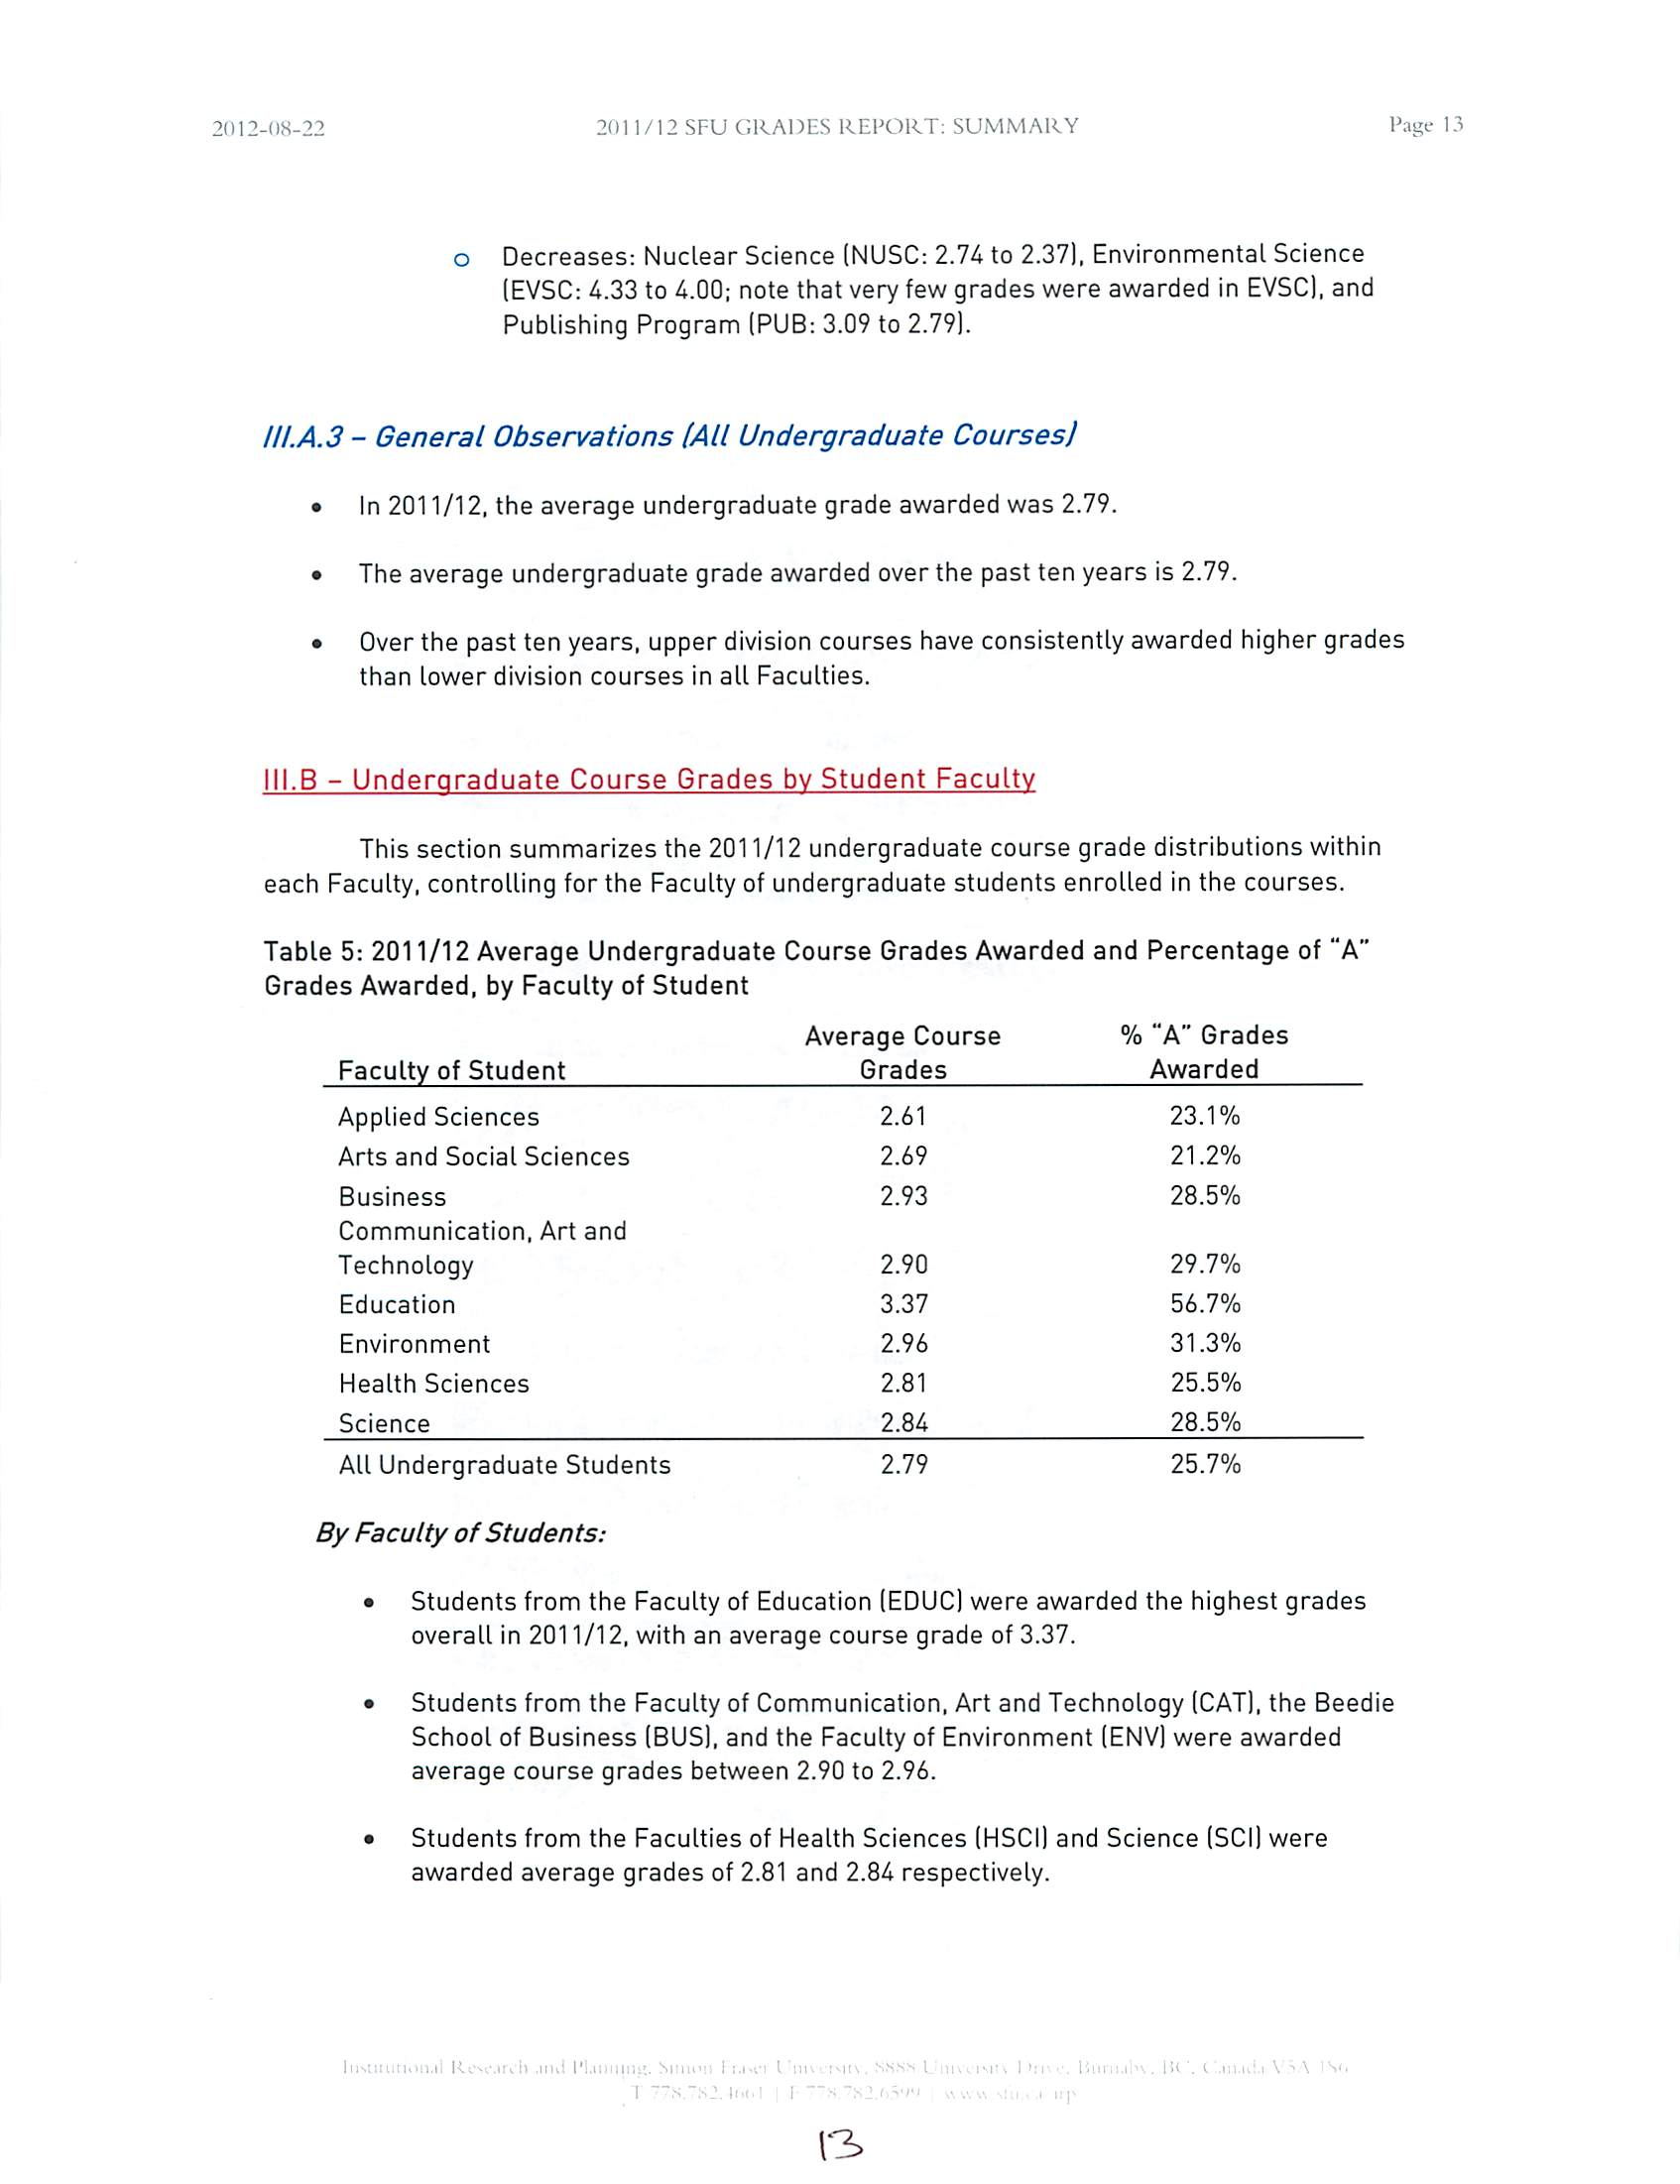
III.B - Undergraduate Course Grades by Student Faculty
This section summarizes the 2011/12 undergraduate course grade distributions within
each Faculty, controlling for the Faculty of undergraduate students enrolled in the courses.
Table 5: 2011/12 Average Undergraduate Course Grades Awarded and Percentage of "A"
Grades Awarded, by Faculty of Student
Ave
rage Course
% "A" Grades
Faculty of Student
Grades
Awarded
Applied Sciences
2.61
23.1%
Arts and Social Sciences
2.69
21.2%
Business
2.93
28.5%
Communication, Art
and
Technology
2.90
29.7%
Education
3.37
56.7%
Environment
2.96
31.3%
Health Sciences
2.81
25.5%
Science
2.84
28.5%
All Undergraduate Students
2.79
25.7%
By Faculty of
Students:
•
Students from the Faculty of Education (EDUC) were awarded the highest grades
overall in 2011/12, with an average course grade of 3.37.
•
Students from the Faculty of Communication, Art and Technology (CAT), the Beedie
School of Business
(BUS), and the Faculty of Environment (ENV) were awarded
average course grades between 2.90 to 2.96.
•
Students from the Faculties of Health Sciences (HSCI) and Science (SCI) were
awarded average grades of 2.81 and 2.84 respectively.
i,i
i•
.
13
2012-08-22
4.33
4.00
3.67
3.33
<
Q.
3.00
V)
V
T3
2.67
2.33
(A
L.
3
0
U
2.00
1.67
0)
to
>
<
1.33
1.00
0.67
0.33
0.00
201 1/12 SFU GRADES REPORT: SUMMARY
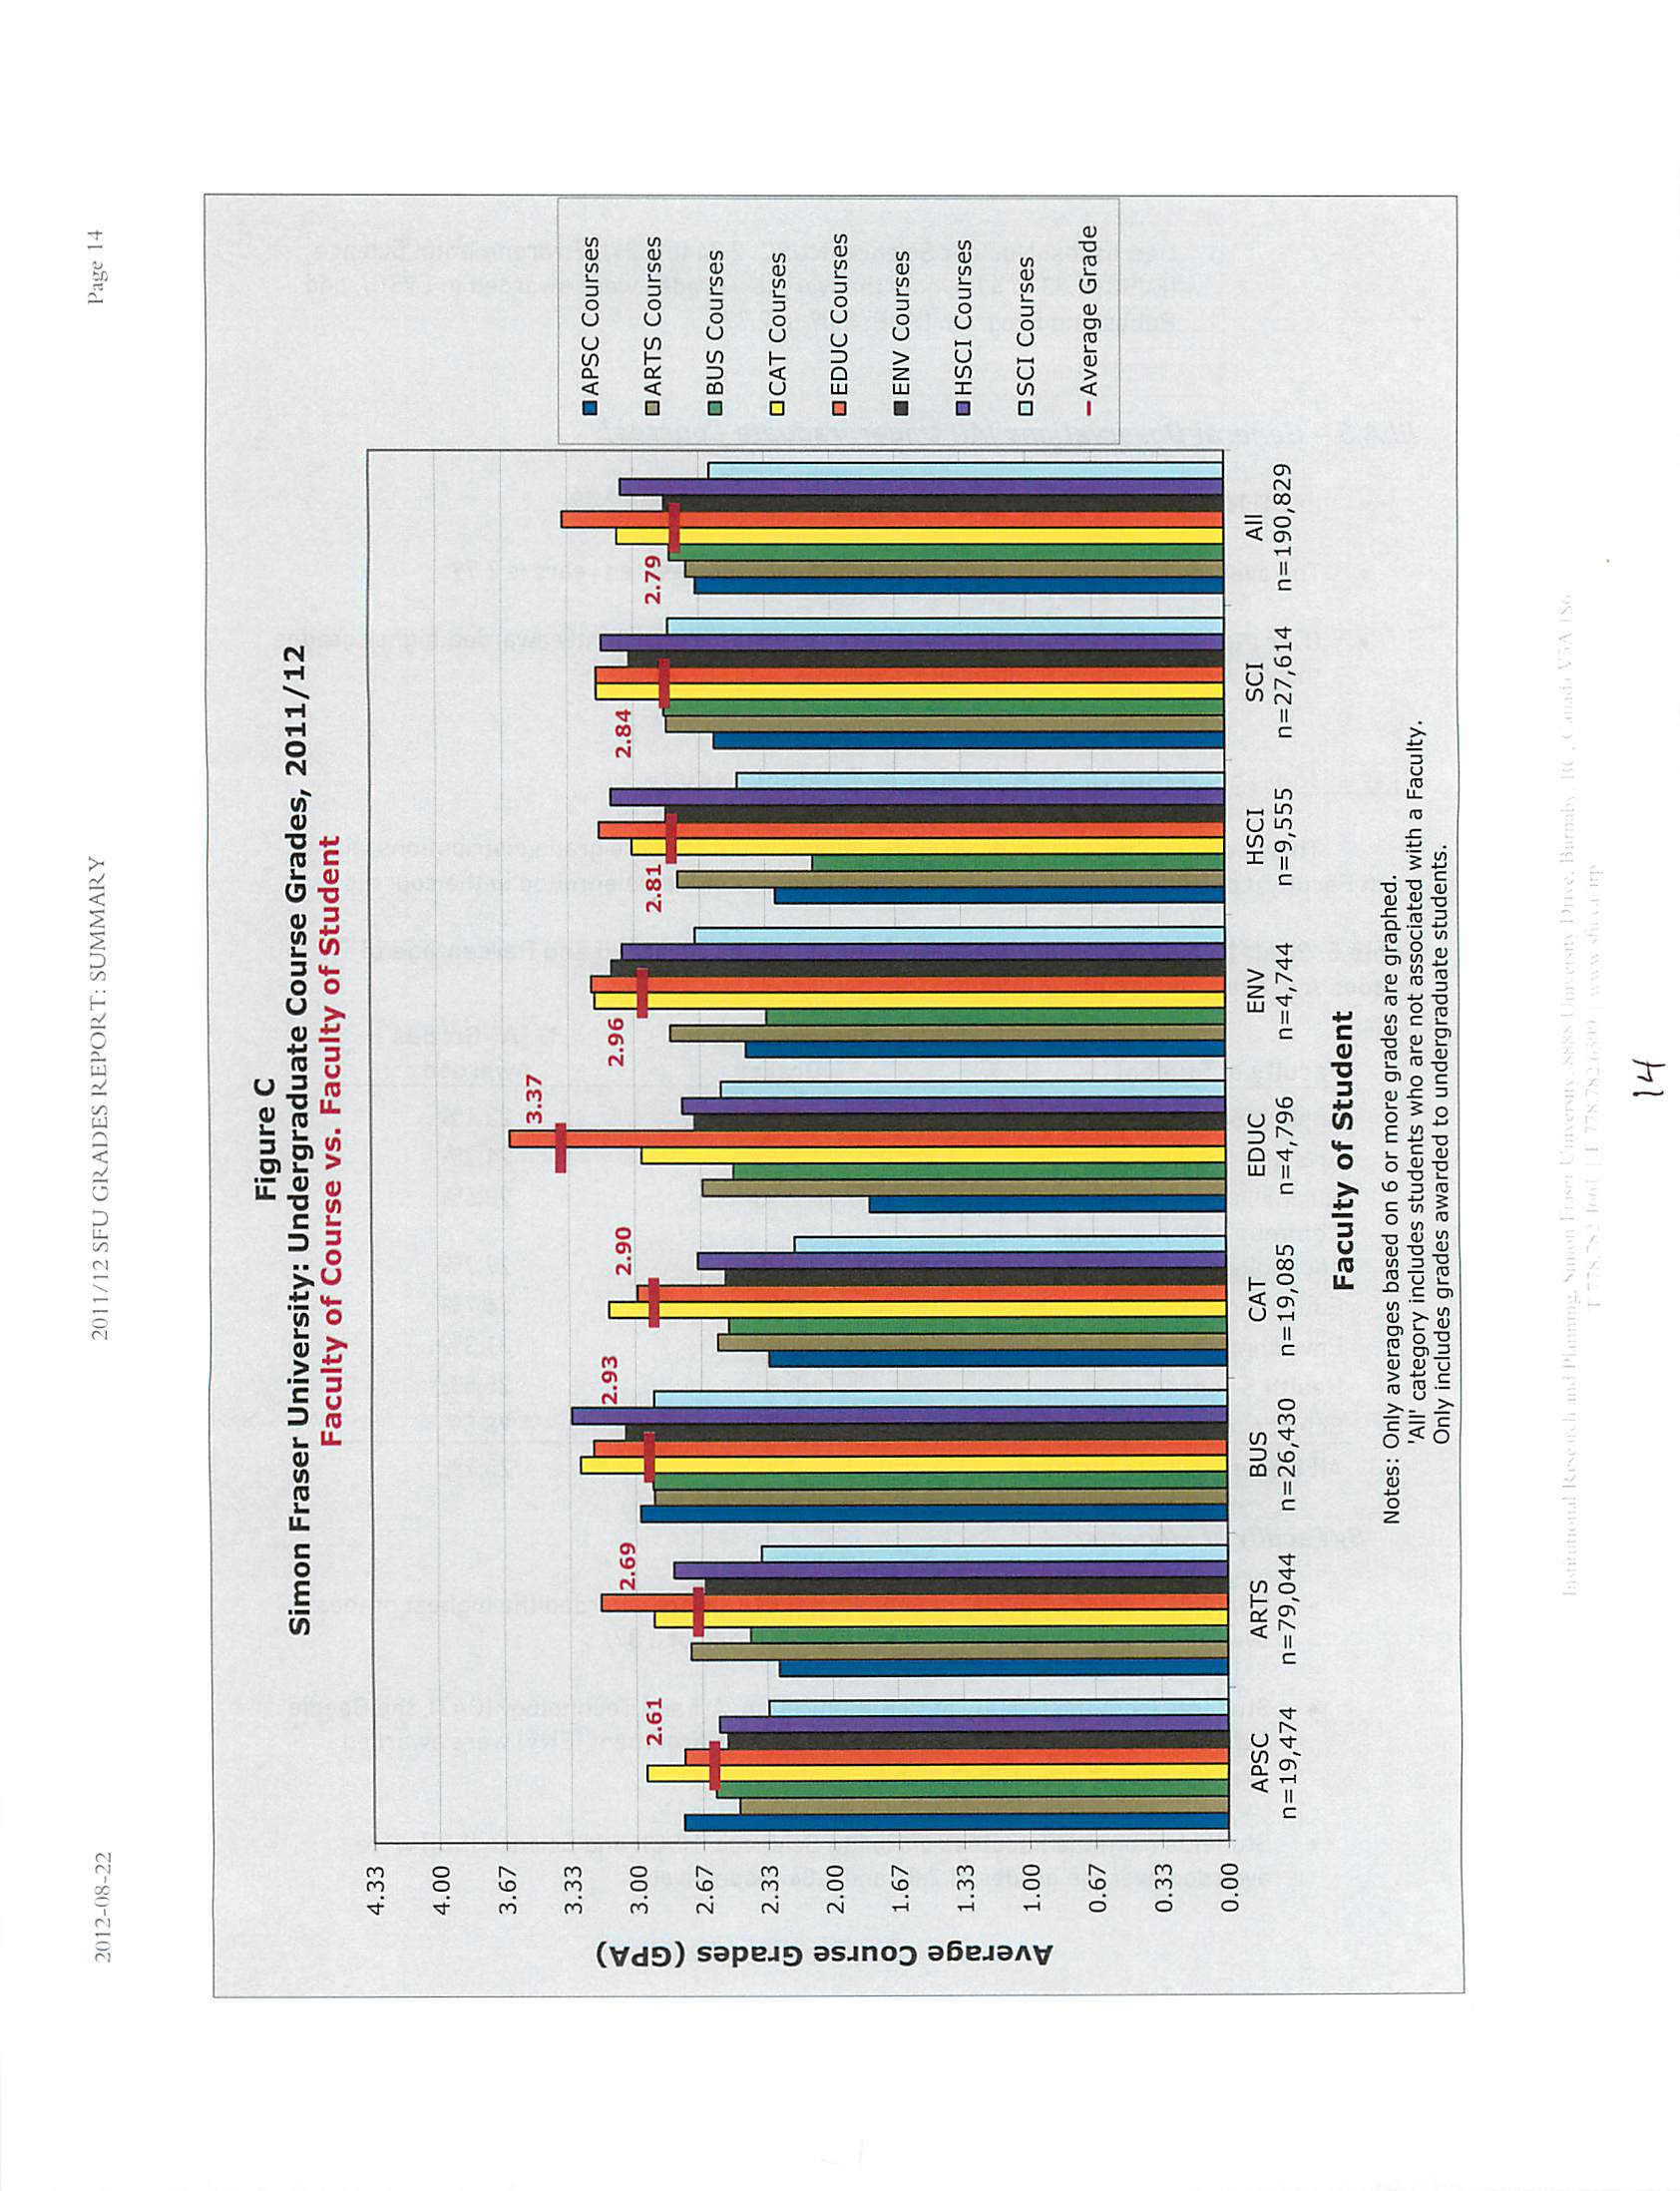
Figure C
Simon Fraser University: Undergraduate Course Grades, 2011/12
Faculty of Course vs. Faculty of Student
APSC
ARTS
BUS
CAT
EDUC
ENV
n= l9,474
n=79,044
n=26,430
n= 19,085
n=4,796
n=4,744
Faculty of Student
HSCI
SCI
All
n=9,555
n = 27,614 n=190,829
Notes: Only averages based on 6 or more grades are graphed.
'All' category includes students who are not associated with a Faculty.
Only includes grades awarded to undergraduate
students.
H
Page 14
• APSC Courses
DARTS Courses
QBUS Courses
DCAT Courses
DEDUC Courses
• ENV Courses
• HSCI Courses
DSCI Courses
-Average Grade
2012-08-22
2011/12 SFU GRADES REPORT: SUMMARY
Page 15
•
Students from the Faculties of Arts and Social Sciences (ARTS) and Applied Sciences
(APSC) were awarded the lowest average grades in 2011/12, with an average course
grade of 2.69 and 2.61 respectively.
•
Students from all Faculties most commonly took courses from their own Faculties.
By Faculty
of Courses:
•
In courses offered by the Faculty of Education (EDUC), students from the Faculty of
Education
(EDUC) received the highest average grades in 2011/12.
•
In courses offered bythe Faculty of Environment (ENV), students from the Faculty of
Environment (ENV) received the highest average grades in 2011/12.
•
In courses offered byall other Faculties, students from the Beedie School of
Business (BUS) received the highest average grades in 2011/12.
•
Apart from the Faculty of Environment
(ENV), courses in all Faculties were most
frequently taken by students from within those Faculties. Faculty of Environment
(ENV) courses were most often taken by students from the Faculty of Arts and Social
Sciences (ARTS).
III.C
- Graduate Course Grades
FACULTY COMPARISONS:
•
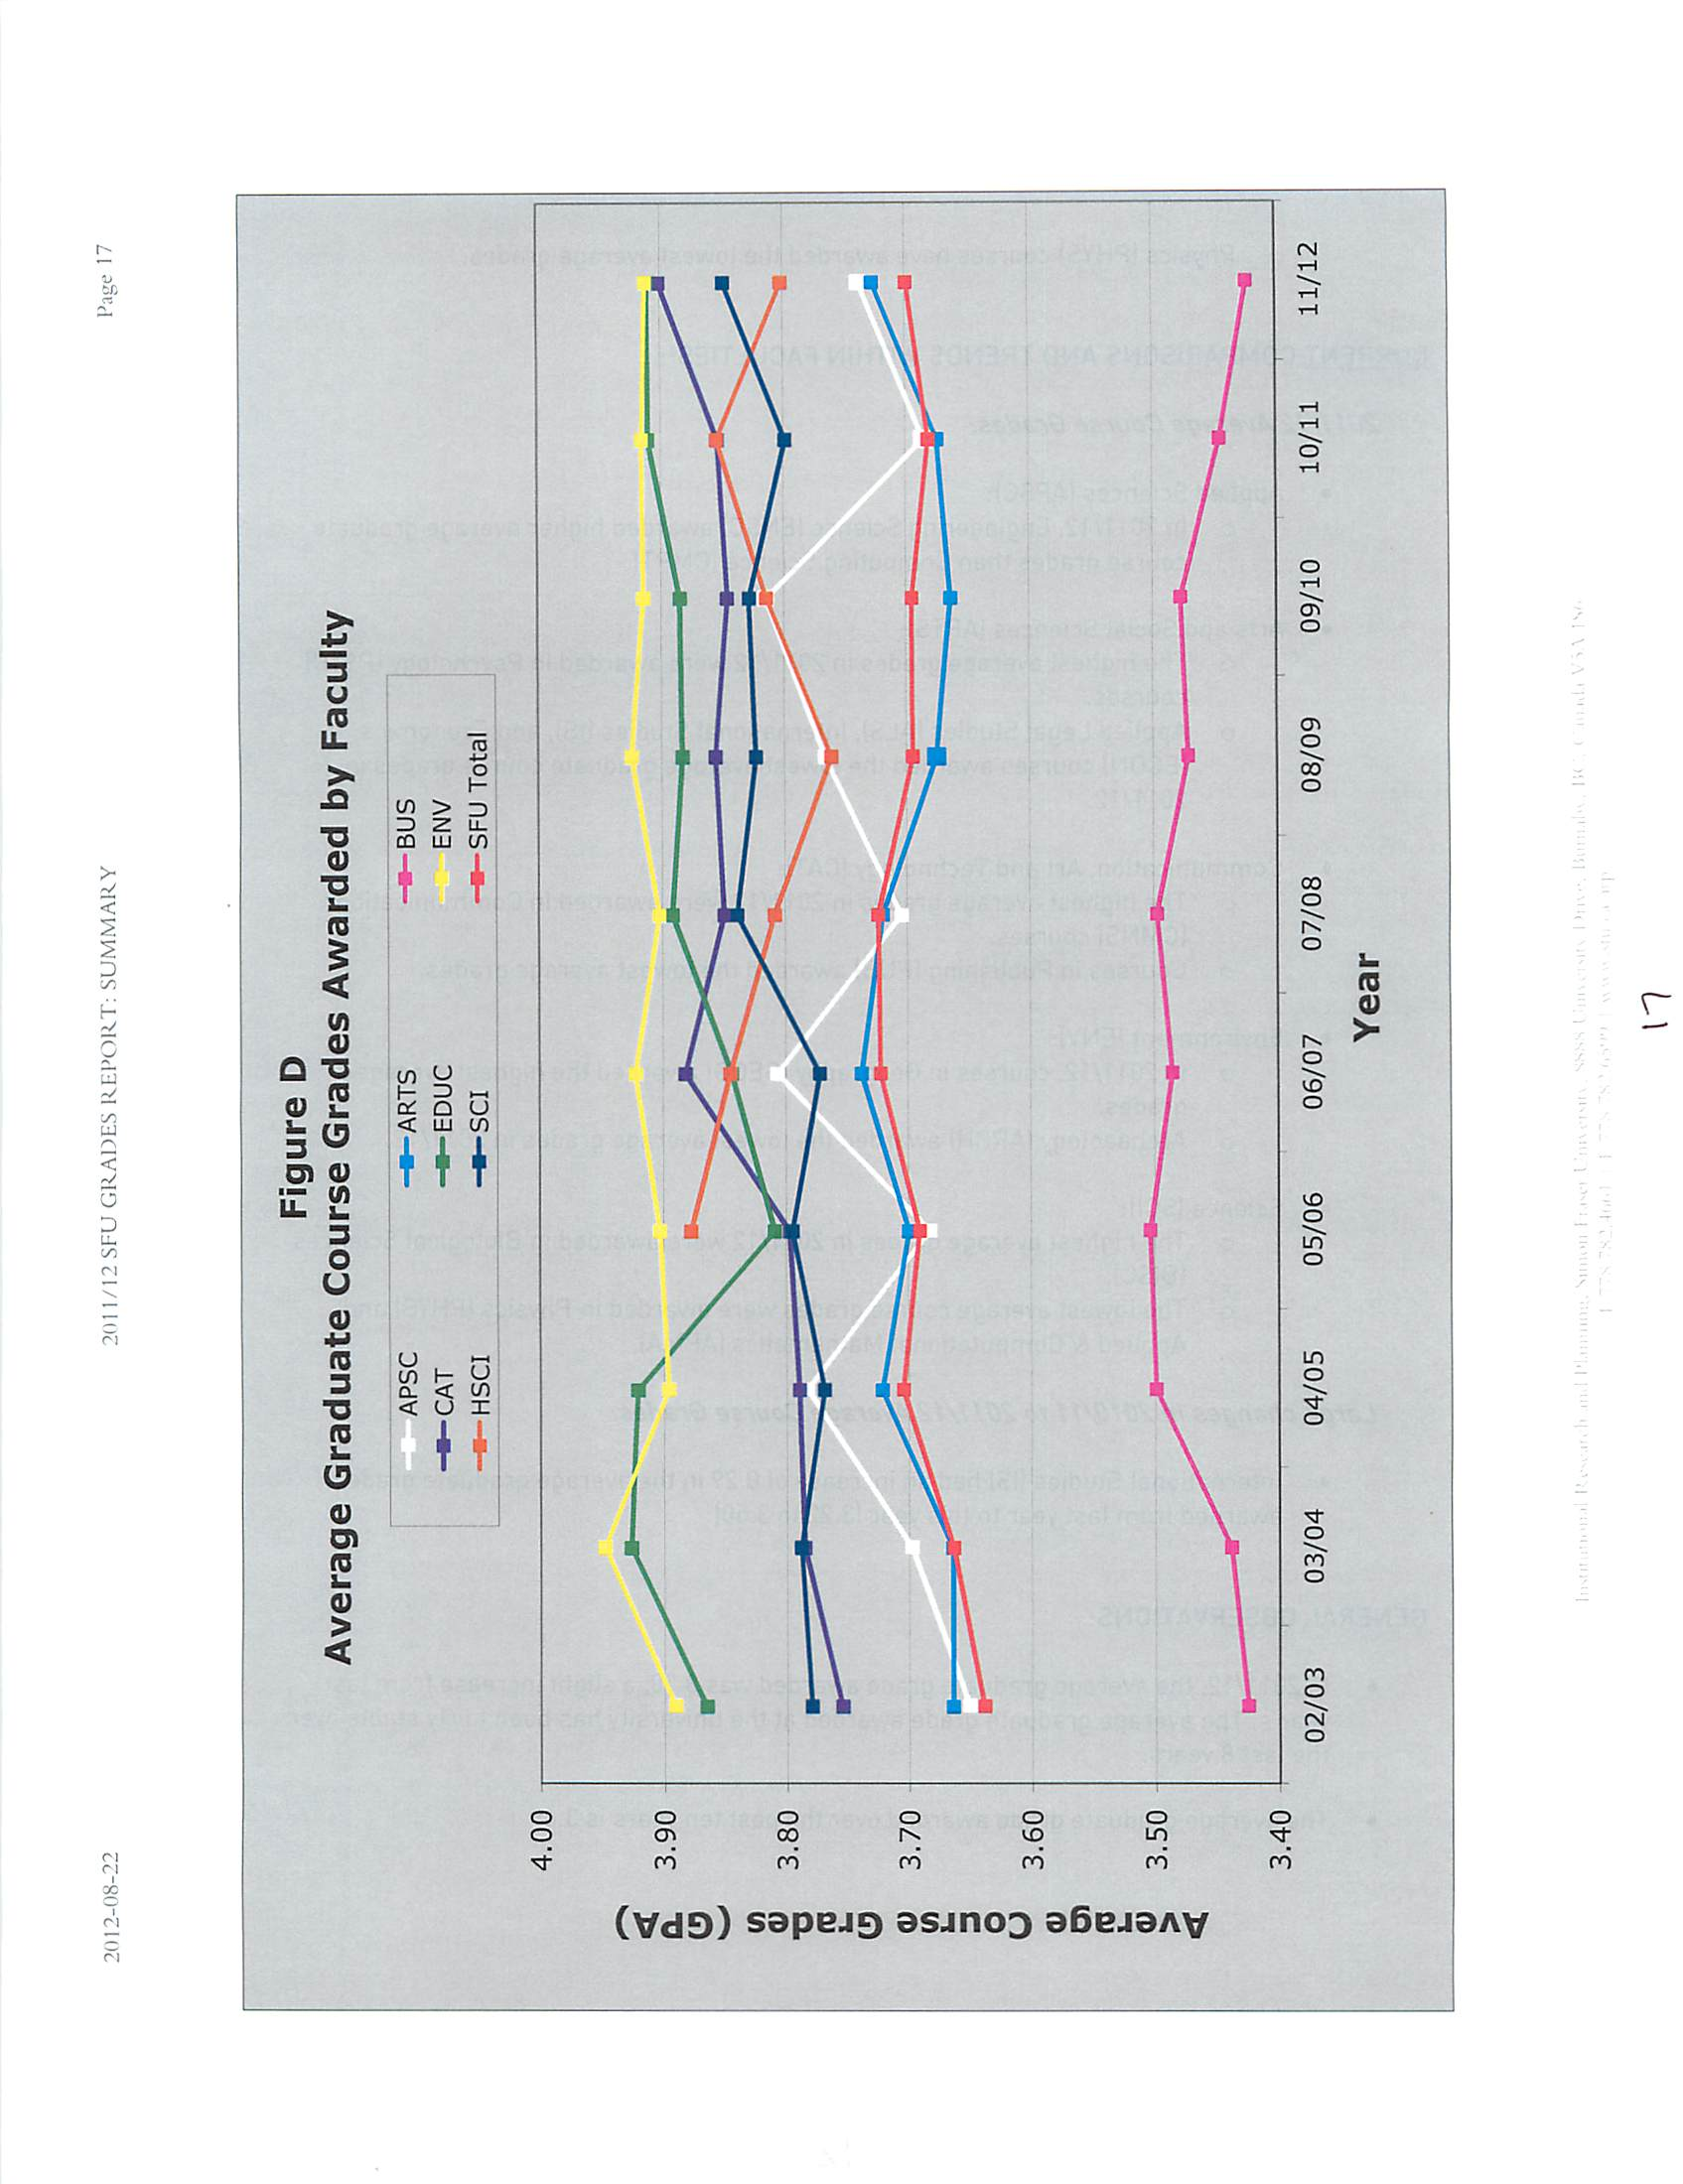
The Faculty of Environment (ENV) has awarded the highest average graduate level course
grades in nine of the last ten years, with an average awarded grade of 3.91.
•
The Faculty of Education (EDUC) has been one of the top two Faculties in eight of the last
ten years, in terms of average graduate grades awarded (10-year average is 3.88.)
•
The Faculties of Communication, Art and Technology (CAT), Health Sciences (HSCI), and
Science (SCI) have awarded similar average grades over the past decade, with 10-year
averages of 3.83, 3.81 and 3.80, respectively.
•
The Faculties of Applied Sciences (APSC) and Arts and Social Sciences (ARTS) have
generally awarded lower average graduate grades than all other Faculties except
Business (10-year averages of 3.73 and 3.70, respectively.)
•
The Beedie School of Business (BUS) has awarded the lowest average grades in each of
the last ten years, with an average grade awarded of 3.46.
;'
«•"
2012-08-22
201 1/12 SFU GRADES REPORT: SUMMARY
Page 16
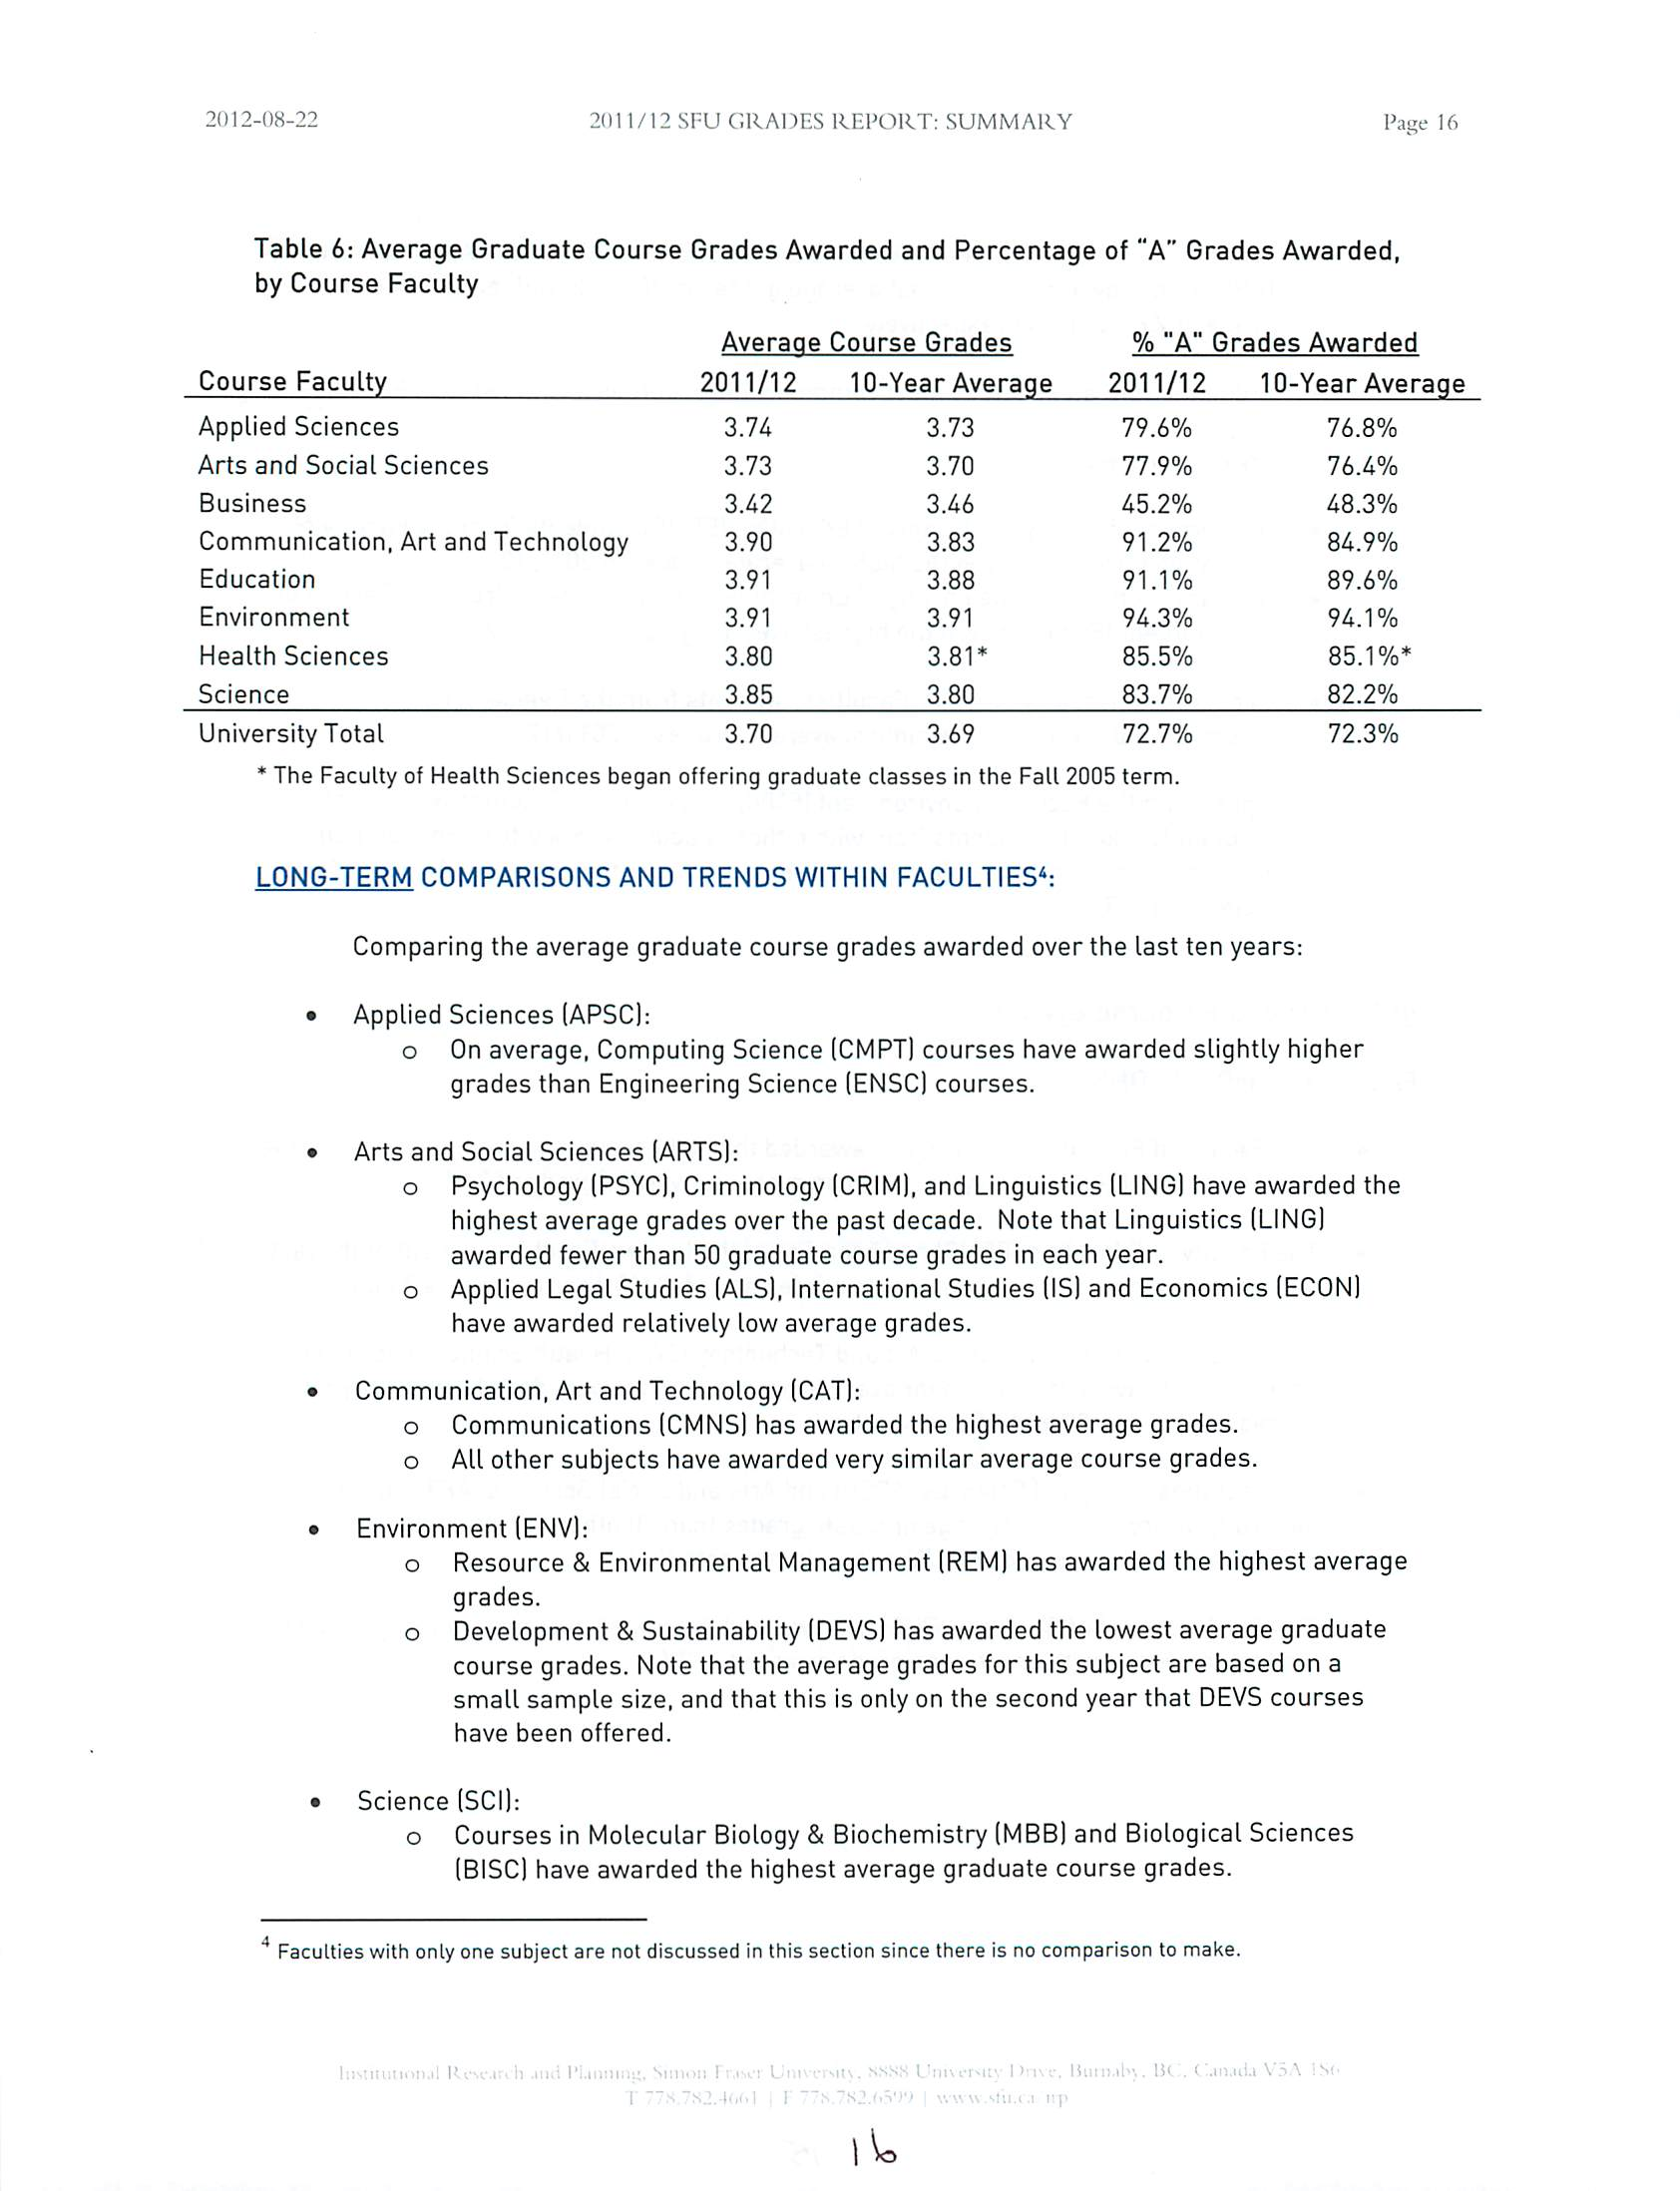
Table 6: Average Graduate Course Grades Awarded and Percentage of "A" Grades Awarded,
by Course Faculty
Average Course Grades
% "A" Grades Awarded
Course Faculty
2011/12
10-Year Average
2011/12
10-Year Average
Applied Sciences
3.74
3.73
79.6%
76.8%
Arts and Social Sciences
3.73
3.70
77.9%
76.4%
Business
3.42
3.46
45.2%
48.3%
Communication, Art and Technology
3.90
3.83
91.2%
84.9%
Education
3.91
3.88
91.1%
89.6%
Environment
3.91
3.91
94.3%
94.1%
Health Sciences
3.80
3.81*
85.5%
85.1%*
Science
3.85
3.80
83.7%
82.2%
University Total
3.70
3.69
72.7%
72.3%
*The Faculty of Health Sciences began offering graduate classes in the Fall 2005 term.
LONG-TERM COMPARISONS AND TRENDS WITHIN FACULTIES6:
Comparing the average graduate course grades awarded over the last ten years:
•
Applied Sciences (APSC):
o
On average, Computing Science (CMPT) courses have awarded slightly higher
grades than Engineering Science
(ENSC) courses.
•
Arts and Social Sciences (ARTS):
o
Psychology (PSYC), Criminology (CRIM), and Linguistics (LING) have awarded the
highest average grades over the past decade. Note that Linguistics (LING)
awarded fewer than 50 graduate course grades in each year.
o
Applied Legal Studies (ALS), International Studies (IS) and Economics (ECON)
have awarded relatively low average grades.
•
Communication, Art and Technology (CAT):
o
Communications (CMNS) has awarded the highest average grades,
o All other subjects have awarded very similar average course grades.
•
Environment (ENV):
o
Resource & Environmental Management (REM) has awarded the highest average
grades,
o
Development & Sustainability (DEVS) has awarded the lowest average graduate
course grades. Note that the average grades for this subject are based on a
small sample size, and that this is only on the second year that DEVS courses
have been offered.
•
Science (SCI):
o
Courses in Molecular Biology & Biochemistry (MBB) and Biological Sciences
(BISC) have awarded the highest average graduate course grades.
Faculties with only one subject are not discussed in this section since there is no comparison to make.
|i
|W
2012-08-22
4.00
<
Q.
3.90
U
«w*
</)
3.80
ru
L.
ID
o
3.70
(/>
i-
3
O
u
3.60
a
O)
(D
L.
>
3.50
<
3.40
201 1/12 SFU GRADES REPORT: SUMMARY
Figure D
Average Graduate Course Grades Awarded by Faculty
APSC
-•-ARTS
-•-BUS
-•-CAT
-•-EDUC
ENV
-•-HSCI
-•-SCI
-•-SFU Total
Page 17
02/03
03/04
04/05
05/06
06/07
07/08
Year
08/09
09/10
10/11
11/12
•
n
2012-08-22
201 1/12 SFU GRADES REPORT: SUMMARY
Page IS
o
Physics (PHYS) courses have awarded the lowest average grades.
CURRENT COMPARISONS AND TRENDS WITHIN FACULTIES6:
2011/12Average Course Grades:
•
Applied Sciences (APSC):
o
In 2011/12, Engineering Science (ENSC) awarded higher average graduate
course grades than Computing Science
(CMPT).
•
Arts and Social Sciences (ARTS):
o
The highest average grades in 2011/12 were awarded in Psychology (PSYC)
courses,
o
Applied Legal Studies (ALS), International Studies (IS), and Economics
(ECON) courses awarded the lowest average graduate course grades in
2011/12.
•
Communication, Art and Technology(CAT):
o
The highest average grades in 2011/12 were awarded in Communications
(CMNS) courses,
o
Courses in Publishing (PUB) awarded the lowest average grades.
•
Environment (ENV):
o
In 2011/12, courses in Geography (GEOG) awarded the highest average
grades,
o
Archaeology (ARCH) awarded the lowest average grades in 2011/12.
•
Science (SCI):
o
The highest average grades in 2011/12 were awarded in Biological Sciences
(BISC).
o
The lowest average course grades were awarded in Physics (PHYS) and
Applied & Computational Mathematics (APMA).
Large changes in 2010/11 to 2011/12Average Course Grades:
•
International Studies (IS) had an increase of 0.29 in the average graduate grade
awarded from last year to this year (3.22to 3.50)
GENERAL OBSERVATIONS:
•
In 2011/12, the average graduate grade awarded was 3.70, a slight increase from last
year's. The average graduate grade awarded at the university has been fairly stable over
the last 8 years.
•
The average graduate grade awarded over the past ten years is 3.69.
i'
2(112-06-29
SFU
Fall 2011 Undergraduate Student Survey: Highlights
Highlights
Fall 201 i SFU Undergraduate Student Survey
The Undergraduate Student Survey has been conducted at Simon Fraser University every Fall semester
since 1992'(except in 2002.) This annual survey provides essential feedback on the academic
experiences and concerns of our undergraduate students. Every year, students are asked about their
experiences with course availabilityat SFU, as well as a range of other topics that change from year to
year. The new topics for this year's survey were teaching/curriculum, services, and student engagement.
Atotal of 6,953 undergraduate students participated in this year's survey. This represents a response
rate of 28.5%, which is very similar to last year's response rate of 28.6%. Assuming that the sample is
representative, proportions calculated on all respondents are accurate within ±1.2%, 19 times out of20:.
The full report is available on the Institutional Research and Planning web-site:
http://www.sfu.ca/irp/surveys/uqss/index.html
General Experience
•
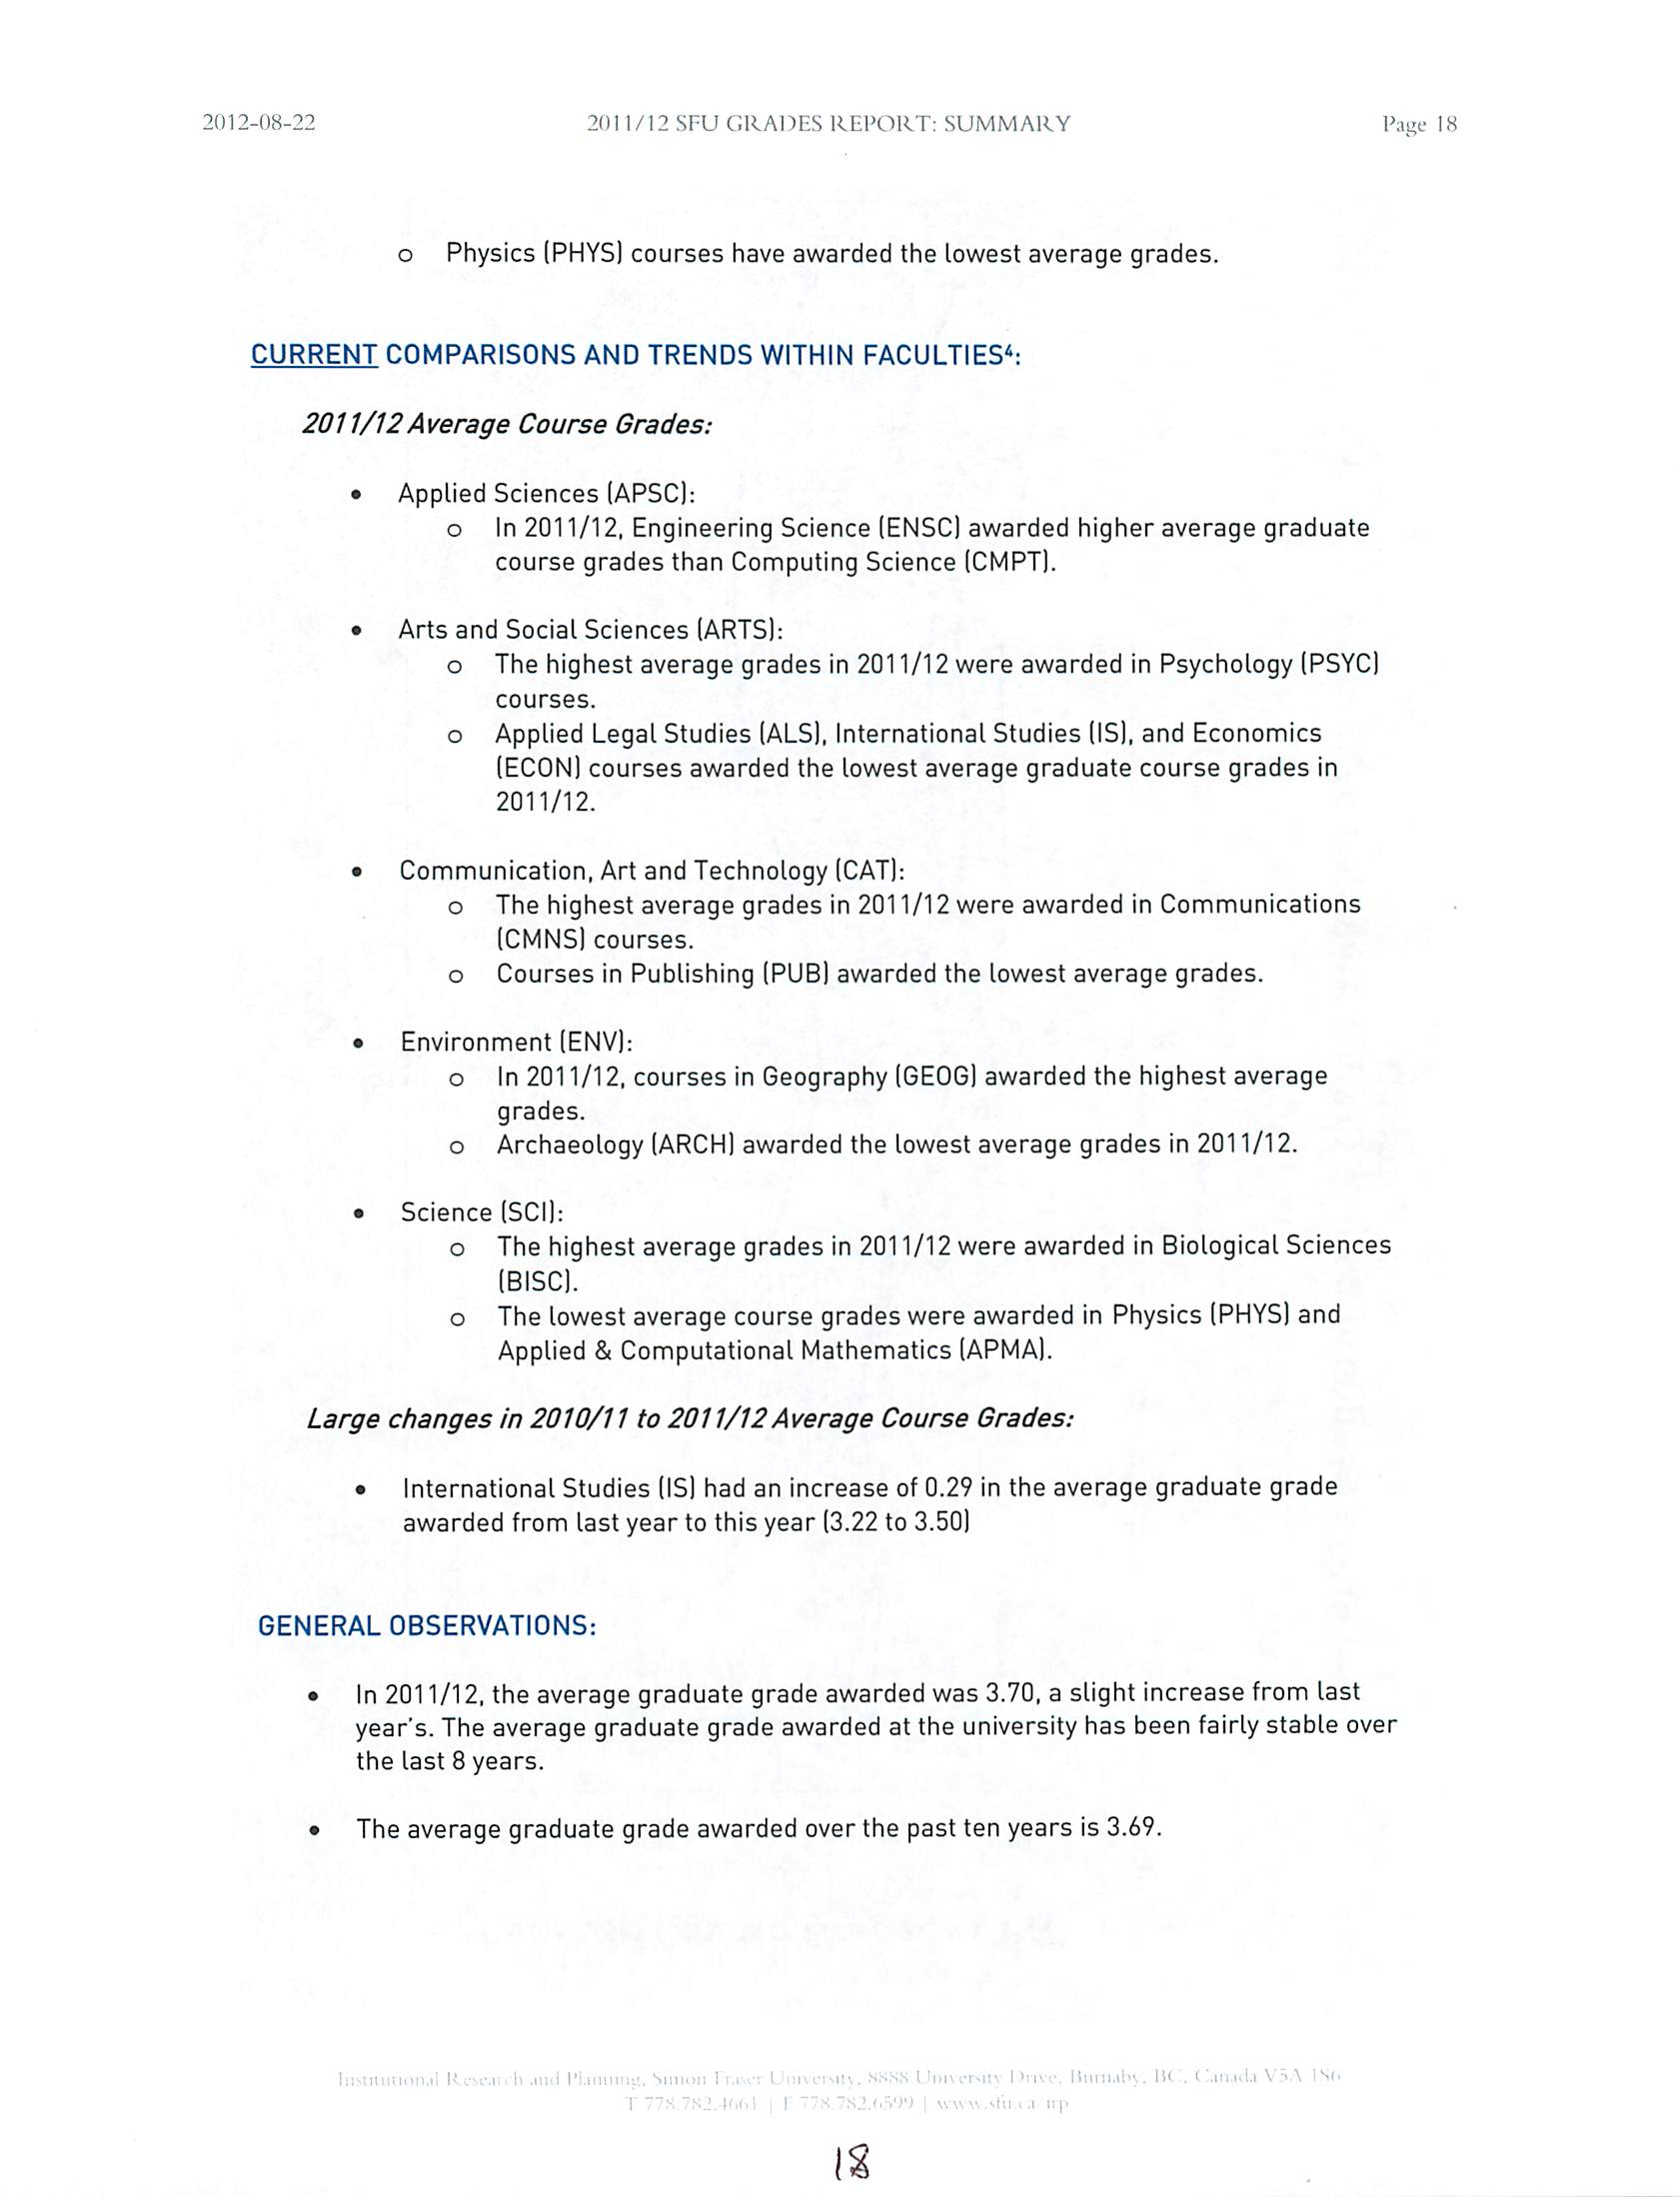
89% of respondents are very/somewhat satisfied with their general SFU experience.
•
When students were asked what single thing SFU could do to improve their experience here, the
most common responses were:
o
improve facilities,
o
improve course availability, variety, and scheduling, and
o
improve student life.
If SFU Could Do One Thing to Improve Your Experience Here,
What Would it Be? (Top 10 Suggestions)
Facilities
Course Availability, Variety and Scheduling
Student Life
Services/Advising
Transportation
University Administration/Policy Decisions
Tuition/Fees and Financial Aid
Course Content, Format, and Workload
Instructors and TAs
Food
0%
5%
10%
15%
20%
It should be noted that a change in methodology, from in-class paper survey to online survey, was instituted in 2006. The paper
surveys, administered to a random sample
of classes, resulted in a "captive audience" and high response rates. In contrast, the
online surveys, usually administered to the entire SFU undergraduate student population, result in larger samples but lower
response rates, which could make the results less generalizable. Measures were taken to reduce potential biases resulting from a
lower response rate.
2This margin oferror applies toestimates based onthe entire sample, assuming that the sample is representative.
•
l
.
11
2(112-06-29
Fall 201 I Undergraduate Student Survey: Highlights
l»ai»<?
•
When asked to compare their experience at SFU to their expectations when they first arrived:
o
14% of respondents said that SFU has exceeded their expectations,
o
67% said SFU has met their expectations, and
o
19% indicated
that SFU has failed to meet their expectations.
Course Availability
In general, this year"s course availability results represent a step backwards from the Fall 2010
results.
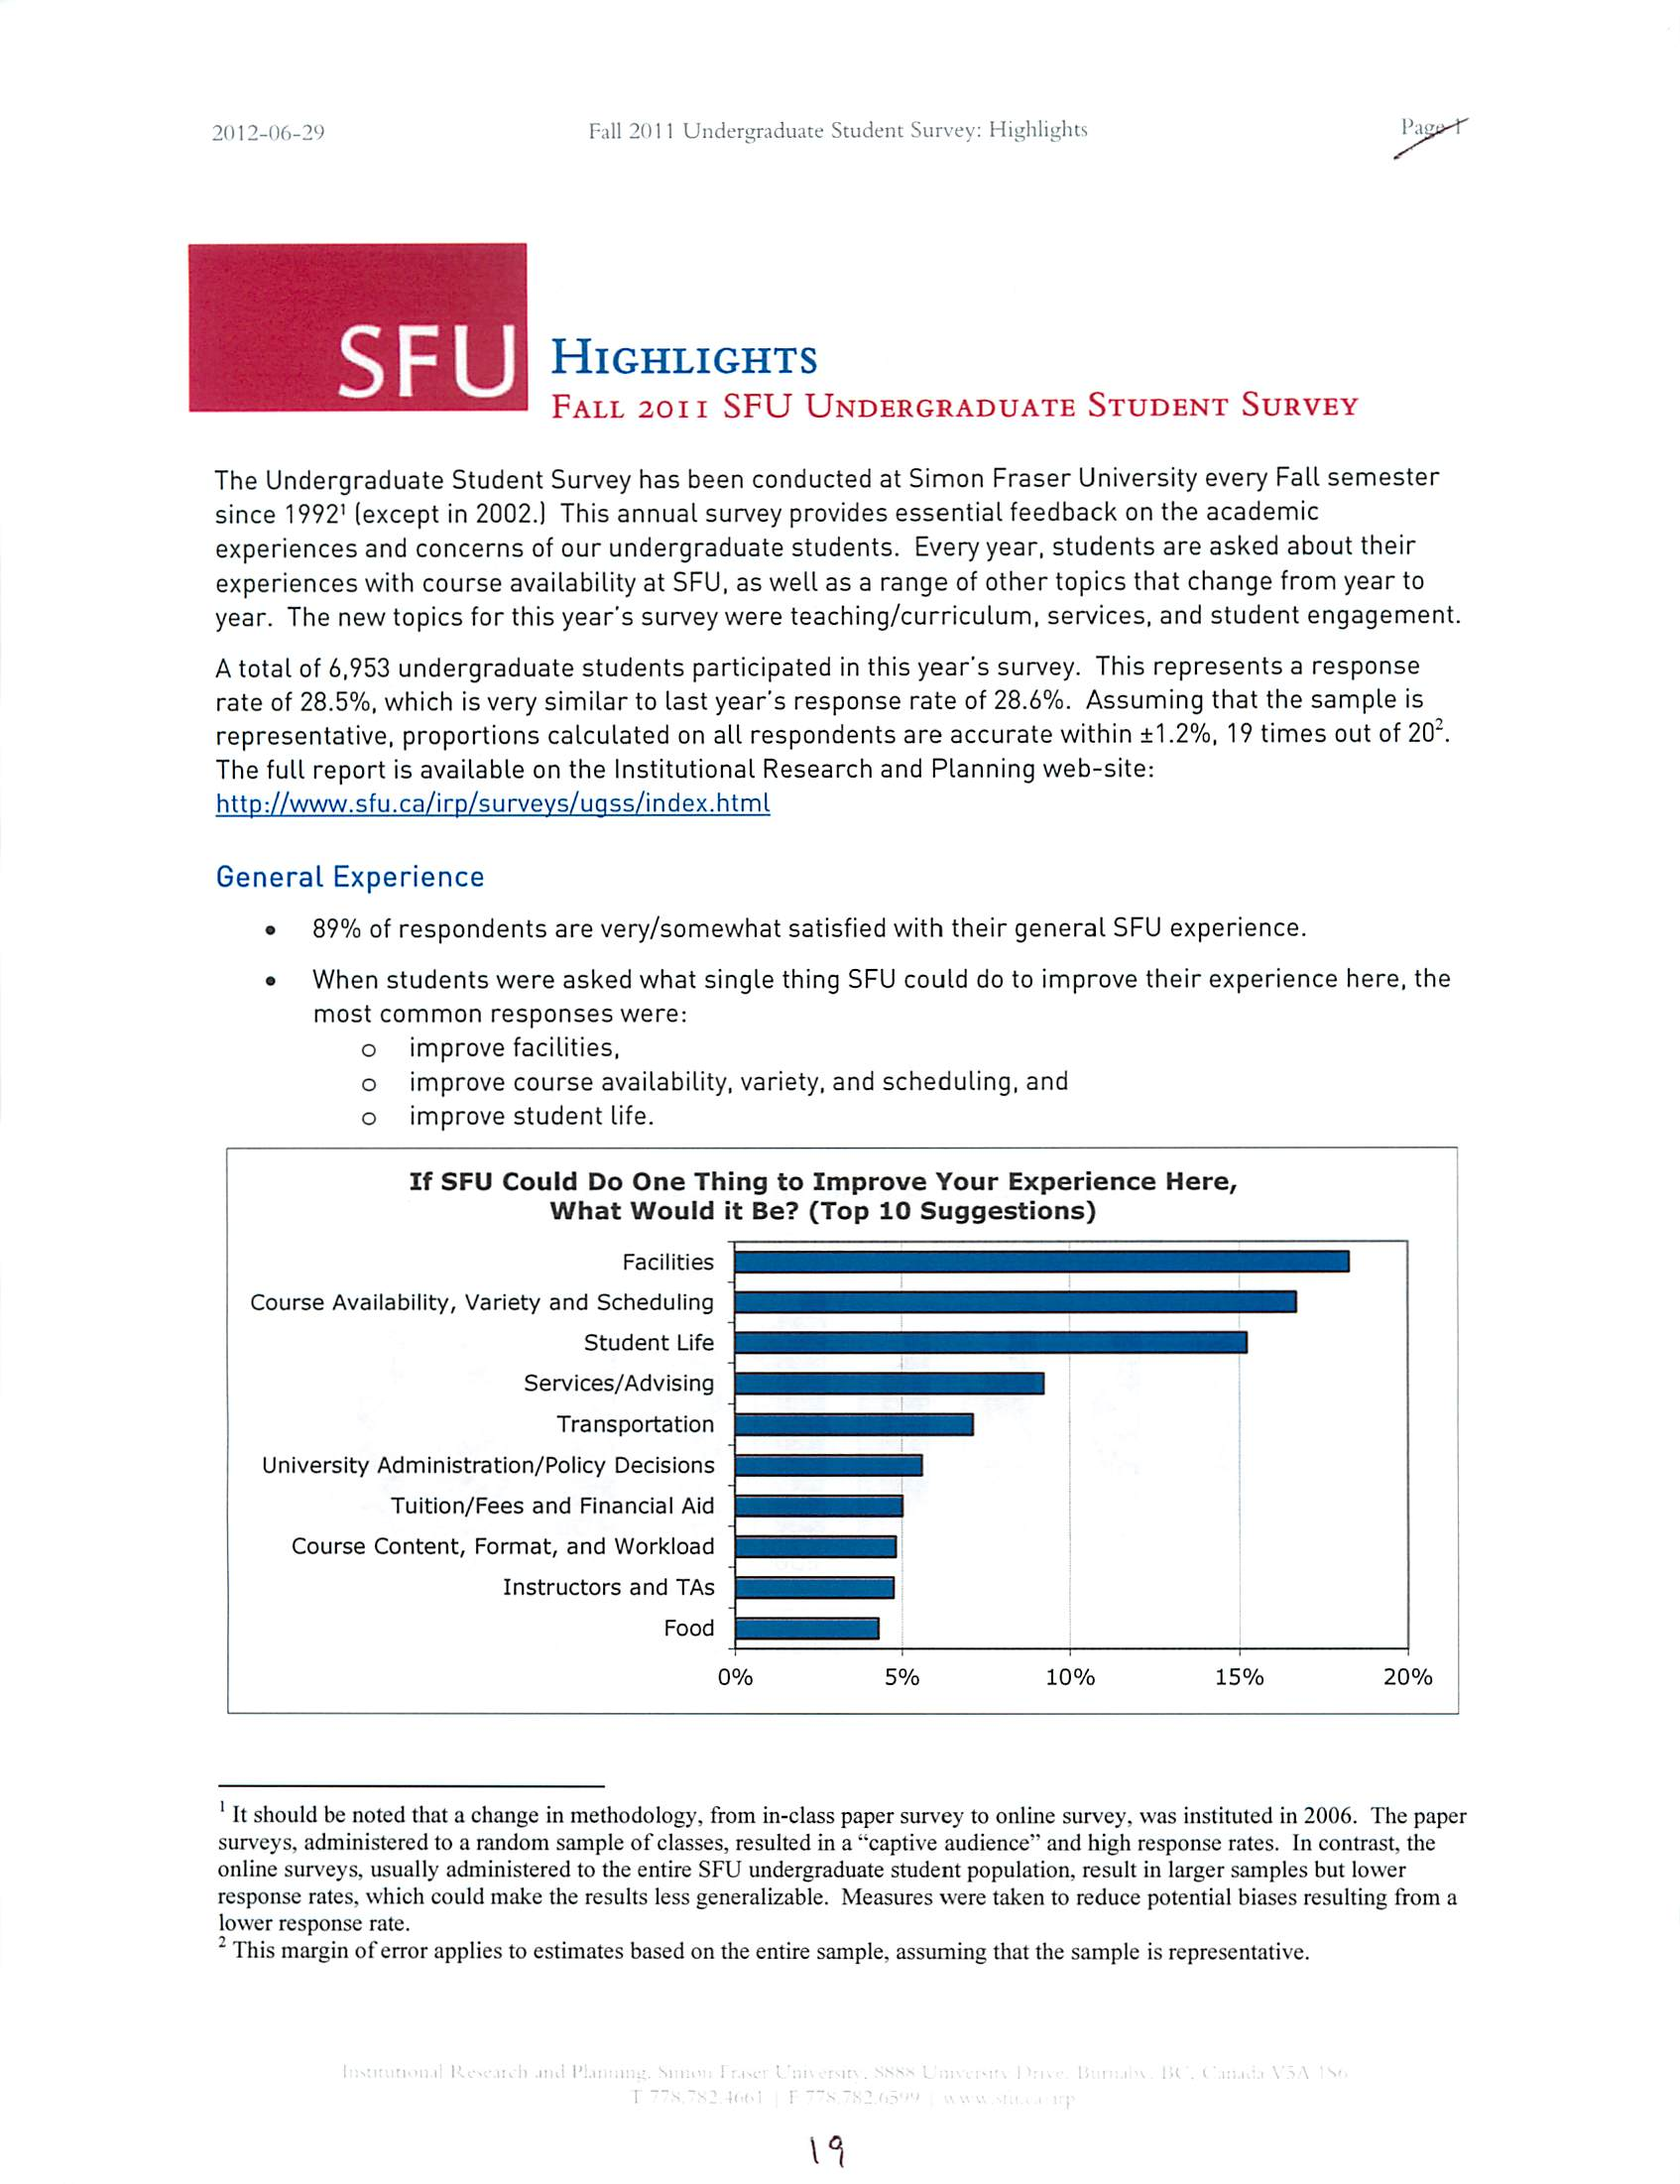
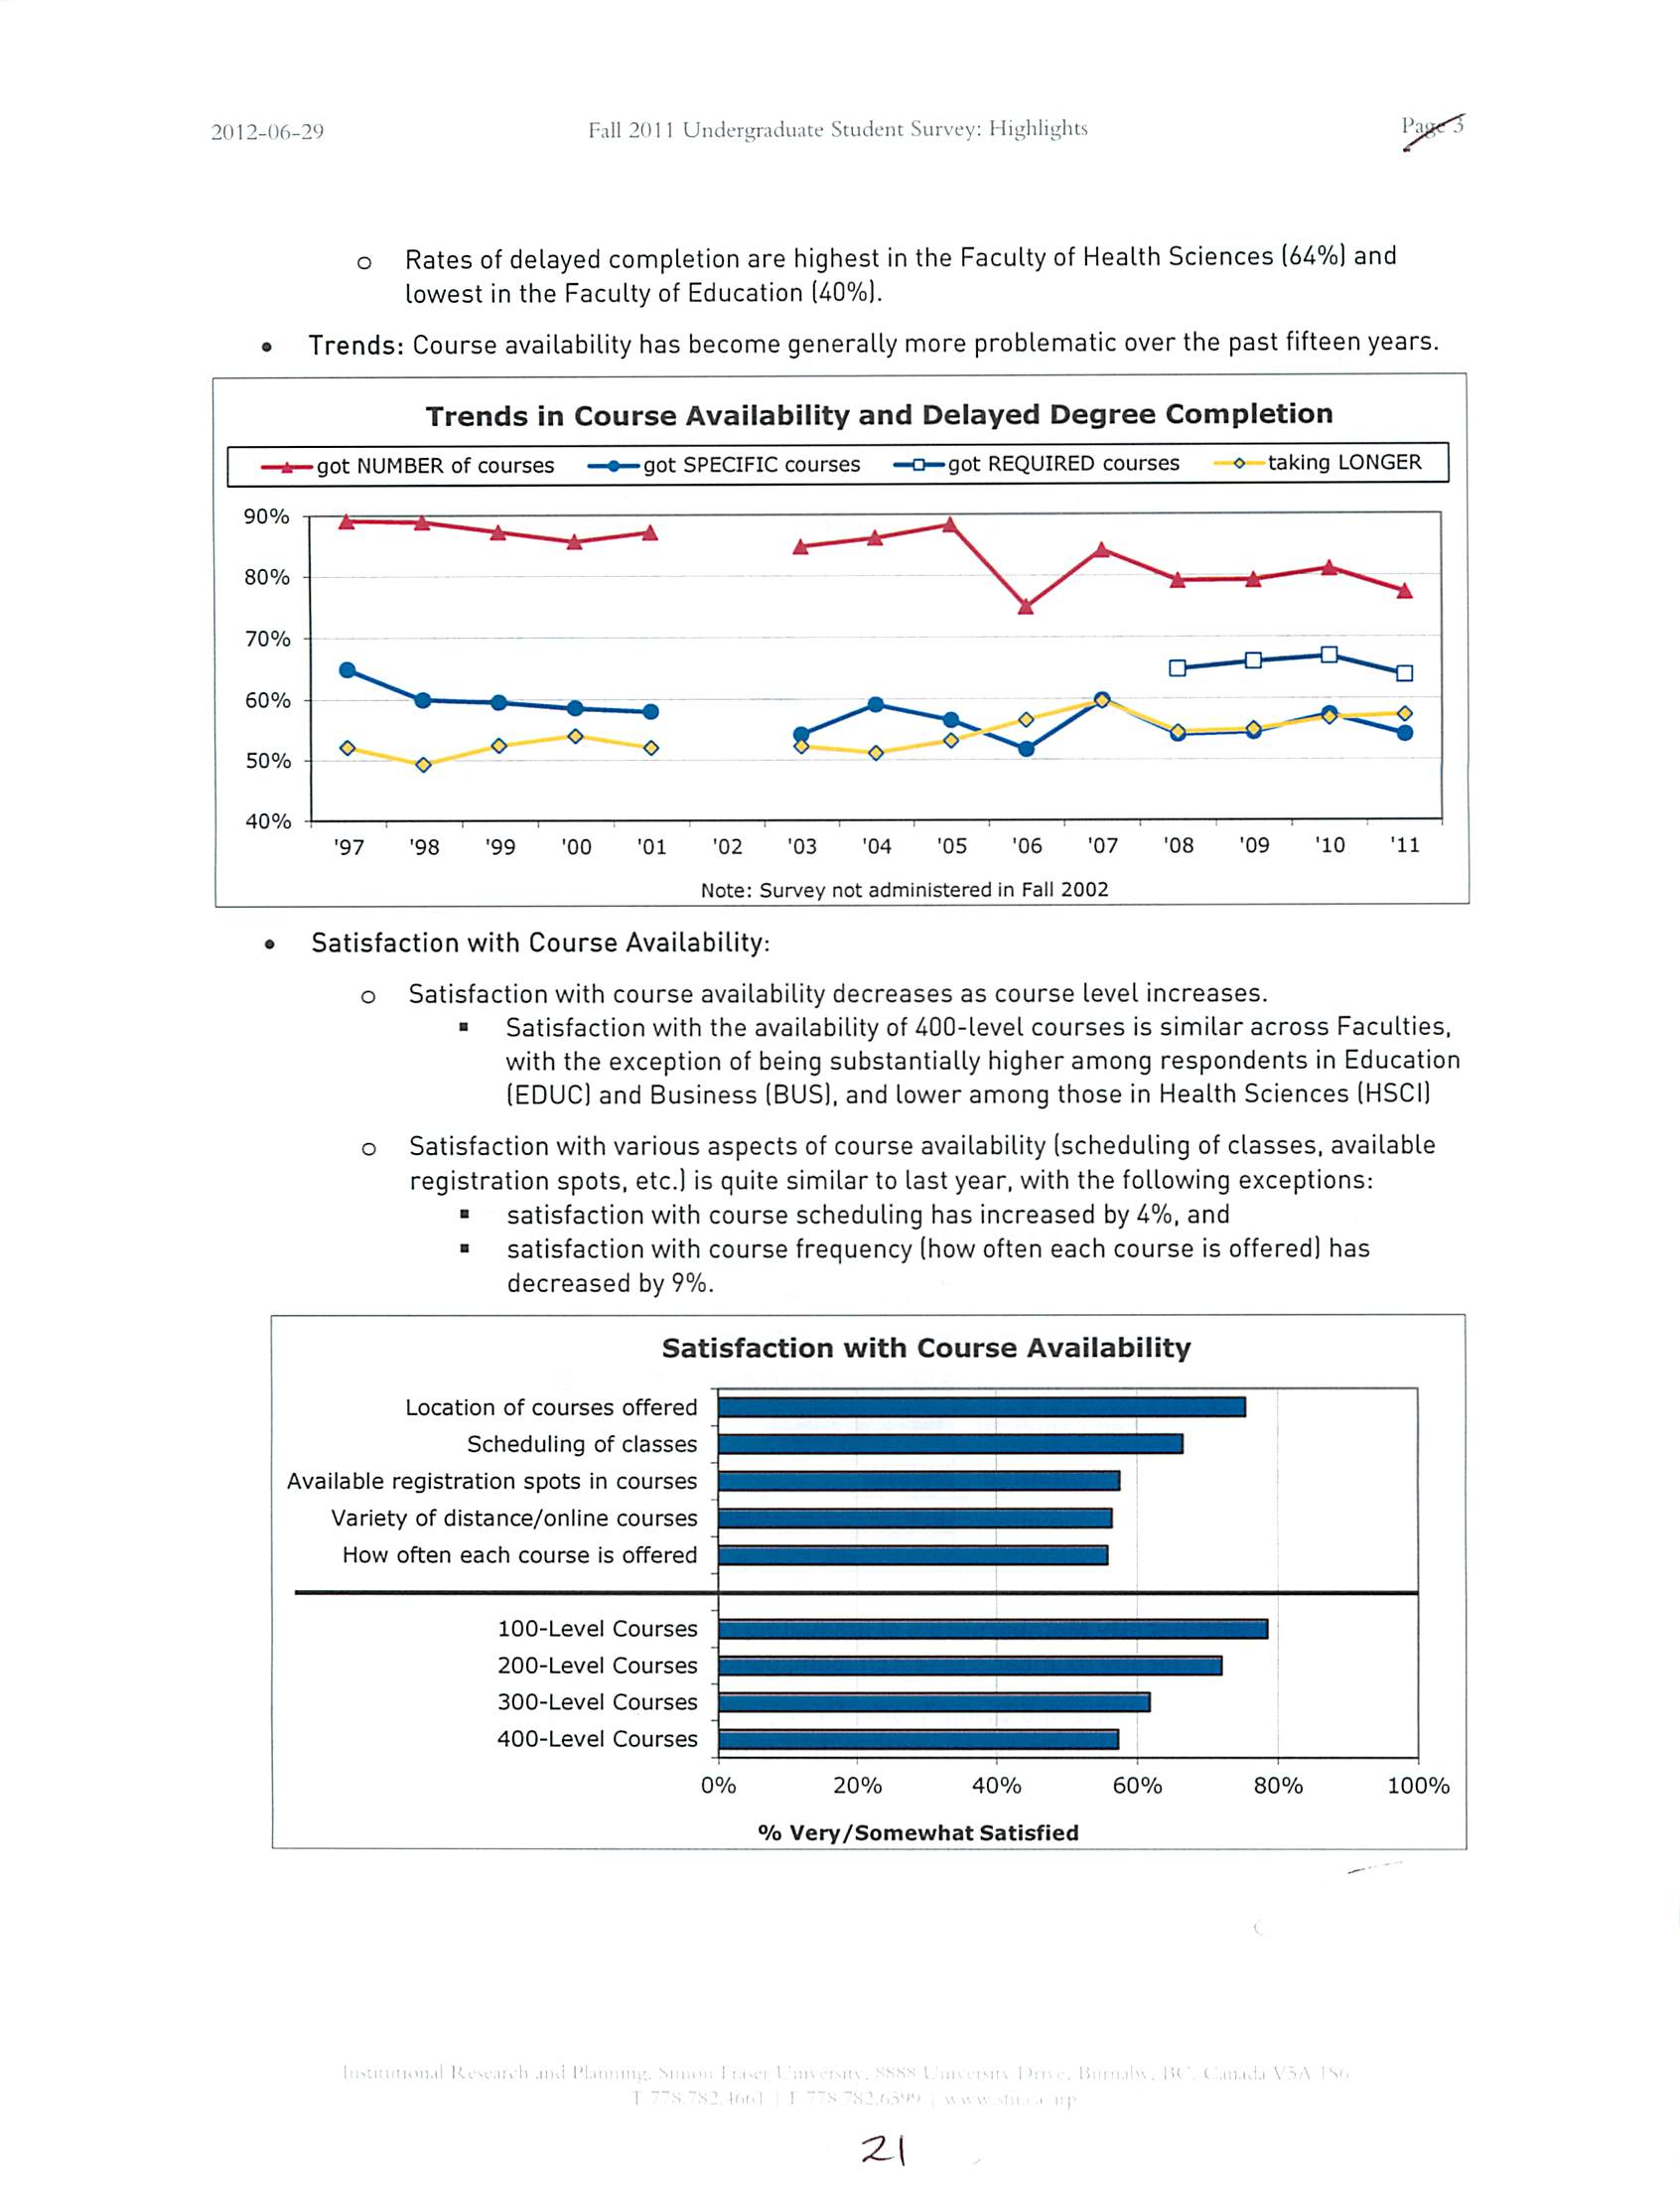
NUMBER of Courses: 77% of respondents were able to register in the number of courses they
wanted this fall, a statistically significant decrease from last year's rate of 81%.
SPECIFIC Courses: 54% were able to register in all of the specific courses they wanted to take
this term. This is on par with the 2009 rate, and is a statistically significant decrease from last
year's rate of 57%.
REQUIRED Courses: 64% were able to register in all of the REQUIRED courses they wanted this
term (vs. 67% last fall, a statistically significant decrease.) Registration difficulty was most often
due to:
o full classes,
o
scheduling conflicts,
o courses not being offered this term,
o
insufficient travel time to get between courses offered at different campuses, and
o inconvenient scheduling.
o
Respondents in the Faculty of Education were most successful in registering for all of the
required courses they wanted to take, while those in Health Sciences and in Arts and
Social Sciences were least successful. This is the same pattern as in Fall 2010.
Fall 2011 Registration Success, by Faculty
• NUMBER of Courses
HREQUIRED Courses
DSPECIFIC Courses
100% i
V)
V
S2
80%
U 60%
•S
40% -
"5
tD
20%
°
0% -
Mill
APSC
ARTS
BUS
CAT
EDUC
nib
ENV
HSCI
SCI
SFU
Overall
Delayed Credential Completion: 57%of respondents reported that they are taking longer than
expected to complete their credential (the same as last year's rate.)
o
85% of students felt that it was important to finish within their expected timeframe.
o
Commonly cited reasons for delay include:
•
course availability issues (e.g. full courses, schedule conflicts, courses not
offered, etc.; 66% of delayed respondents),
•
taking a reduced course load
(50%), and
•
employment
(40%).
11
2D
2012-06-29
Fall 201 1 Undergraduate Student Survey: Highlights
90%
o
Rates of delayed completion are highest in the Faculty of Health Sciences (64%) and
lowest in the Faculty of Education (40%).
Trends: Course availability has become generally more problematic over the past fifteen years.
Trends in Course Availability and Delayed Degree Completion
•got NUMBER of courses
•got SPECIFIC courses
•got REQUIRED courses
o taking LONGER
80% -
70% -
40%
'97
'98
'99
'00
'01
'02
'03
'04
'05
'06
'07
Note: Survey not administered in Fall 2002
'08
'09
'10
'11
Satisfaction with Course Availability:
o
Satisfaction with course availability decreases as course level increases.
•
Satisfaction with the availability of 400-level courses is similar across Faculties,
with the exception of being substantially higher among respondents in Education
(EDUC) and Business (BUS), and lower among those in Health Sciences (HSCI)
o
Satisfaction with various aspects of course availability (scheduling of classes, available
registration spots, etc.) is quite similar to last year, with the following exceptions:
•
satisfaction with course scheduling has increased by 4%, and
•
satisfaction with course frequency (how often each course is offered) has
decreased by 9%.
Satisfaction with Course Availability
Location of courses offered
Scheduling of classes
Available registration spots in courses )
Variety of distance/online courses
How often each course is offered
100-Level Courses
200-Level Courses
300-Level Courses
400-Level Courses
0%
20%
40%
%
Very/Somewhat Satisfied
60%
80%
:
•In • .i
z
100%
2012-06-29
Fall 201 1 Undergraduate Student Survey: Highlights
Teaching/Curriculum
•
Quality of Teaching: 86% of respondents are satisfied with the overall quality of teaching at SFU.
•
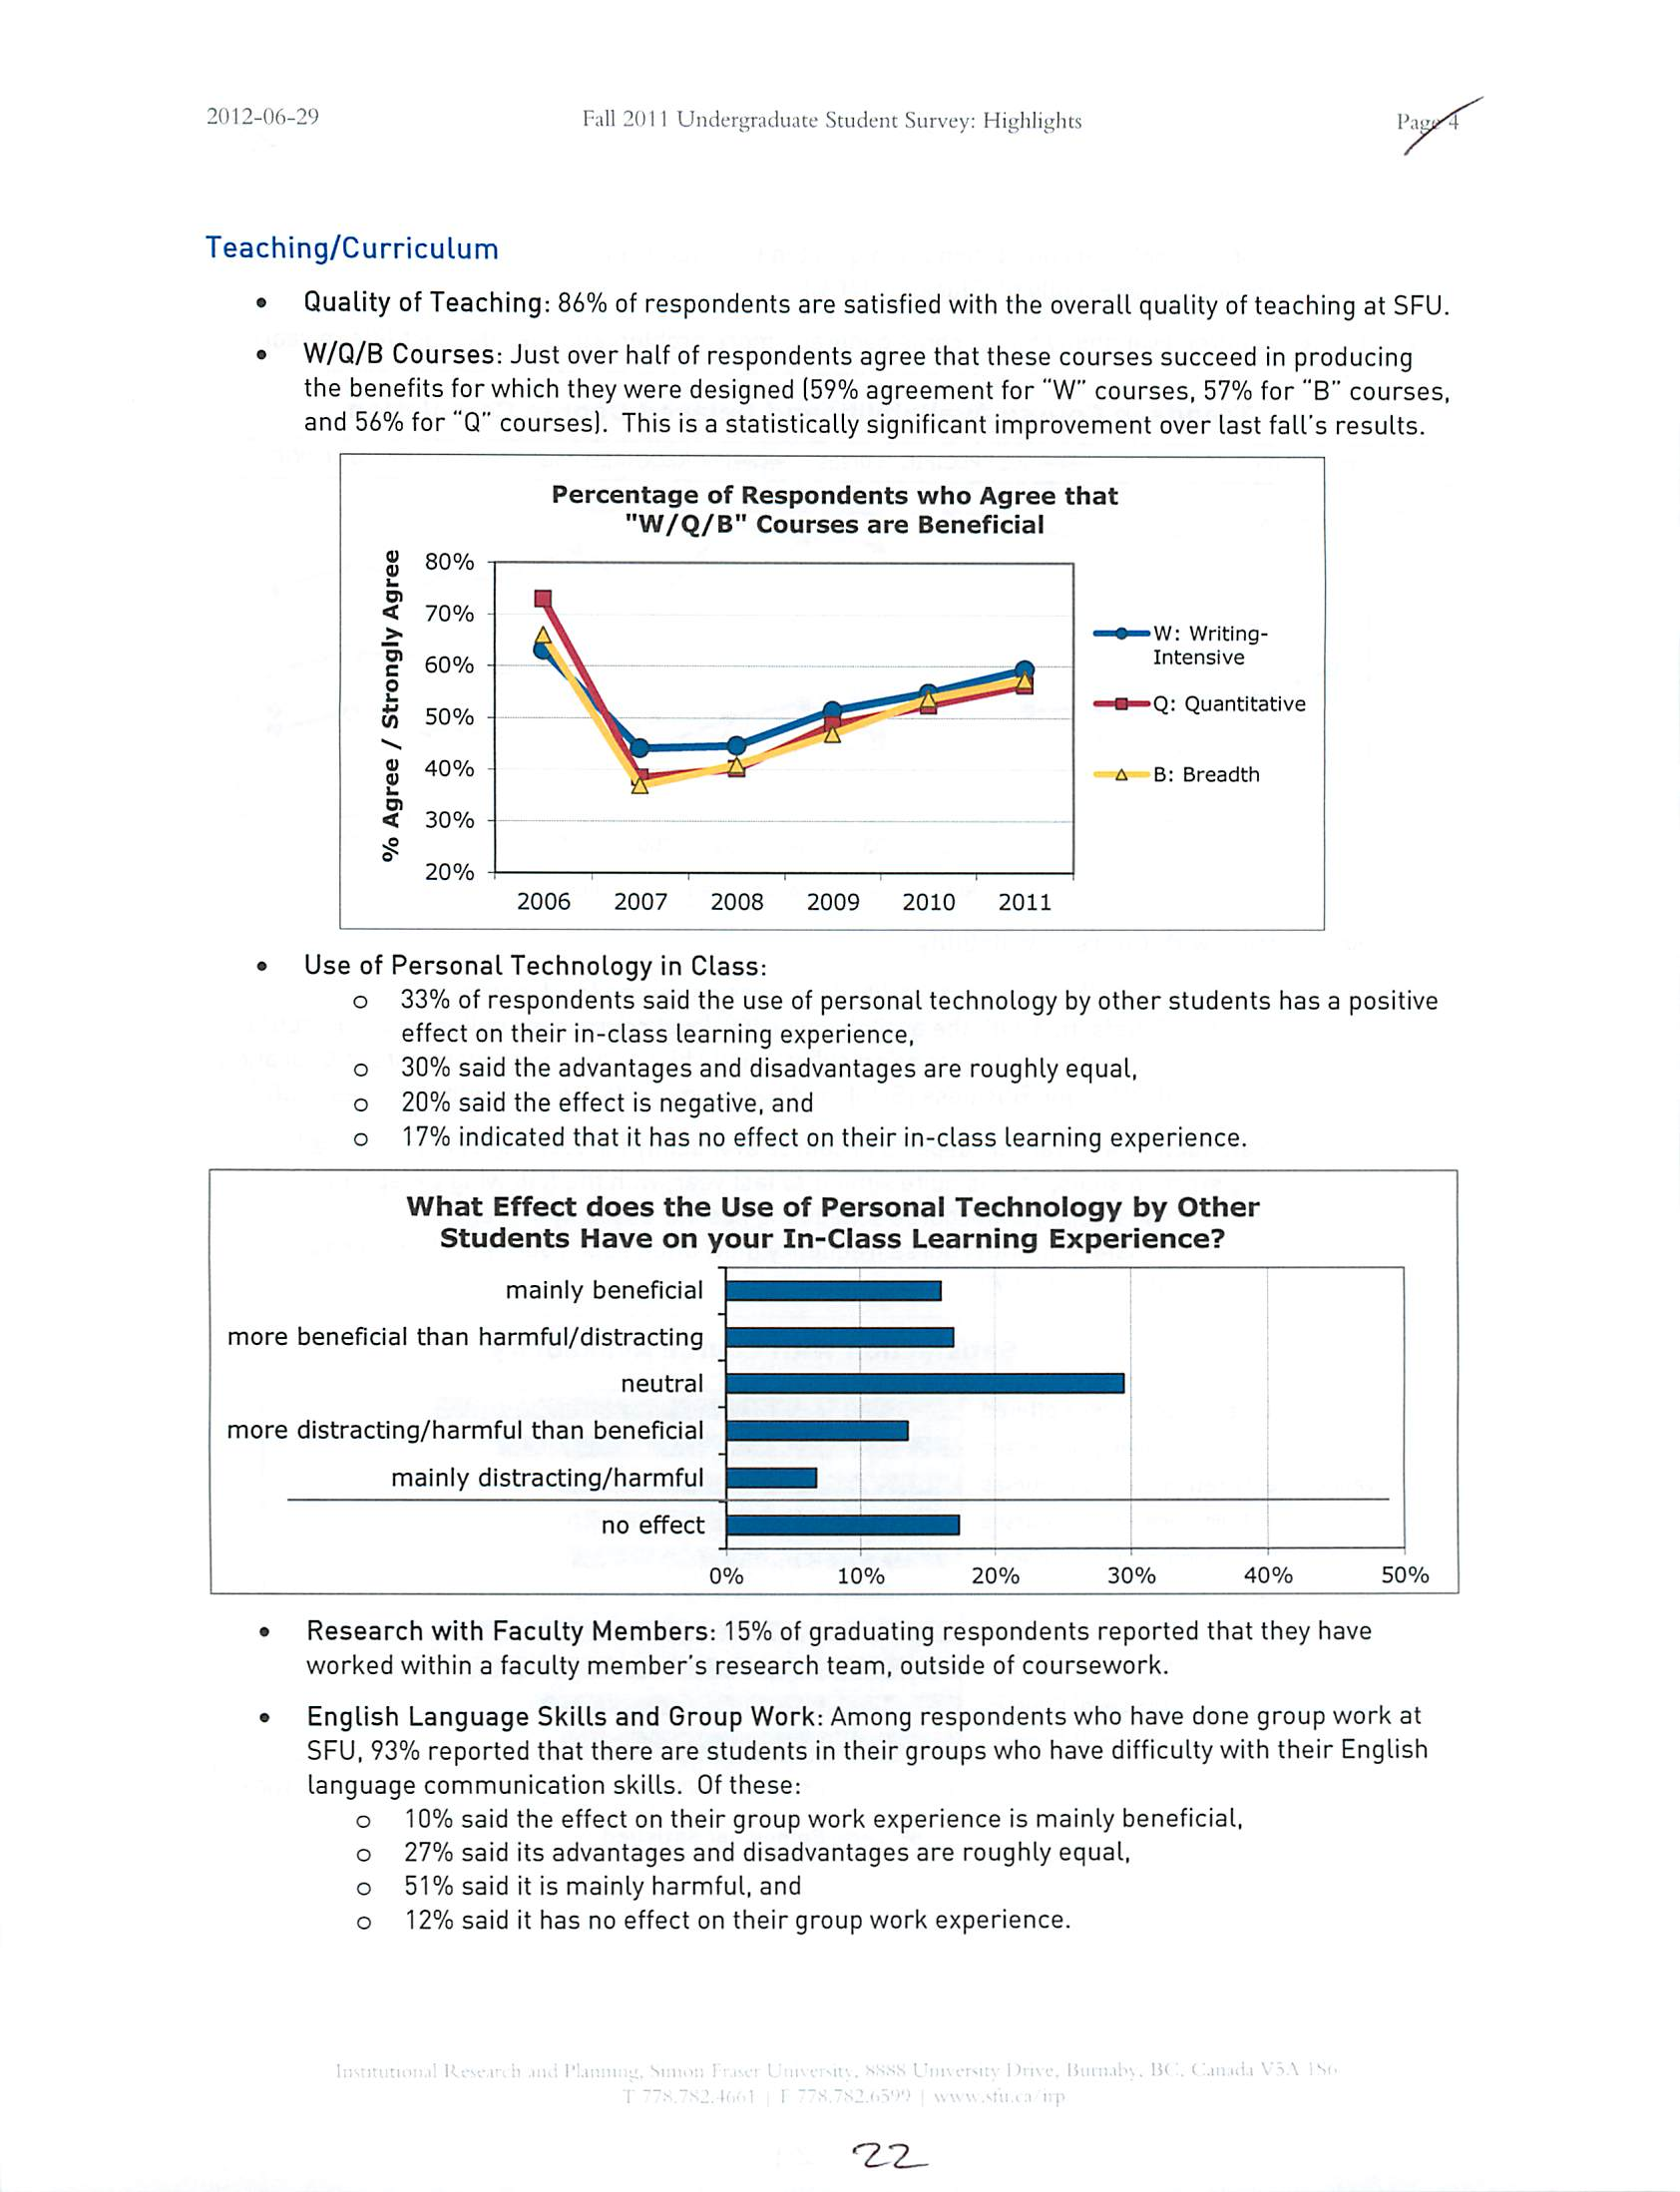
W/Q/B Courses: Just over half of respondents agree that these courses succeed in producing
the benefits for which they were designed (59% agreement for "W" courses, 57% for "B" courses,
and 56% for "Q" courses). This is a statistically significant improvement over last fall's results.
0)
QJ
L.
U)
<
>
?
60%
o
U)
80%
70%
50%
$ 40%
< 30% H
20%
Percentage of Respondents who Agree that
"W/Q/B" Courses are Beneficial
•W: Writing-
Intensive
•Q: Quantitative
A B: Breadth
2006 2007 2008 2009 2010 2011
Use of Personal Technology in Class:
o 33% of respondents said the use of personal technology by other students has a positive
effect on their in-class learning experience,
o
30% said the
advantages and disadvantages are roughly equal,
o
20% said the effect is negative, and
o
17% indicated that it
has no effect on their in-class learning experience.
What Effect does the Use of Personal Technology by Other
Students Have on your In-Class Learning Experience?
mainly beneficial
more beneficial than harmful/distracting
neutral
more distracting/harmful than beneficia
mainly distracting/harmful
no effect
50%
Research with Faculty Members: 15% of graduating respondents reported that they have
worked within a faculty member's research team, outside of coursework.
English Language Skills and Group Work: Among respondents who have done group work at
SFU, 93% reported that there are students in their groups who have difficulty with their English
language communication skills. Of these:
o
10% said the effect on their group work experience is mainly beneficial,
o
27% said its
advantages and disadvantages are roughly equal,
o
51% said it is mainly harmful, and
o
12% said it has no effect on their group work experience.
^2^
2012-06-29
Fall2011 Undergraduate Student Survey: Highlights
!'.,
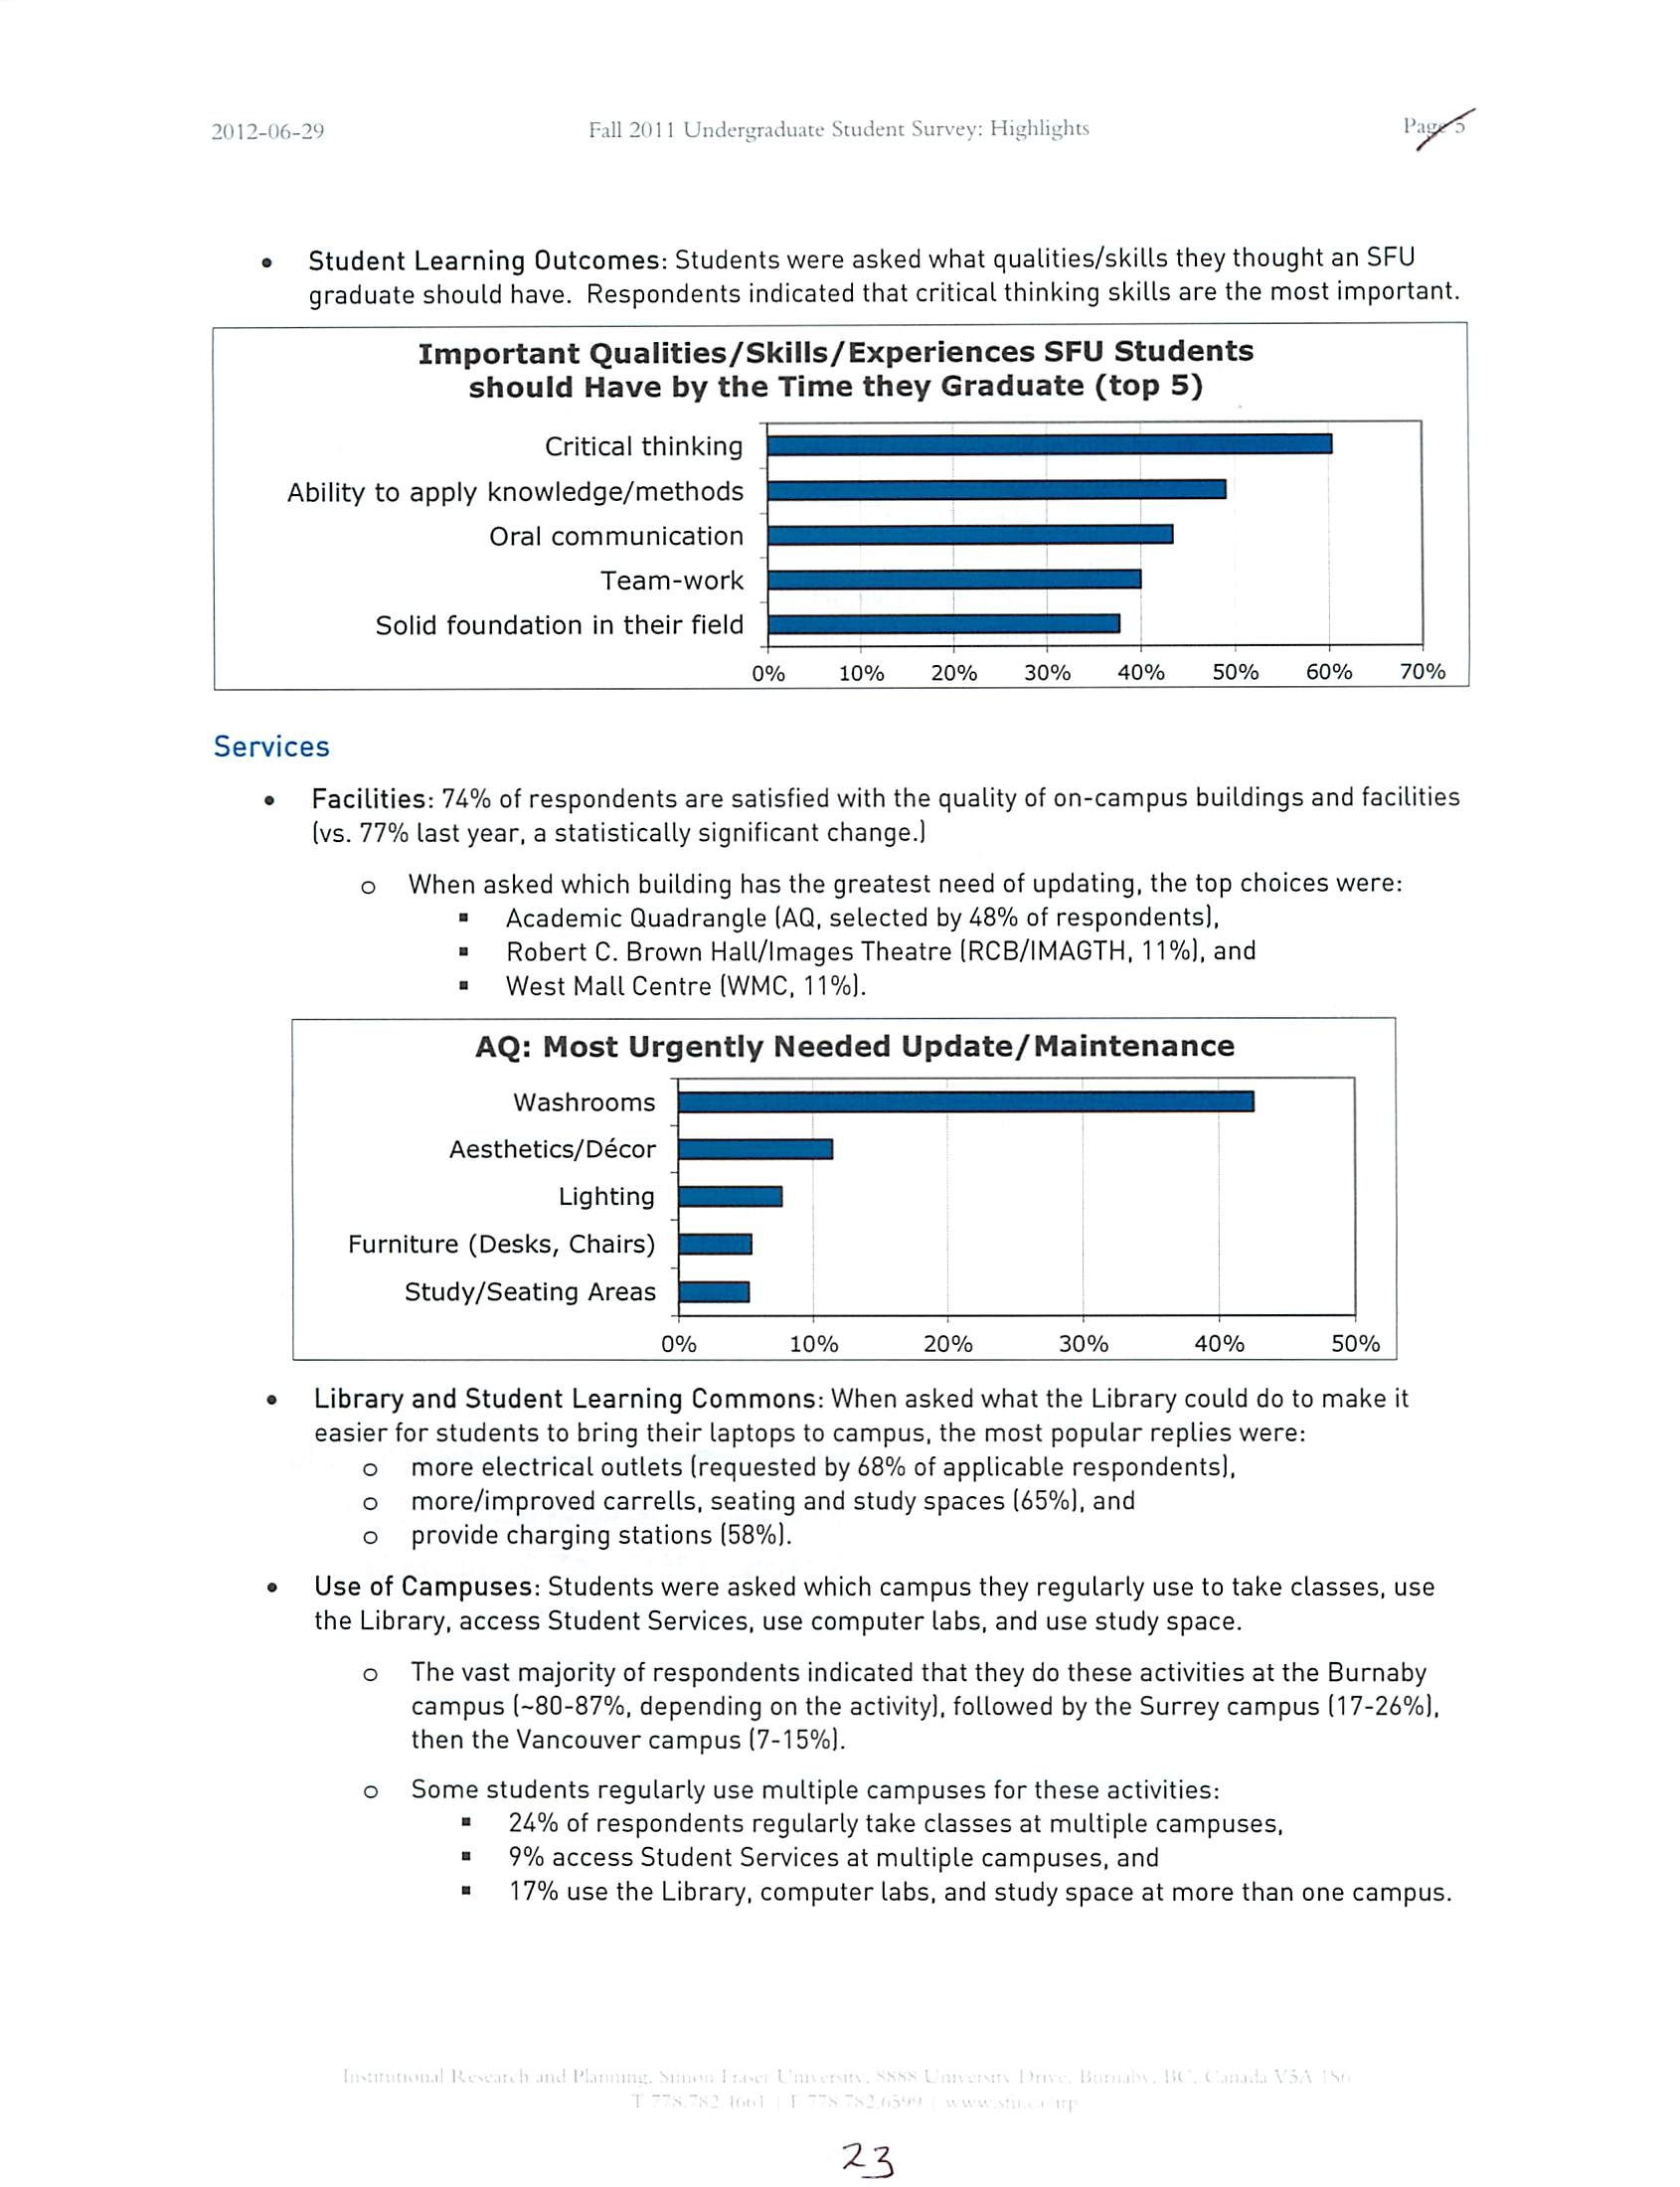
Student Learning Outcomes: Students were asked what qualities/skills they thought an SFU
graduate should have. Respondents indicated that critical thinking skills are the most important.
Important Qualities/Skills/Experiences SFU Students
should Have by the Time they Graduate (top 5)
Critical thinking
Ability to apply knowledge/methods
Oral communication
Team-work
Solid foundation in their field
o%
Services
10%
20%
30%
40%
50%
60%
70%
Facilities: 74% of respondents are satisfied with the quality of on-campus buildings and facilities
(vs. 77% last year, a statistically significant change.)
o
When asked which building has the greatest need of updating, the top choices were:
•
Academic Quadrangle (AQ, selected by48% of respondents),
•
Robert C. Brown Hall/Images Theatre
(RCB/IMAGTH, 11%), and
•
West Mall Centre (WMC. 11%).
AQ: Most Urgently Needed Update/Maintenance
Washrooms
Aesthetics/Decor
Lighting
Furniture (Desks, Chairs)
Study/Seating Areas
0%
10%
20%
30%
40%
50%
Library and Student Learning Commons: When asked what the Library could do to make it
easier for students to bring their laptops to campus, the most popular replies were:
o
more electrical outlets (requested by 68% of applicable respondents),
o
more/improved carrells, seating and study spaces (65%), and
o
provide charging stations (58%).
Use of Campuses: Students were asked which campus they regularly use to take classes, use
the Library, access Student Services, use computer labs, and use study space.
o
The vast majority of respondents indicated that they do these activities at the Burnaby
campus (-80-87%, depending on the activity), followed by the Surrey campus (17-26%),
then the Vancouver campus (7-15%).
o Some students regularly use multiple campuses for these activities:
•
24% of respondents regularly take classes at multiple campuses,
•
9% access Student Services at multiple campuses, and
•
17% use the Library, computer labs, and study space at more than one campus.
!
23
2012-06-29
Fall 201 1 Undergraduate Student Survey: Highlights
General
Engagement at SFU: Graduating students were asked about their participation in various
activities at SFU, over the course of their studies here. Among respondents:
o
19% had participated in co-op, and an additional 62% said that they would have liked to.
o
7-11 % had participated in field schools, international exchange/study abroad, and work-
study. An additional 55-67% said they would have liked to participate in
these programs.
o
13% indicated that they were unaware of events in their department, program or Faculty
in which they could have participated.
Engagement in the Community: In the last year:
o
40% of
respondents engaged in civic activities in their local community,
o
33%
engaged in humanitarian efforts to help the needy, and
o
15-20% engaged in environmental advocacy, social justice activities, and community
service work that made use of their SFU education.
o
Among those who did engage in these activities, 21% did so in an international setting.
o
34-55% indicated that they are not planning on engaging in these types of activities.
Employment: 53% of respondents are currently employed or self-employed. Among these-.
o
10% work more than 30 hours per week in a paid job,
o
31% work 16 - 30 hours per week, and
o
58% work 15 hours or
less per week.
Tuition for International Students: International students were asked whether they would still
have
come to SFU if the tuition had been higher.
o
At an increase in tuition of $1,000 per year, 47% of international respondents indicated
that they definitely would have come, 22% said that they would not have come, and 31%
were unsure.
o
At an increase of $5,000 per year, 14%said that they definitely would have come, while
71% definitely would not have come to SFU, and 15% were unsure.
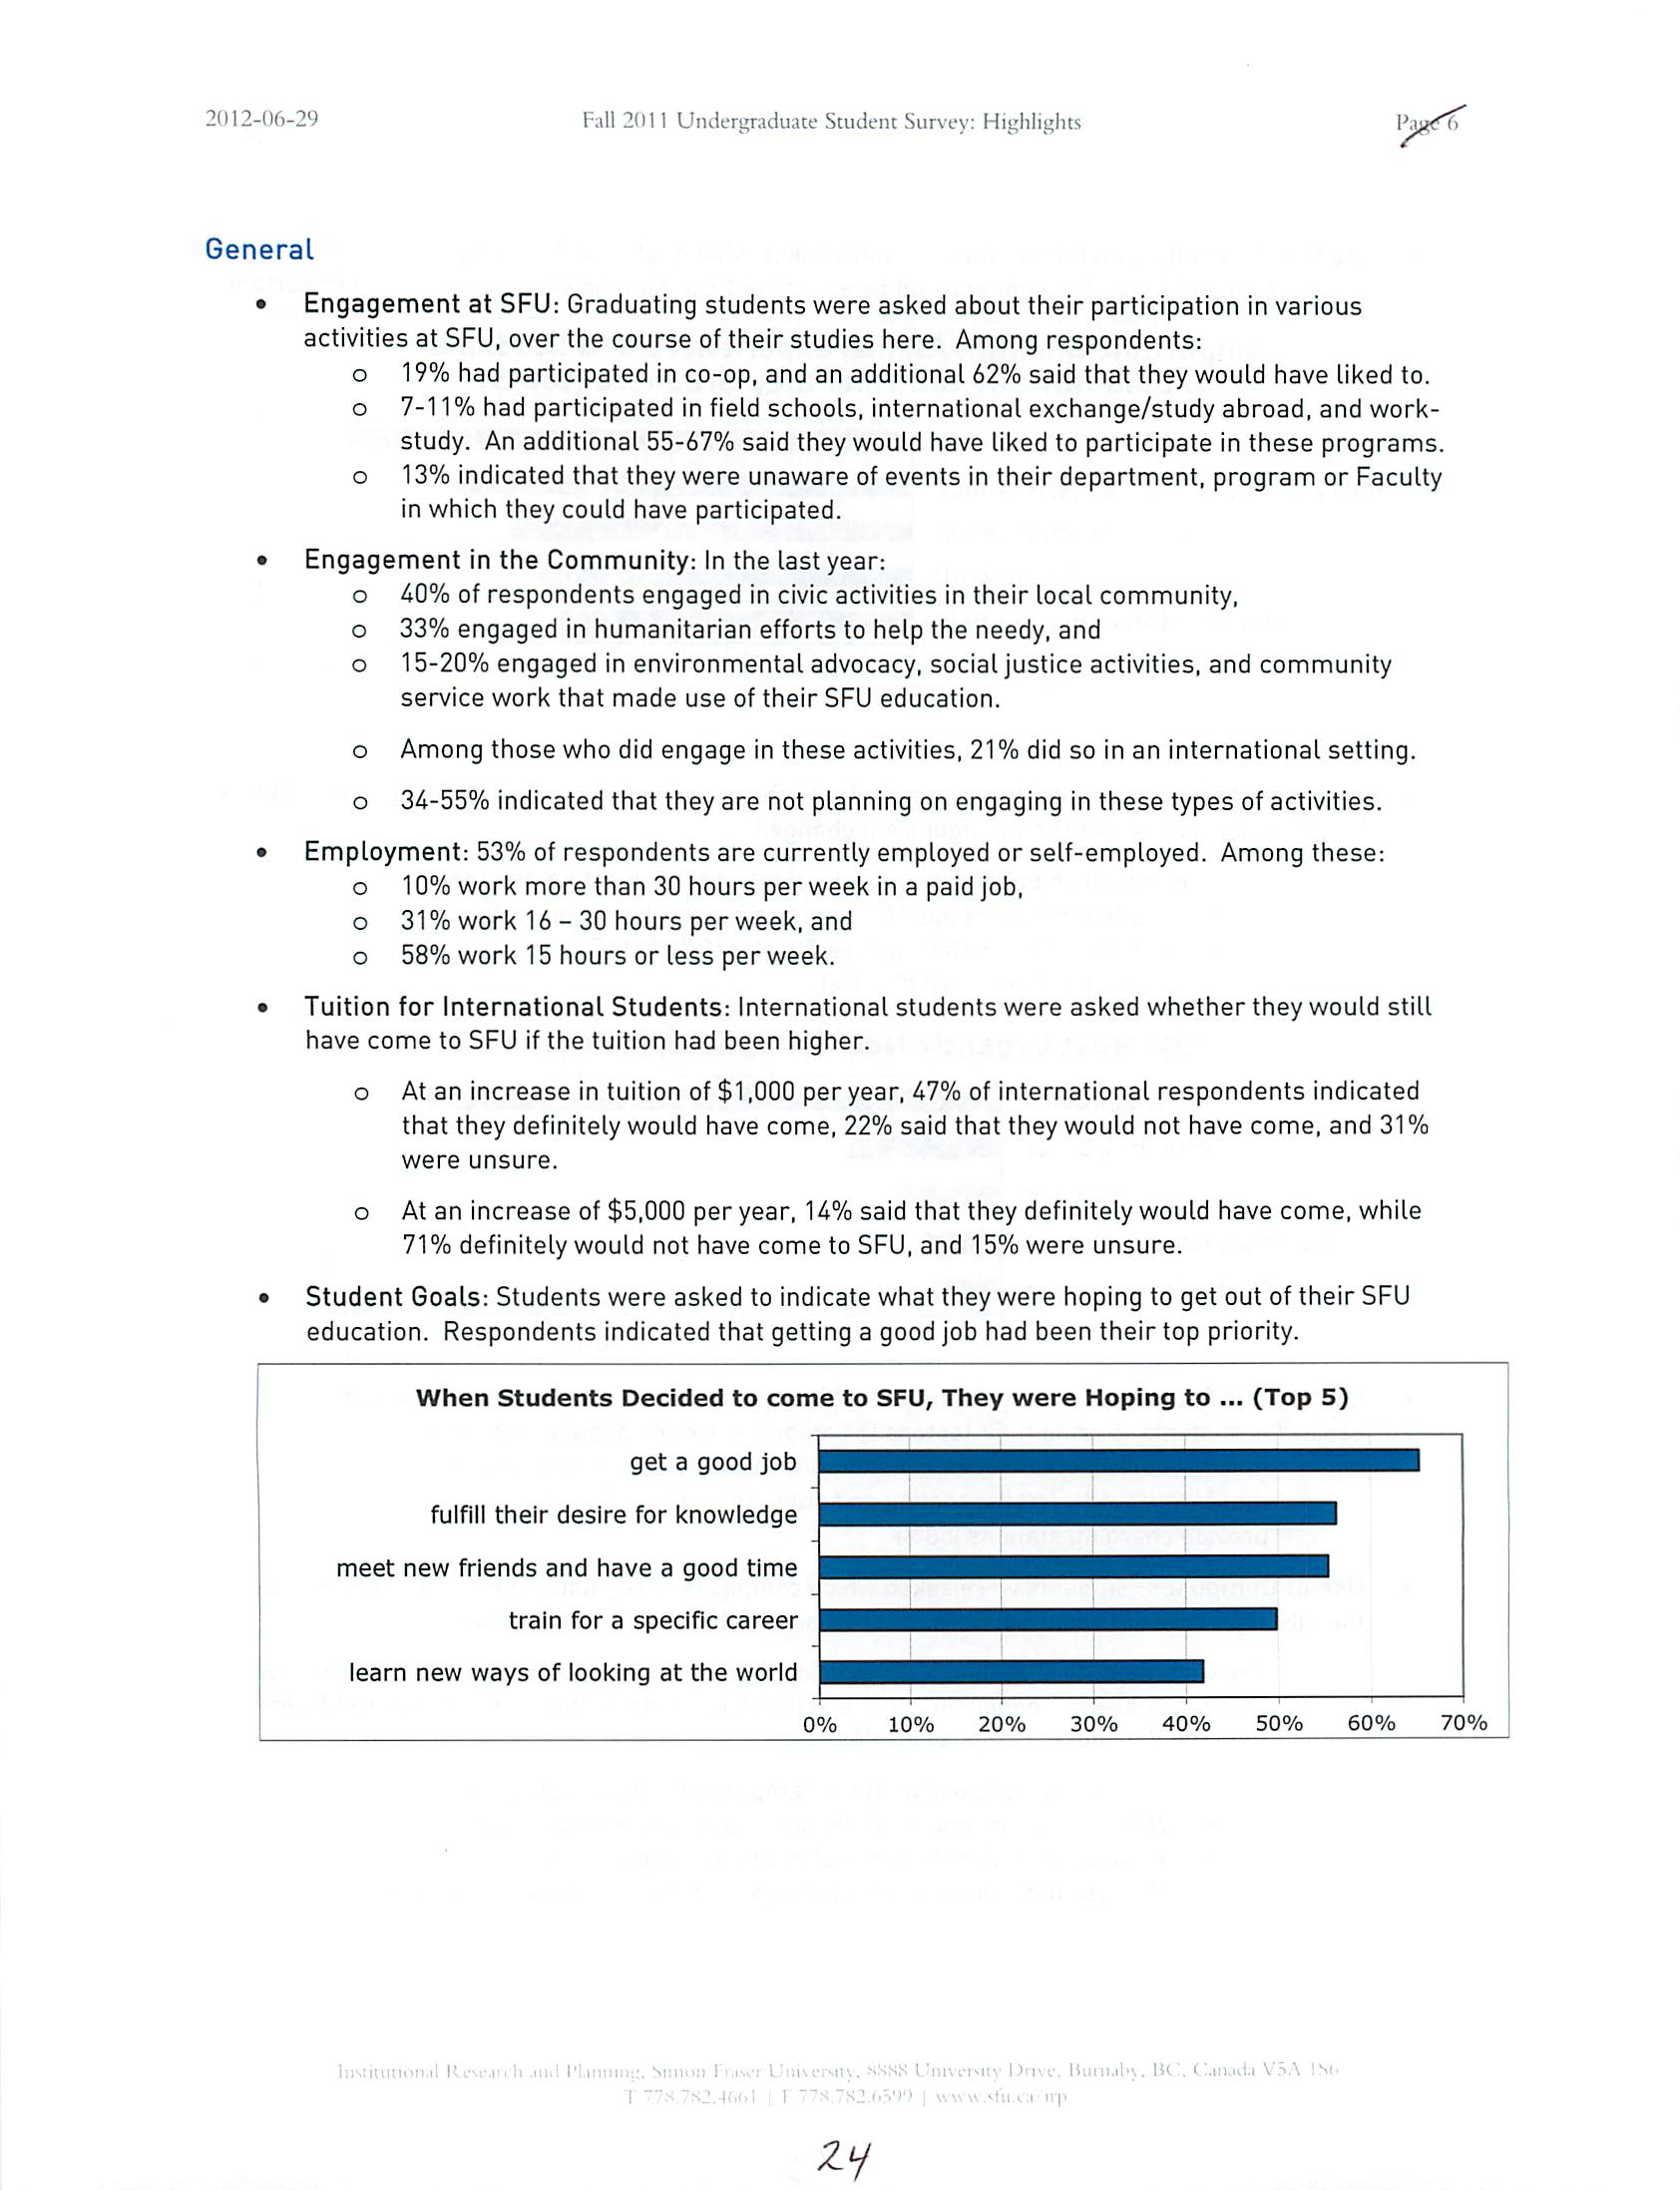
Student Goals: Students were asked to indicate what they were hoping to get out of their SFU
education. Respondents indicated that getting a good job had been their top priority.
When Students Decided to come to SFU, They were Hoping to
...
(Top 5)
get a good job
fulfill their desire for knowledge
meet new friends and have a good time
train for a specific career
learn new ways of looking at the world
o%
10%
20%
30%
40%
50%
60%
70%
I
Zi
2012-06-29
Fall 2011 Undergraduate StudentSurvey: Highlights
Pa
Recommendations
•
Facilities: While overall satisfaction with facilities is relatively high (74%), in the student
comments, facilities were the most frequently cited improvement requested. Based on
comments received, student satisfaction with facilities could be further improved by:
o
Continuing to make improvements to on-campus washrooms, as well as keeping the
washrooms clean throughout the day, and in a good state of repair. Washrooms in the
AQ were most frequently cited as being in need of updating or maintenance.
o
Increase lighting in lecture halls.
o
Continuing to add, expand, and make improvements to study areas.
•
Course Availability and Scheduling: Student responses suggest the need for continued effort to:
o
Increase the frequency of required upper division courses.
o
Increase the seat capacity of courses that have been historically popular.
o
Schedule courses likely to be taken together at non-overlapping times (and at sufficiently
spaced times, when they are offered on different campuses.)
o
Check that exam times for courses commonly taken together do not overlap, before
releasing the exam schedule.
•
Student Life/Campus Community: Students continue to request improvements to student life
and the campus community, such as holding more student events on campus.
•
WQB Courses: While students' perception of the value of WQB courses has been rising for
several years, the rigidity of the requirements seems to cause issues for some students.
Respondents suggest that the requirements would be less cumbersome if there were more
designated WQB courses, especially at the upper division level.
•
Policies and Services: Some additional student suggestions over the last few years for
improving their experience at SFU include:
o
Reducing wait times to see academic advisors.
o
Improving the registration priority system, and communicating the algorithm to students.
o
Increasing the English-language communication standards for incoming students,
o
Lowering tuition and fees, and/or improving financial aid.
i
Z5~~
Back to top