For Information
?
S.93-14
SIMON FRASER UNIVERSITY
DEAN OF GRADUATE STUDIES ?
Memorandum
TO: ?
W. R.
Heath
?
FROM: B.P.
Clayman
Registrar
SUBJECT:
Annual Report
?
DATE: January 19, 1993
SGSC
Enclosed please find the annual report of the Senate Graduate Studies Committee and
its
appendices.
.
End.
cc: ?
M. McGinn
MJA20HEADOC
01/19/93
0 ?
SIMON FRASER UNIVERSITY
Senate Graduate Studies Committee
1992 REPORT TO SENATE
The Dean of Graduate Studies is responsible for the general supervision of graduate work at the
University and chairs the Senate Graduate Studies Committee. This report outlines the position
of graduate studies at Simon Fraser University, describes some changes made in 1992 and makes
recommendations for future directions.
The enclosed copy of the 1993 S.F.U. Graduate Studies Fact Book describes, in quantitative
terms, the graduate student body in Fall 1992 and provides some retrospective data on
completion rates. It is the third edition. It is designed to complement information in the Simon
Fraser University Fact Book, produced by the Office of Analytical Studies.
I.
Enrolments and Degrees
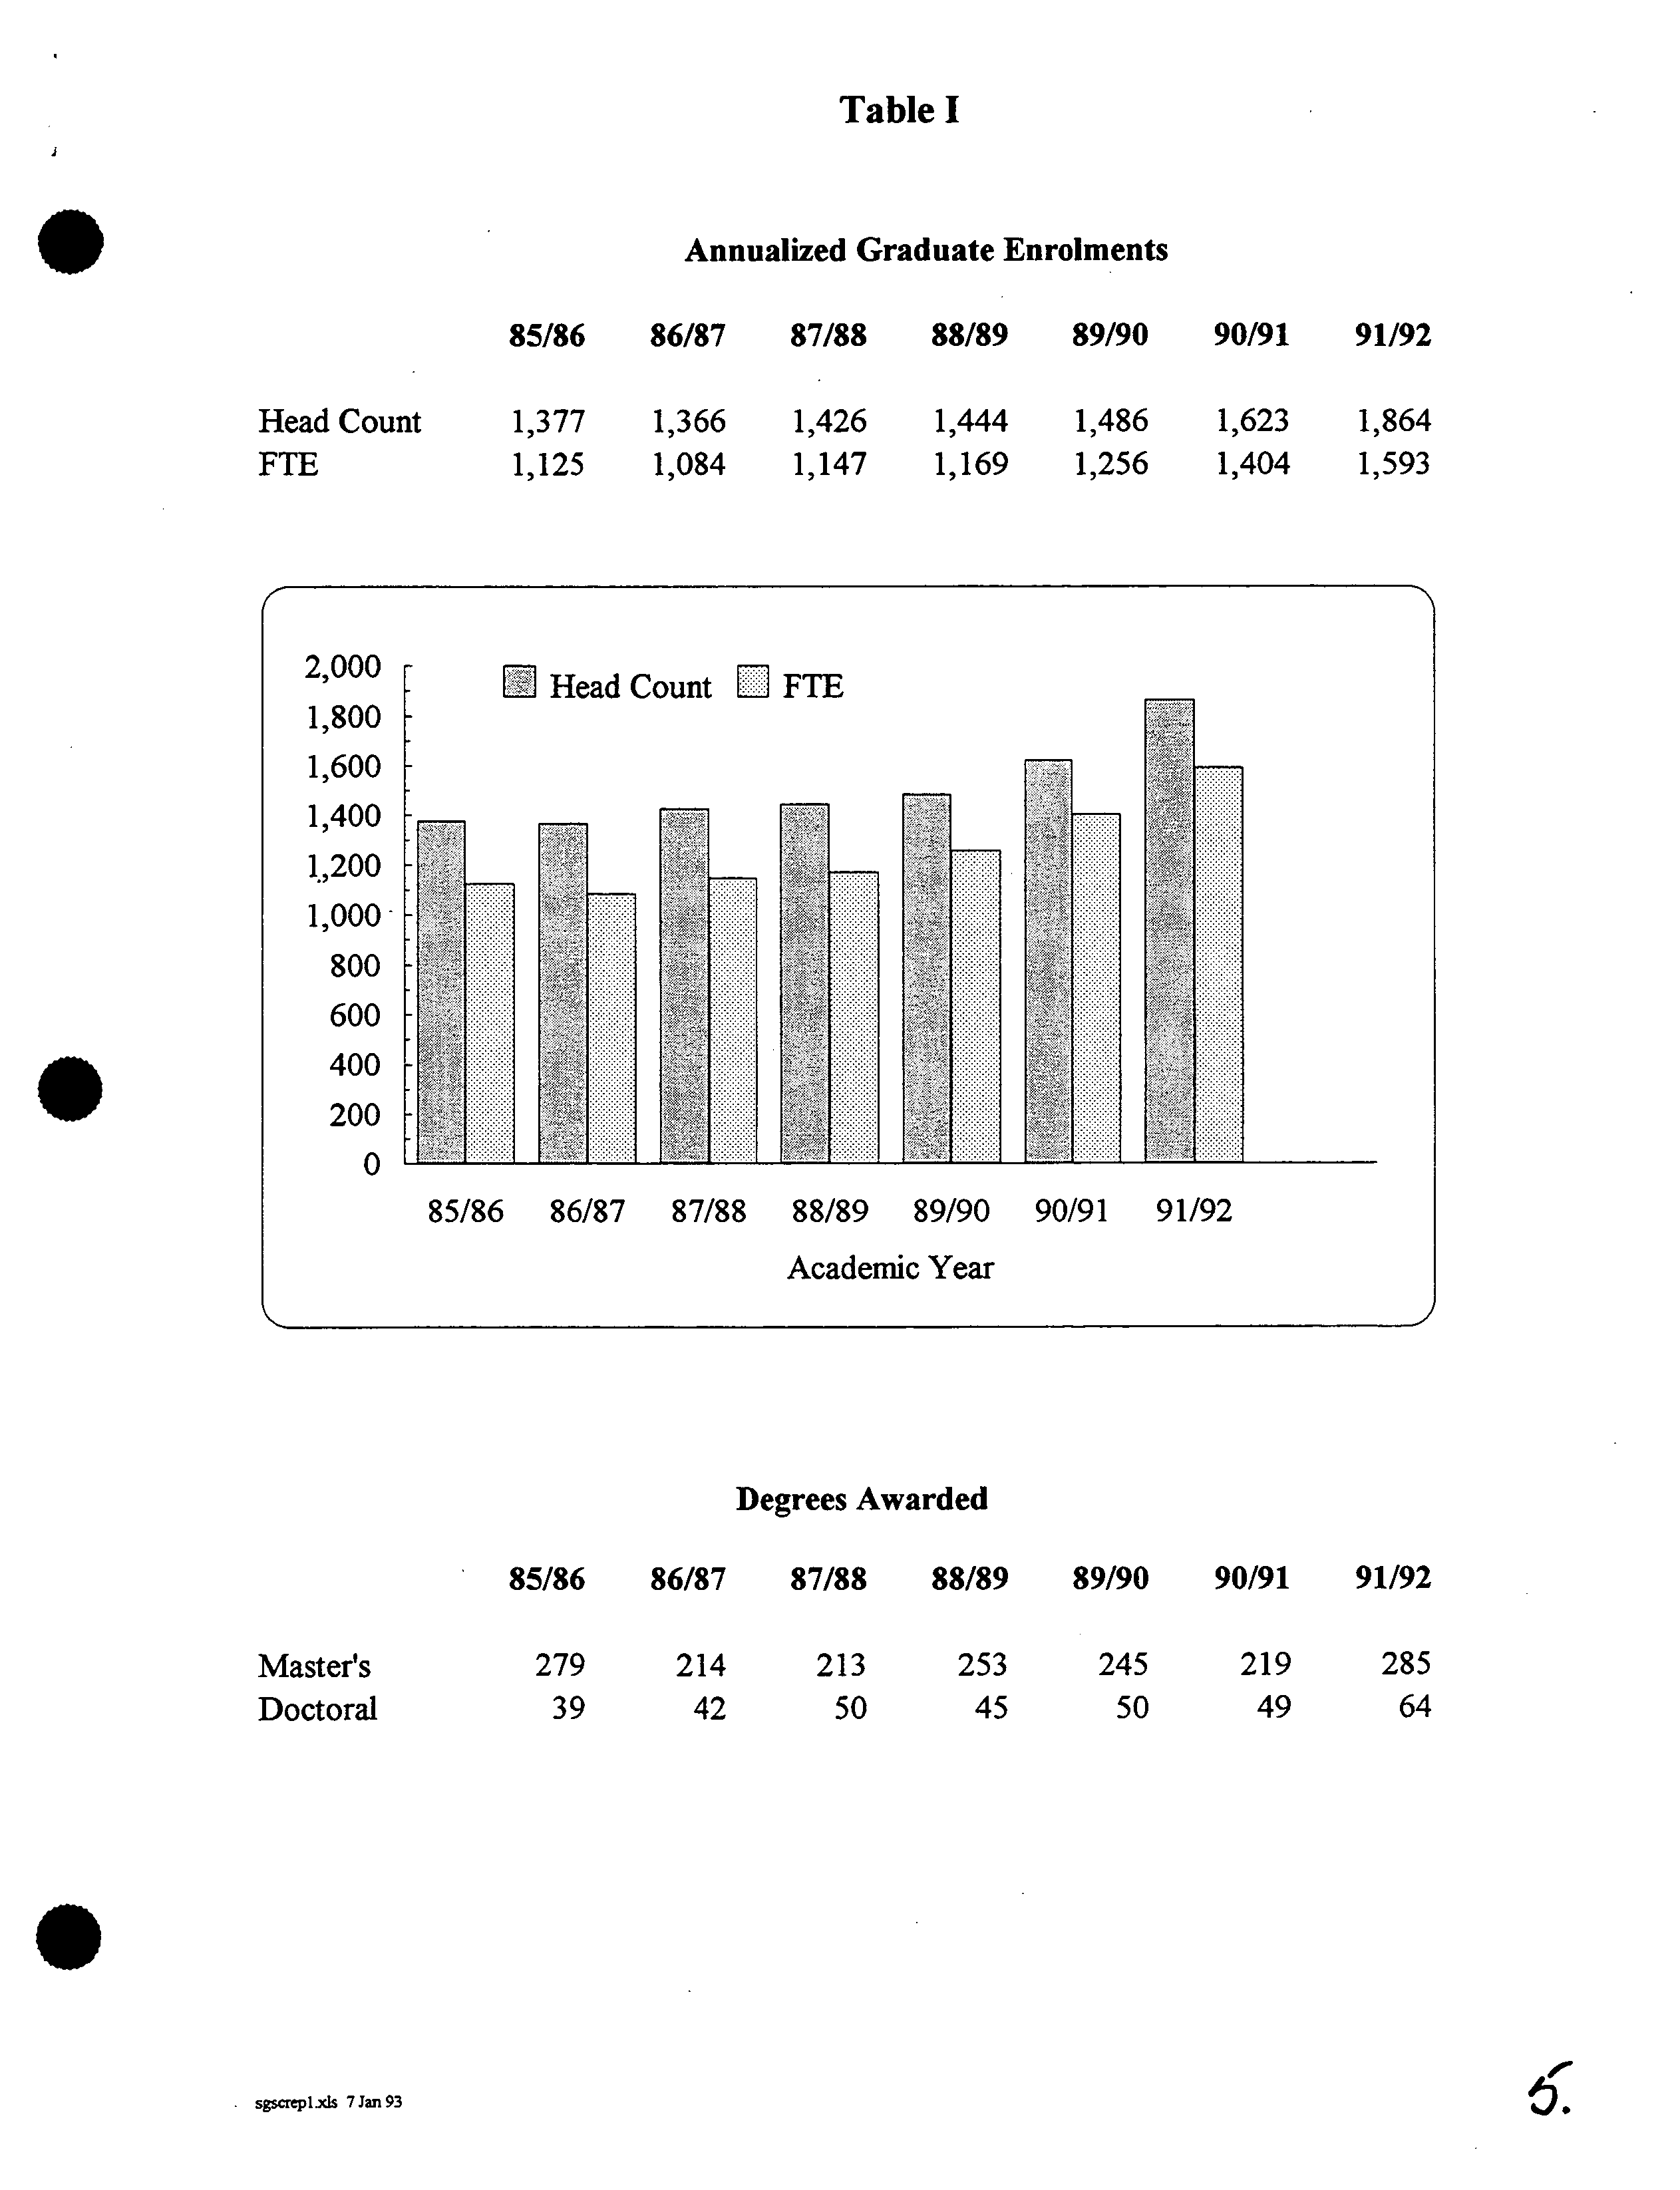
Table I shows the recent history of graduate enrolments and degrees granted. The FTE
S
enrolment figures should be treated with caution on two grounds. Prior to the Fall 1989, they
were determined through a reporting process which was subject to considerable variation
between departments. Starting in the Fall 1989, a new, rigorous definition of Part-time status
was adopted; this was primarily responsible for the large change in the (Head Count)/FTE ratio
between 1988/89 and 1989/90. The official recognition of Part-time status and the introduction
of a reduced semester tuition fee for Part-time students were major advances in improving the
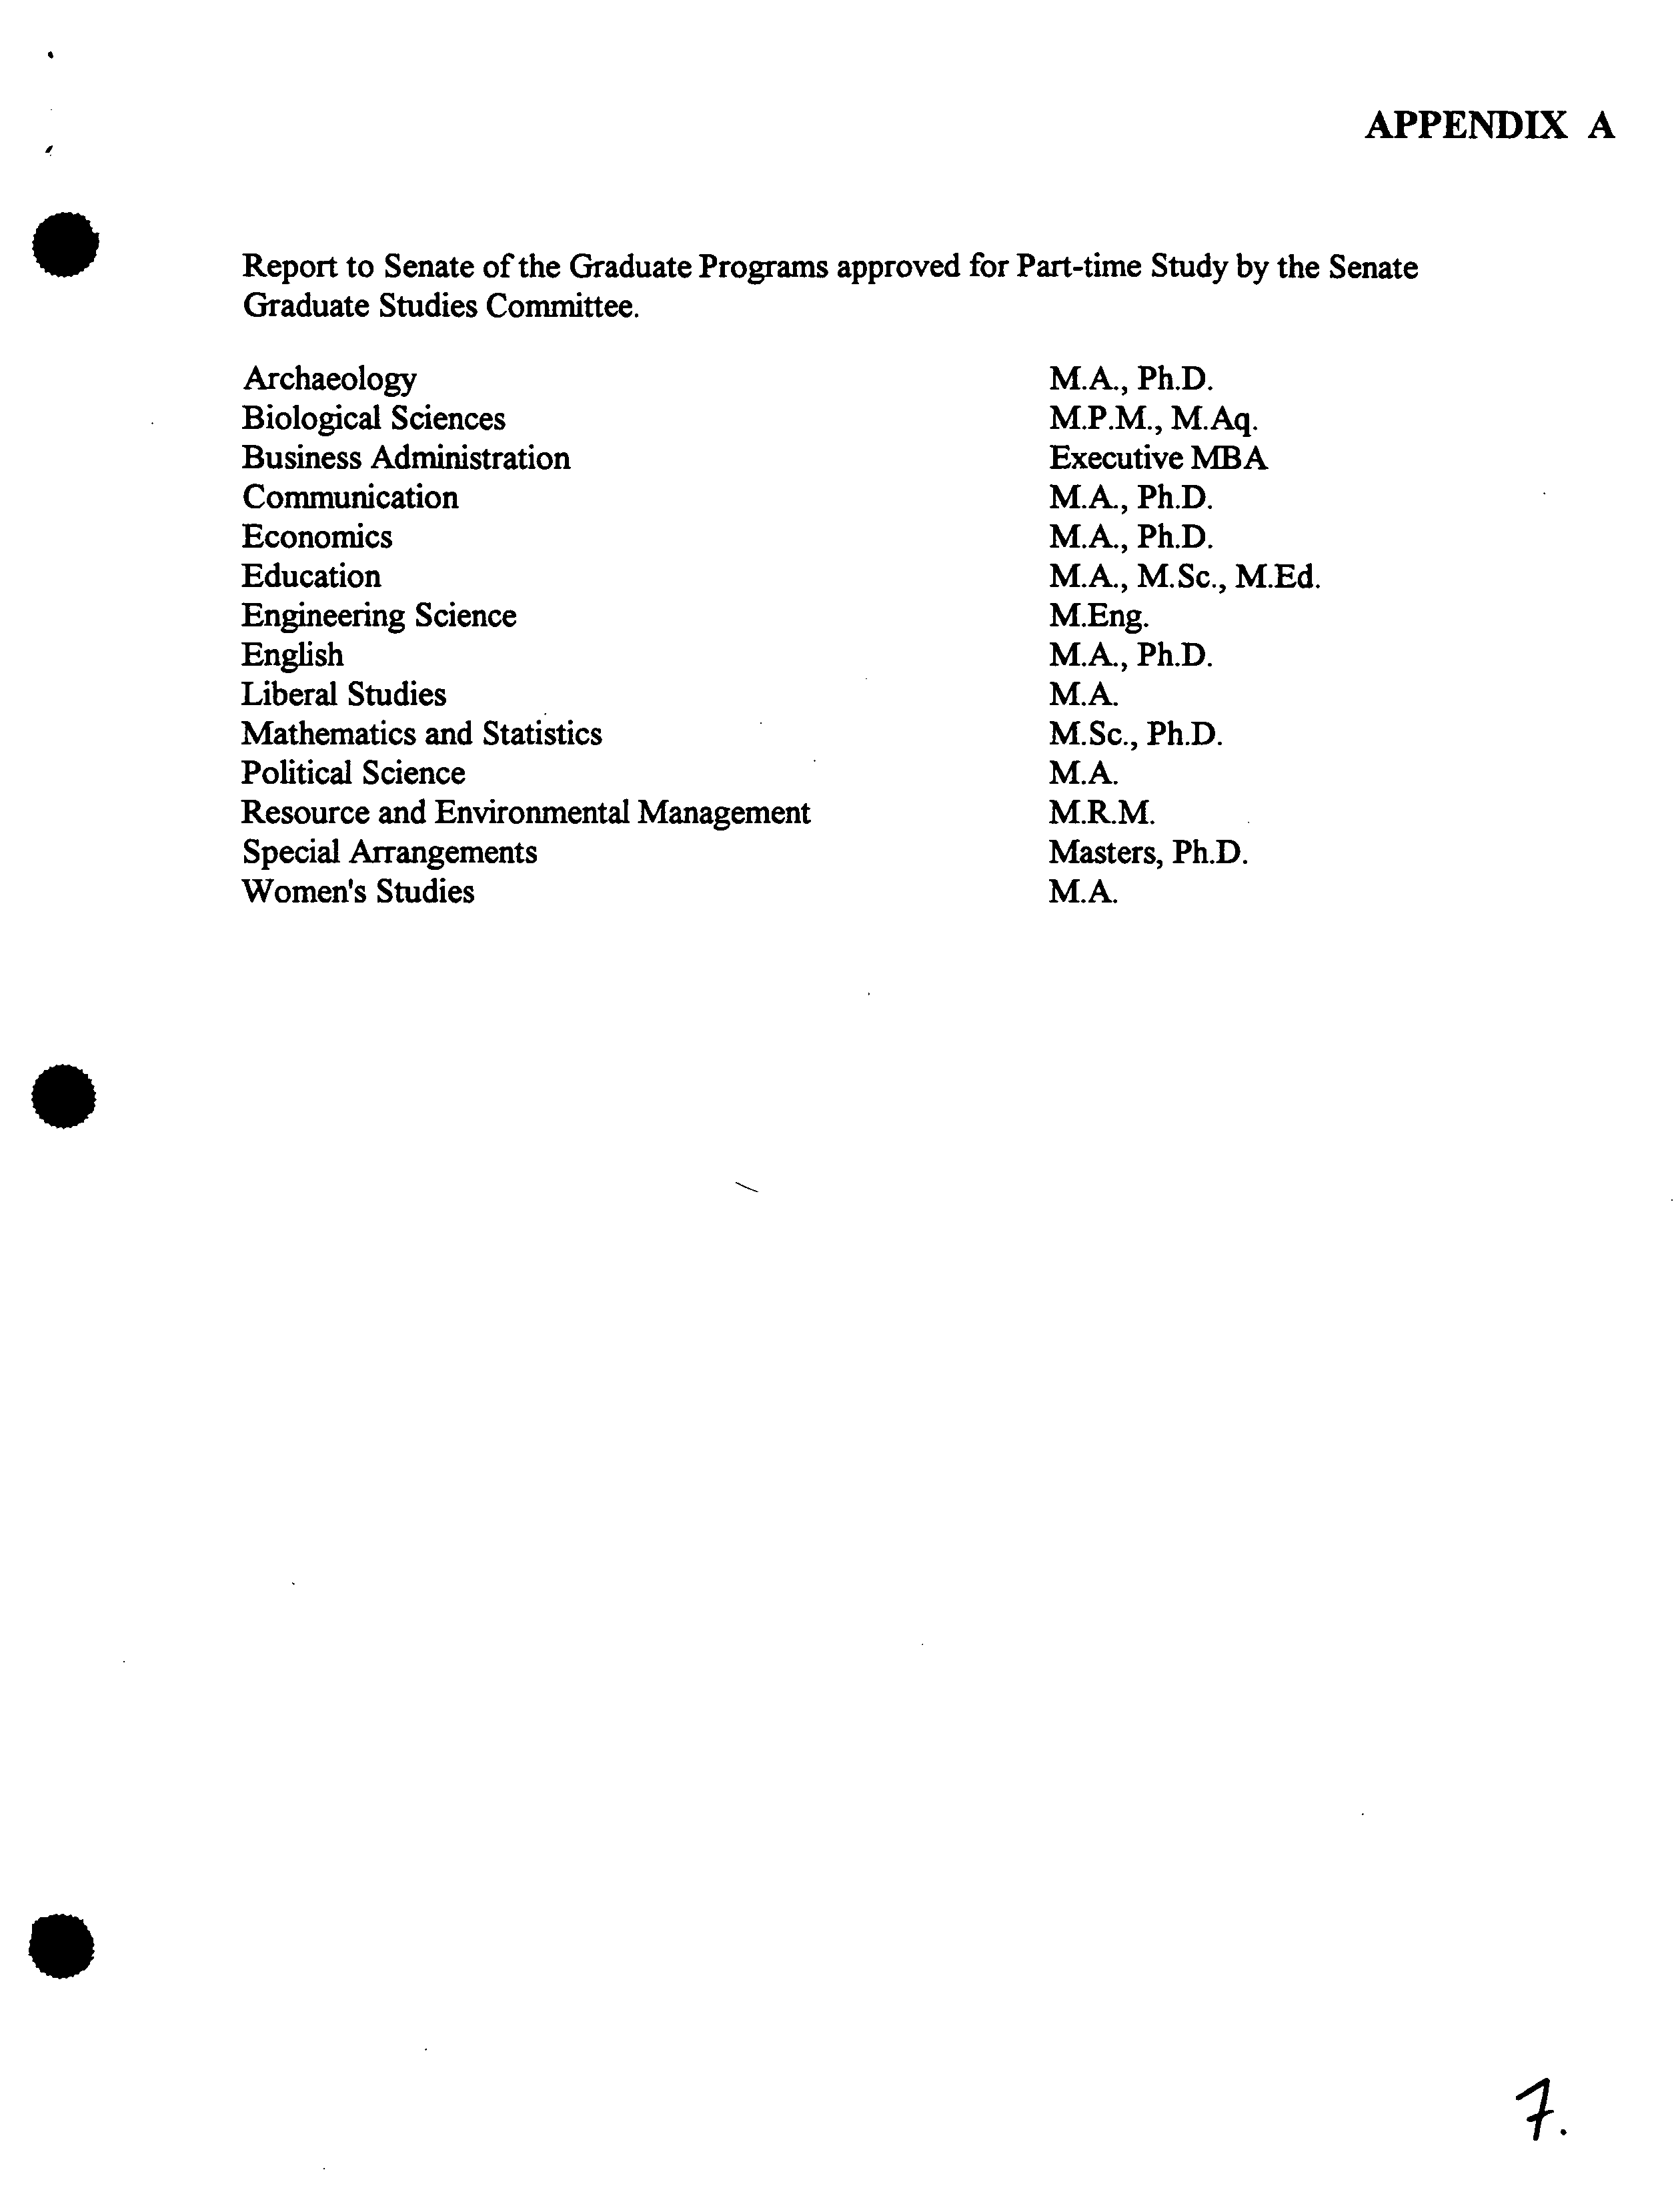
accessibility of our graduate programs. Programs approved for part-time study are listed in
Appendix A.
As requested by Senate in January, 1989, I can report that the introduction of a formal
requirement of competence in the English language has proceeded very smoothly. A very small
fraction of applicants recommended for admission whose first language is not English did not
produce TOEFL scores of at least
570.
Of these, a large majority submitted satisfactory other
evidence of their English language competence. Most TOEFL scores are over 600.
II.
Degree Completion/Withdrawal
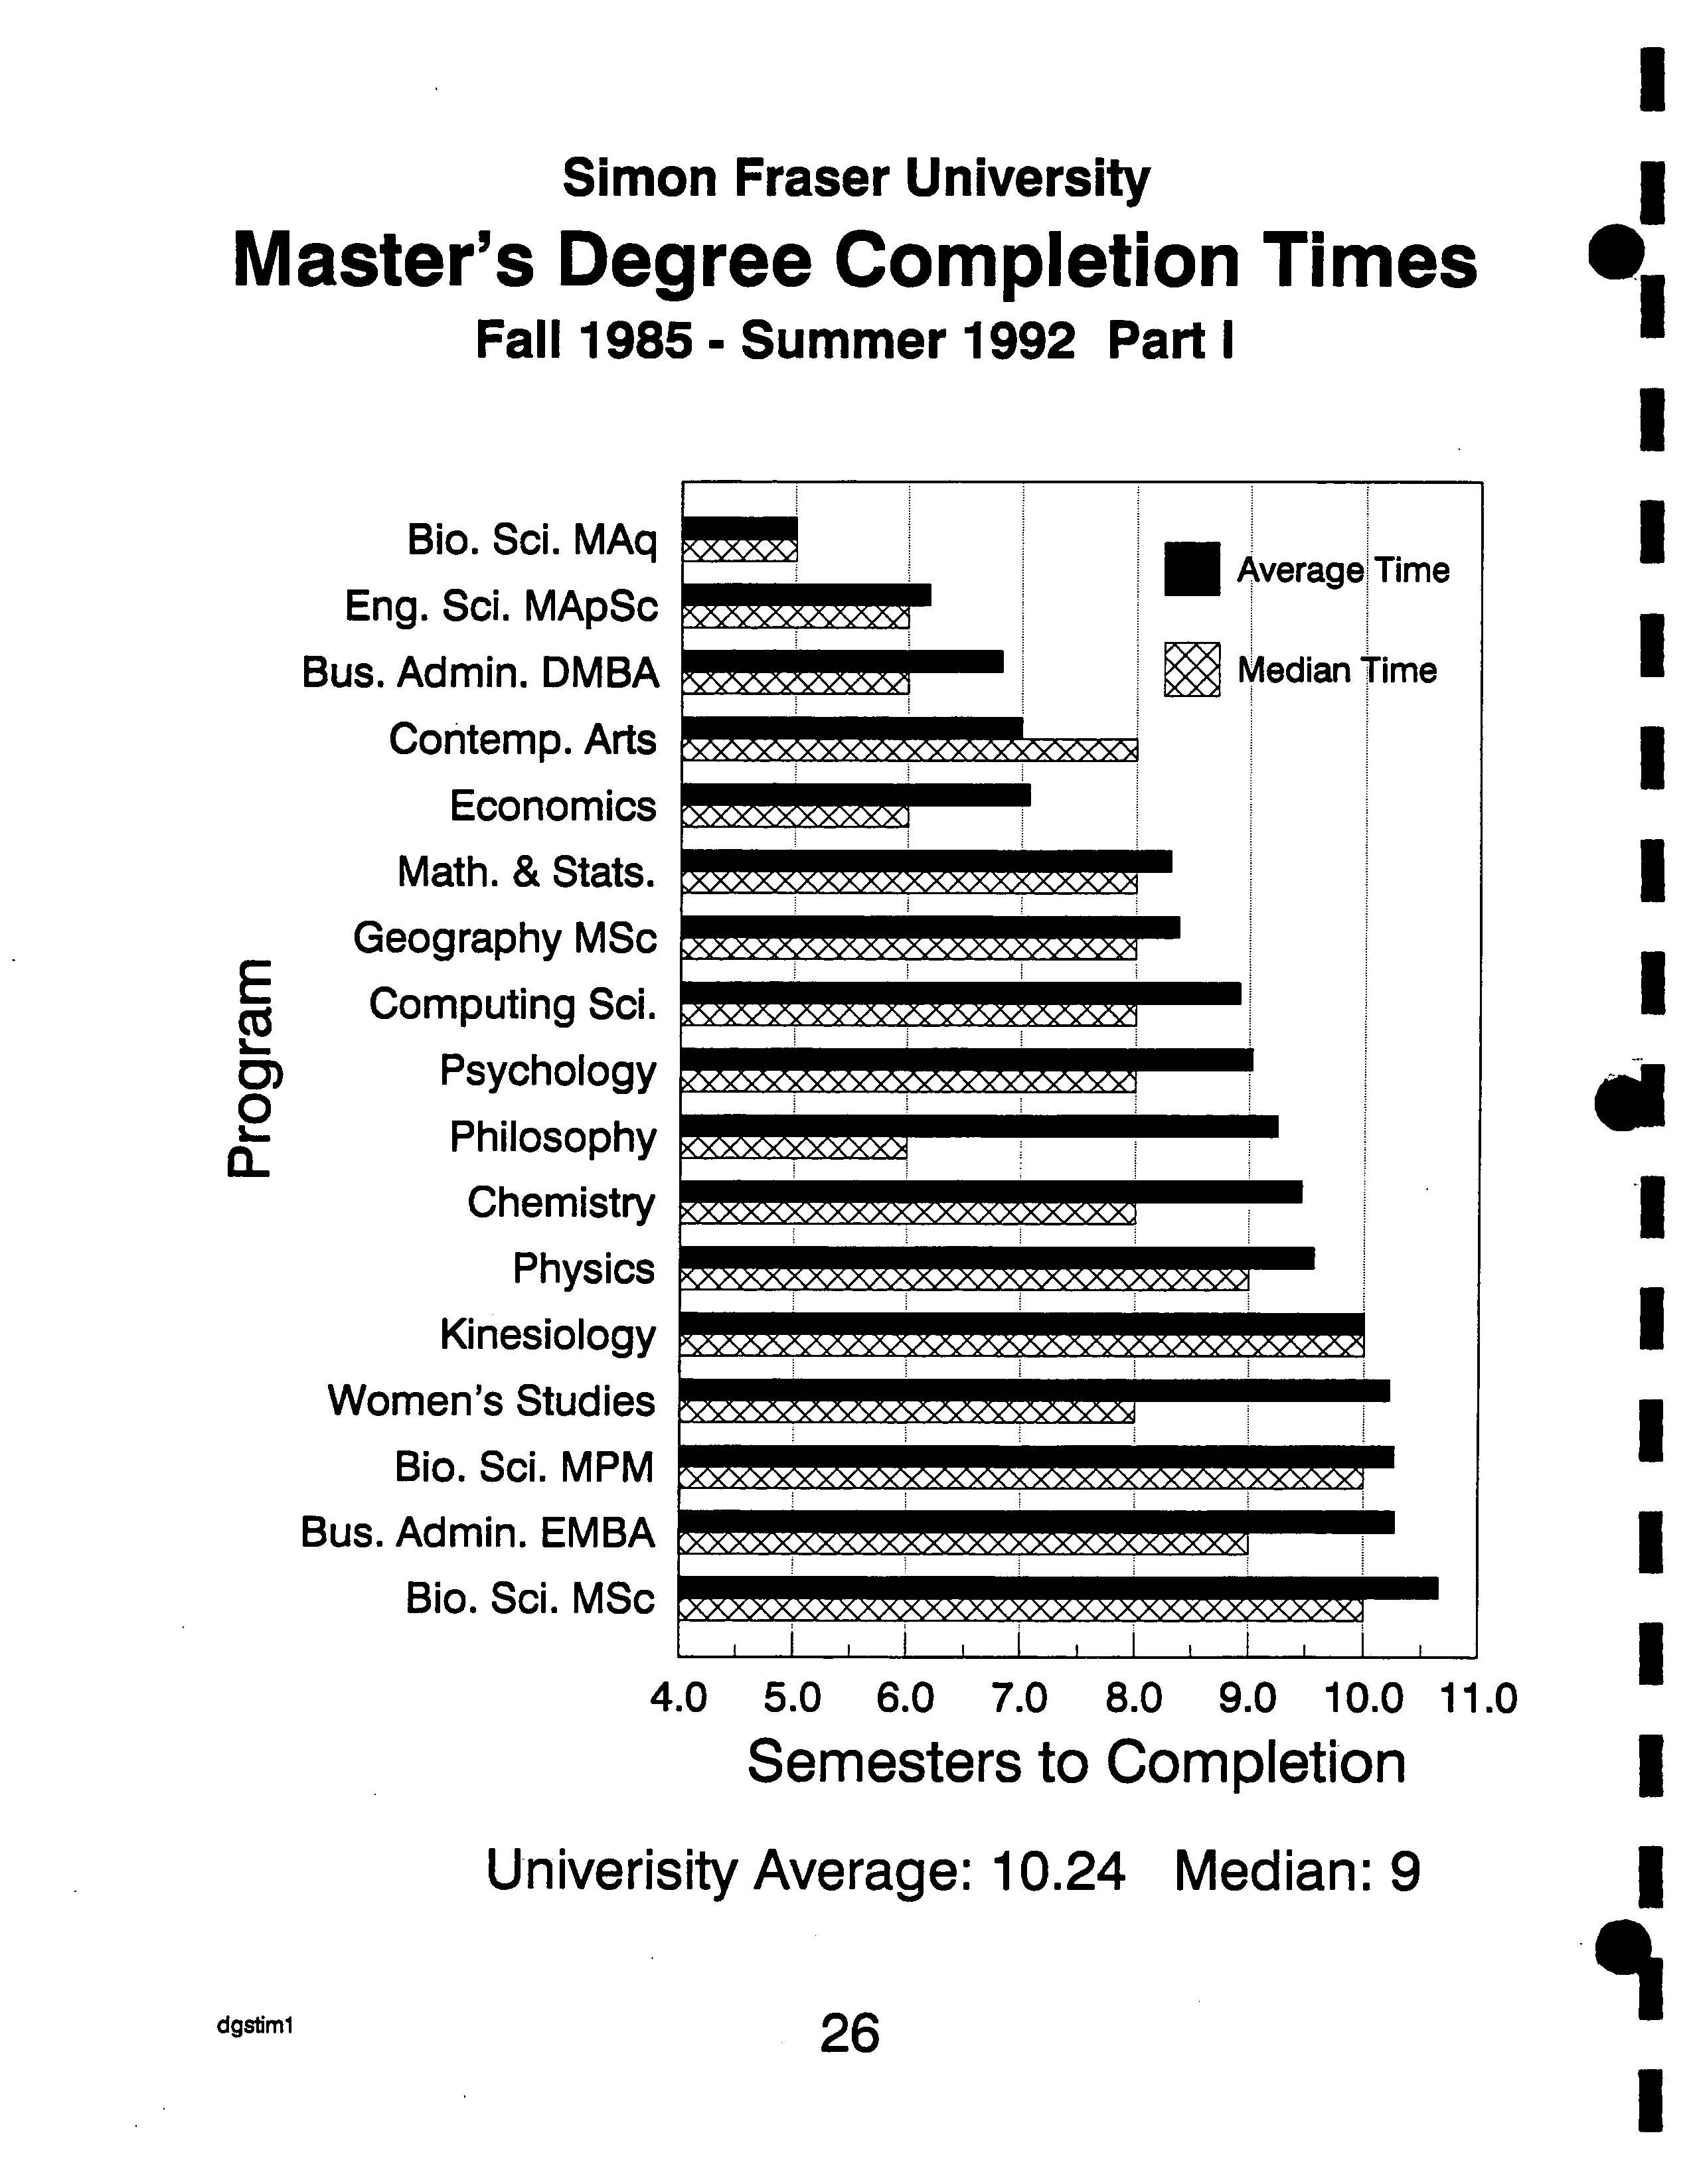
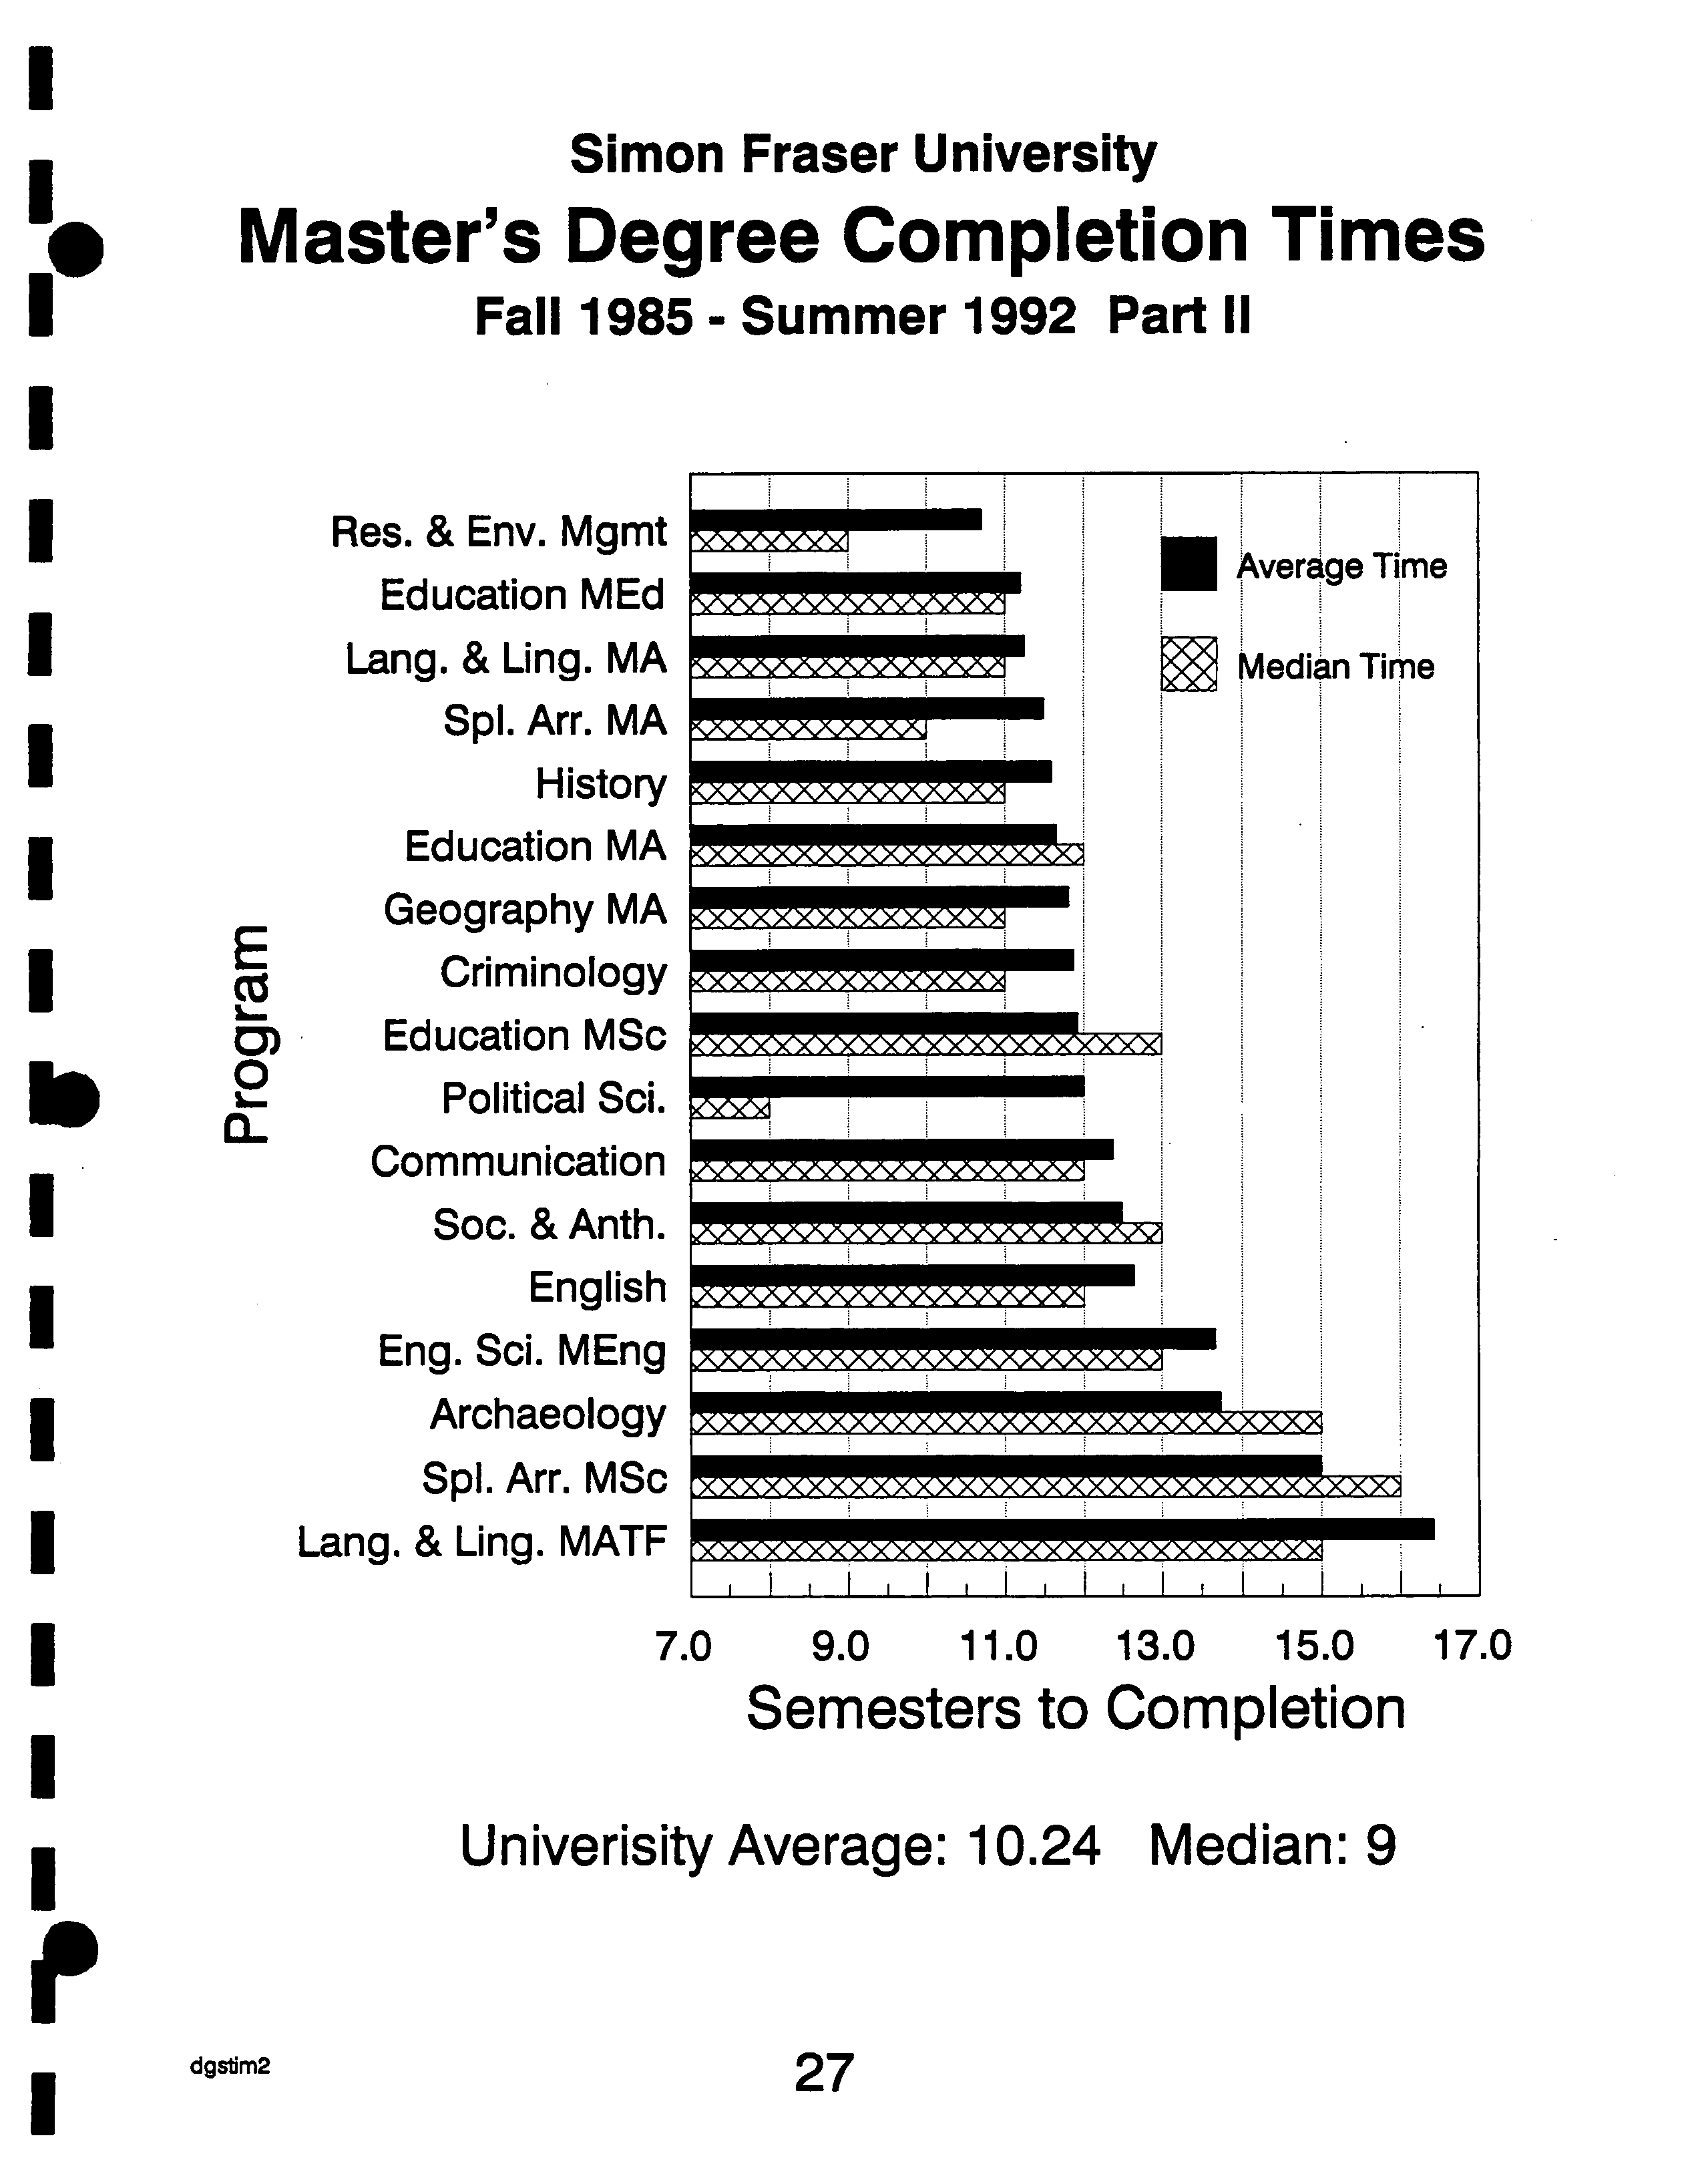
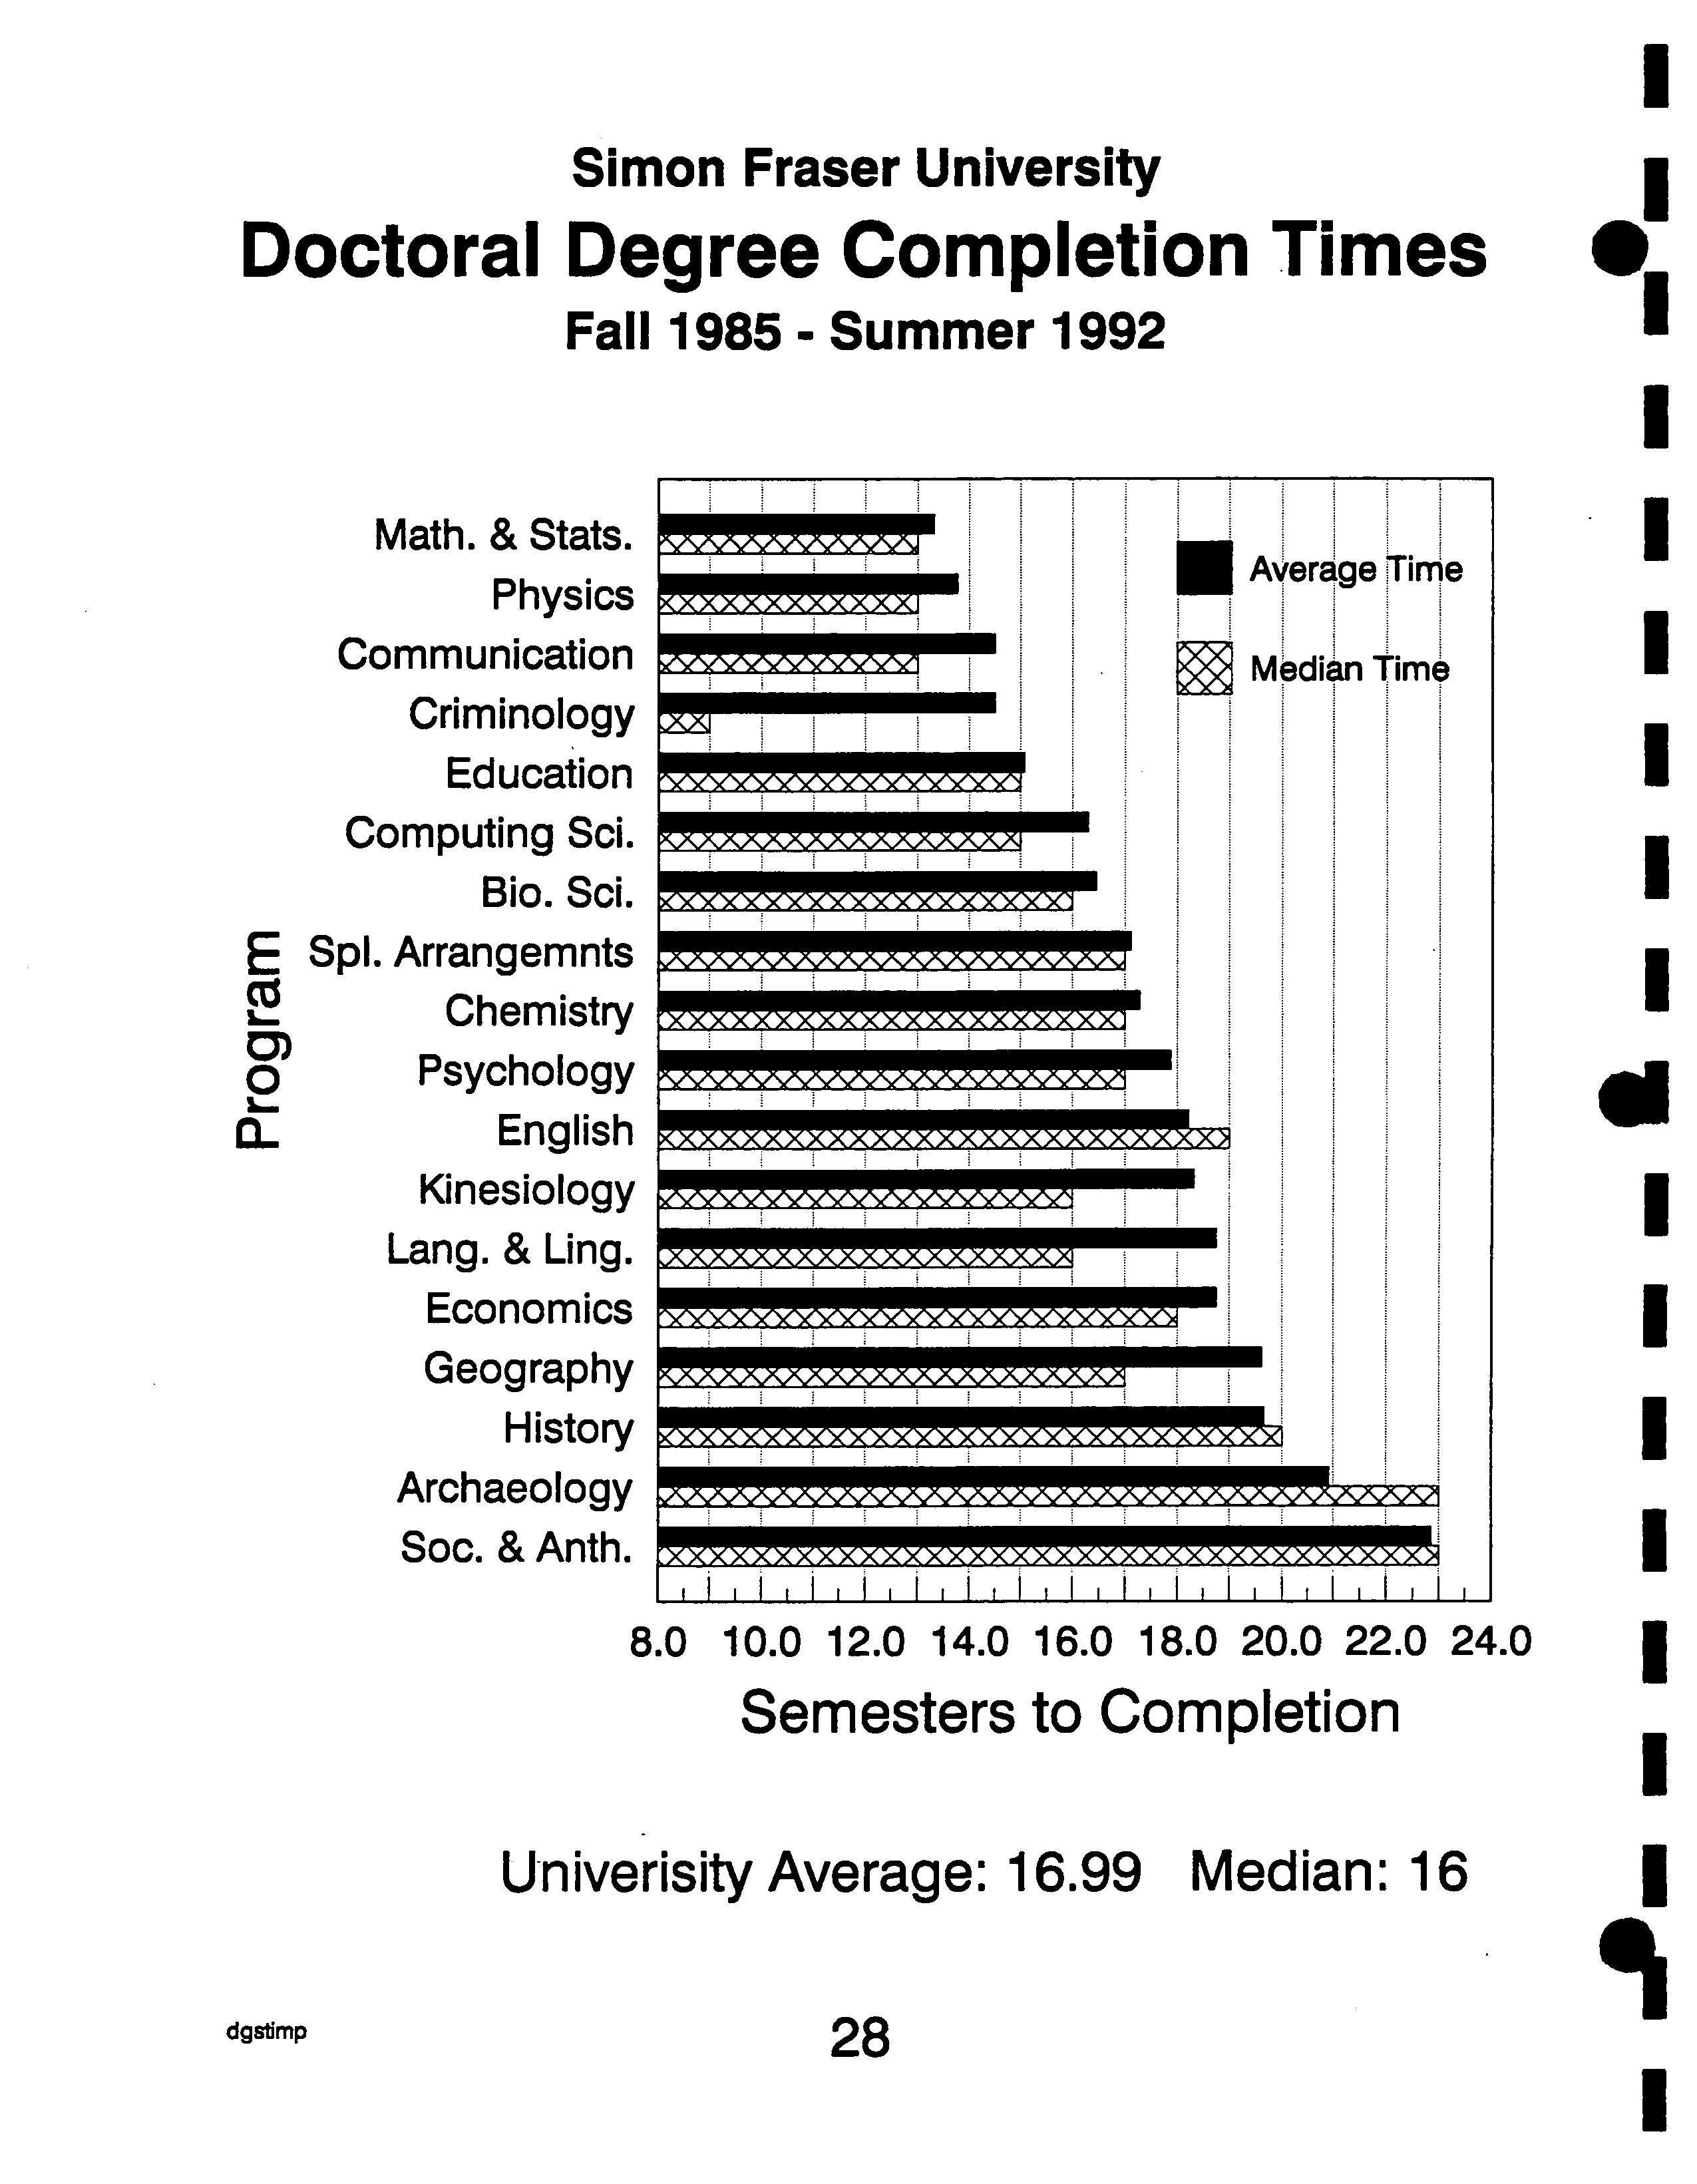
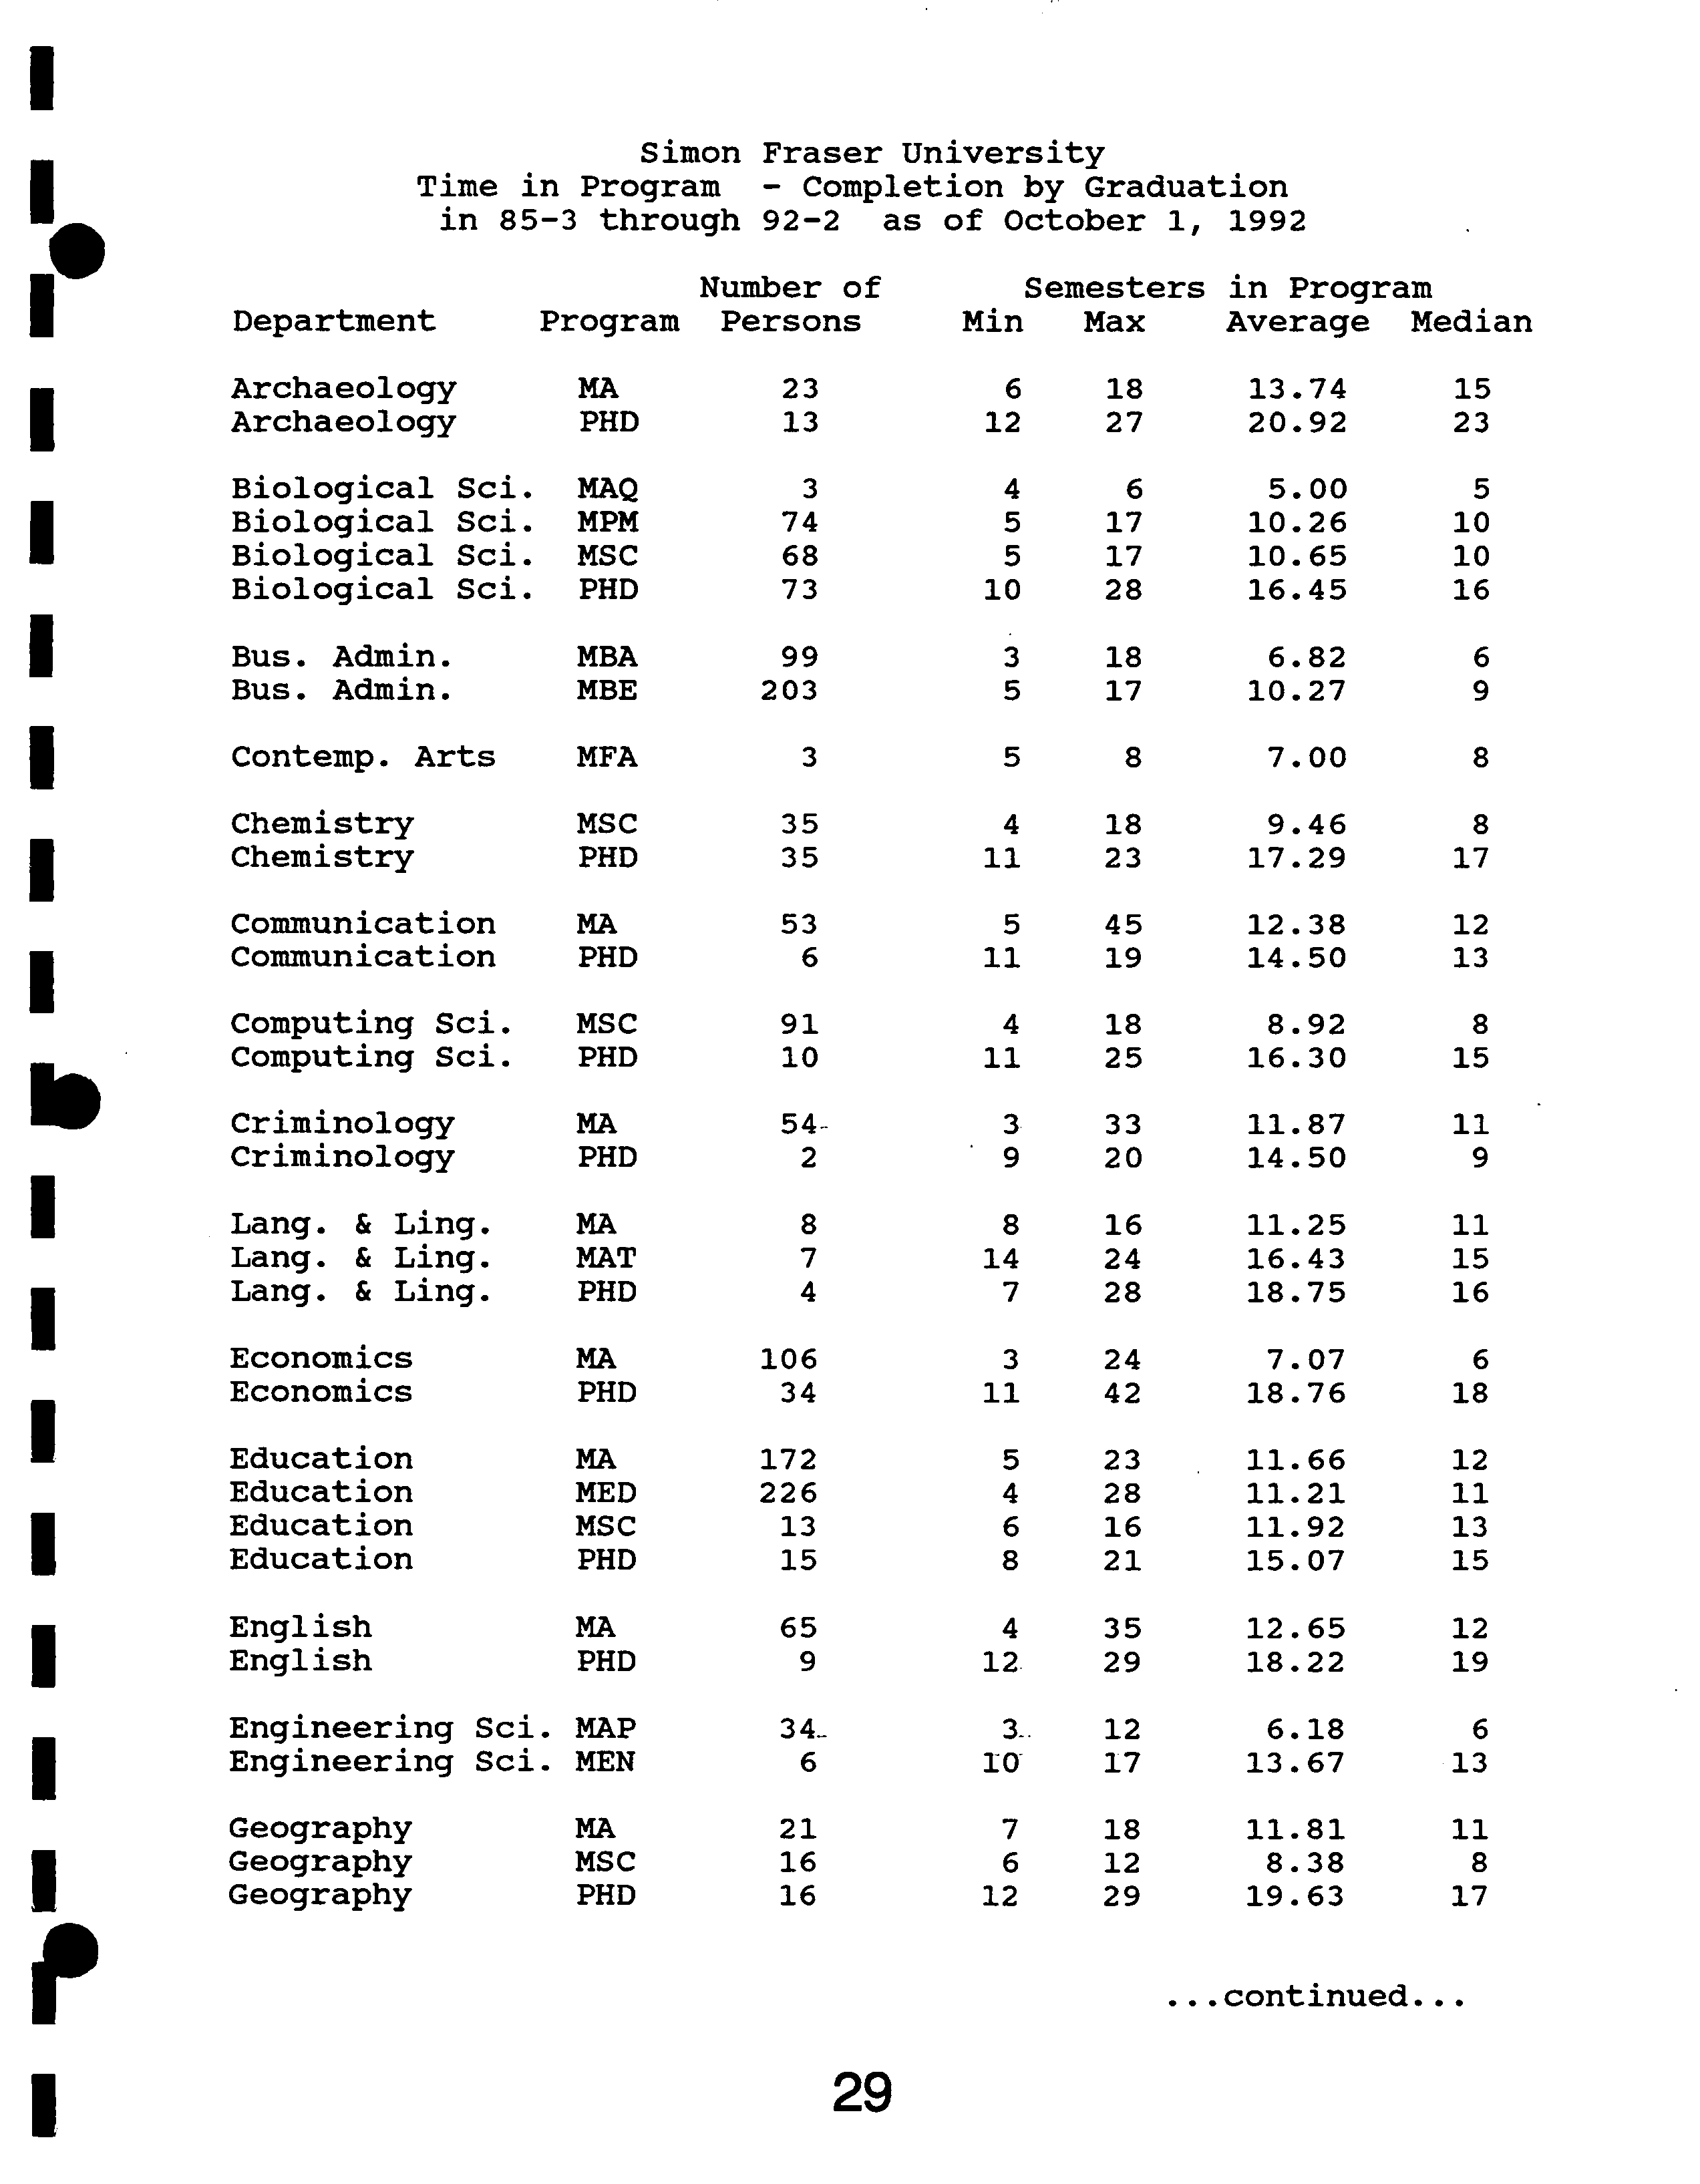
Degree completion times are presented, starting on page 26, in the Graduate Studies Fact Book.
It should be noted that these data do not take into account the possibility that a student may
have been enrolled part-time for all
or part of the program and thus overstate completion times,
especially for programs with large numbers of part-time students.
I remain concerned by what appear in many cases to be excessive times for degree completion.
When resources are limited, it is especially important that they be used effectively and
S.G.S.C. Report to Senate. Page 2
efficiently. The Ministry of Postsecondary Education has recently become interested in degree
completion time and may be considering measures that would effectively penalize universities
with lengthy completion times.
I am actively encouraging departments to ensure both that their degree requirements are realistic
and that their students make satisfactory progress, as required by Senate regulations, toward
meeting those requirements. The Graduate Studies Handbook, first published in 1991, contains
guidelines for supervisors and students that (if followed) should improve prospects for
expeditious degree completion. I am also considering more rigorous enforcement of the
regulations requiring annual progress reports.
I am also pressing for timely appointment of supervisory committees. In establishing the
Graduate Studies Database, I encountered many students who had been here for several years,
yet apparently had no supervisory committees. This situation has largely been remedied; each
semester, reminders about 'delinquent' students are sent to departments by my office; a minor
flood of committee recommendations follows.
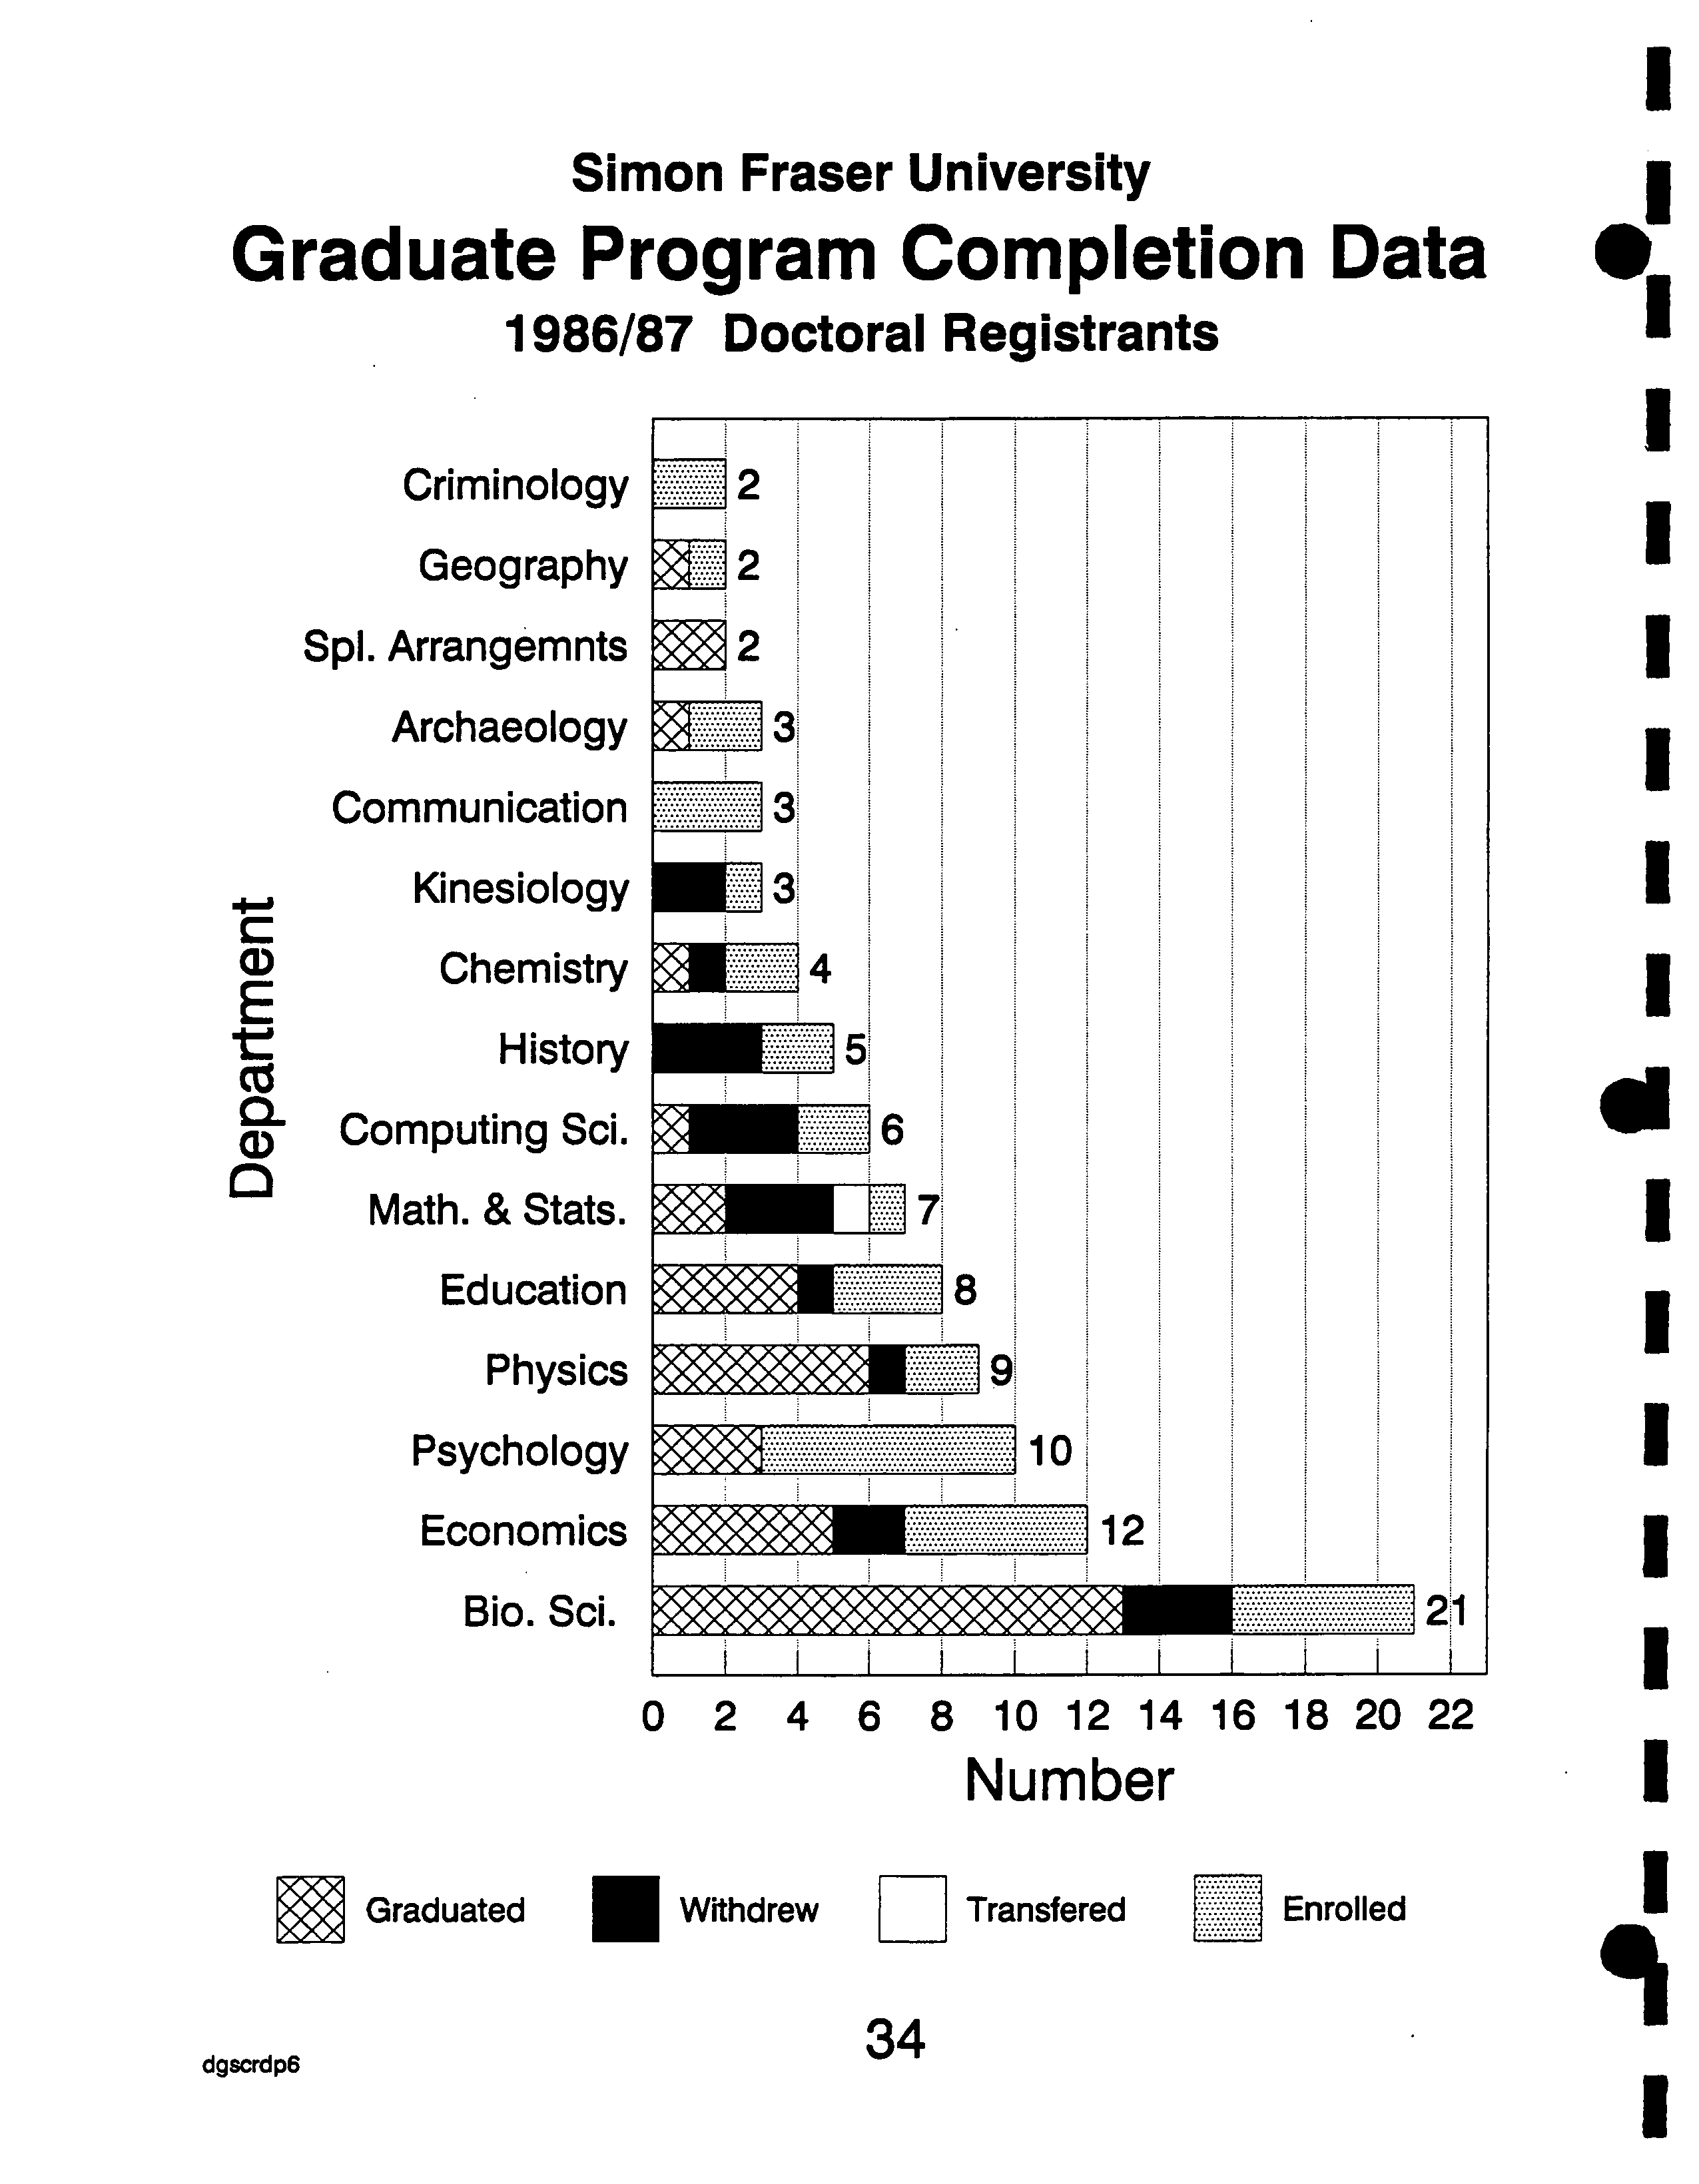
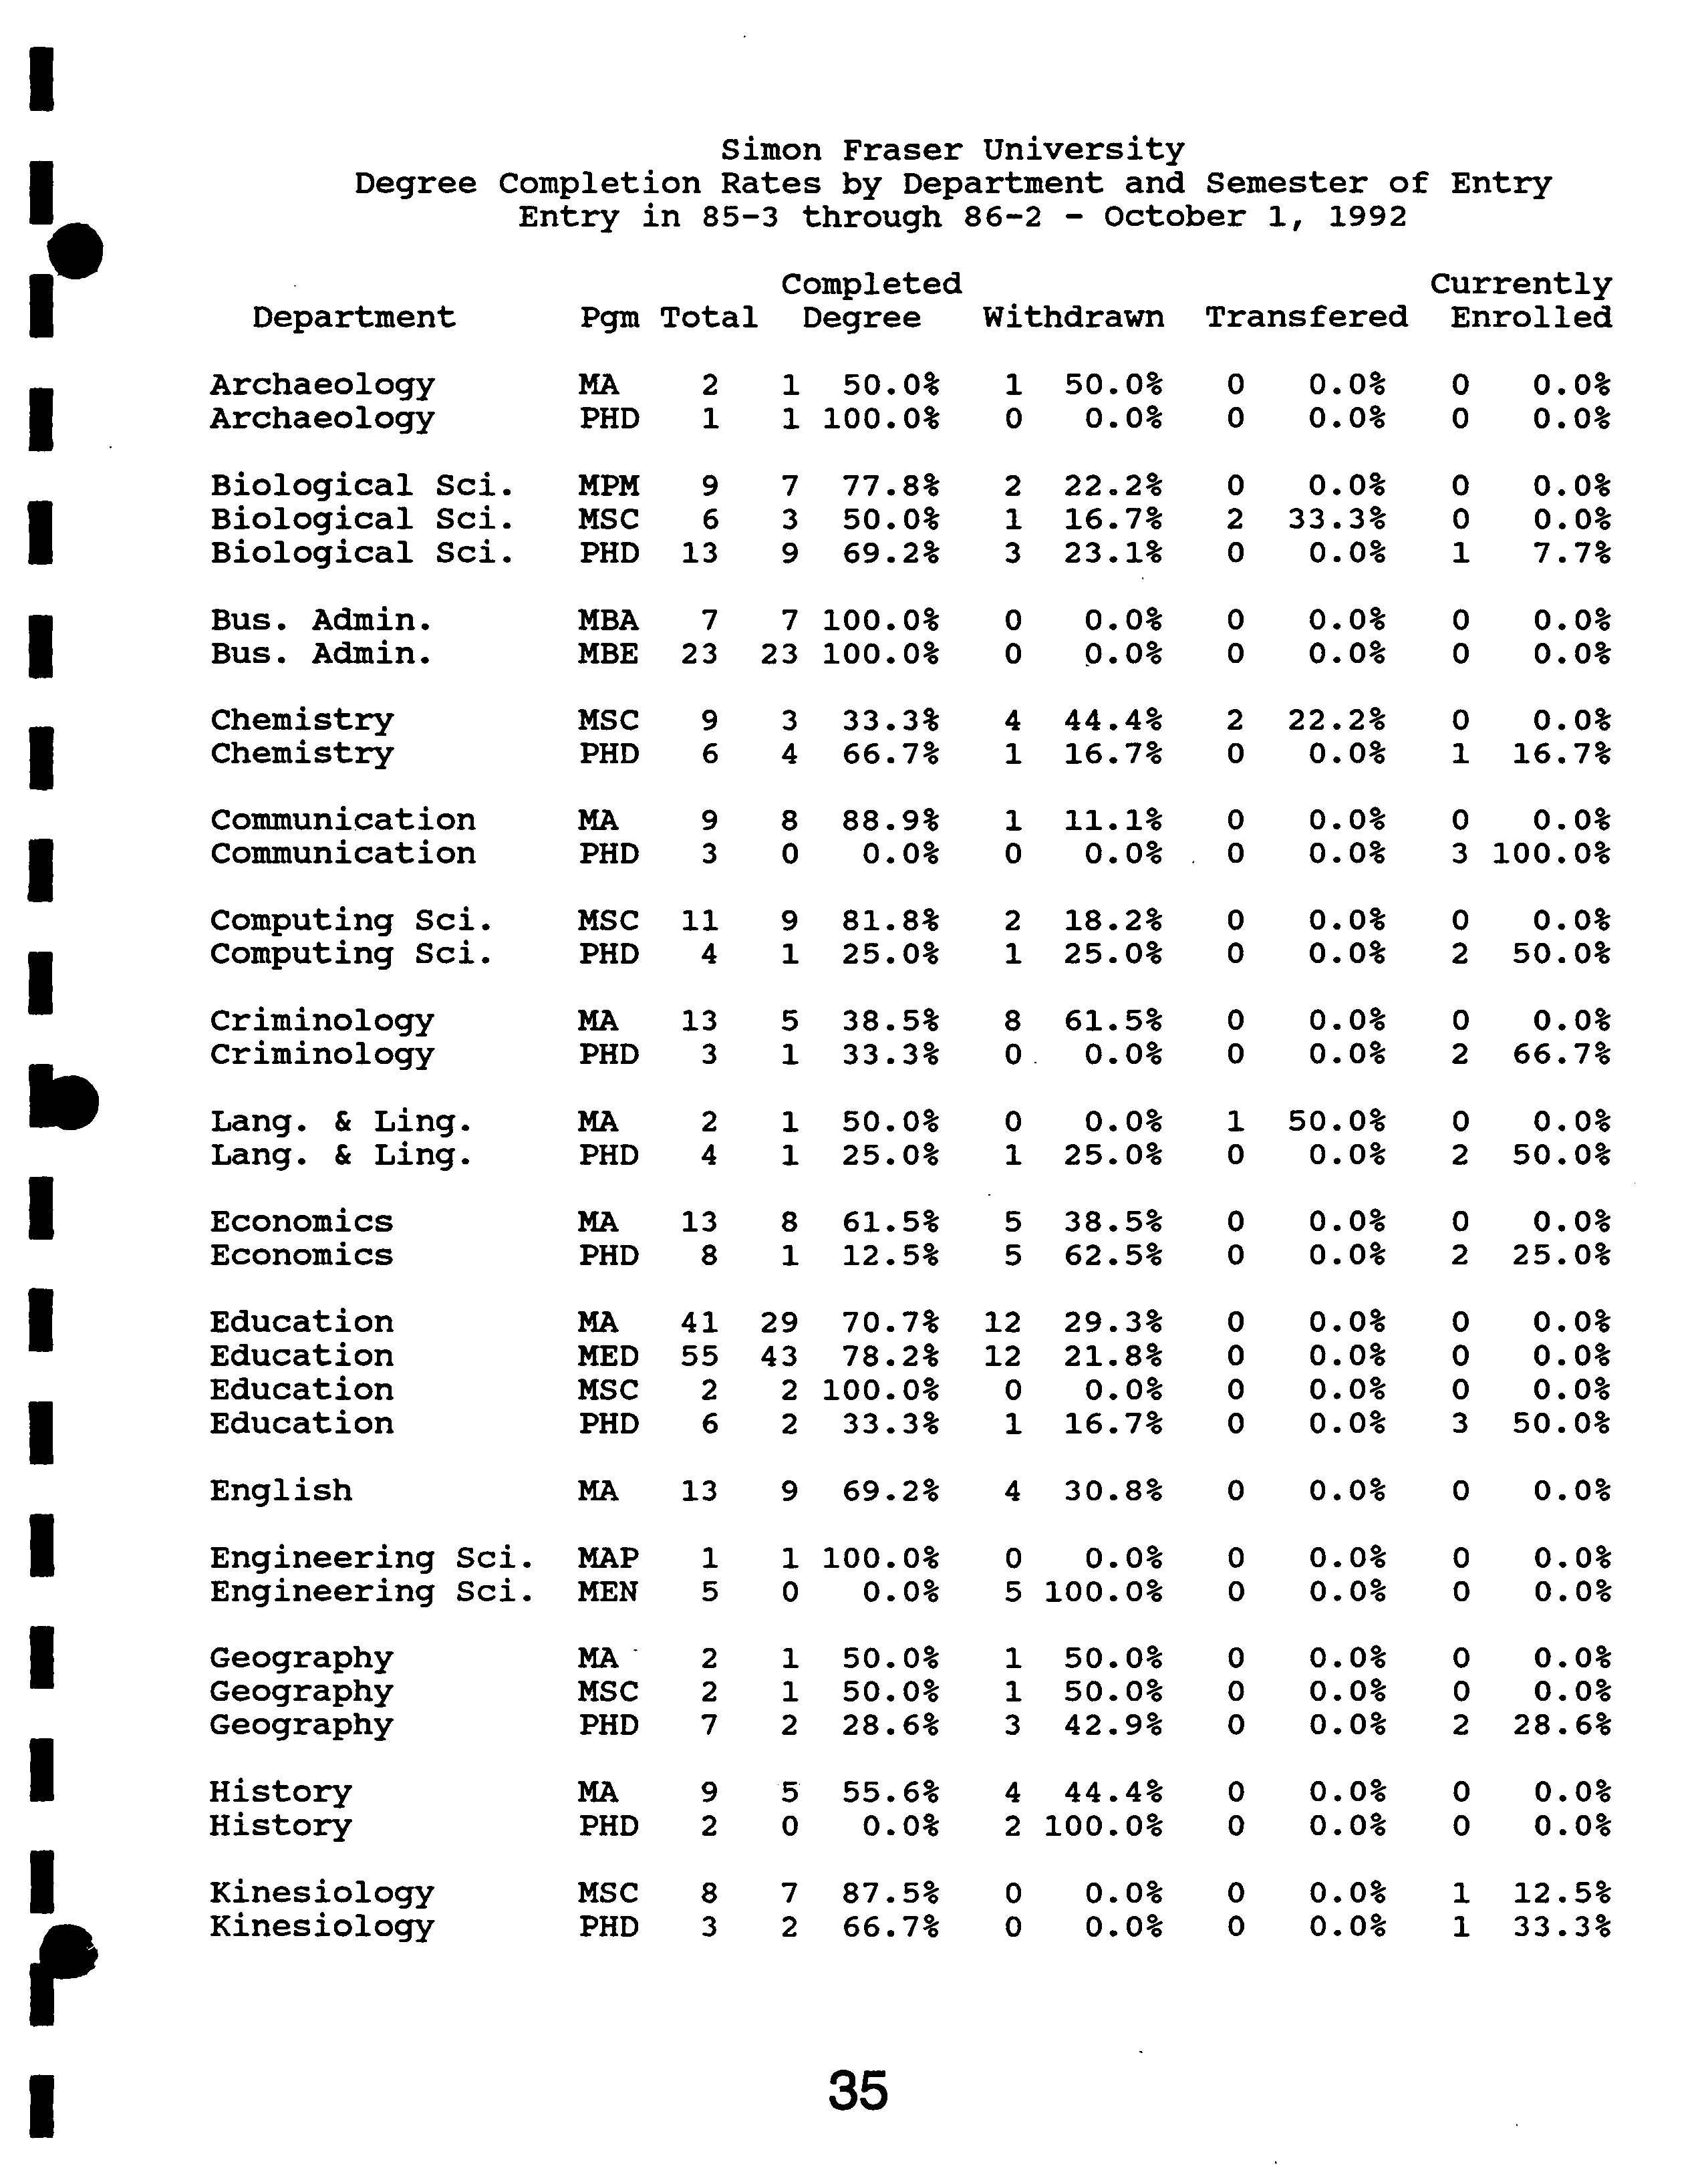
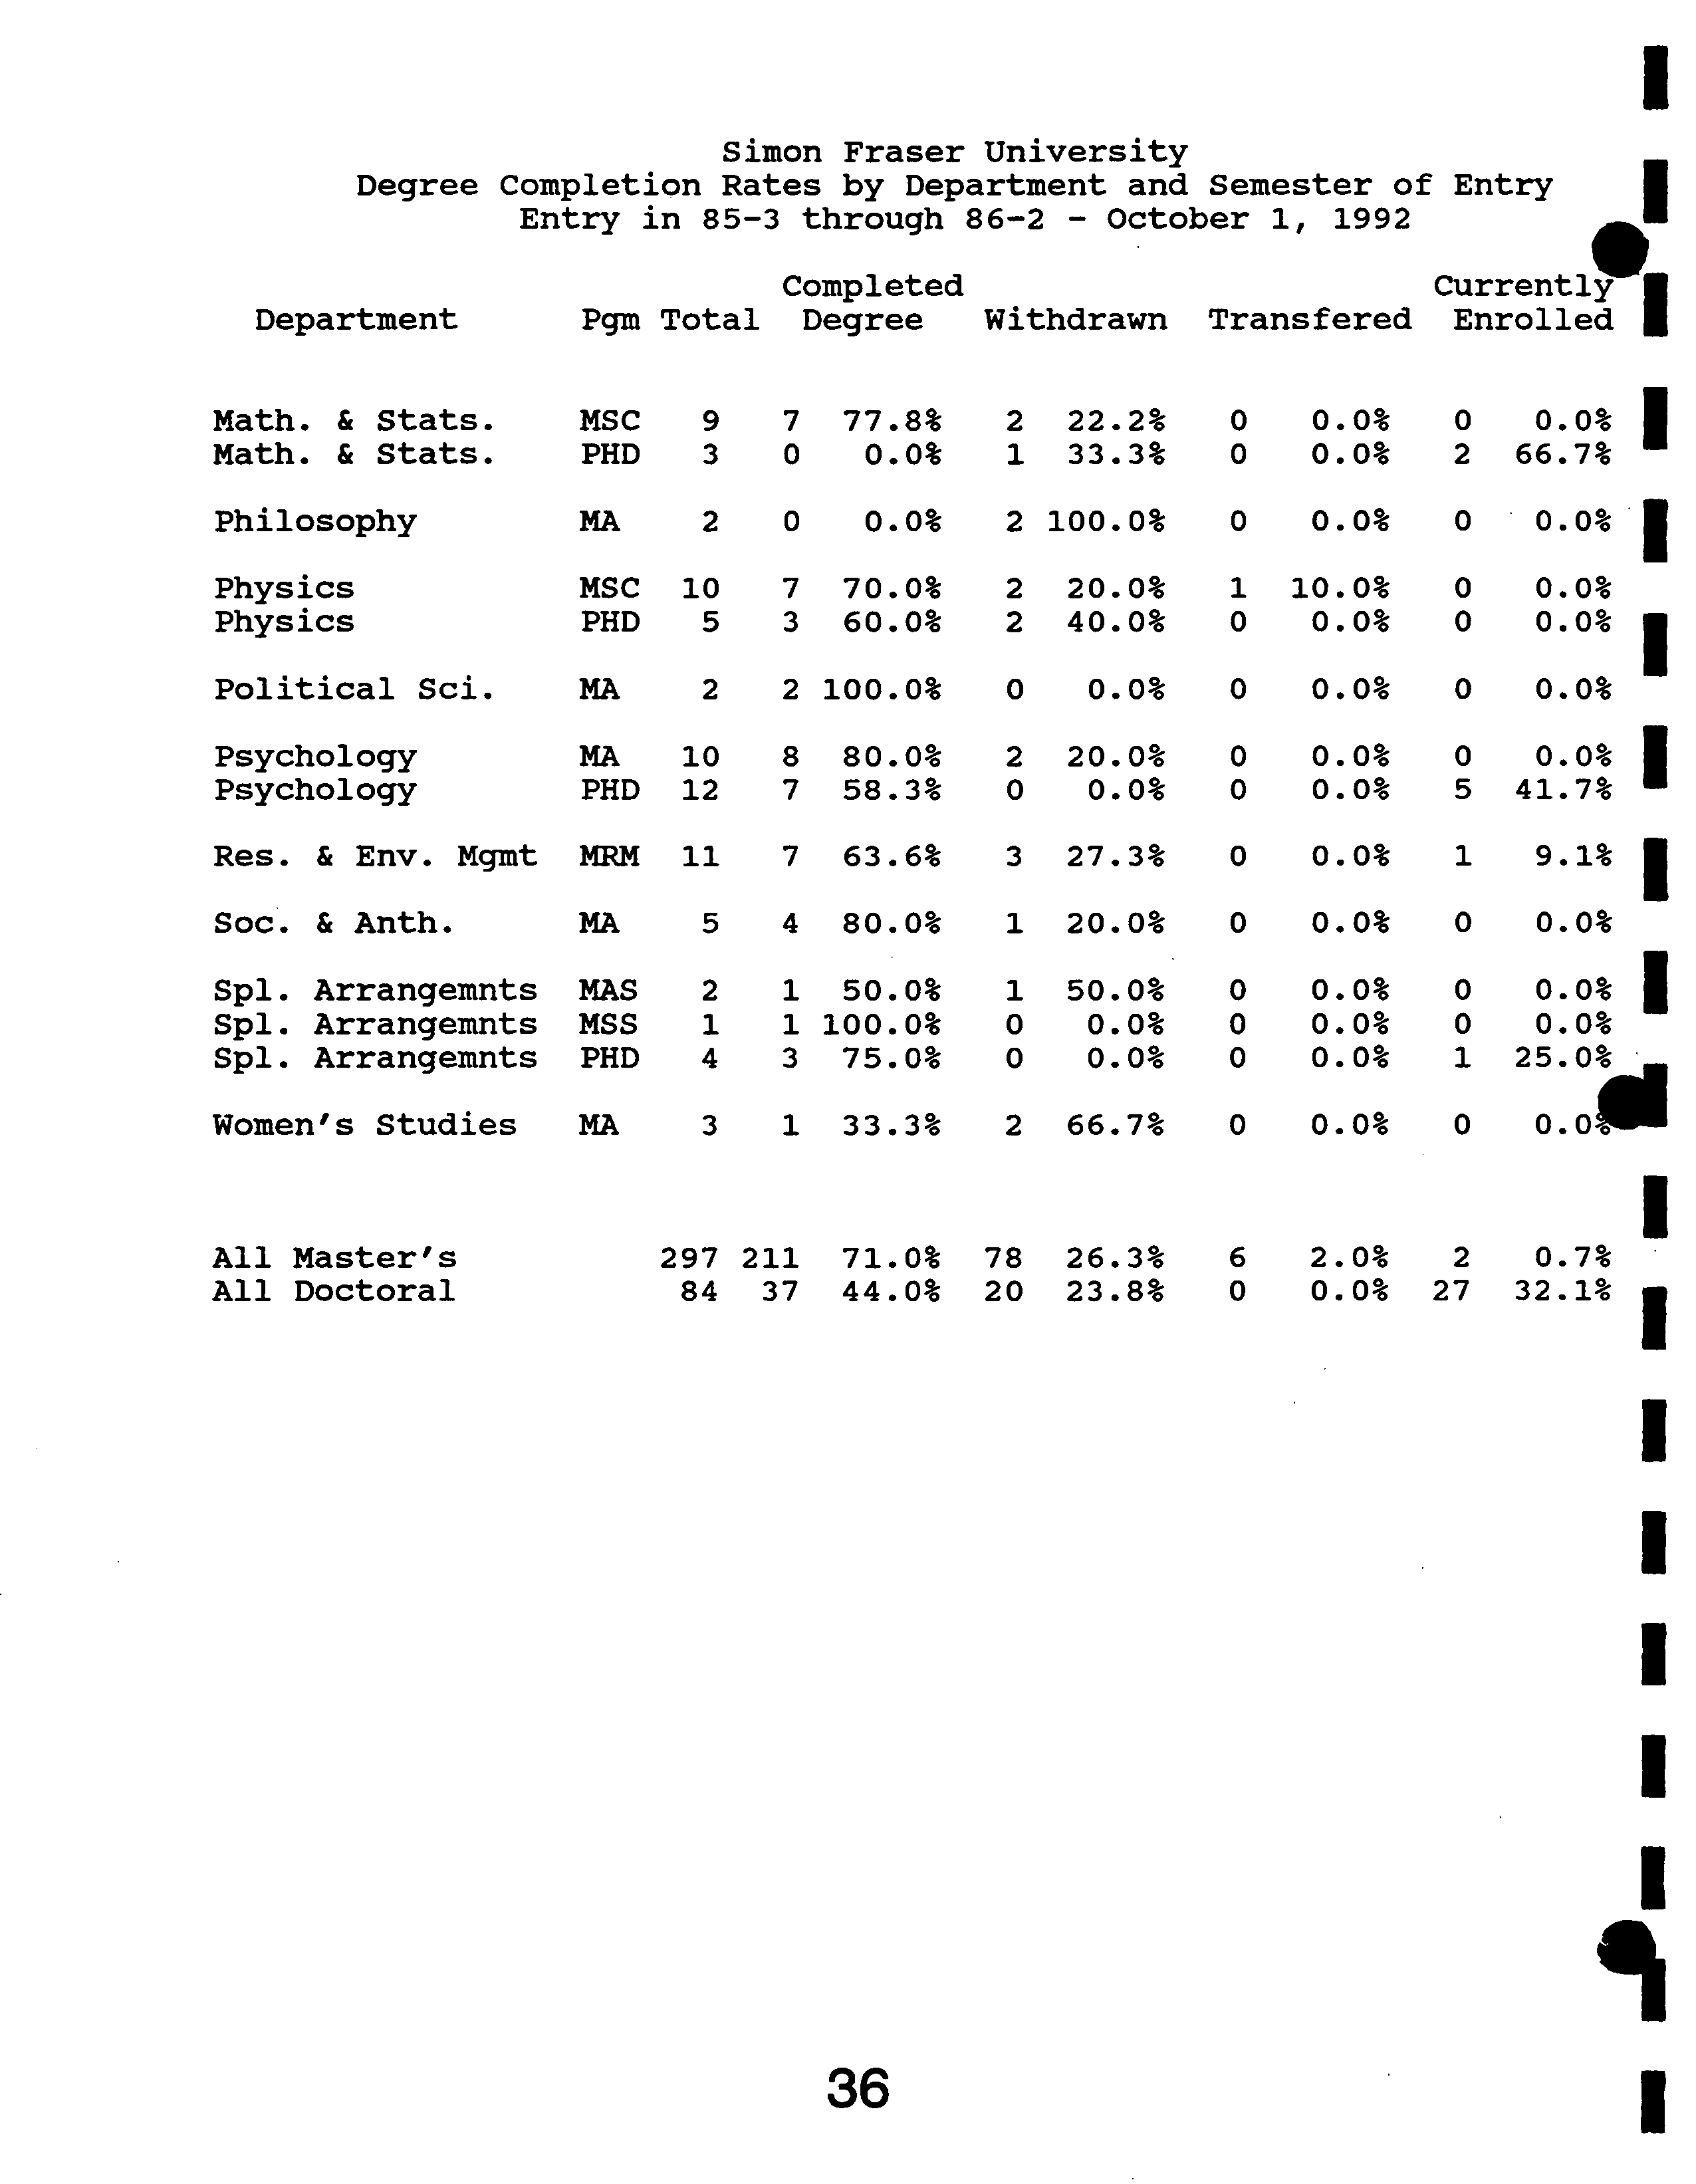
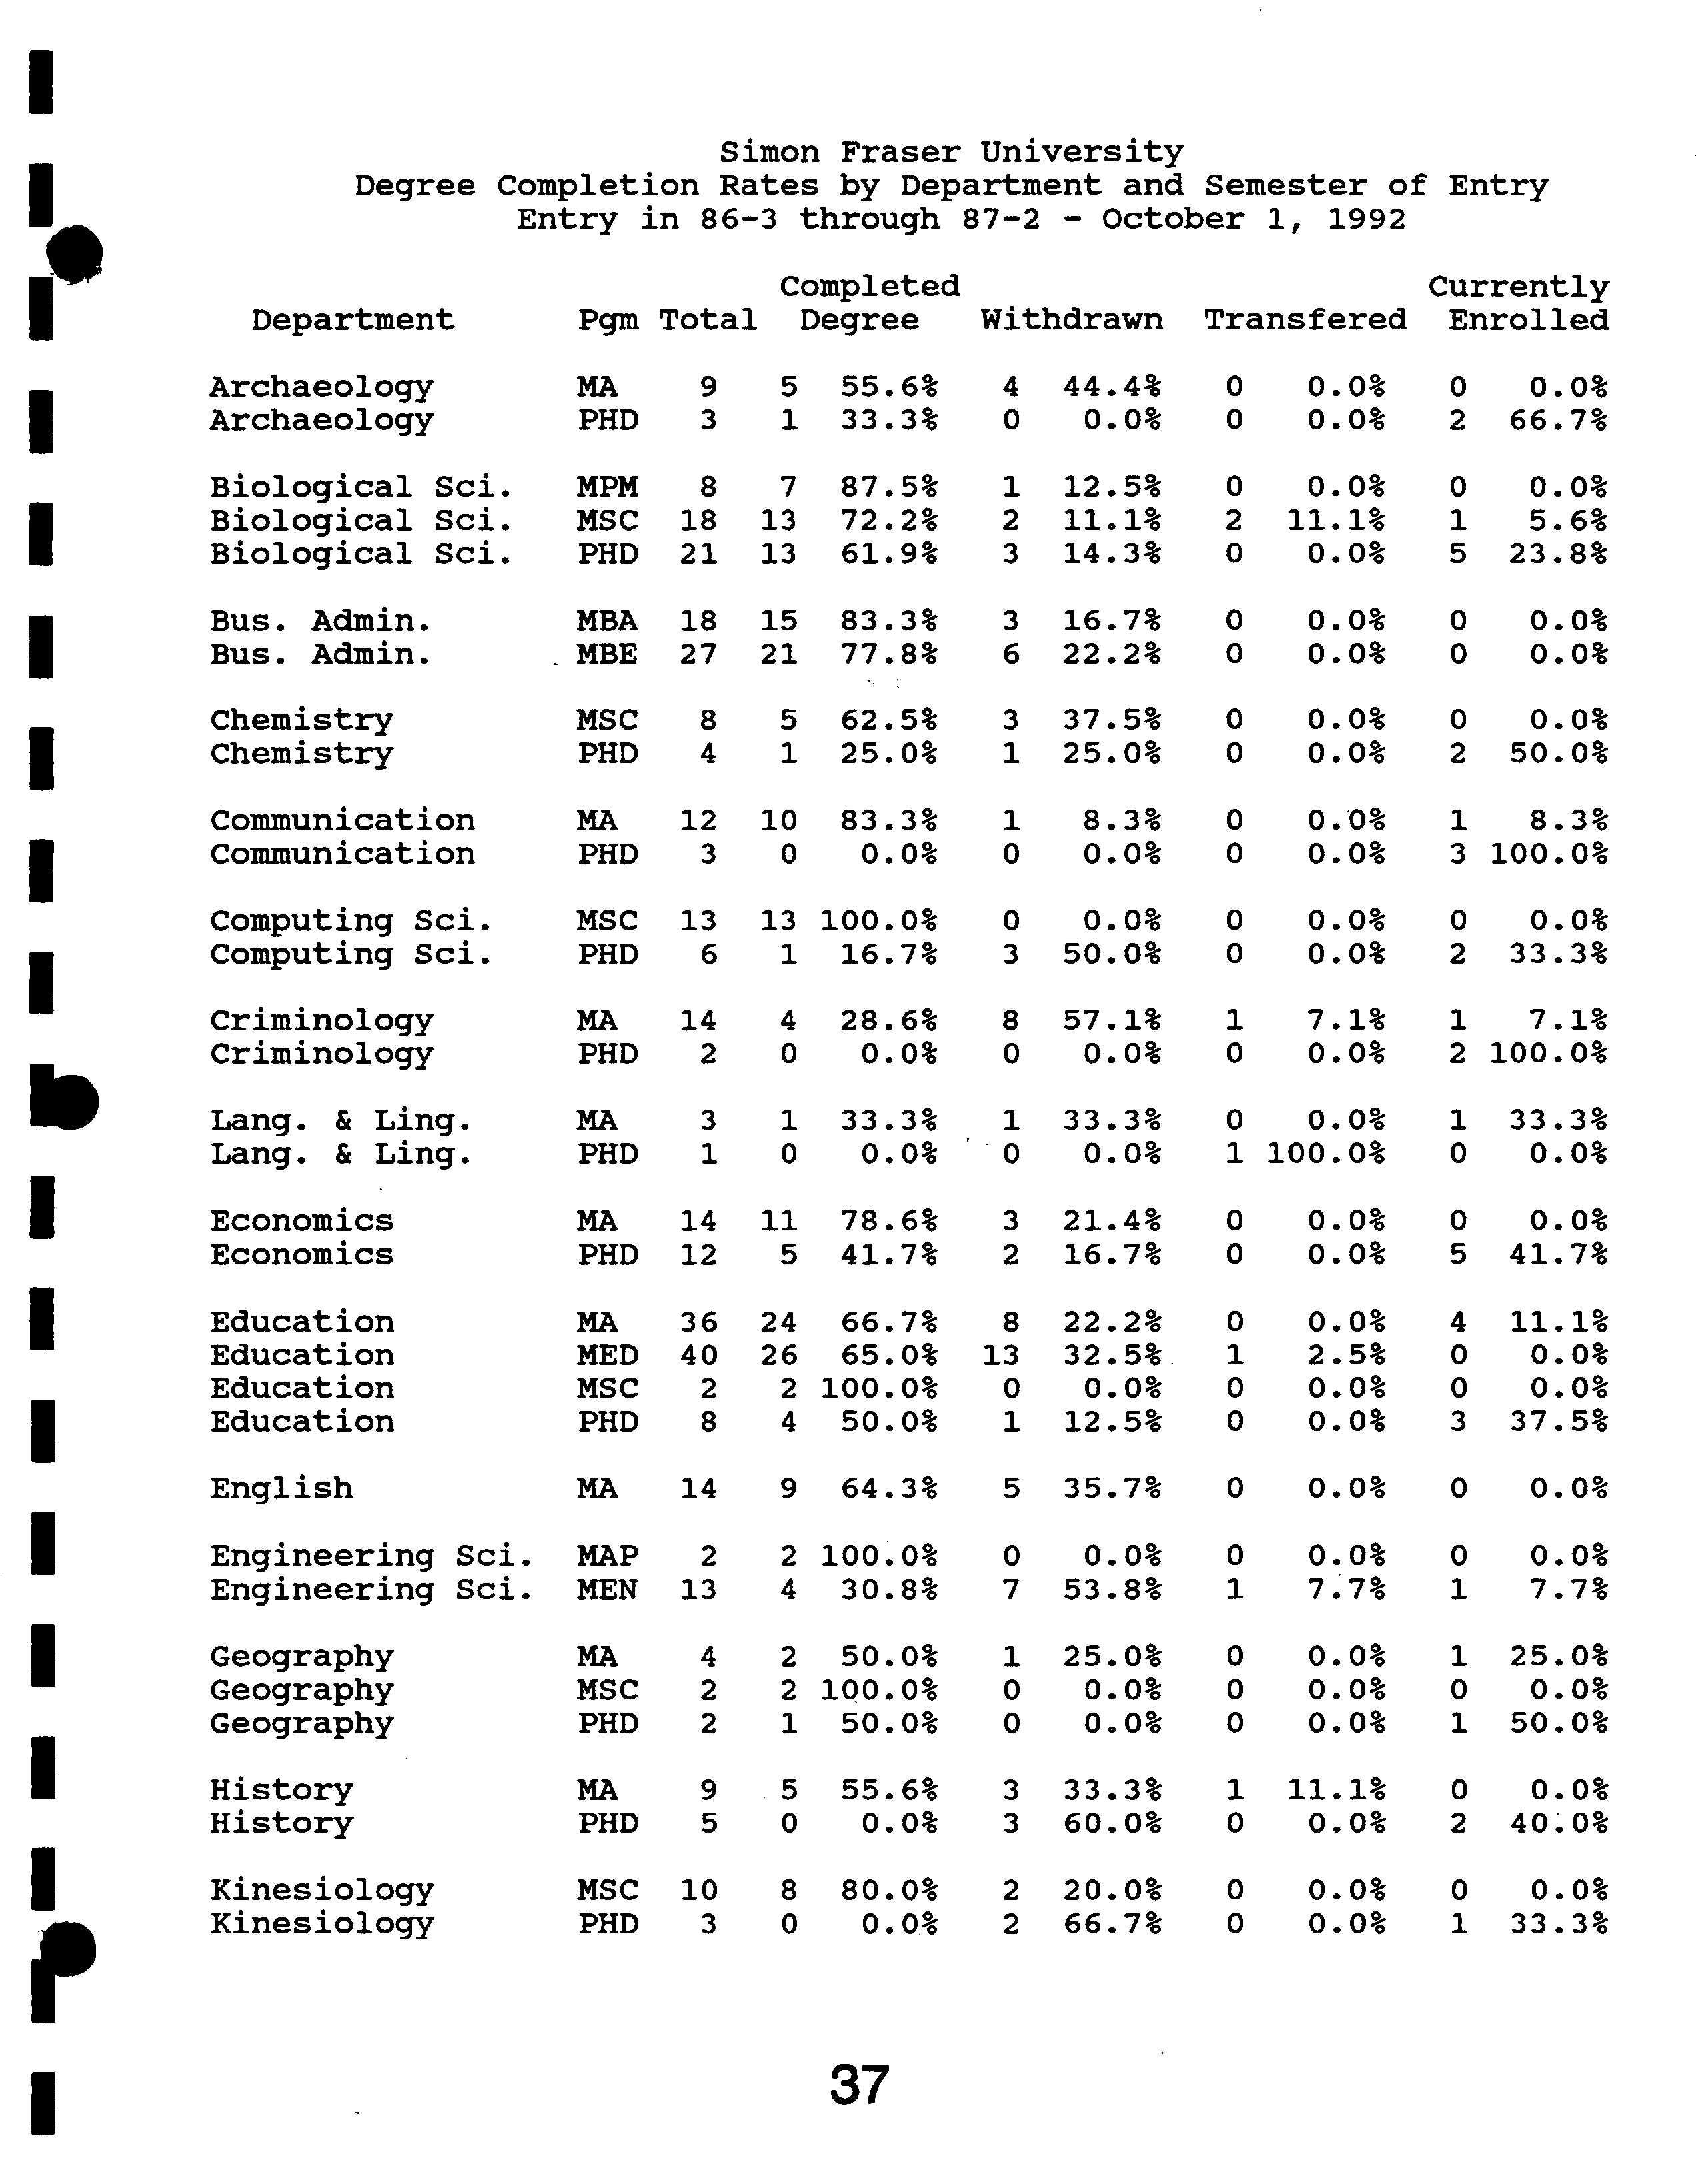
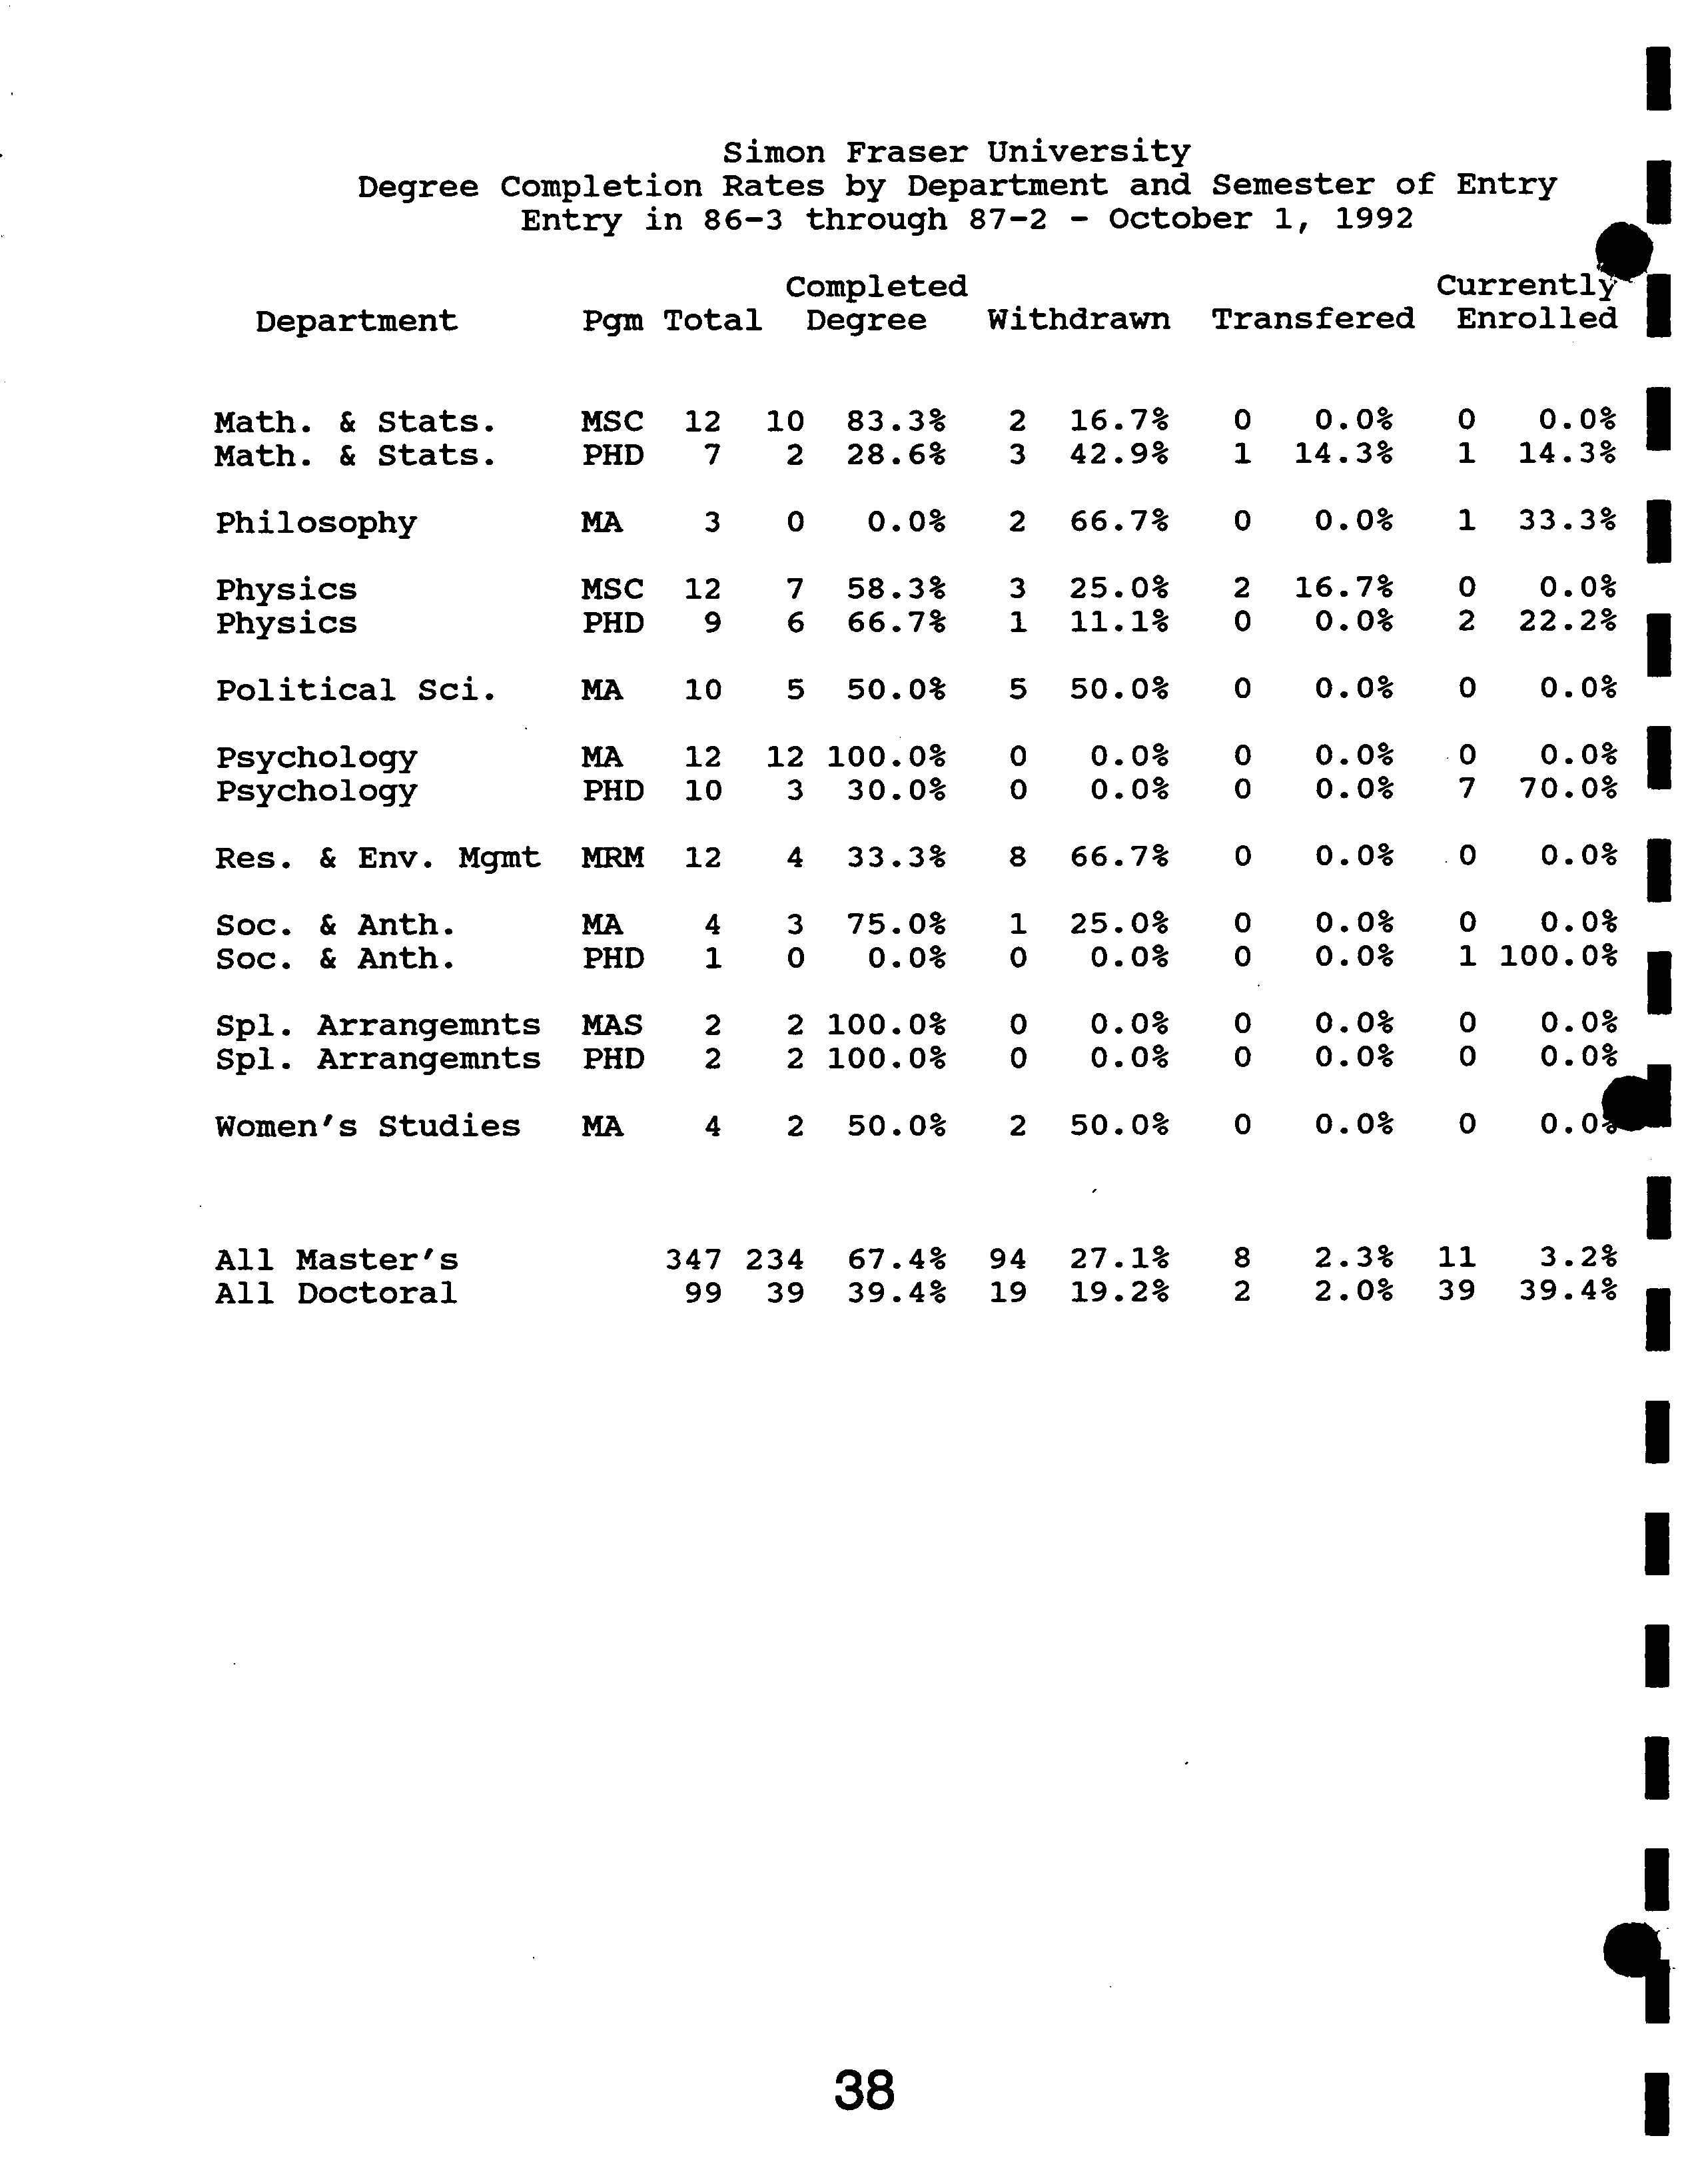
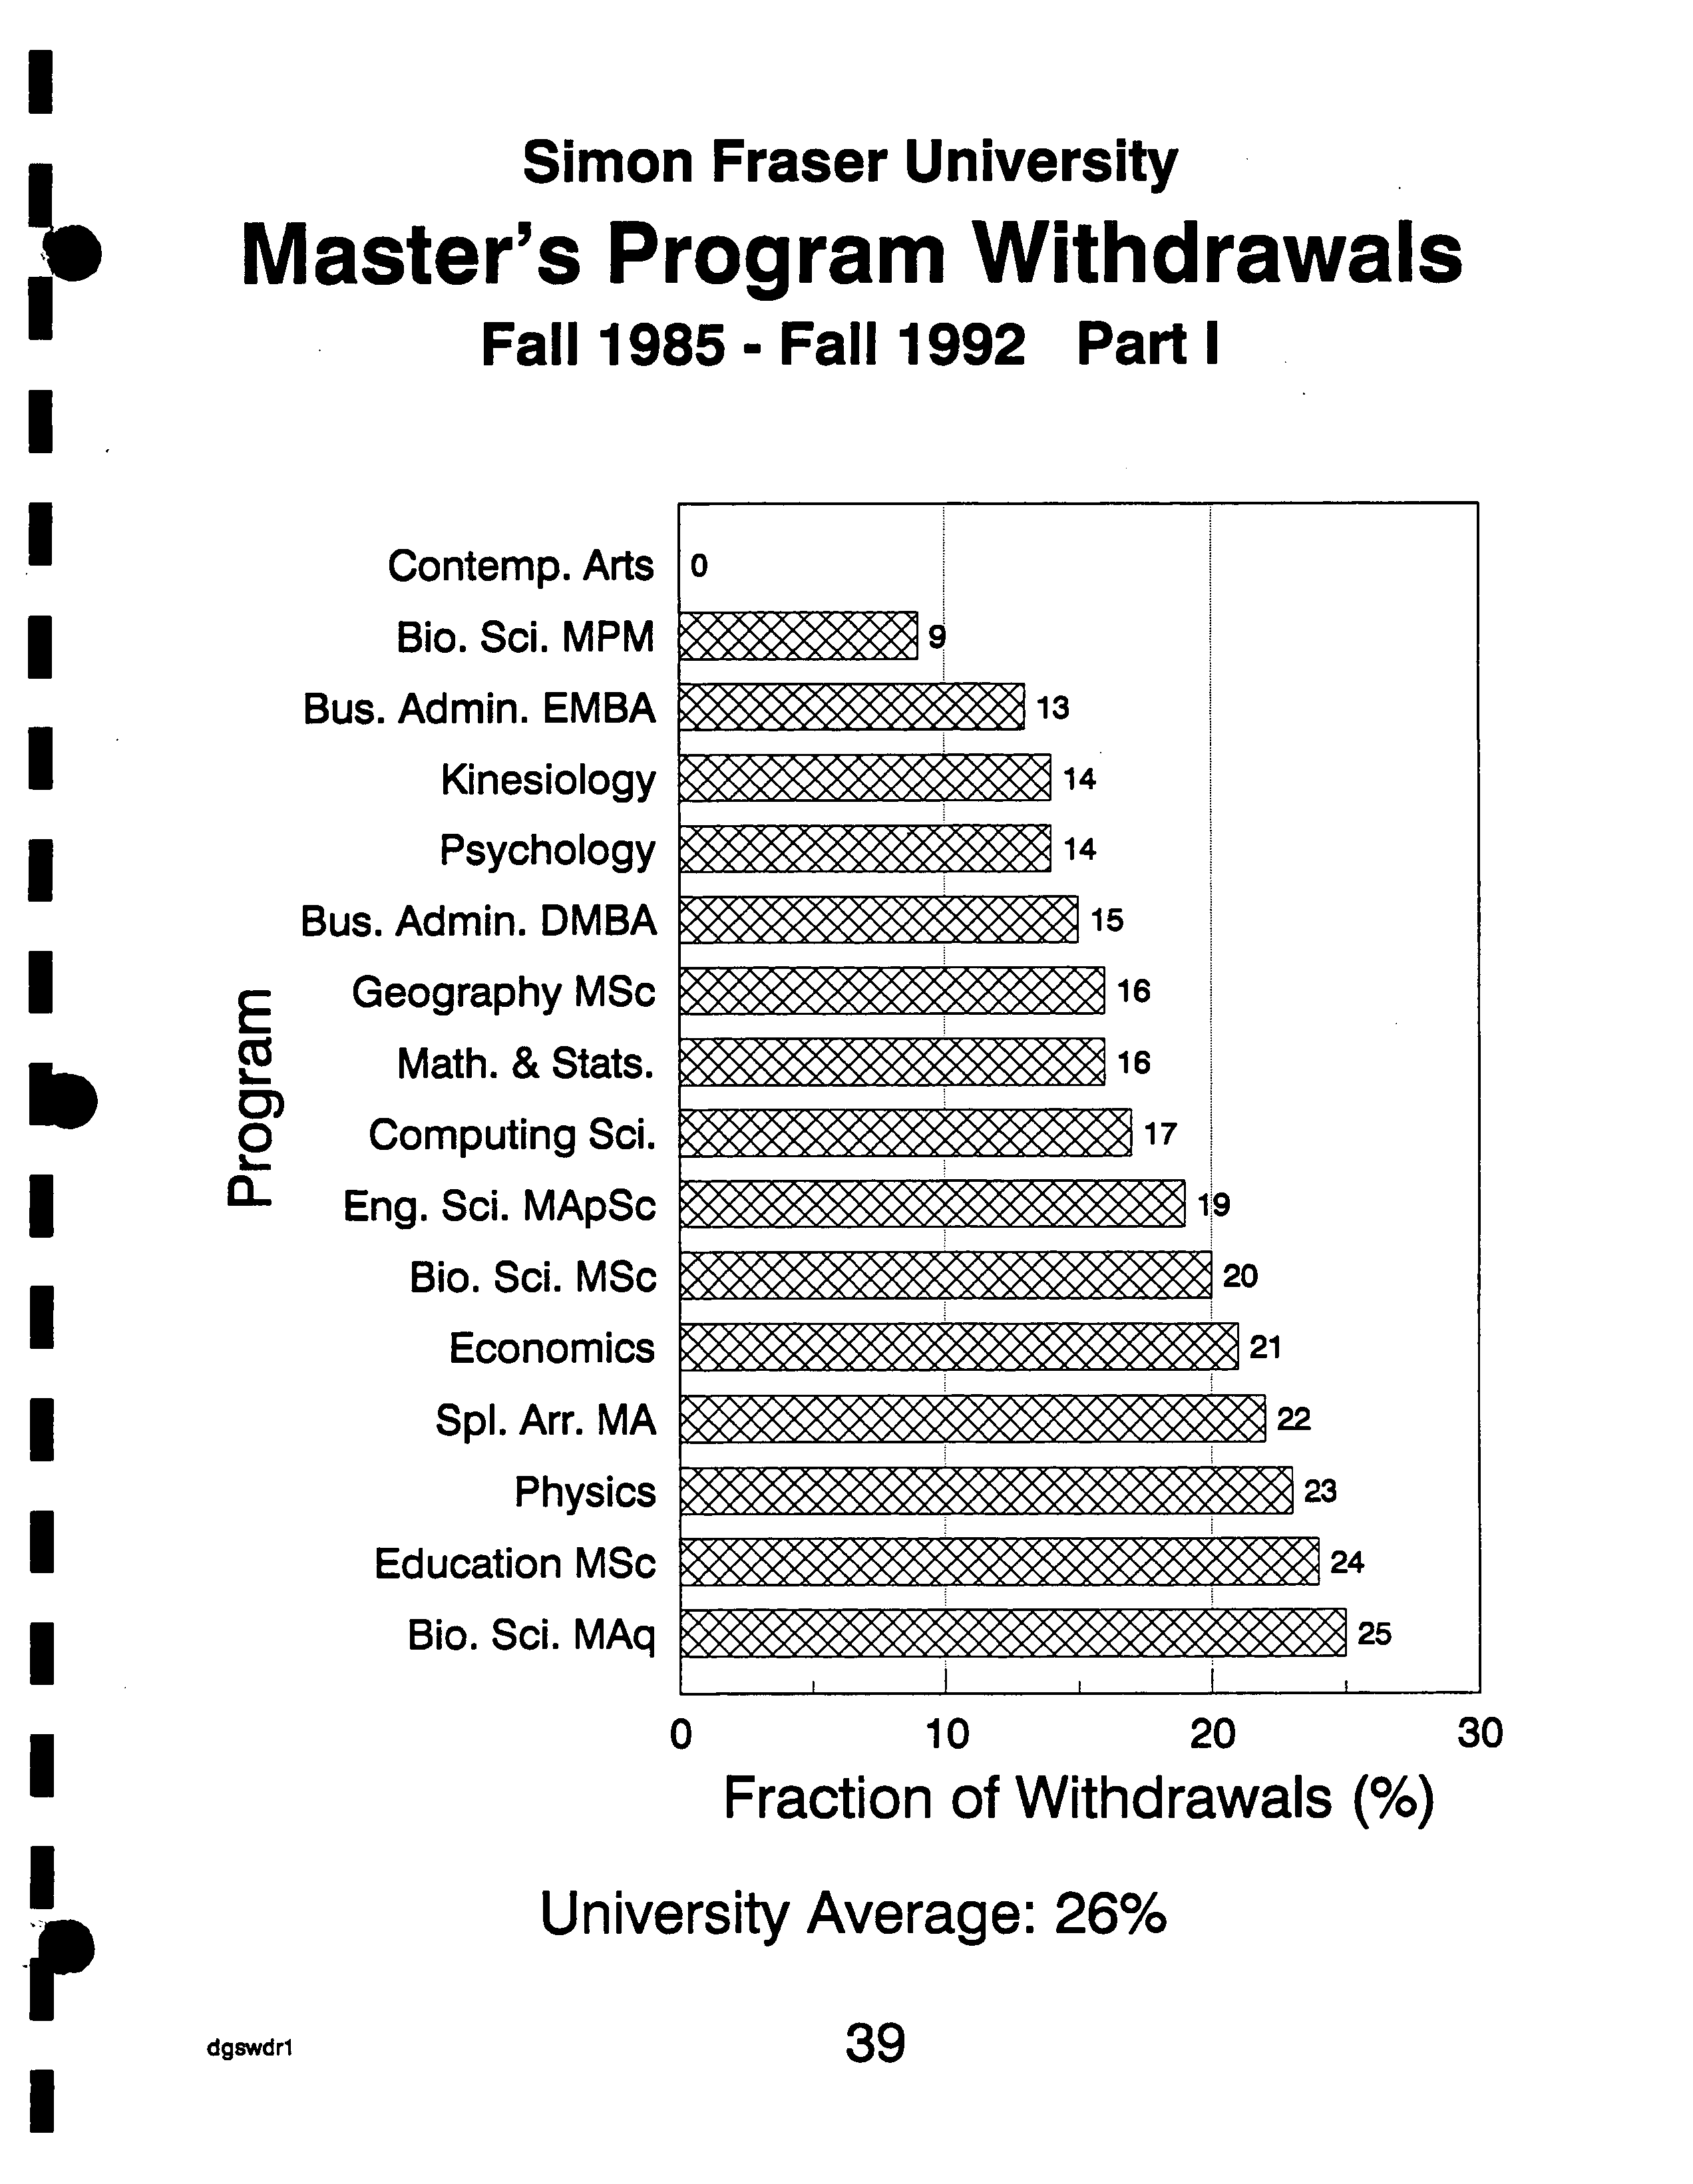
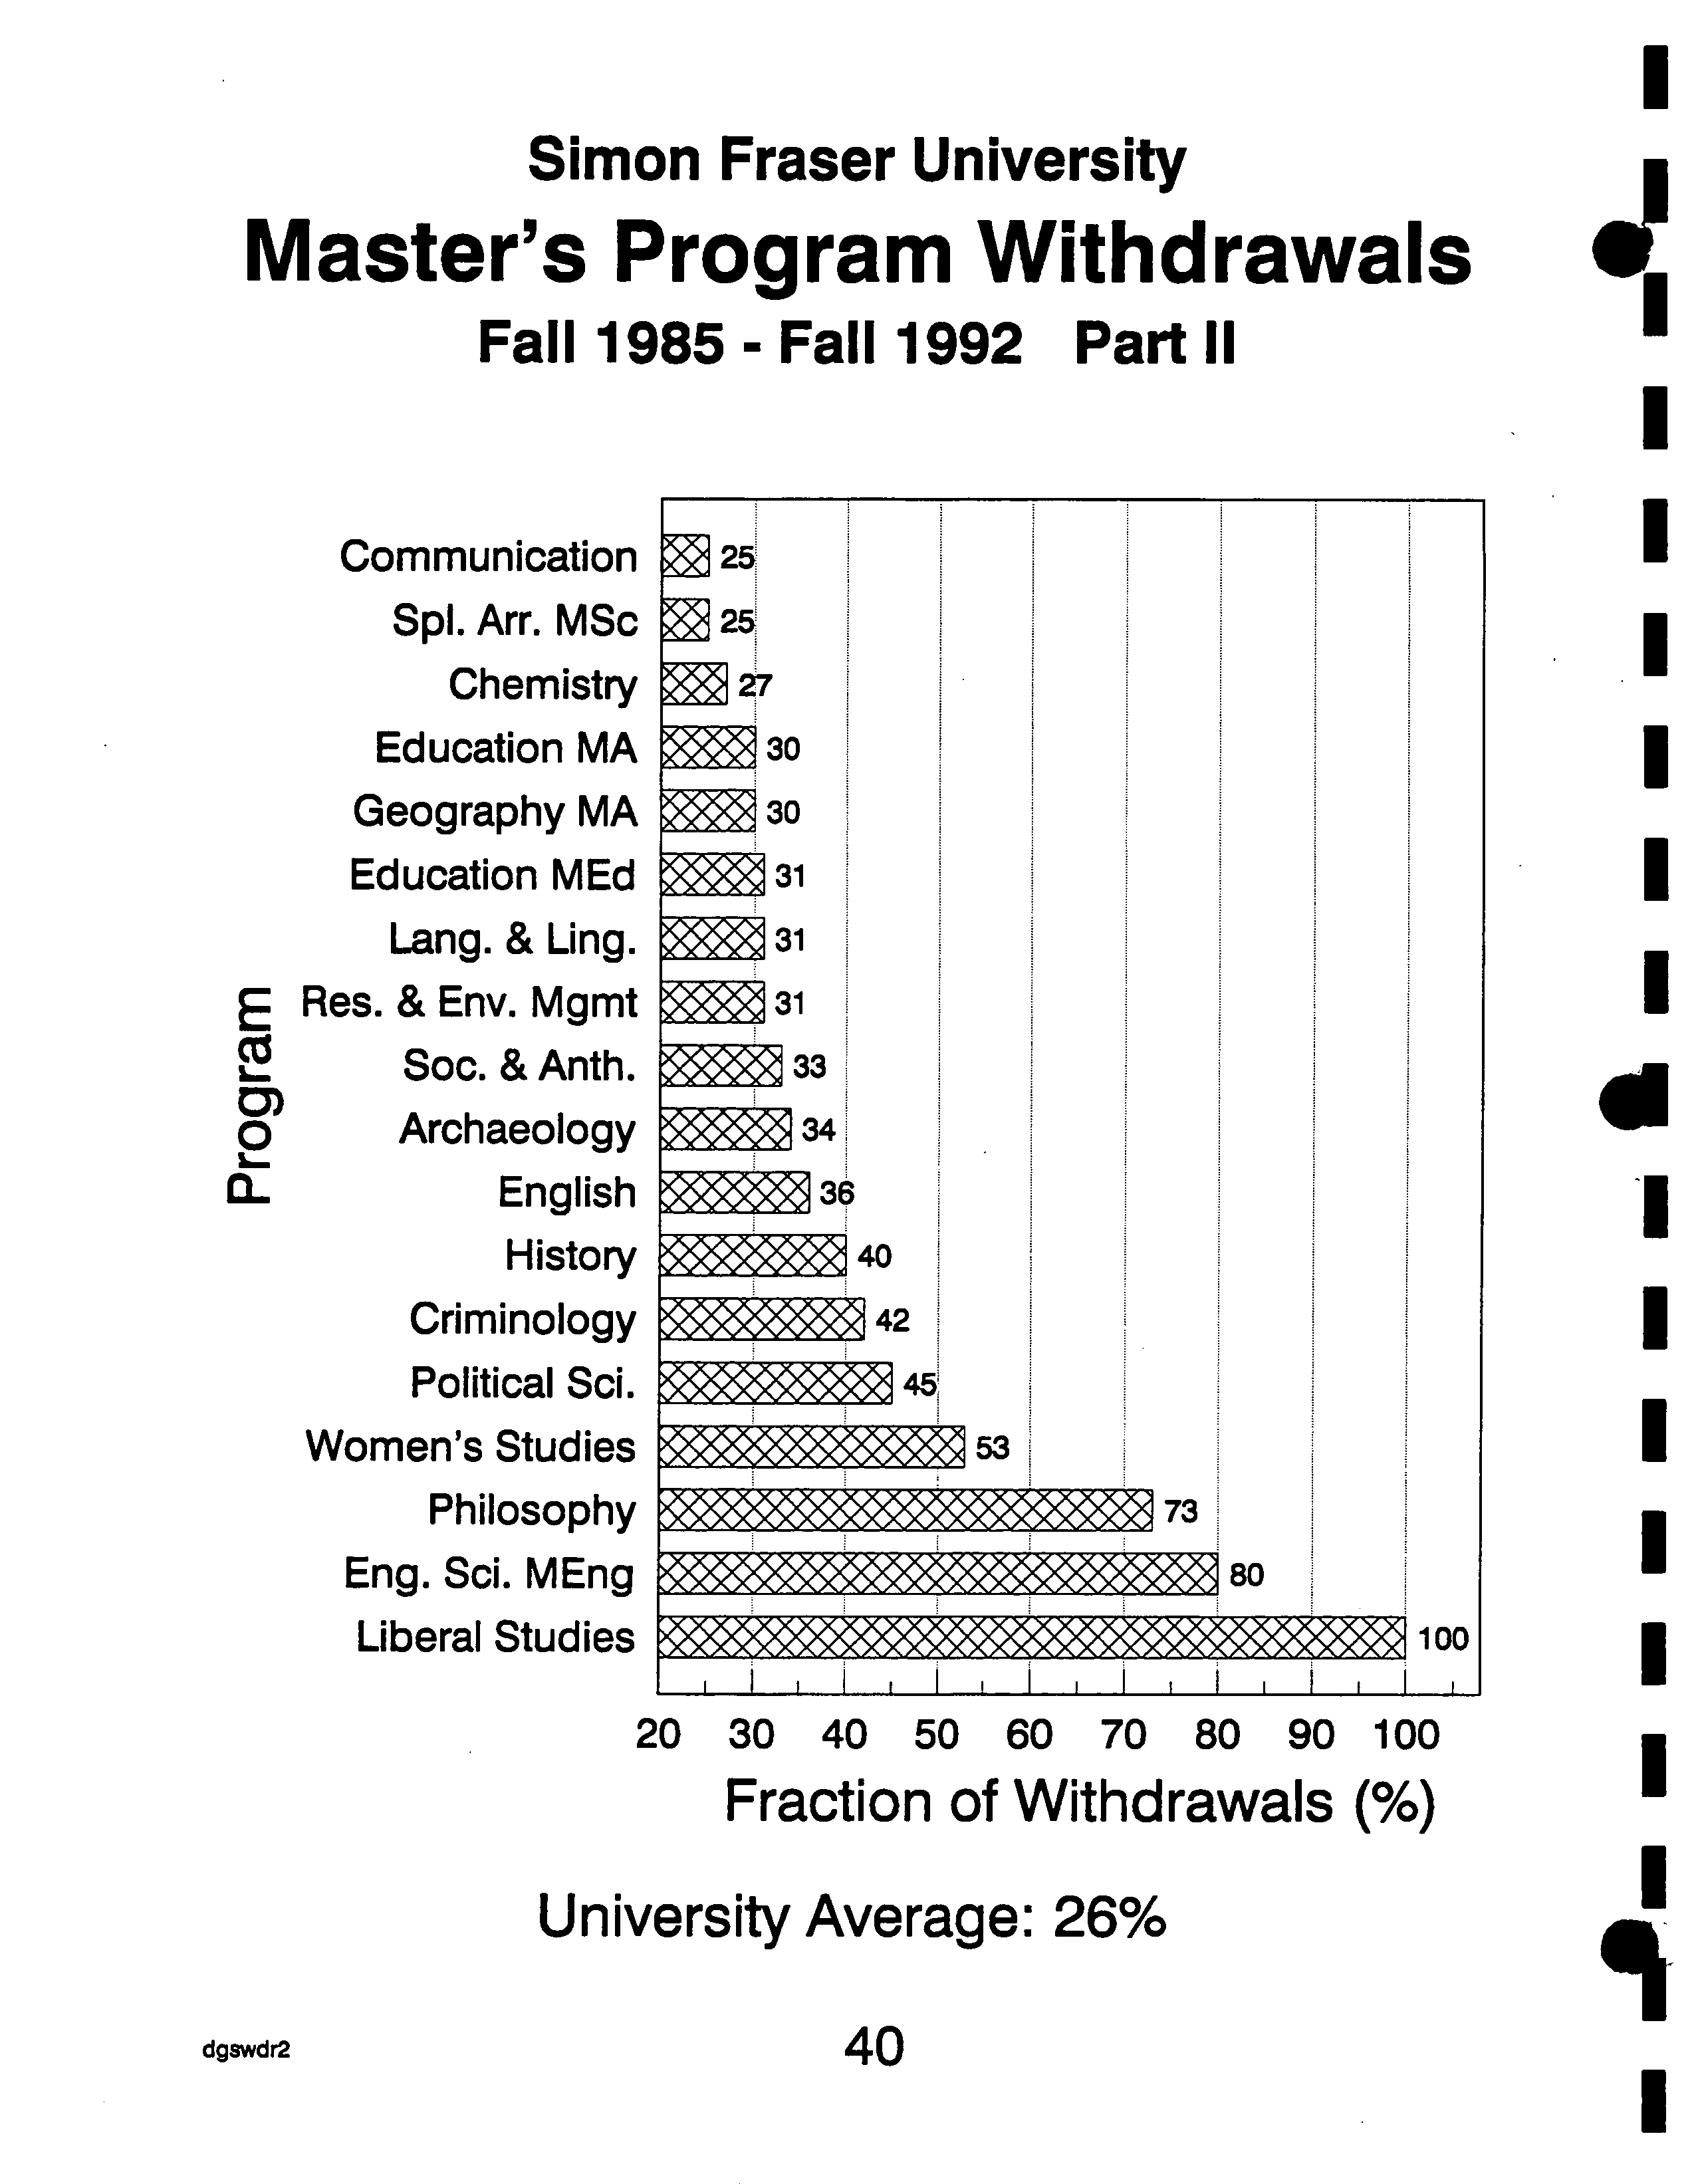
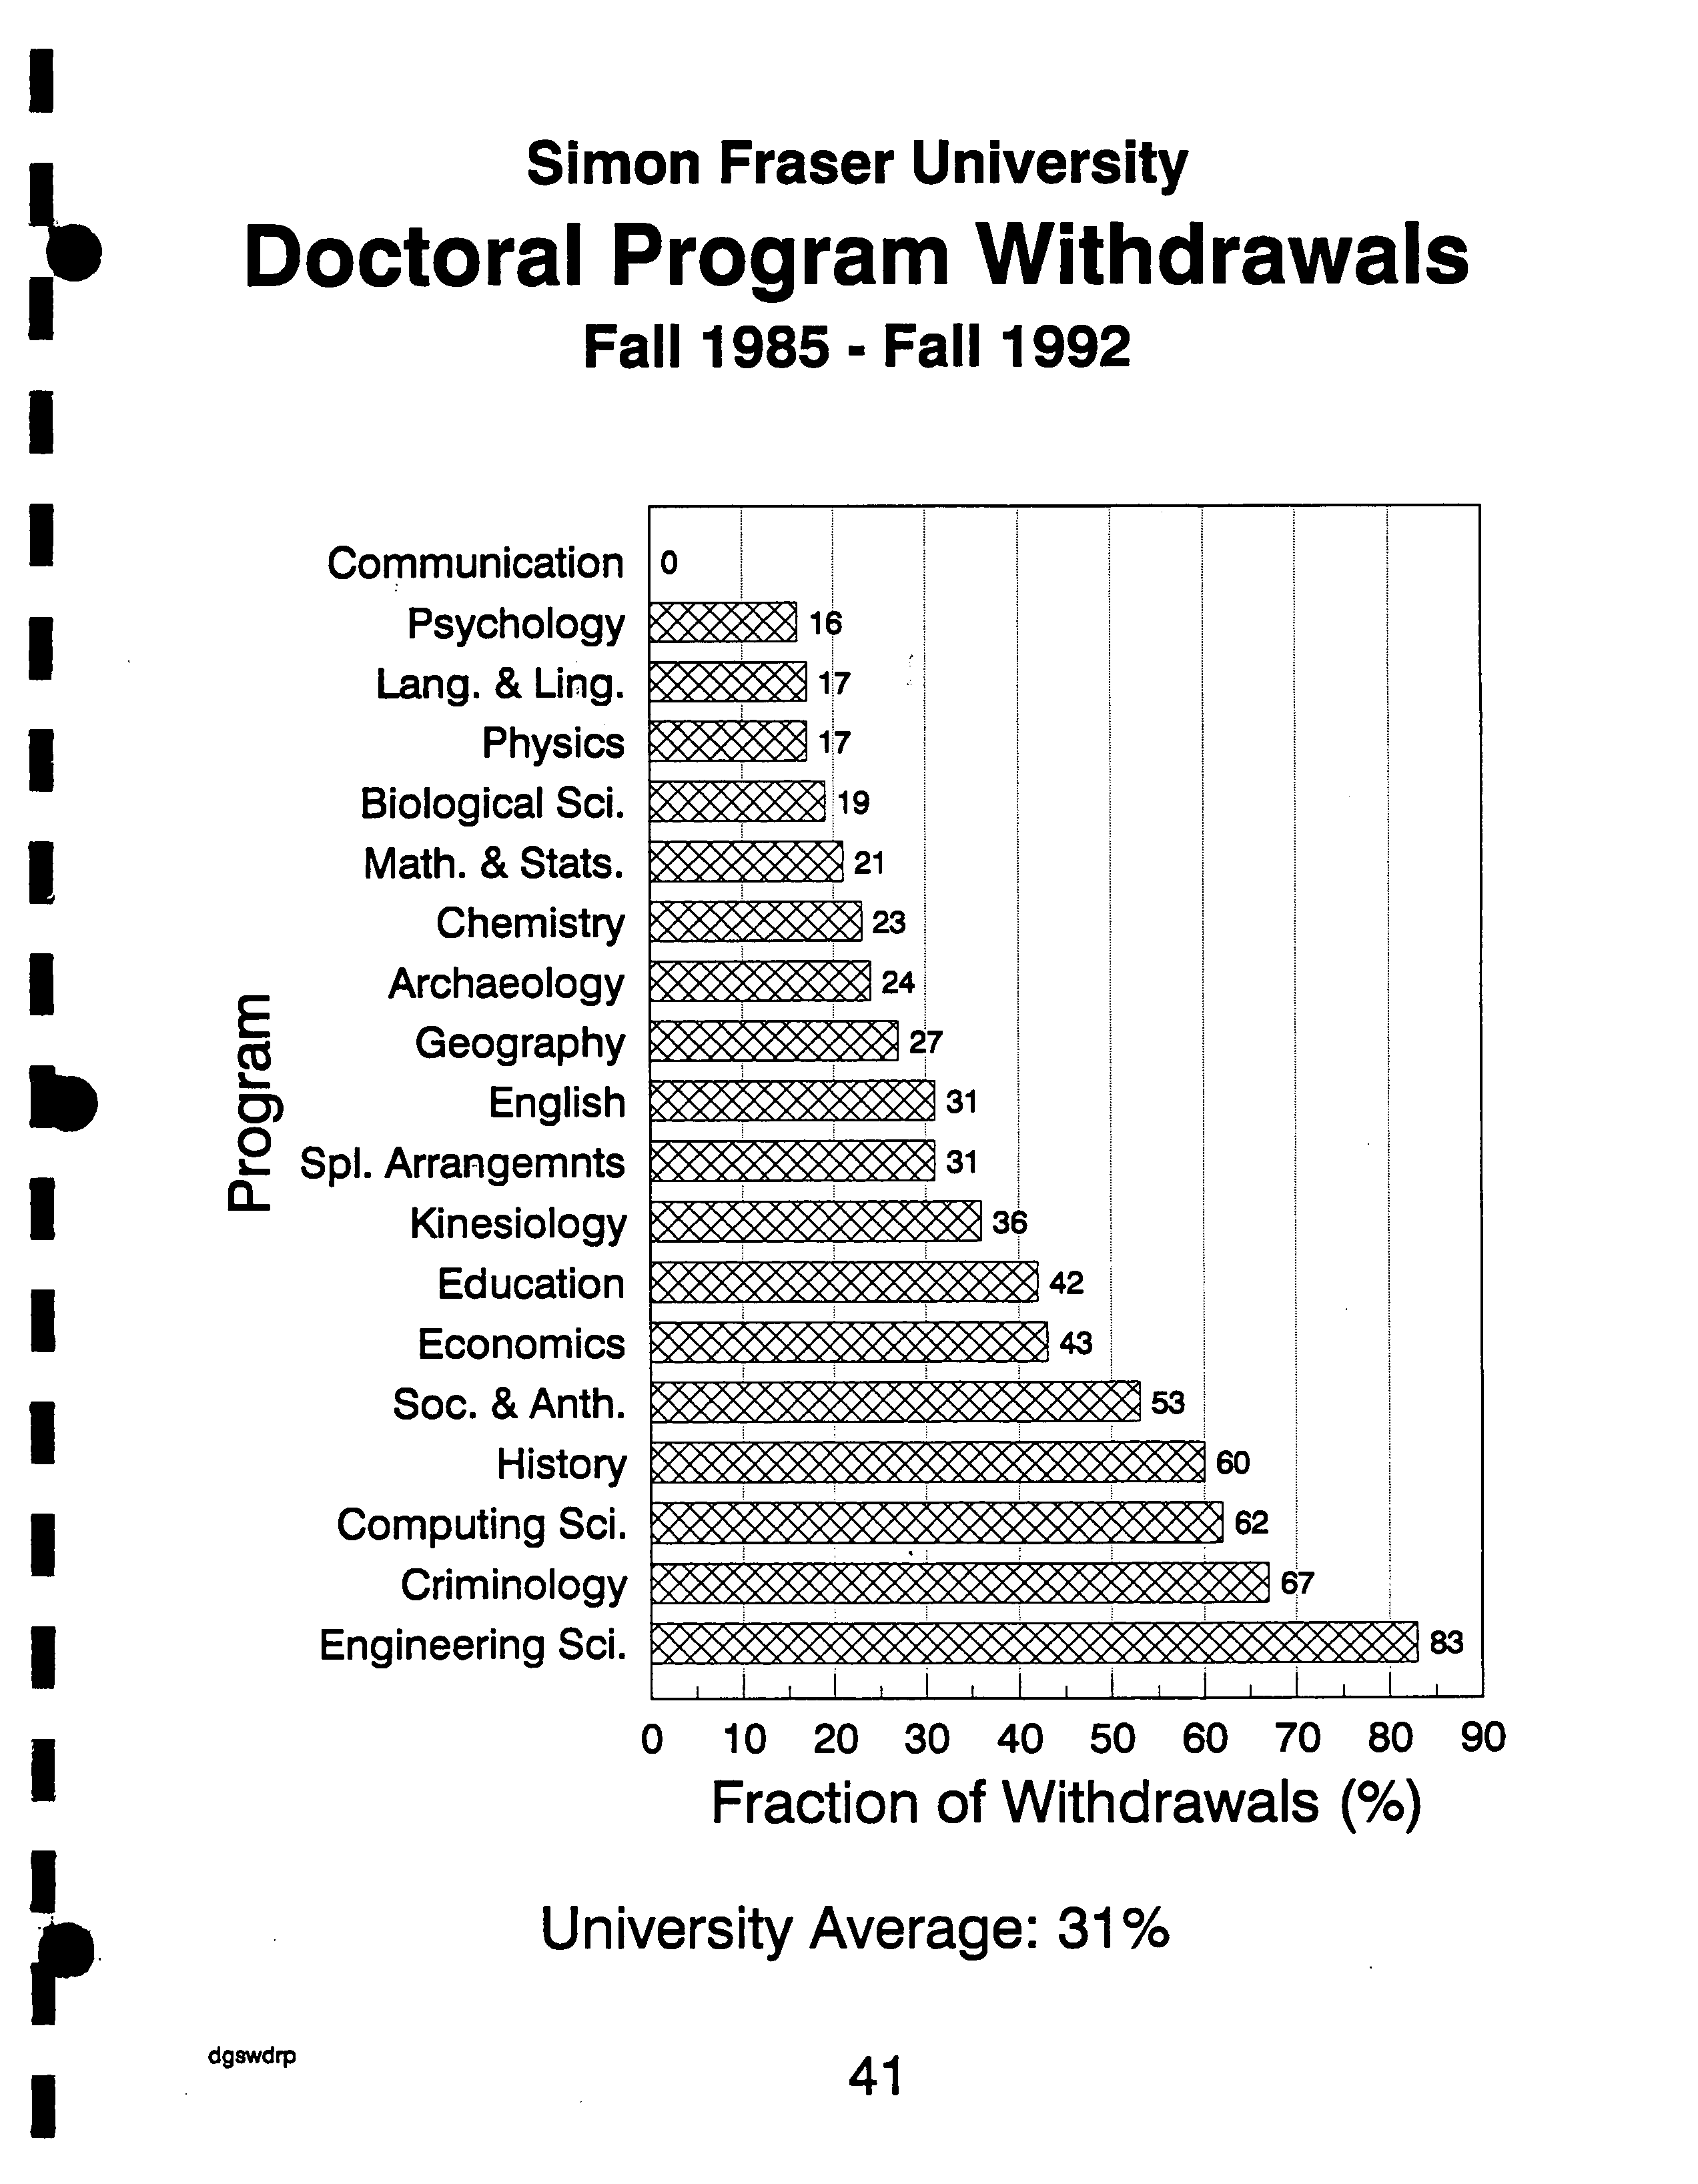
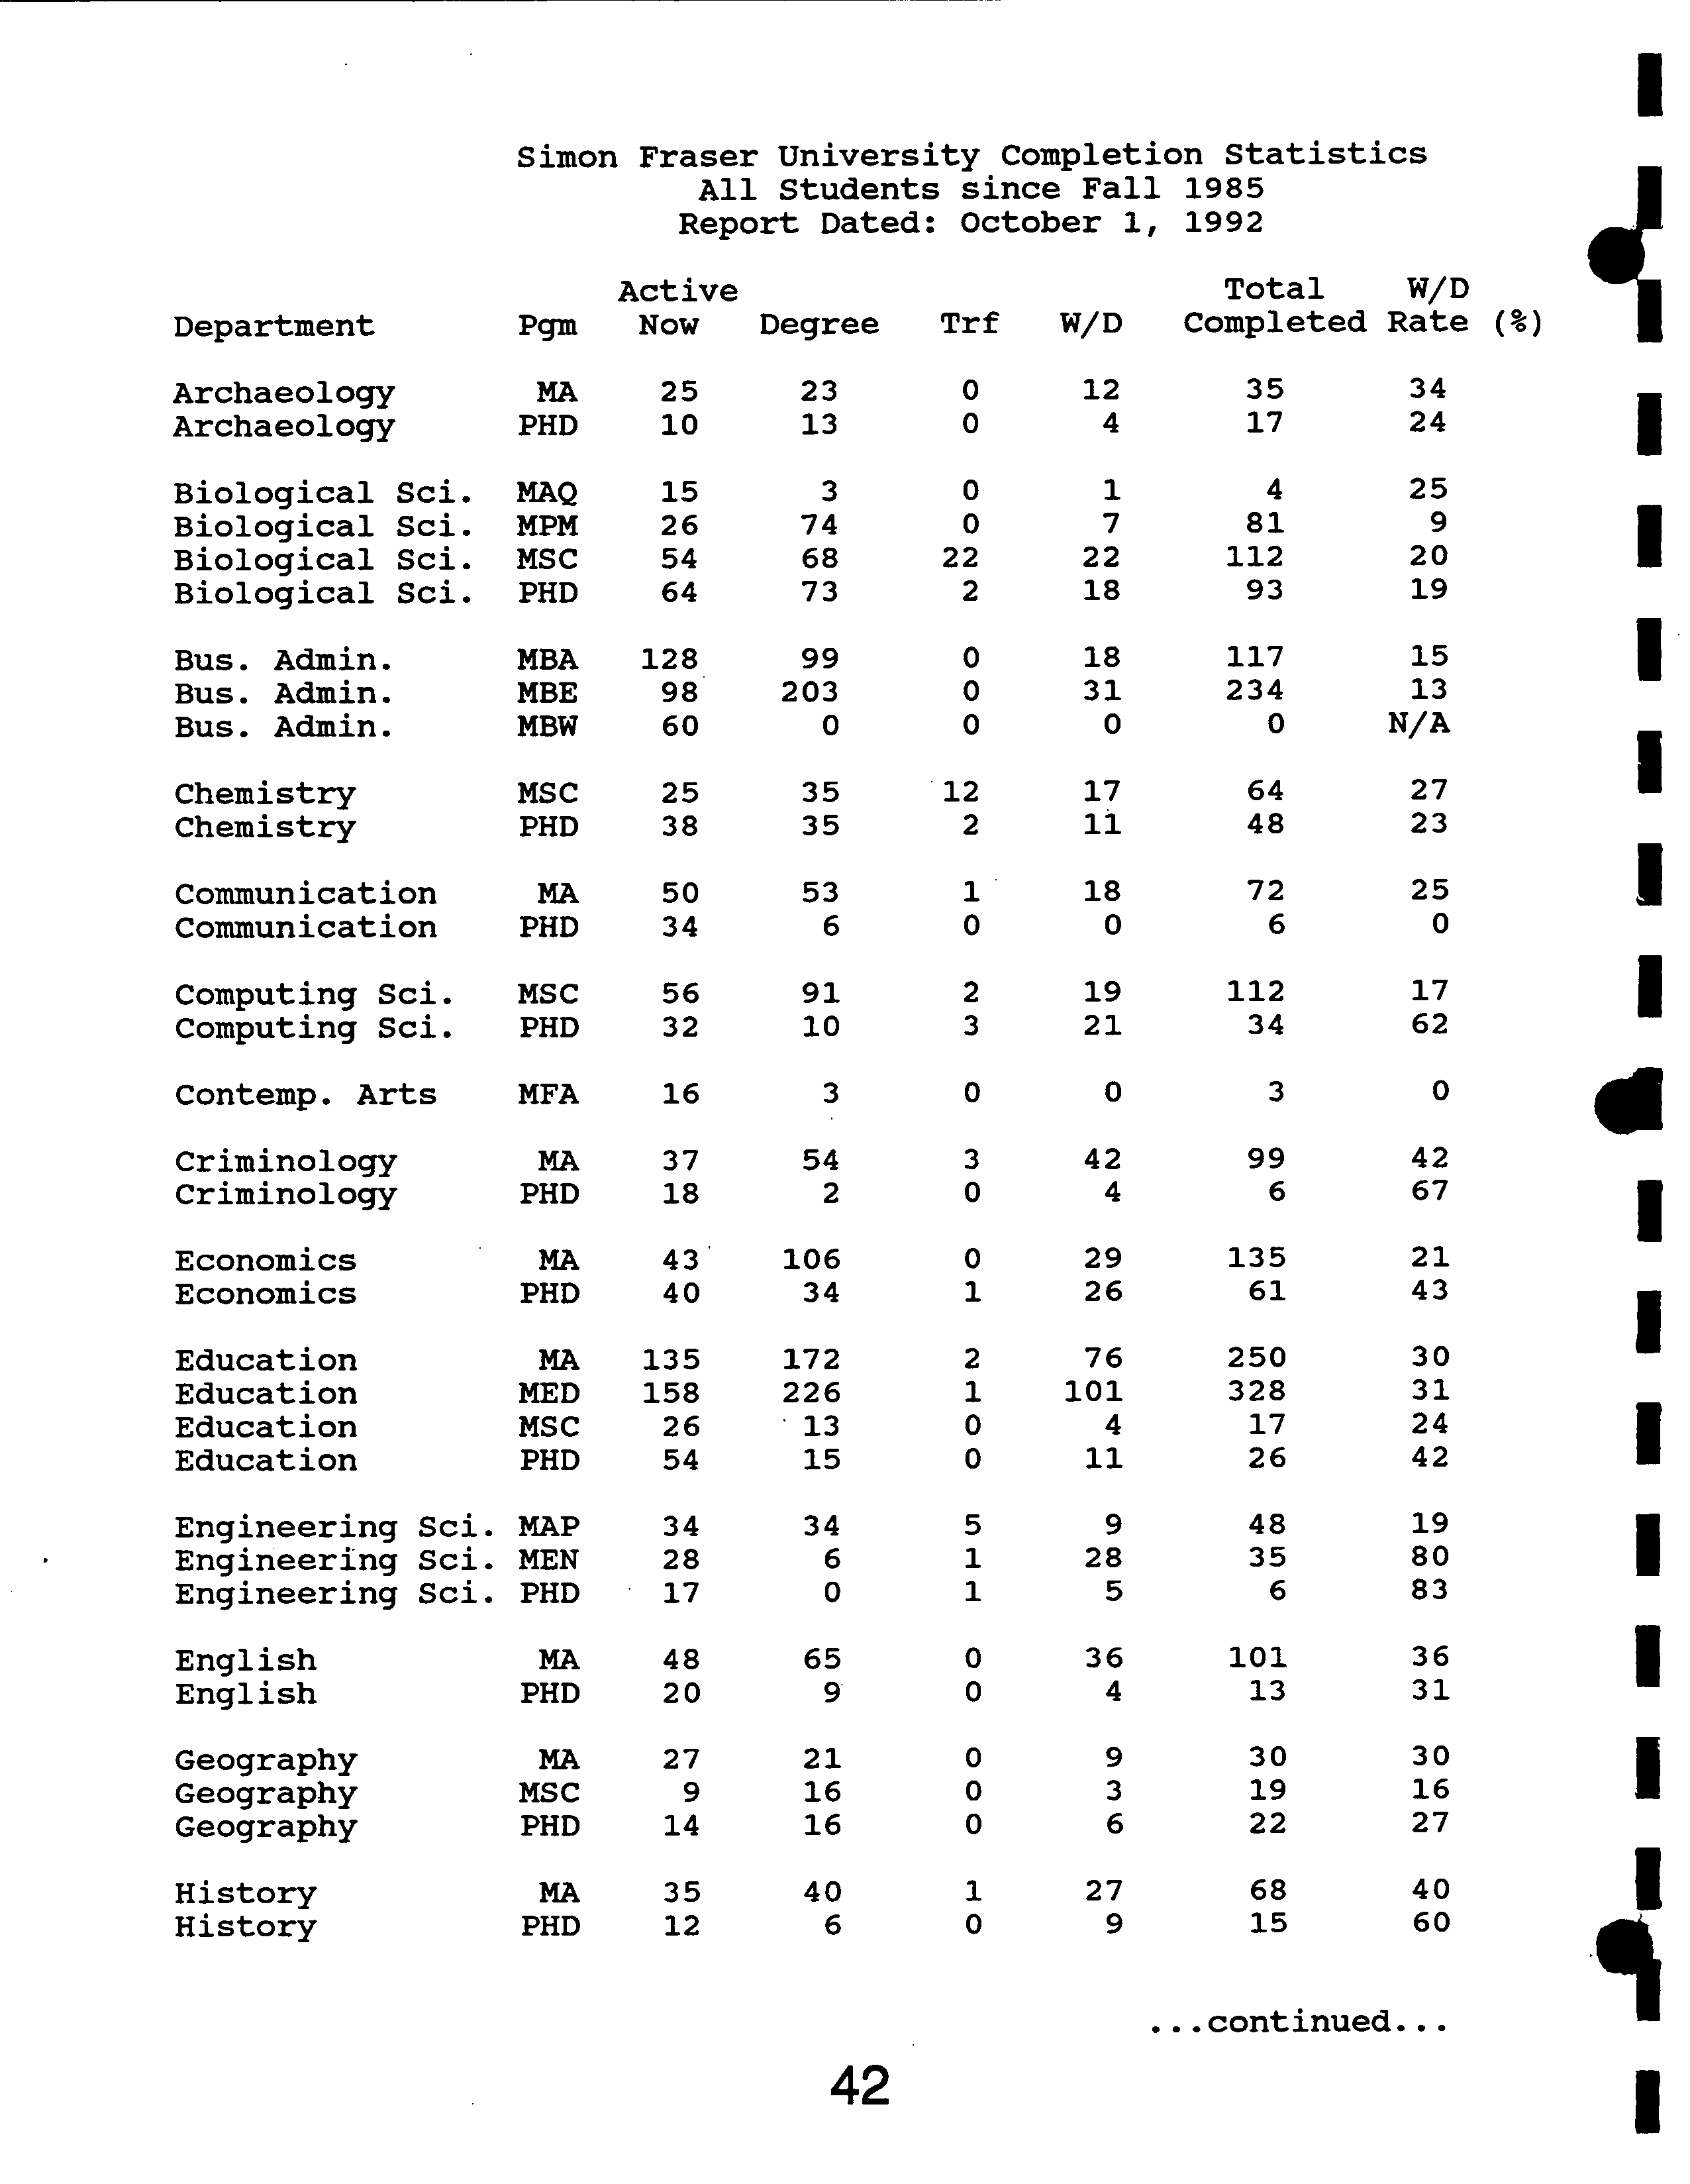
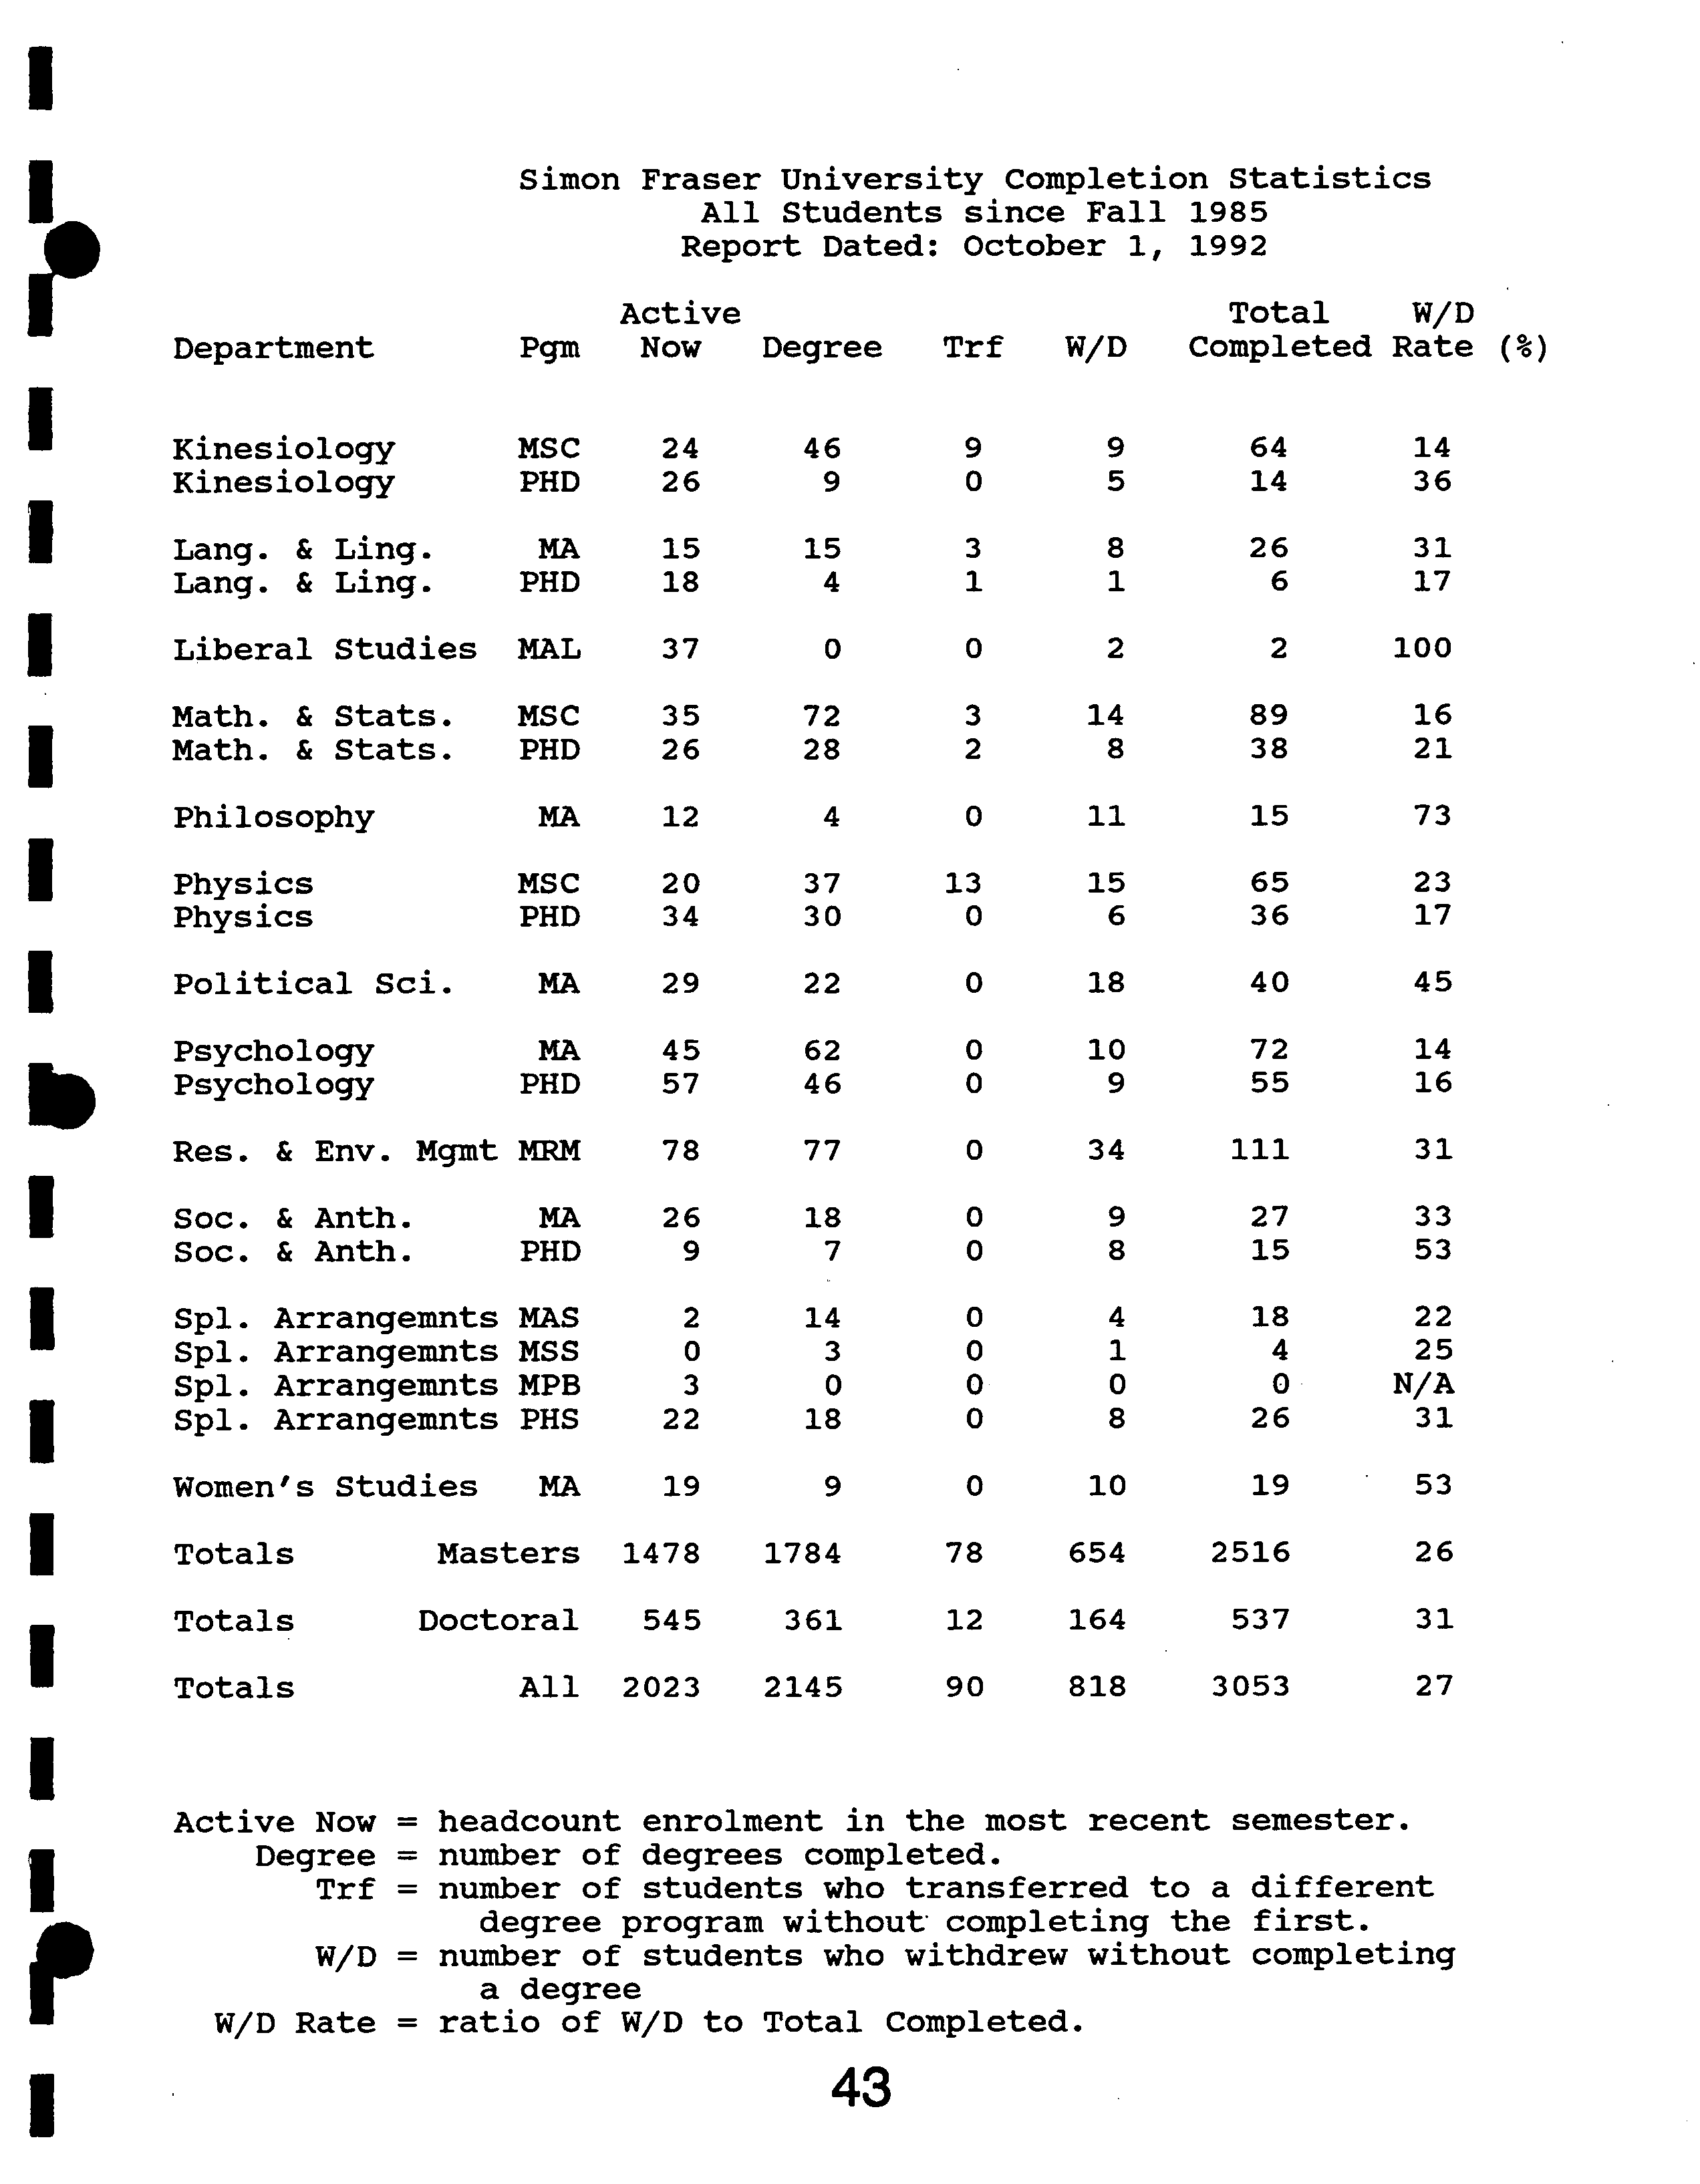
Withdrawal rates are presented, starting on page 39, in the Graduate Studies Fact Book. There
are tremendous variations in rates between programs. The overall rates for the University as a
whole are in line with the results of similar studies performed in the U.S. I know of no directly
comparable studies yet completed in Canada, although both the Canadian Association for
Graduate Studies (of which I am President) and the Western Canadian Deans of Graduate
Studies are proceeding with projects to compile these data, as well as degree completion time
data.
I am very concerned about the low completion rates in some of our graduate programs.
Withdrawal may be due to any one of or a combination of factors including: lack of ability, lack
of motivation, lack of financial resources, health problems, and deficiencies in the graduate
programs and/or their implementation. For the last several years, I assisted a Master's student in
Education, Ms. Marianne Yeatman, who, as her thesis research, performed a study of students
who withdrew from their graduate programs. The study had both statistical and anecdotal
components and made some interesting generalizations about the importance of the factors
outlined above. The thesis was successfully defended early last year and is available in the S.F.U.
Library. As of January 1, 1993, I have instituted an exit questionnaire to gather information about
many aspects of our graduate programs from students who successfully complete their degrees
and from those who withdraw. Because of the need for confidentiality, the results will be
analyzed only statistically, once enough students respond; it will thus be at least a year until
results will be available for most programs.
Meanwhile, I am continuing to press for improved funding for graduate financial aid. There had
been very substantial increases to the graduate scholarships budget in the previous two years.
Unfortunately, this year there was a significant reduction. I have argued strenuously to reverse
this action and provide increased support for graduate students. I am very pleased that the cur-
rent agreement with Teaching Support Staff Union increases the Teaching Assistant stipend and
reduces the workload. The latter factor will both allow students more time for their studies and
S.G.S.C. Report to Senate. Page 3
will create additional teaching assistant positions, allowing more graduate students to receive
appointments.
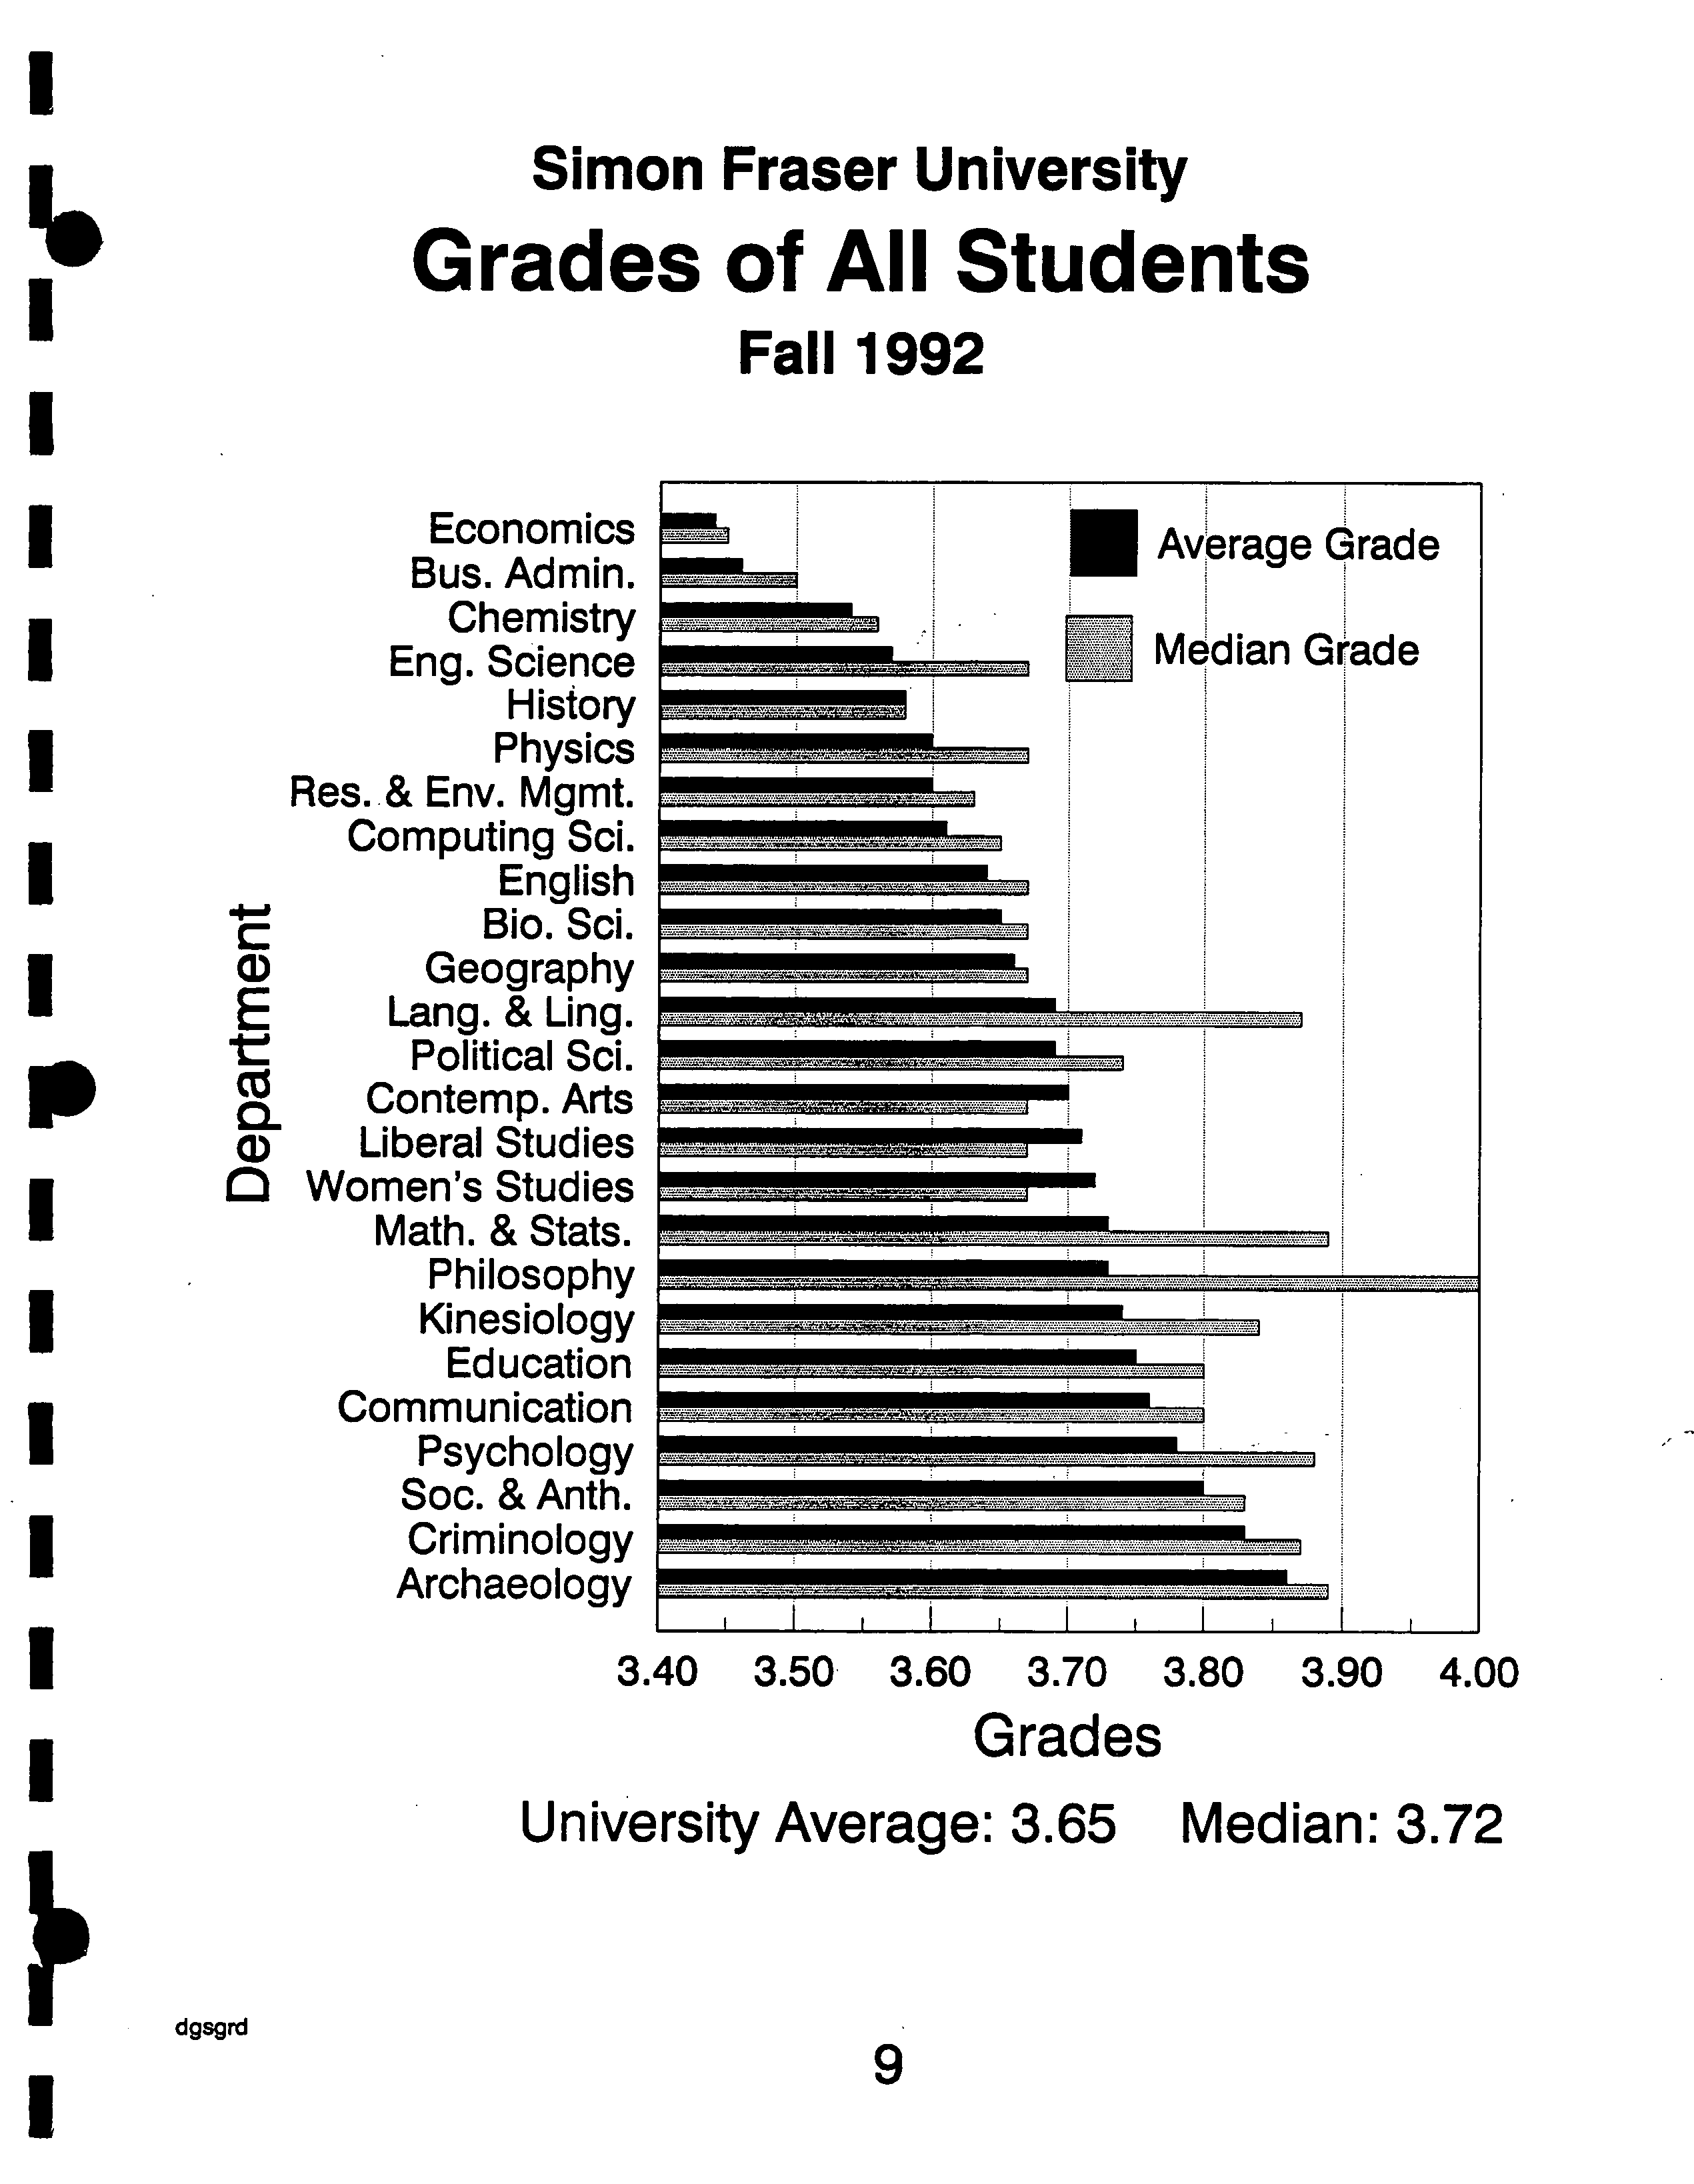
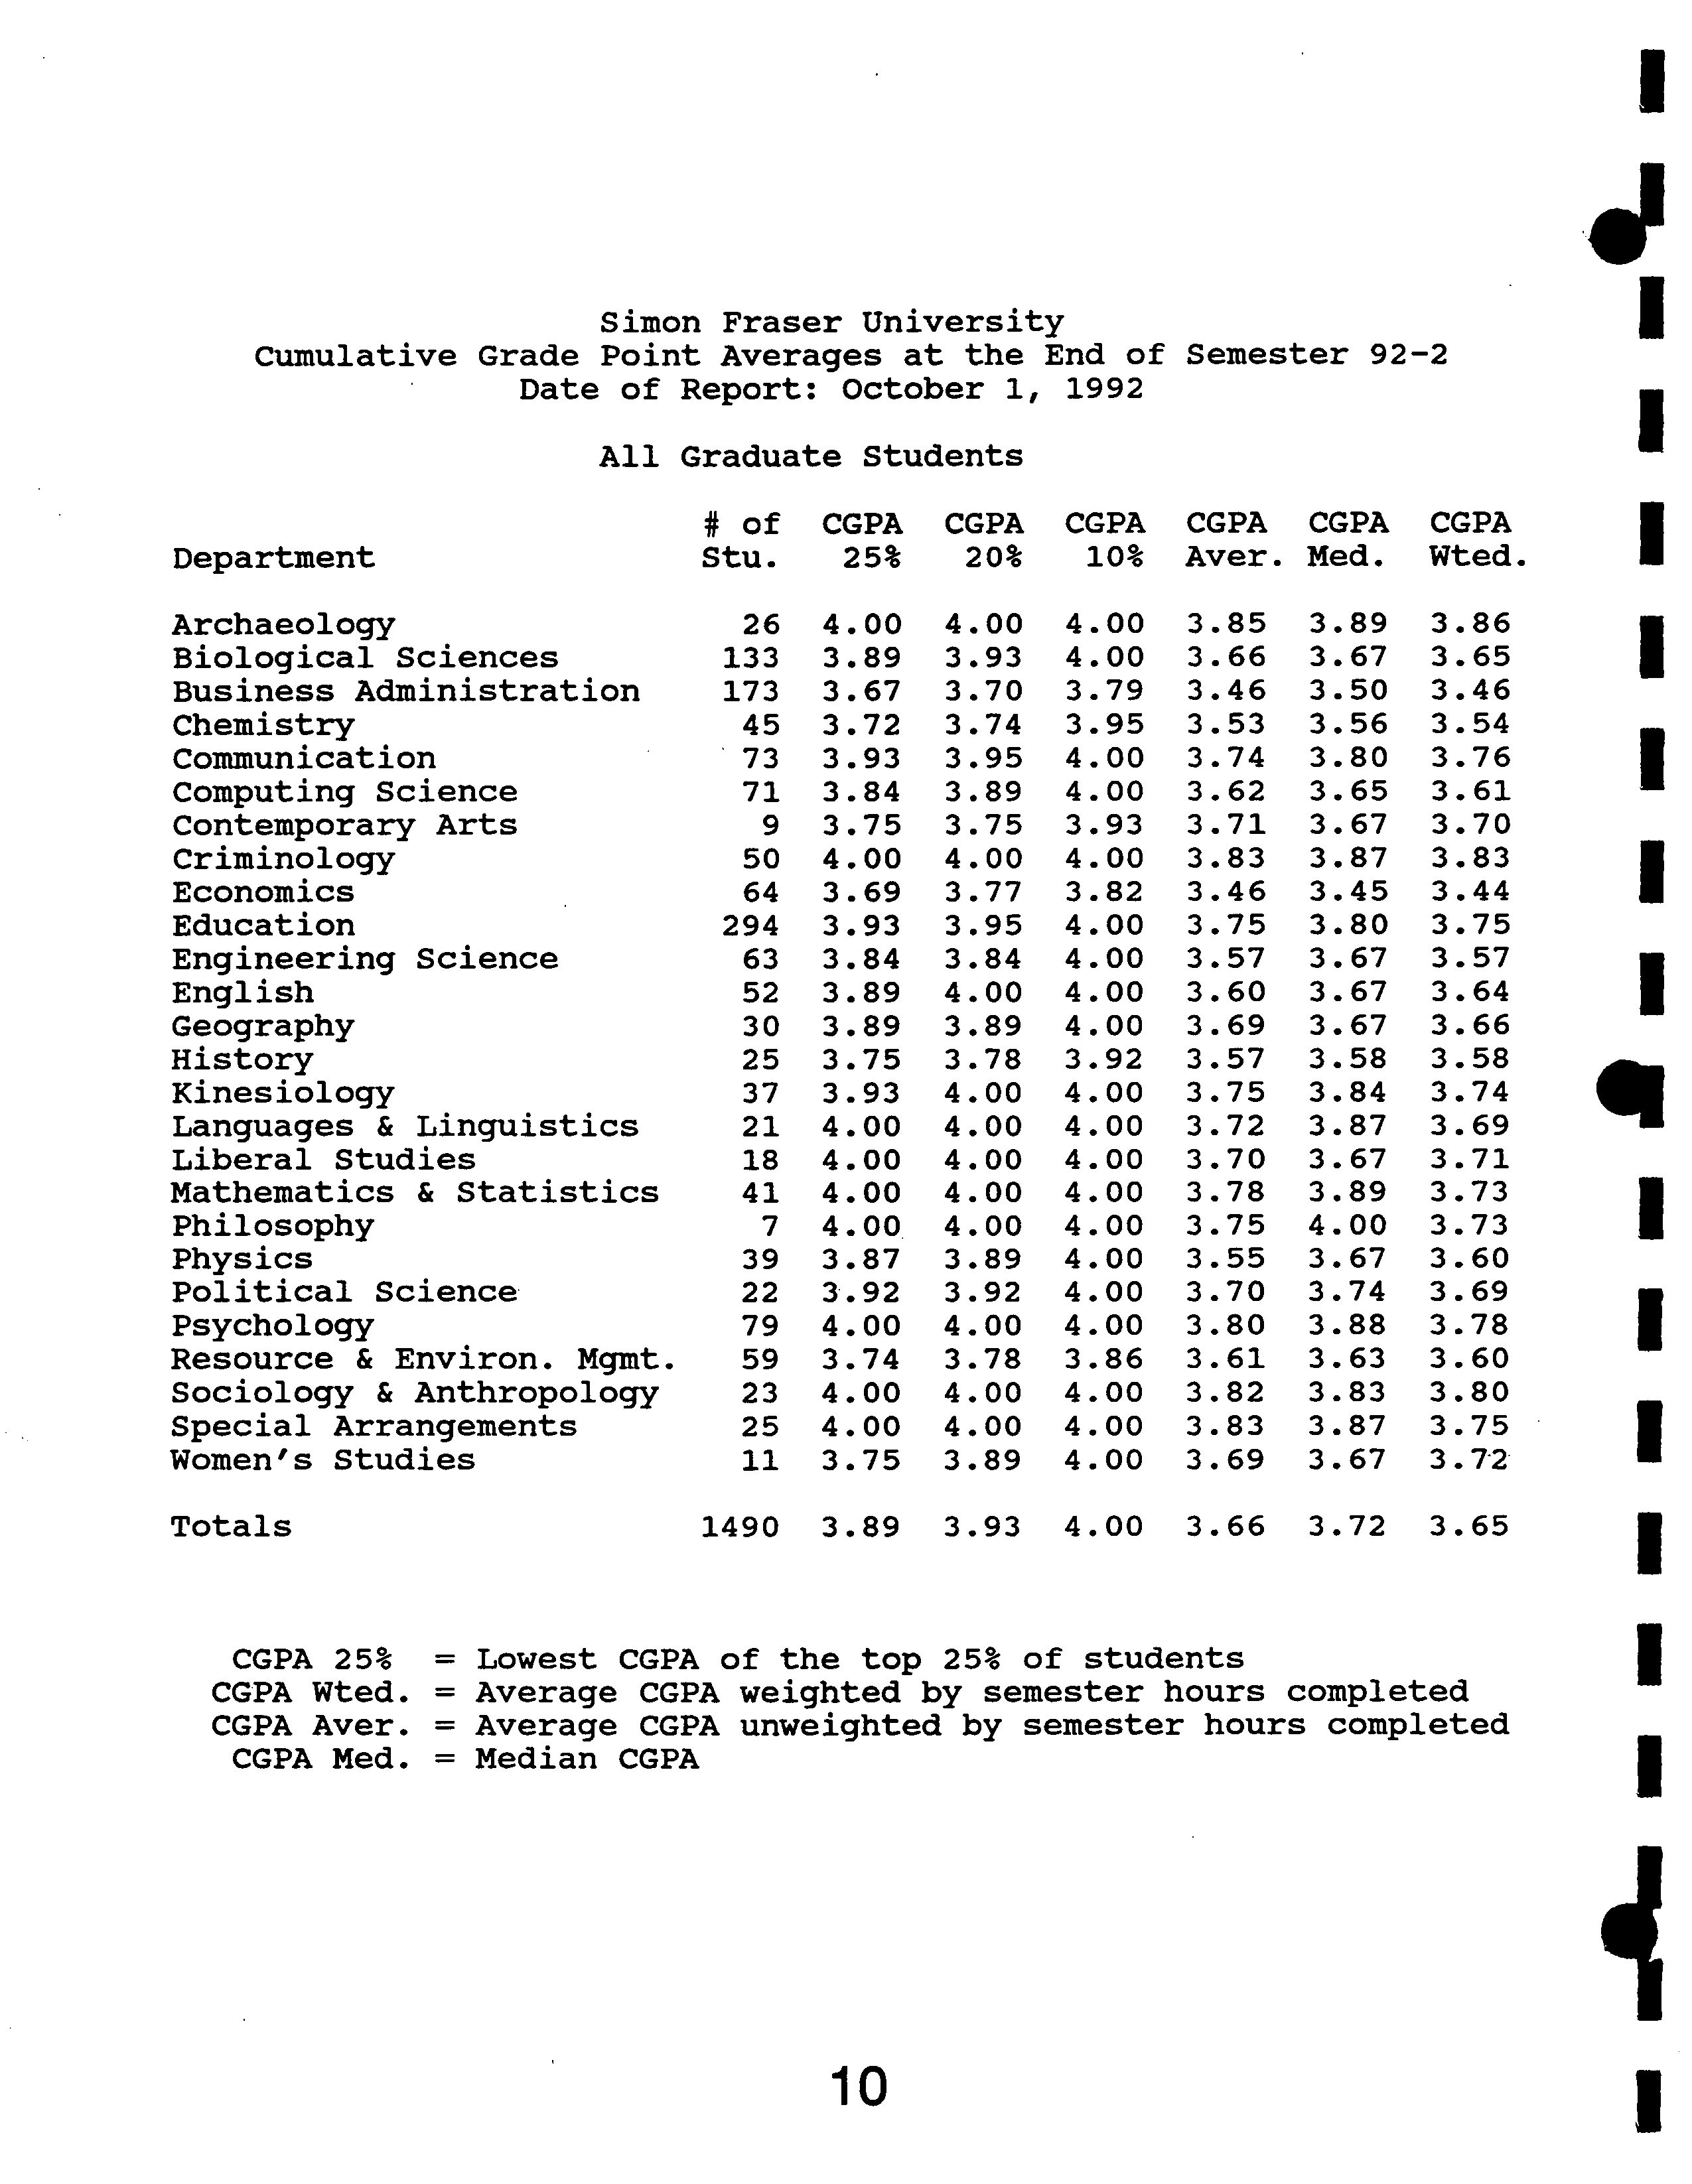
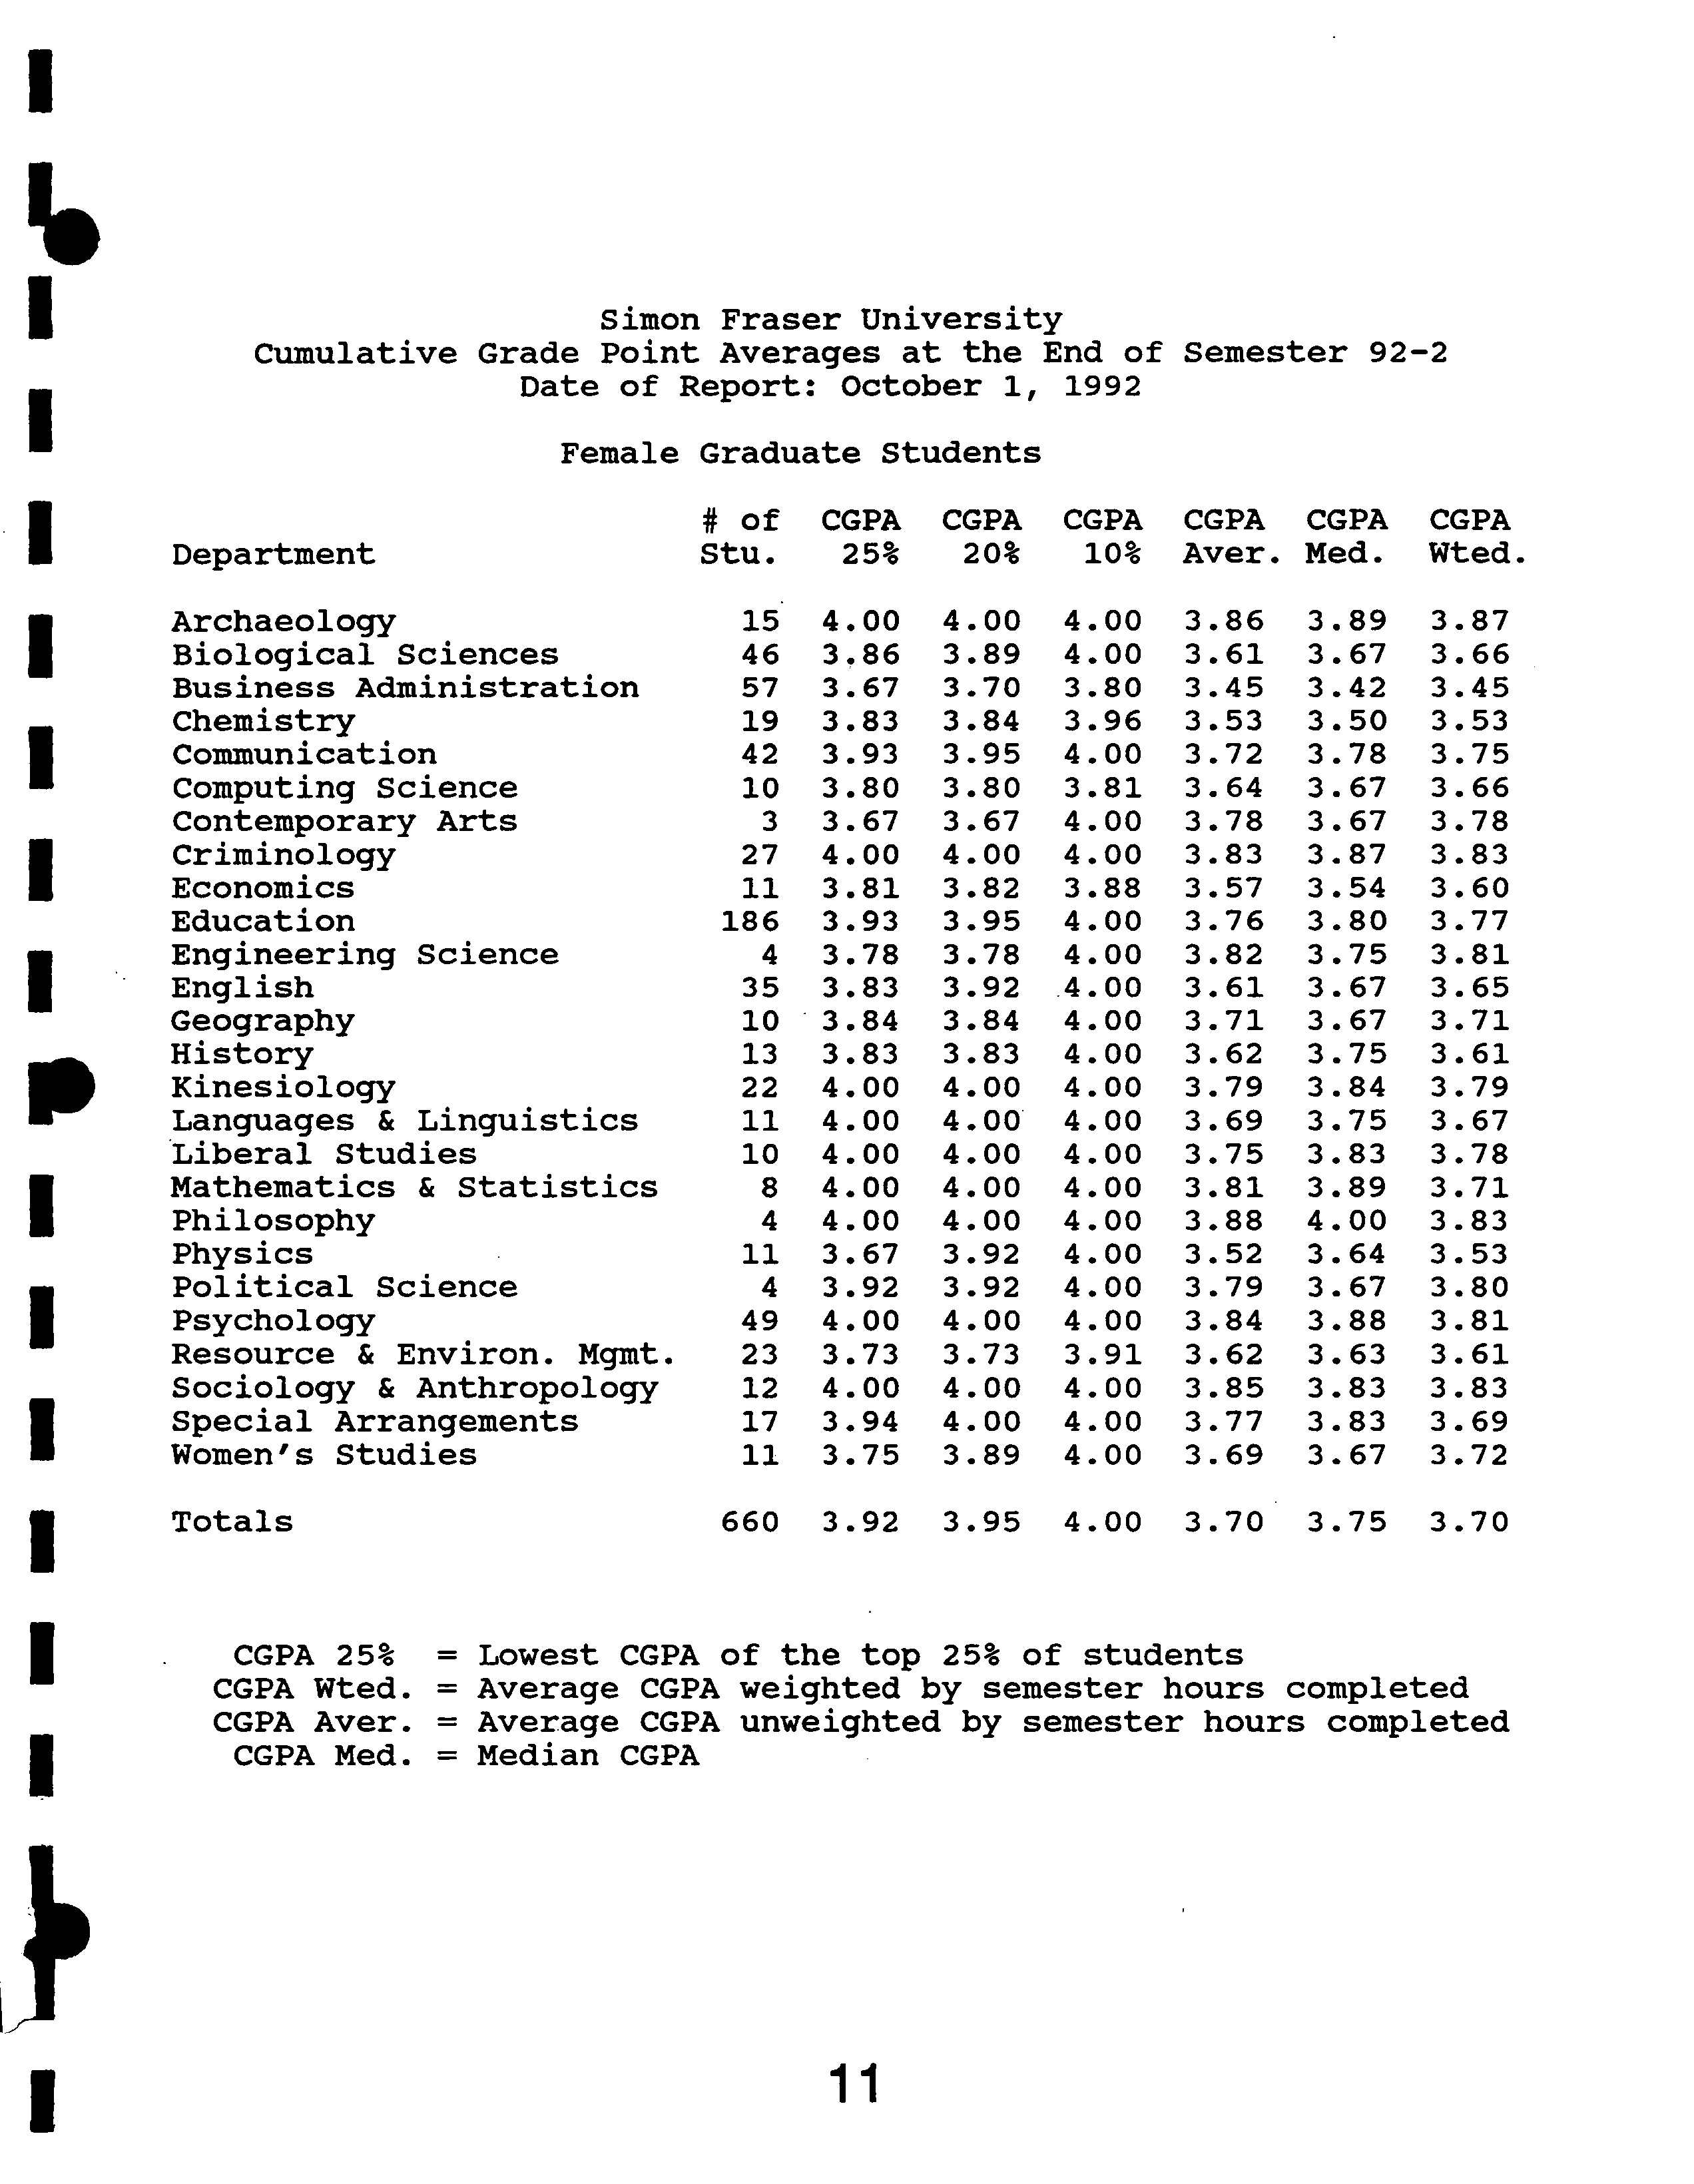
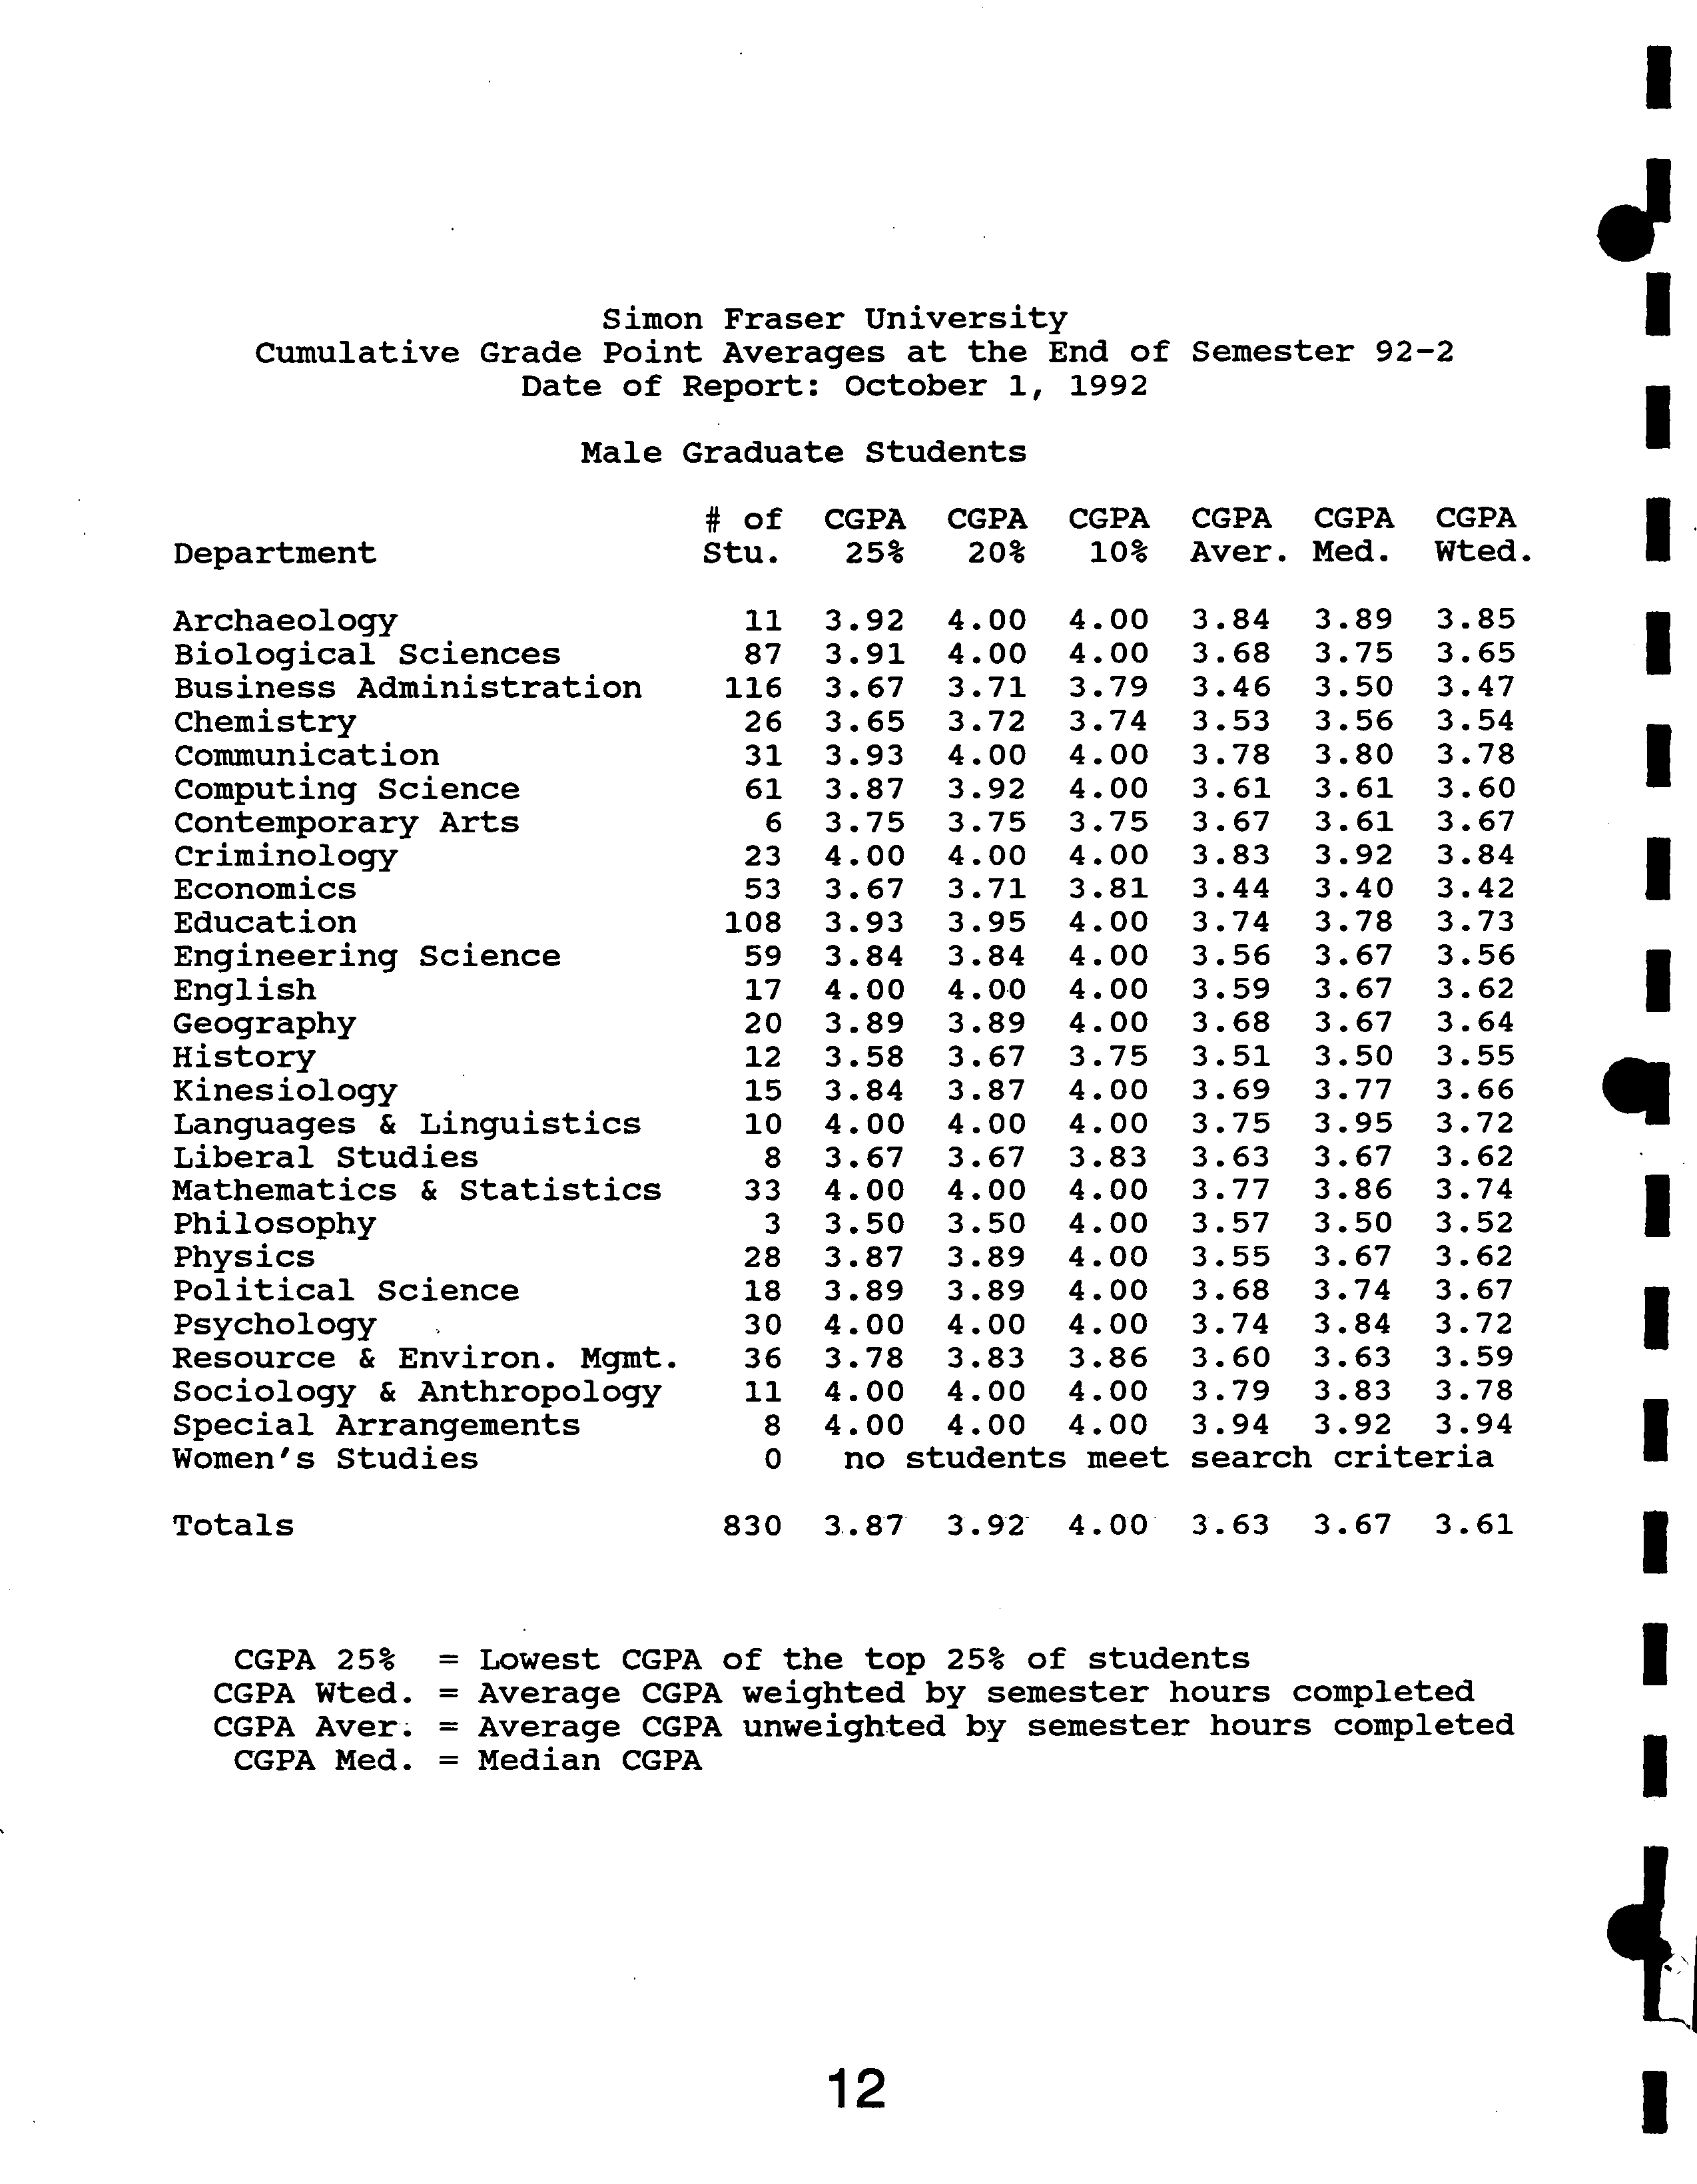
ifi. Grades
Page 9 of the Graduate Studies Fact Book gives information on the S.F.U. graduate grades of
the end of the Summer 1992 semester; it excludes students who had not yet taken an S.F.U.
graduate course. Data were taken from the Registrar's data files and incorporated into and
processed within the Graduate Studies Database system.
The tremendous range in the grade distributions among departments may stem from two causes:
(1) differences in grading practices and (2) differences in the abilities of students. I believe that,
most likely, it is a mixture of these with the former a larger contributor than the latter. This
range is one of the reasons that I have moved away from interdepartmental comparisons of
CGPA in the ranking of applicants for S.F.U. graduate scholarships.
IV.
Special Arrangements
The Senate Graduate Studies Committee serves as the Graduate Program Committee of students
enrolled under Special Arrangements. I have given special attention to these students. With the
• goal of ensuring their satisfactory progress, I have brought all their supervisory committees into
compliance with Senate's regulations and require up-to-date progress reports as a condition of
registration. The response of students and supervisors has been excellent.
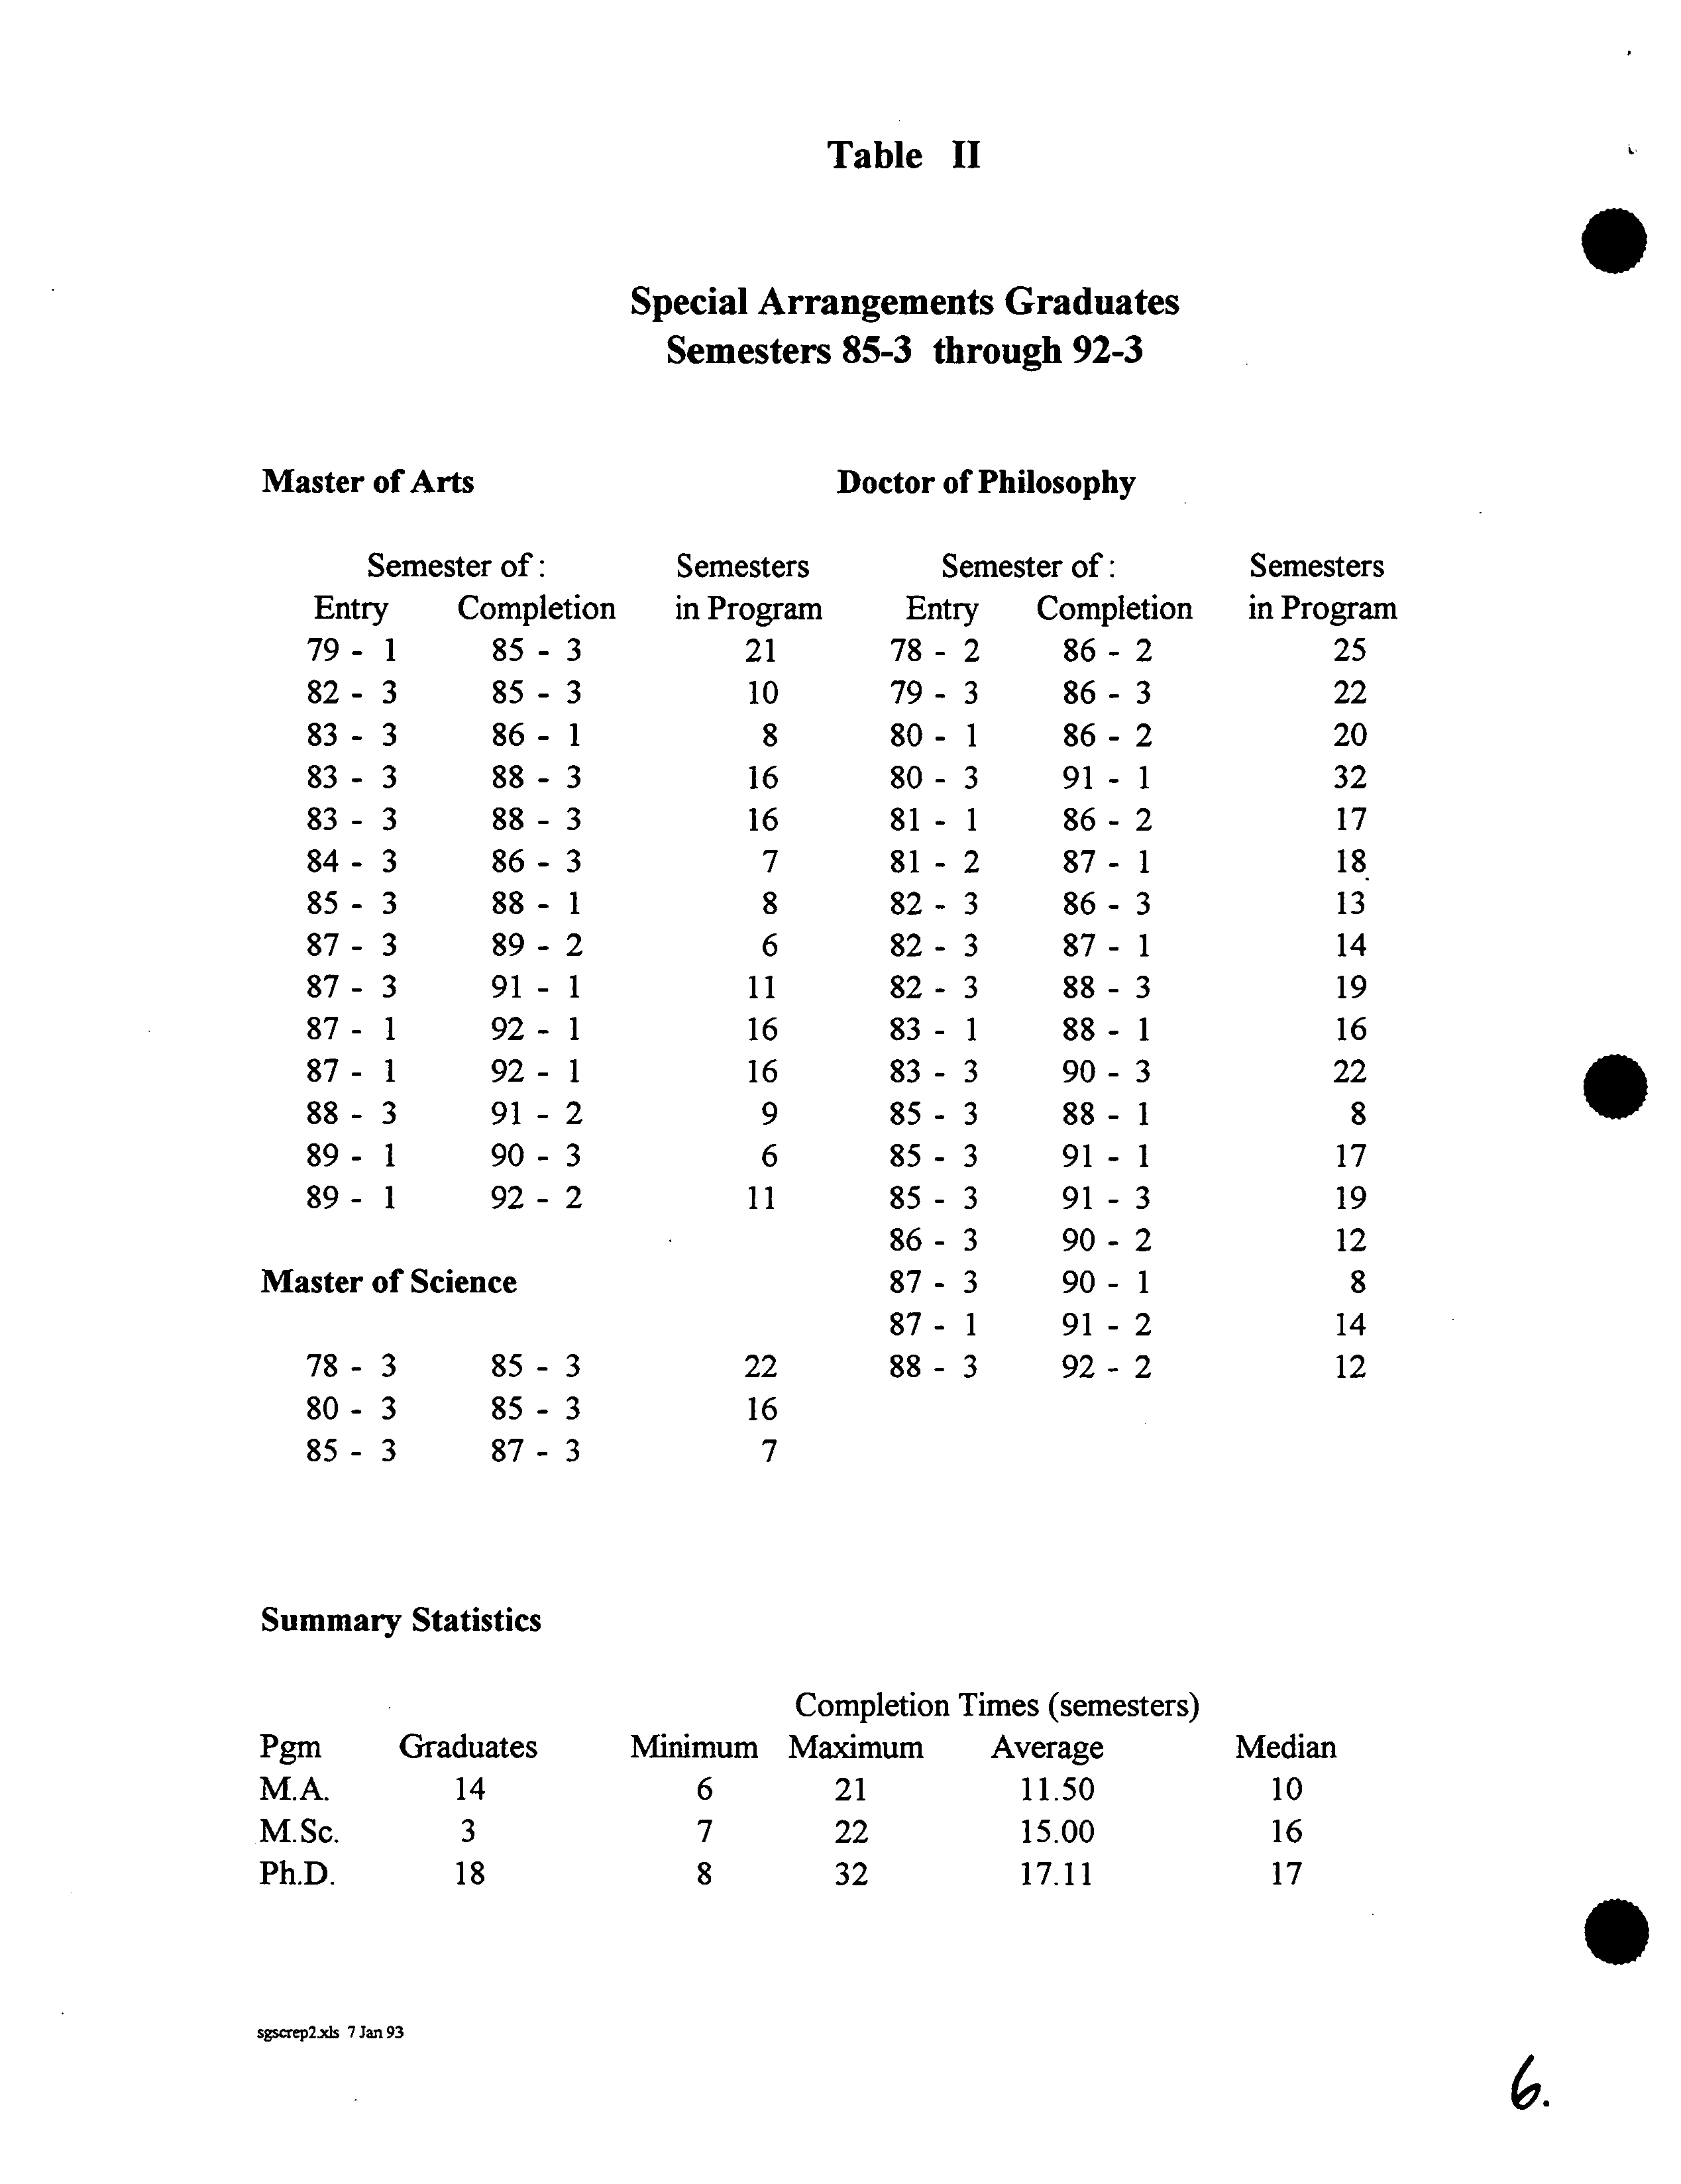
I am pleased to report that the defences of theses completed under Special Arrangements, which
I chair, have all been quite successful. Table II provides data on degree completion.
Historically, Special Arrangements have been a high risk area; students either succeed or fail
spectacularly. The number of students enrolled have remained roughly constant around 25.
Degree completion has been highly variable: 4 in 1992, 6 in 1991, 2 in 1990, 3 in 1989, 4 in
1988, 7 in 1987, 6 in 1986, 2 in
1985, 6
in 1984, 1 in 1983, 2 in 1982, and 4 in 1981. Some
other students have dropped out and others encountered health problems. By the steps outlined
above and by continued rigorous adherence to the criteria for entrance into Special
Arrangements, I hope to improve the success rate.
V. S.G.S.C. Motions
A summary, prepared by the Office of the Registrar, of the motions passed by the S.G.S.C. is
presented in Appendix B.
VI. The Future
I remain optimistic about the future of graduate studies at SFU. We have introduced a number
of new programs which are in the process of implementation. Several other exciting new
S.G.S.C. Report to Senate. Page 4
program initiatives are presently in the planning process; some of these have received approval
from the Senate Committee on Academic Planning approval to proceed with detailed planning.
Substantial growth in graduate programs is a component of the University's strategic plan. It
will be essential to ensure that sufficient resources are allocated to support this growth while
maintaining high quality.
The quality of our existing programs remains high and the quality of most of the thesis defences
which I have attended has been high. With rare exception, applicants recommended by
departments for entry into Ph.D. programs have been very strong. Through aggressive
recruiting of excellent applicants with the aid of entrance scholarships, rigorous enforcement of
the present requirements for satisfactory progress, improved financial aid and careful monitoring
of student supervision, it should be possible to improve further the quality of our graduate
programs, and to decrease degree completion times and withdrawal rates, thus making more
effective use of our resources.
?--) - .
('O\
B.P. Clayman
Dean of Graduate Studies
BPC:vb
Attachments
SENAT-93 .DOC 01/21/93
r
9
.
Table I
Annualized Graduate Enrolments
?
85/86 ?
86/87 ?
87/88 ?
88/89 ?
89/90 ?
90/91 ?
91/92
Head Count ?
1,377 ?
1,366 ?
1,426 ?
1,444 ?
1,486 ?
1,623 ?
1,864
FTh ?
1,125 ?
1,084 ?
1,147 ?
1,169 ?
1,256 ?
1,404 ?
1,593
?
2,000 ?
: Head Count
El
FTE
1,800
?
1,600 ?
-
?
1,400 ?
P ?
-
?
1,200 ?
-
?
1,000 ?
I
?
800 ?
I
600
400
200
0
85/86 86/87 87/88 88/89 89/90 90/91 91/92
Academic Year
Degrees Awarded
?
85/86 ?
86/87 ?
87/88 ?
88/89 ?
89/90 ?
90/91 ?
91/92
?
Master's
?
279 ?
214 ?
213 ?
253 ?
245 ?
219 ?
285
?
Doctoral
?
39 ?
42 ?
50 ?
45 ?
50 ?
49
?
64
sgscrepl.x1s 7 Jan 93
Semesters
in Program
25
22
20
32
17
18
13
14
19
16
22
8
17
19
12
8
14
12
.
Table II
Special Arrangements Graduates
?
Semesters 85-3 through 92-3
.
Semesters
in Program
21
10
8
16
16
7
8
6
11
16
16
9
6
11
78-3
85-3
22
80-3
85-3
16
85-3
87-3
7
Master of Arts
Semester of:
Entry
Completion
79-1
85-3
82-3
85-3
83-3
86-1
83-3
88-3
83-3
88-3
84-3
86-3
85-3
88-1
87-3
89-2
87-3
91-1
87-1
92-1
87-1
92-1
88-3
91-2
89-1
90-3
89-1
92-2
Master of Science
Doctor of Philosophy
Semester of:
Entry
Completion
78-2
86-2
79-3
86-3
80-1
86-2
80-3
91-1
81-1
86-2
81-2
87-1
82-3
86-3
82-3
87-1
82-3
88-3
83-1
88-1
83-3
90-3
85-3
88-1
85-3
91-1
85-3
91-3
86-3
90-2
87-3
90-1
87-1
91-2
88-3
92-2
Summary Statistics
Completion Times (semesters)
Pgm
Graduates
Minimum
Maximum ?
Average
Median
M.A.
14
6
21 ?
11.50
10
M.Sc.
3
7
22 ?
15.00
16
Ph.D.
18
8
32 ?
17.11
17
.
sgscrep2ds 7 Jan 93
'7.
APPENDIX A
L
?
Report to Senate of the Graduate Programs approved for Part-time Study by the Senate
Graduate Studies Committee.
Archaeology
Biological Sciences
Business Administration
Communication
Economics
Education
Engineering Science
English
Liberal Studies
Mathematics and Statistics
Political Science
Resource and Environmental Management
Special Arrangements
Women's Studies
M.A., Ph.D.
M.P.M., M.Aq.
Executive MBA
MA., Ph.D.
M.A., Ph.D.
M.A., M.Sc., M.Ed.
M.Eng.
MA, Ph.D.
M.A.
M.Sc., Ph.D.
M.A.
M.R.M.
Masters, Ph.D.
M.A.
.
.
1.
APPENDIX B
El
Report to Senate of the Activities of the Senate Graduate Studies
Commitee from January 1992 to December 1992.
Number of Meetings - 3
1.
A sub-committee of the Senate Graduate Studies Committee was
established to consider a graduate student appeal. The appeal
was denied.
2.
A proposed Master of Arts Program in Latin American Studies was
approved.
3.
A Task Force on Guidelines for the Supervision of Graduate
Students was established. The membership was made up of
faculty and two graduate students; one graduate student from
the TSSU. The Task Force will also look at the faculty/graduat
student relations more generally.
4.
Graduate Curriculum Changes in the Departments of Psychology,
Contemporary Arts, English, Linguistics, Economics, History,
Political Science, Business, Education, Aquaculture, Chemistry,
Mathematics and Statistics and the School of Resource and
Environmental Management.
5.
New Graduate Courses in Education, Kinesiology and Business.
6.
A Co-op Education Program in Mathematics and Statistics was
approved.
I
ii
I
I
I
I
?
SIMON FRASER UNIVERSITY
I
I
I ?
Graduate Studies Fact Book
p
I
I
I
I
I
?
?
Office of the Dean
January
of
1993
Graduate Studies
Simon Fraser University
I ?
Burnaby, British Columbia
V5A 1S6
1
I
I
I.
Simon Fraser University
I ?
Graduate Studies Fact Book
I
The Graduate Studies Fact Book provides a snap-shot of the Fall
I
Semester
student population, as well as retrospective data on
program completion. The information is derived from enrolment
I
data provided by the Office of the Registrar, supplemented by
information gathered and processed in this office. It is
I
Office
largely complementary to the S.F.U. Fact Book prepared by the
of Analytical Studies. Minor differences in enrolment
figures exist between the two publications due to differences
in the data collection interval.
I
Each section is headed by a graphical summary. In some cases,
the summaries omit programs where the numbers reported are too
small to be significant; the tabular data are complete.
It is hoped that this Fact Book will be a useful source of
I
information
for the campus community. This office can provide
additional more specialized reports, if these are required.
I
I
I
?
Bruce P. Clayman
Dean of Graduate Studies
Room A06046
Phone: (604) 291-4255
Fax: (604) 291-3080
Email: clayman@sfu.ca
I
I
I
6
?
Simon Fraser University
I ?
Graduate Studies Fact Book
I
I
I
I
P
I
?
GradesCitizenshipEnrolment
Contents
13
9
2
Age
21
I
I
Degree
Degree
Completion
Completion
TimeRate
26
31
Program Completion
39
I
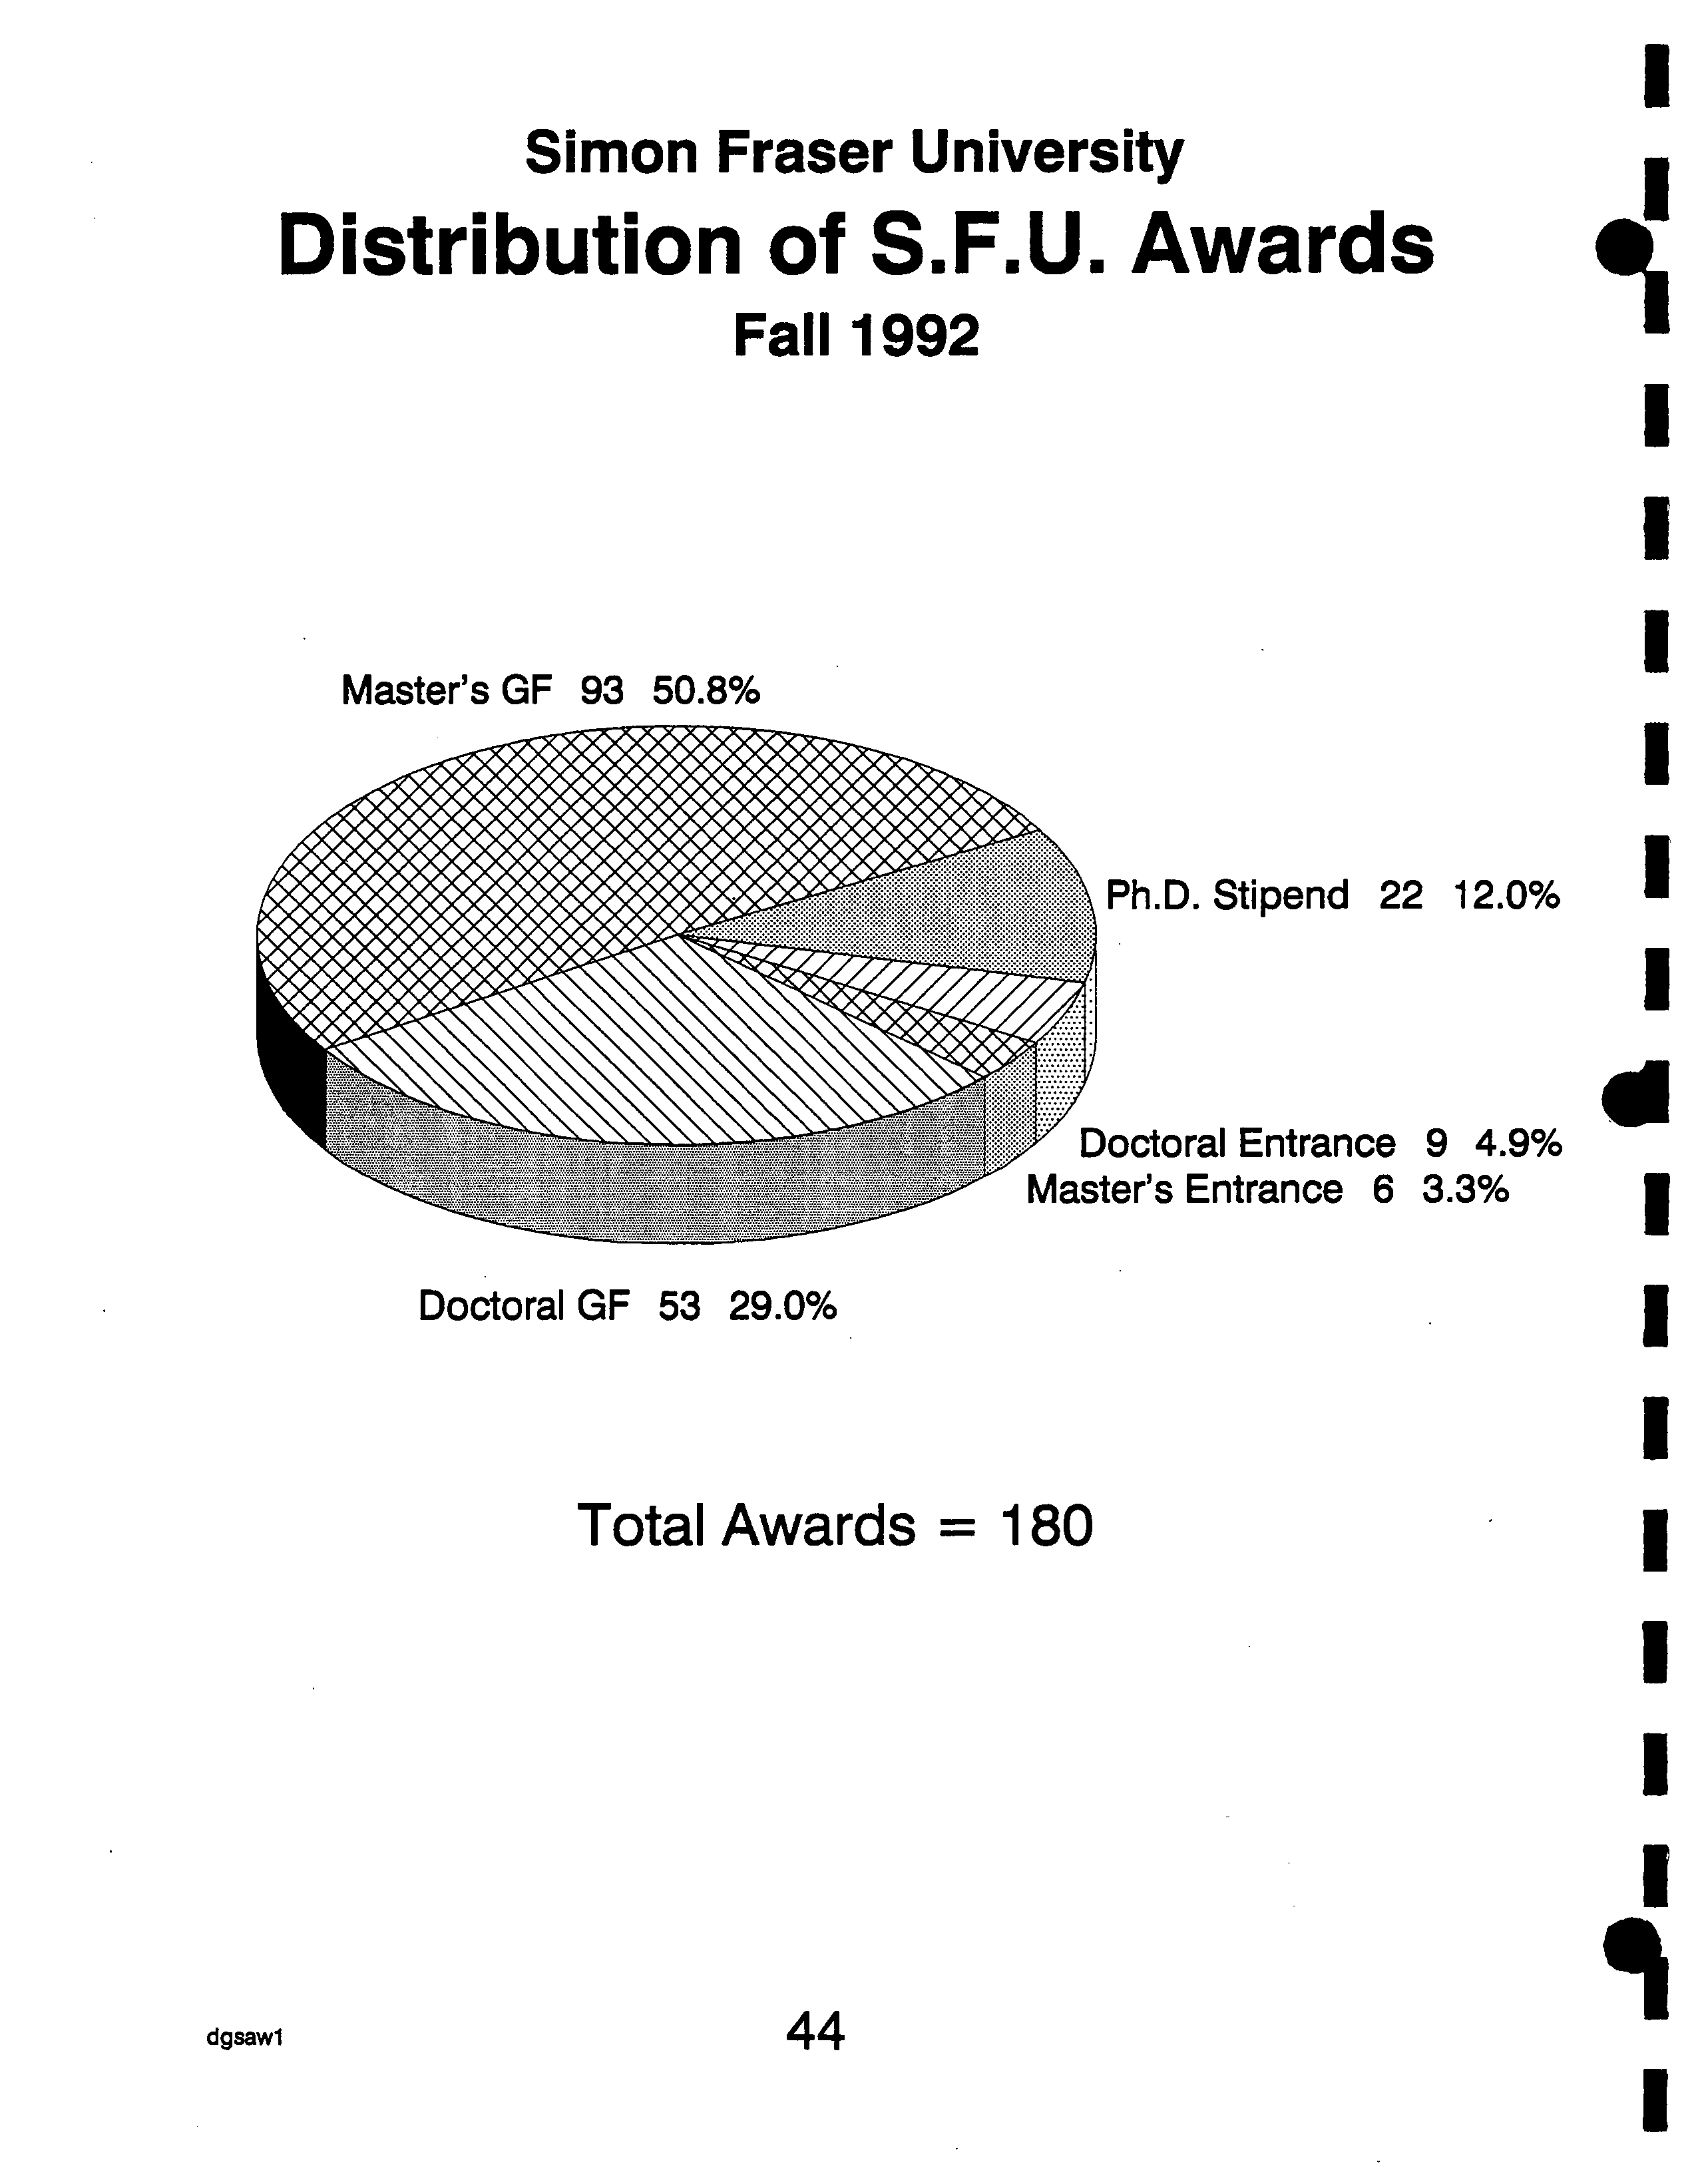
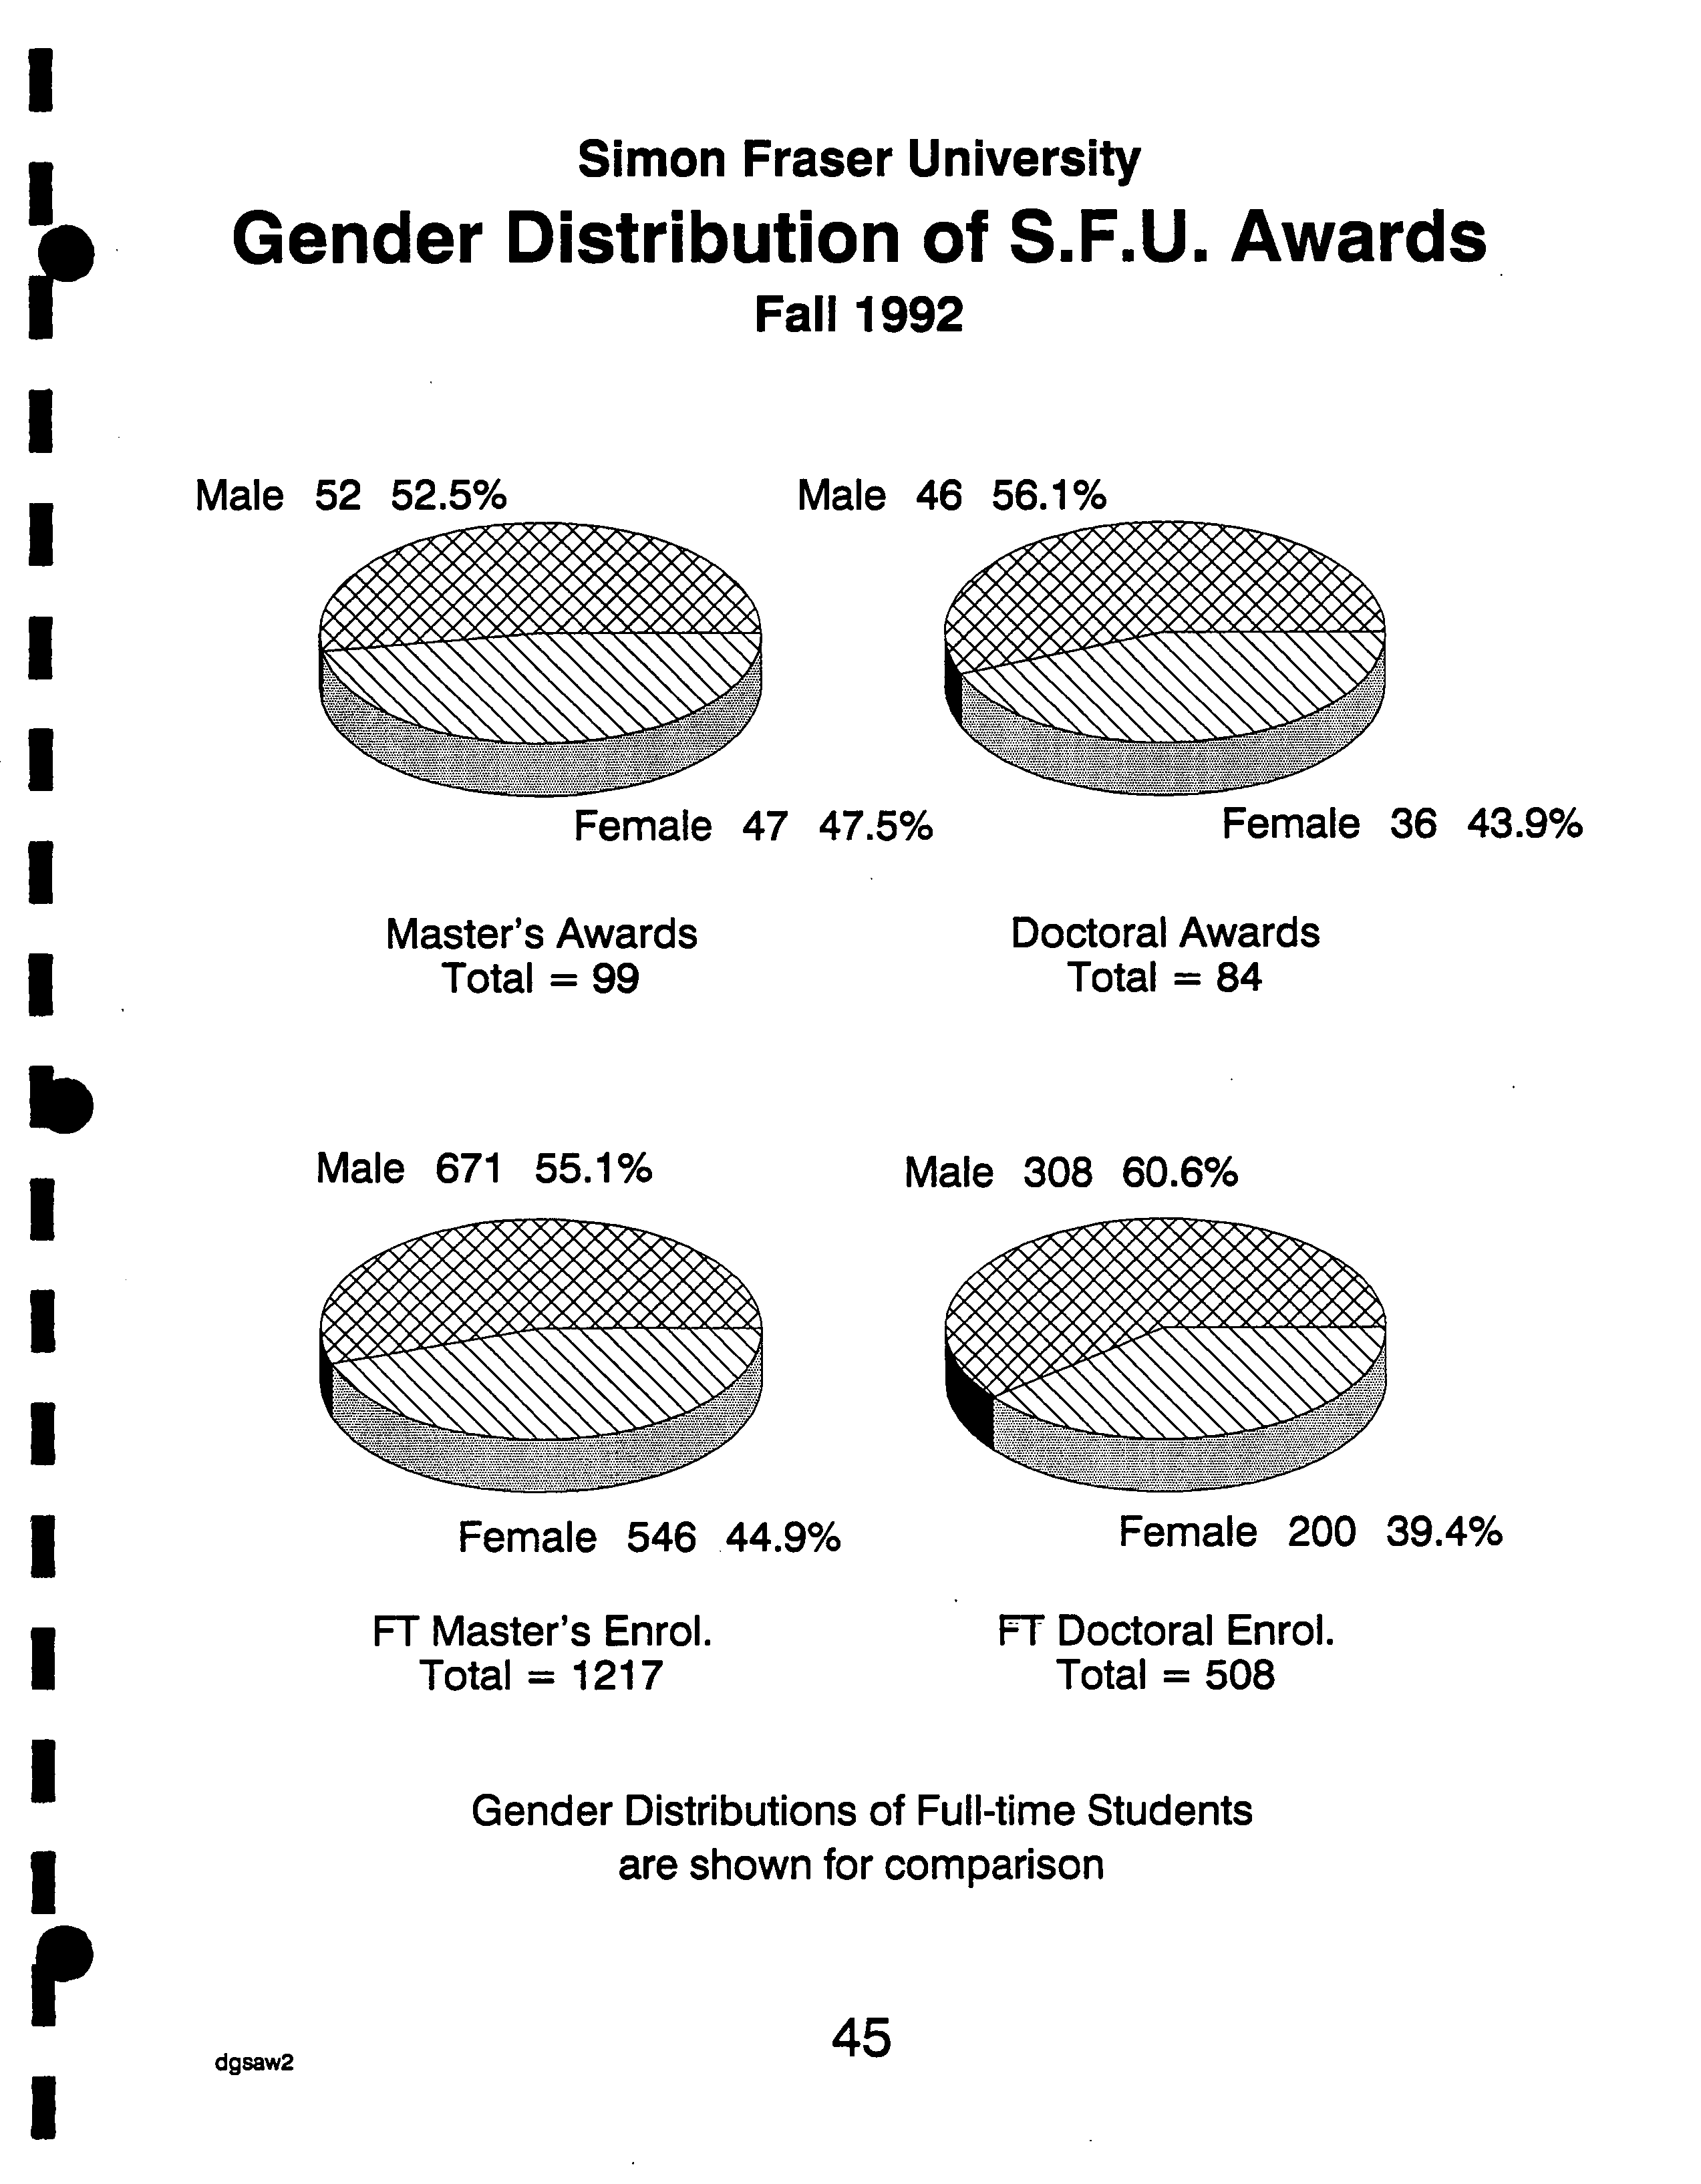
S.F.U. Financial Awards
44
I
I
Contents.drw
I,
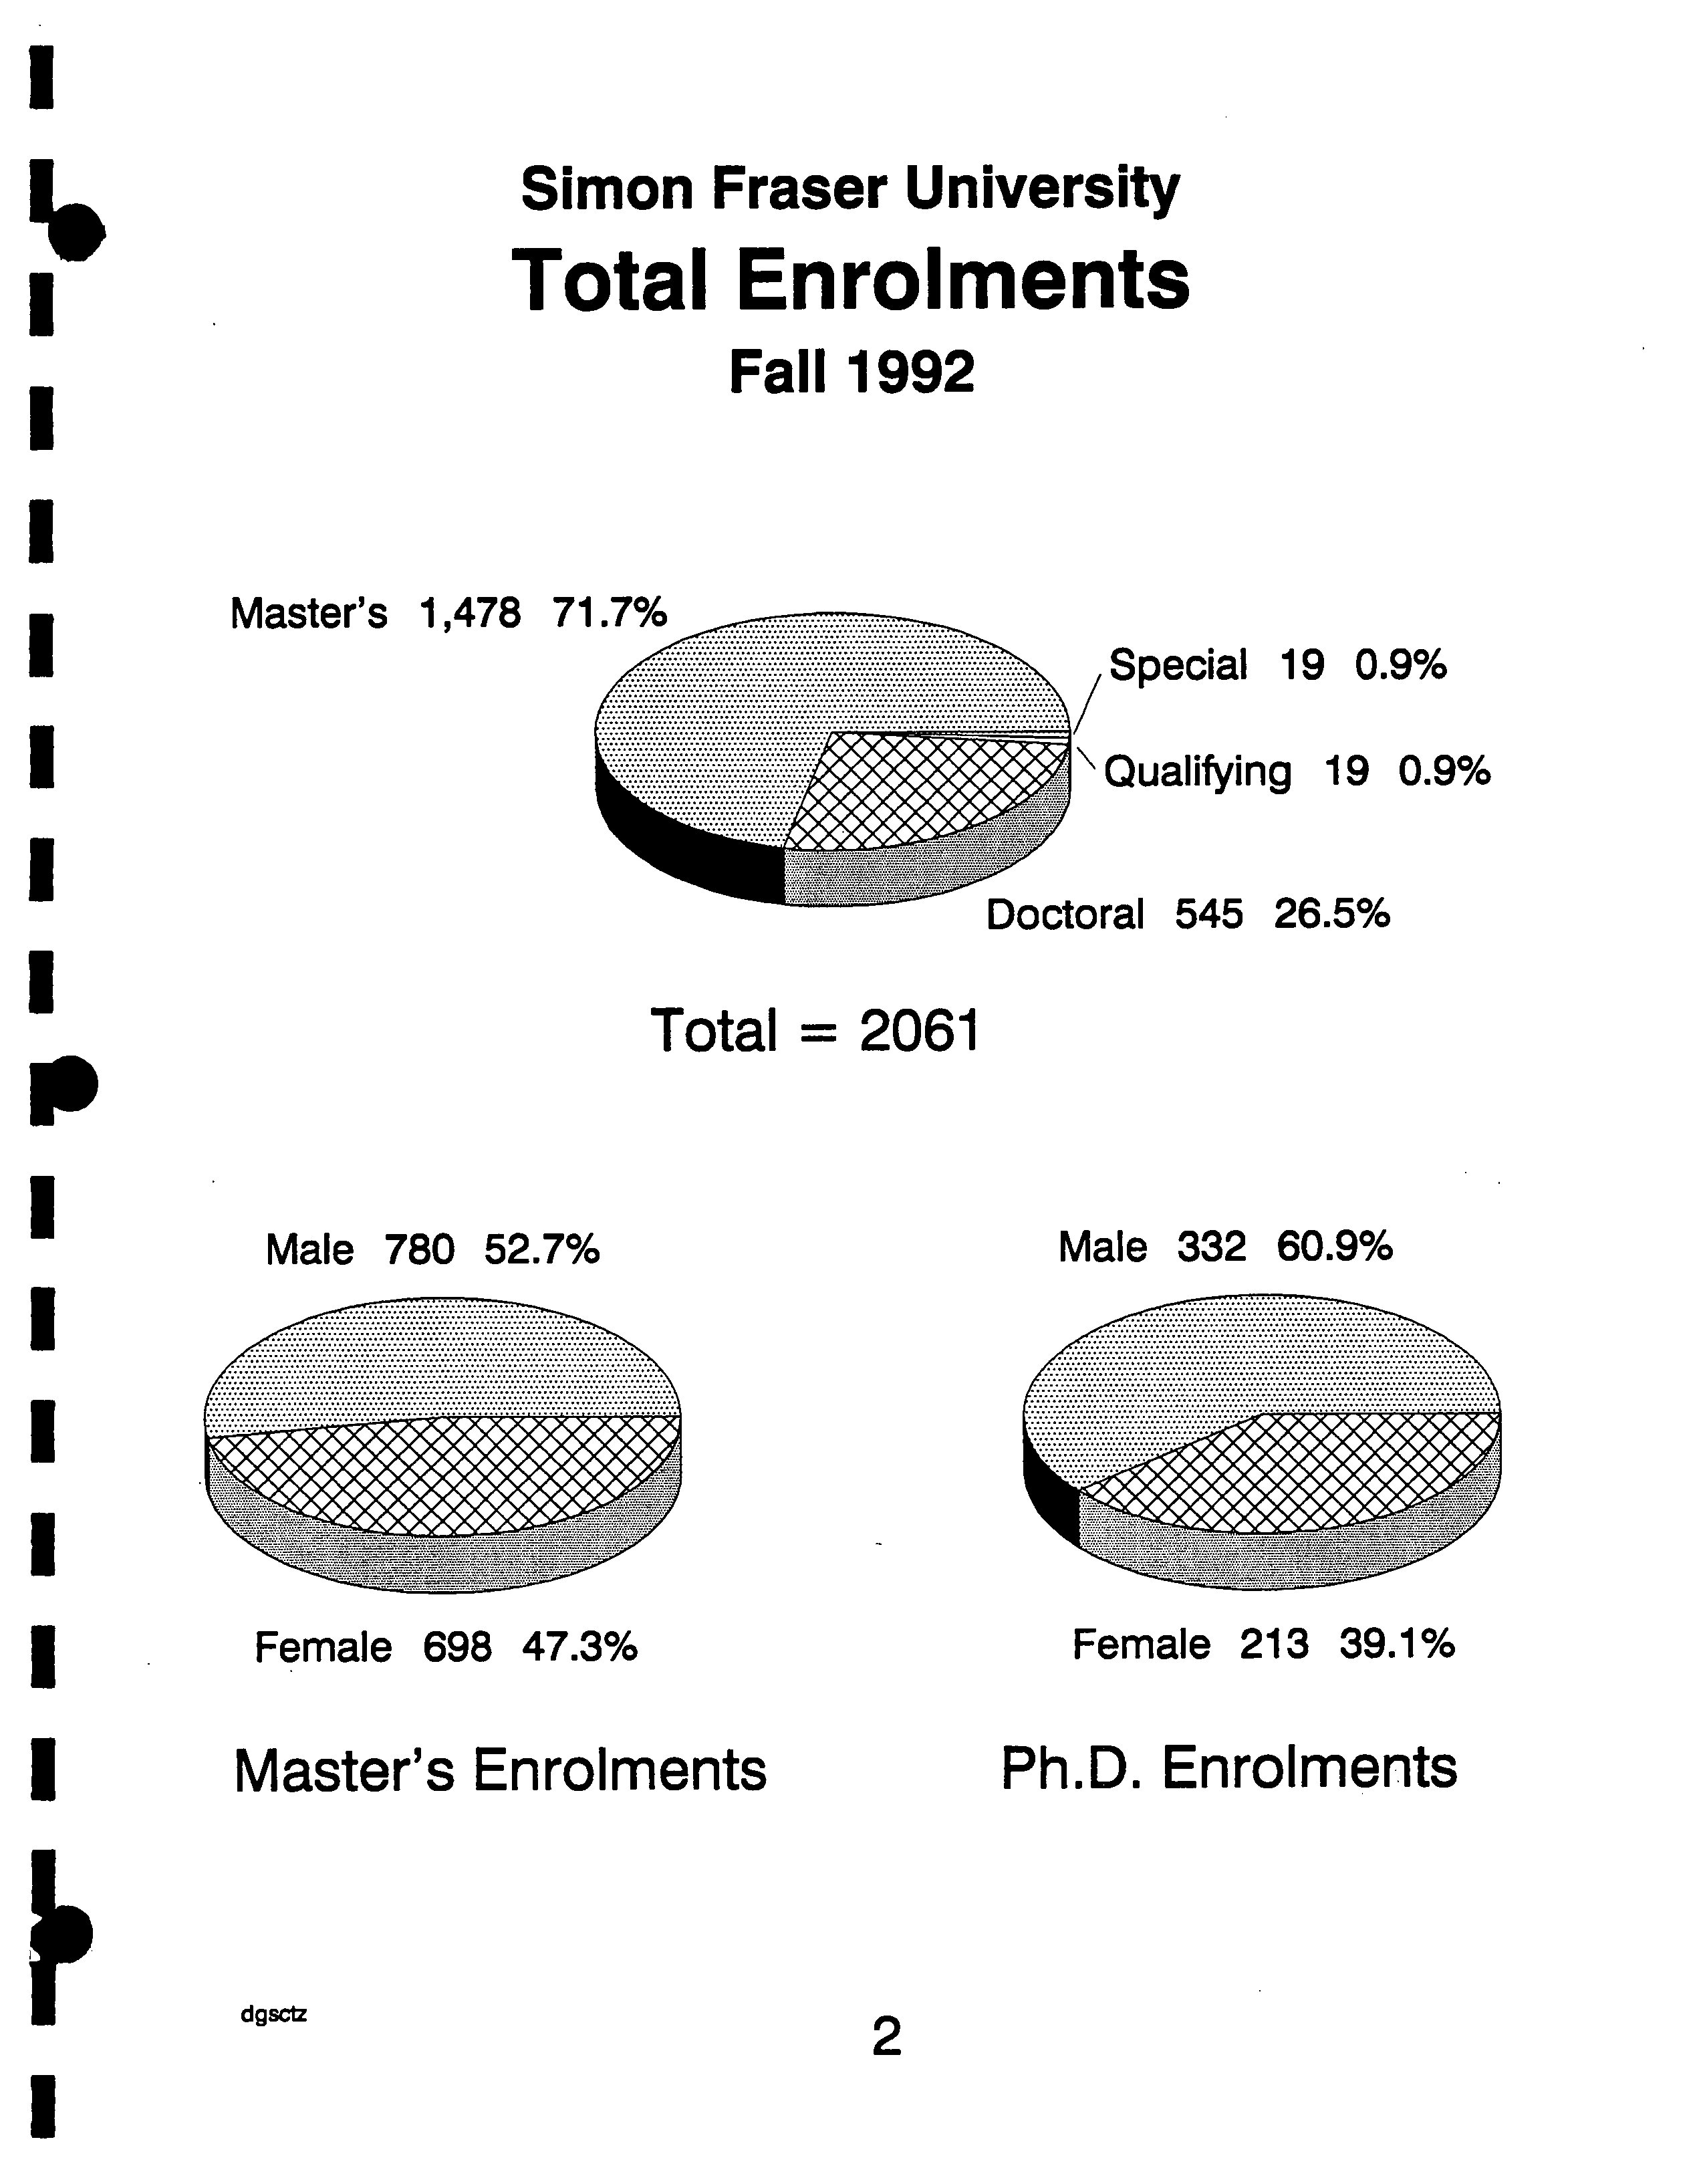
Master's 1,478 71
Special 19 0.9%
Qualifying 19 0.9%
uuciural 545 26.5%
I
I.
I
I
I
I
I
I
I
p
I
I
I
I
I
I
p
Total
Simon Fraser
Enrolments
University
Fall 1992
Total = 2061
Master's Enrolments
?
Ph.D. Enrolments
dgsclz
?
2
Male 780 52.7%
Female 698 47.3%
Male 332 60.9%
Female 213 39.1%
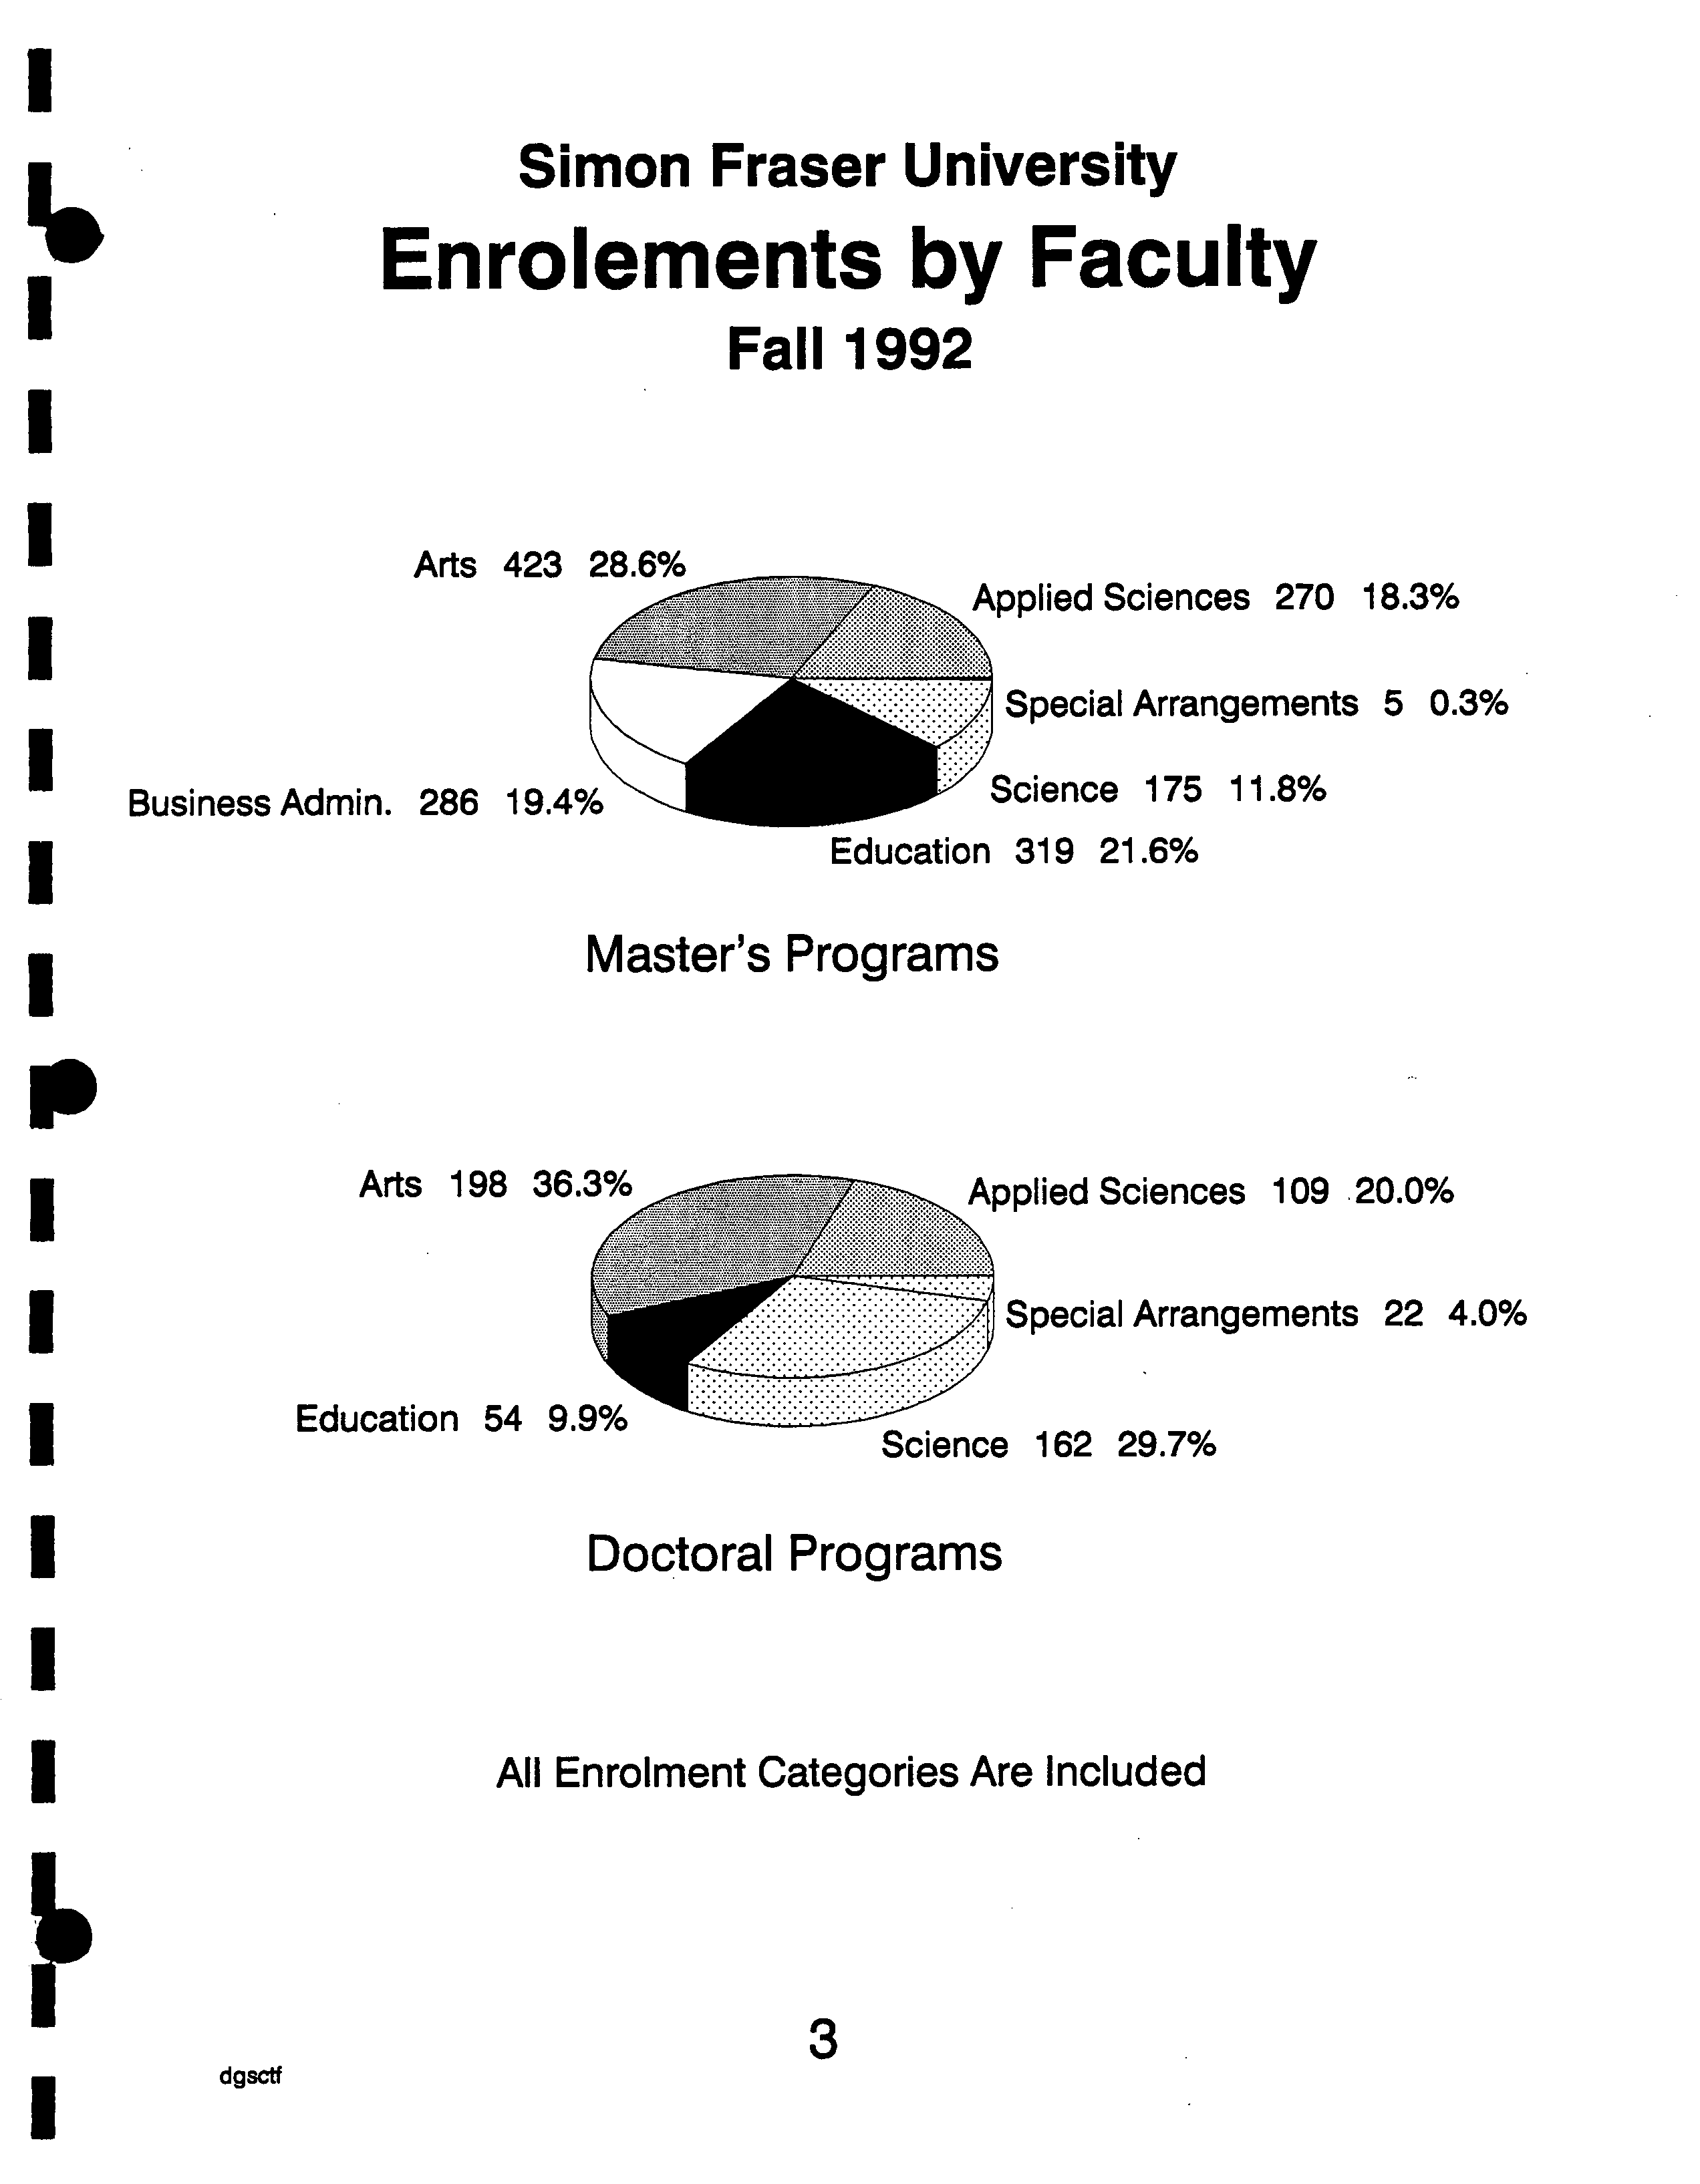
Arts 198 36.3%
?
Applied Sciences 109 .20.0%
Special Arrangements 22 4.0%
Education 54 9.9%
?
Science 162 29.7%
pplied Sciences 270 18.3%
Special Arrangements 5 0.3%
Science 175 11.8%
Education 319 21.6%
Simon Fraser University
Enrolements by Faculty
Fall 1992
Arts 423 28.8%
Business Admin. 286 19.4
Master's Programs
Doctoral Programs
All Enrolment Categories Are Included
dgsctf
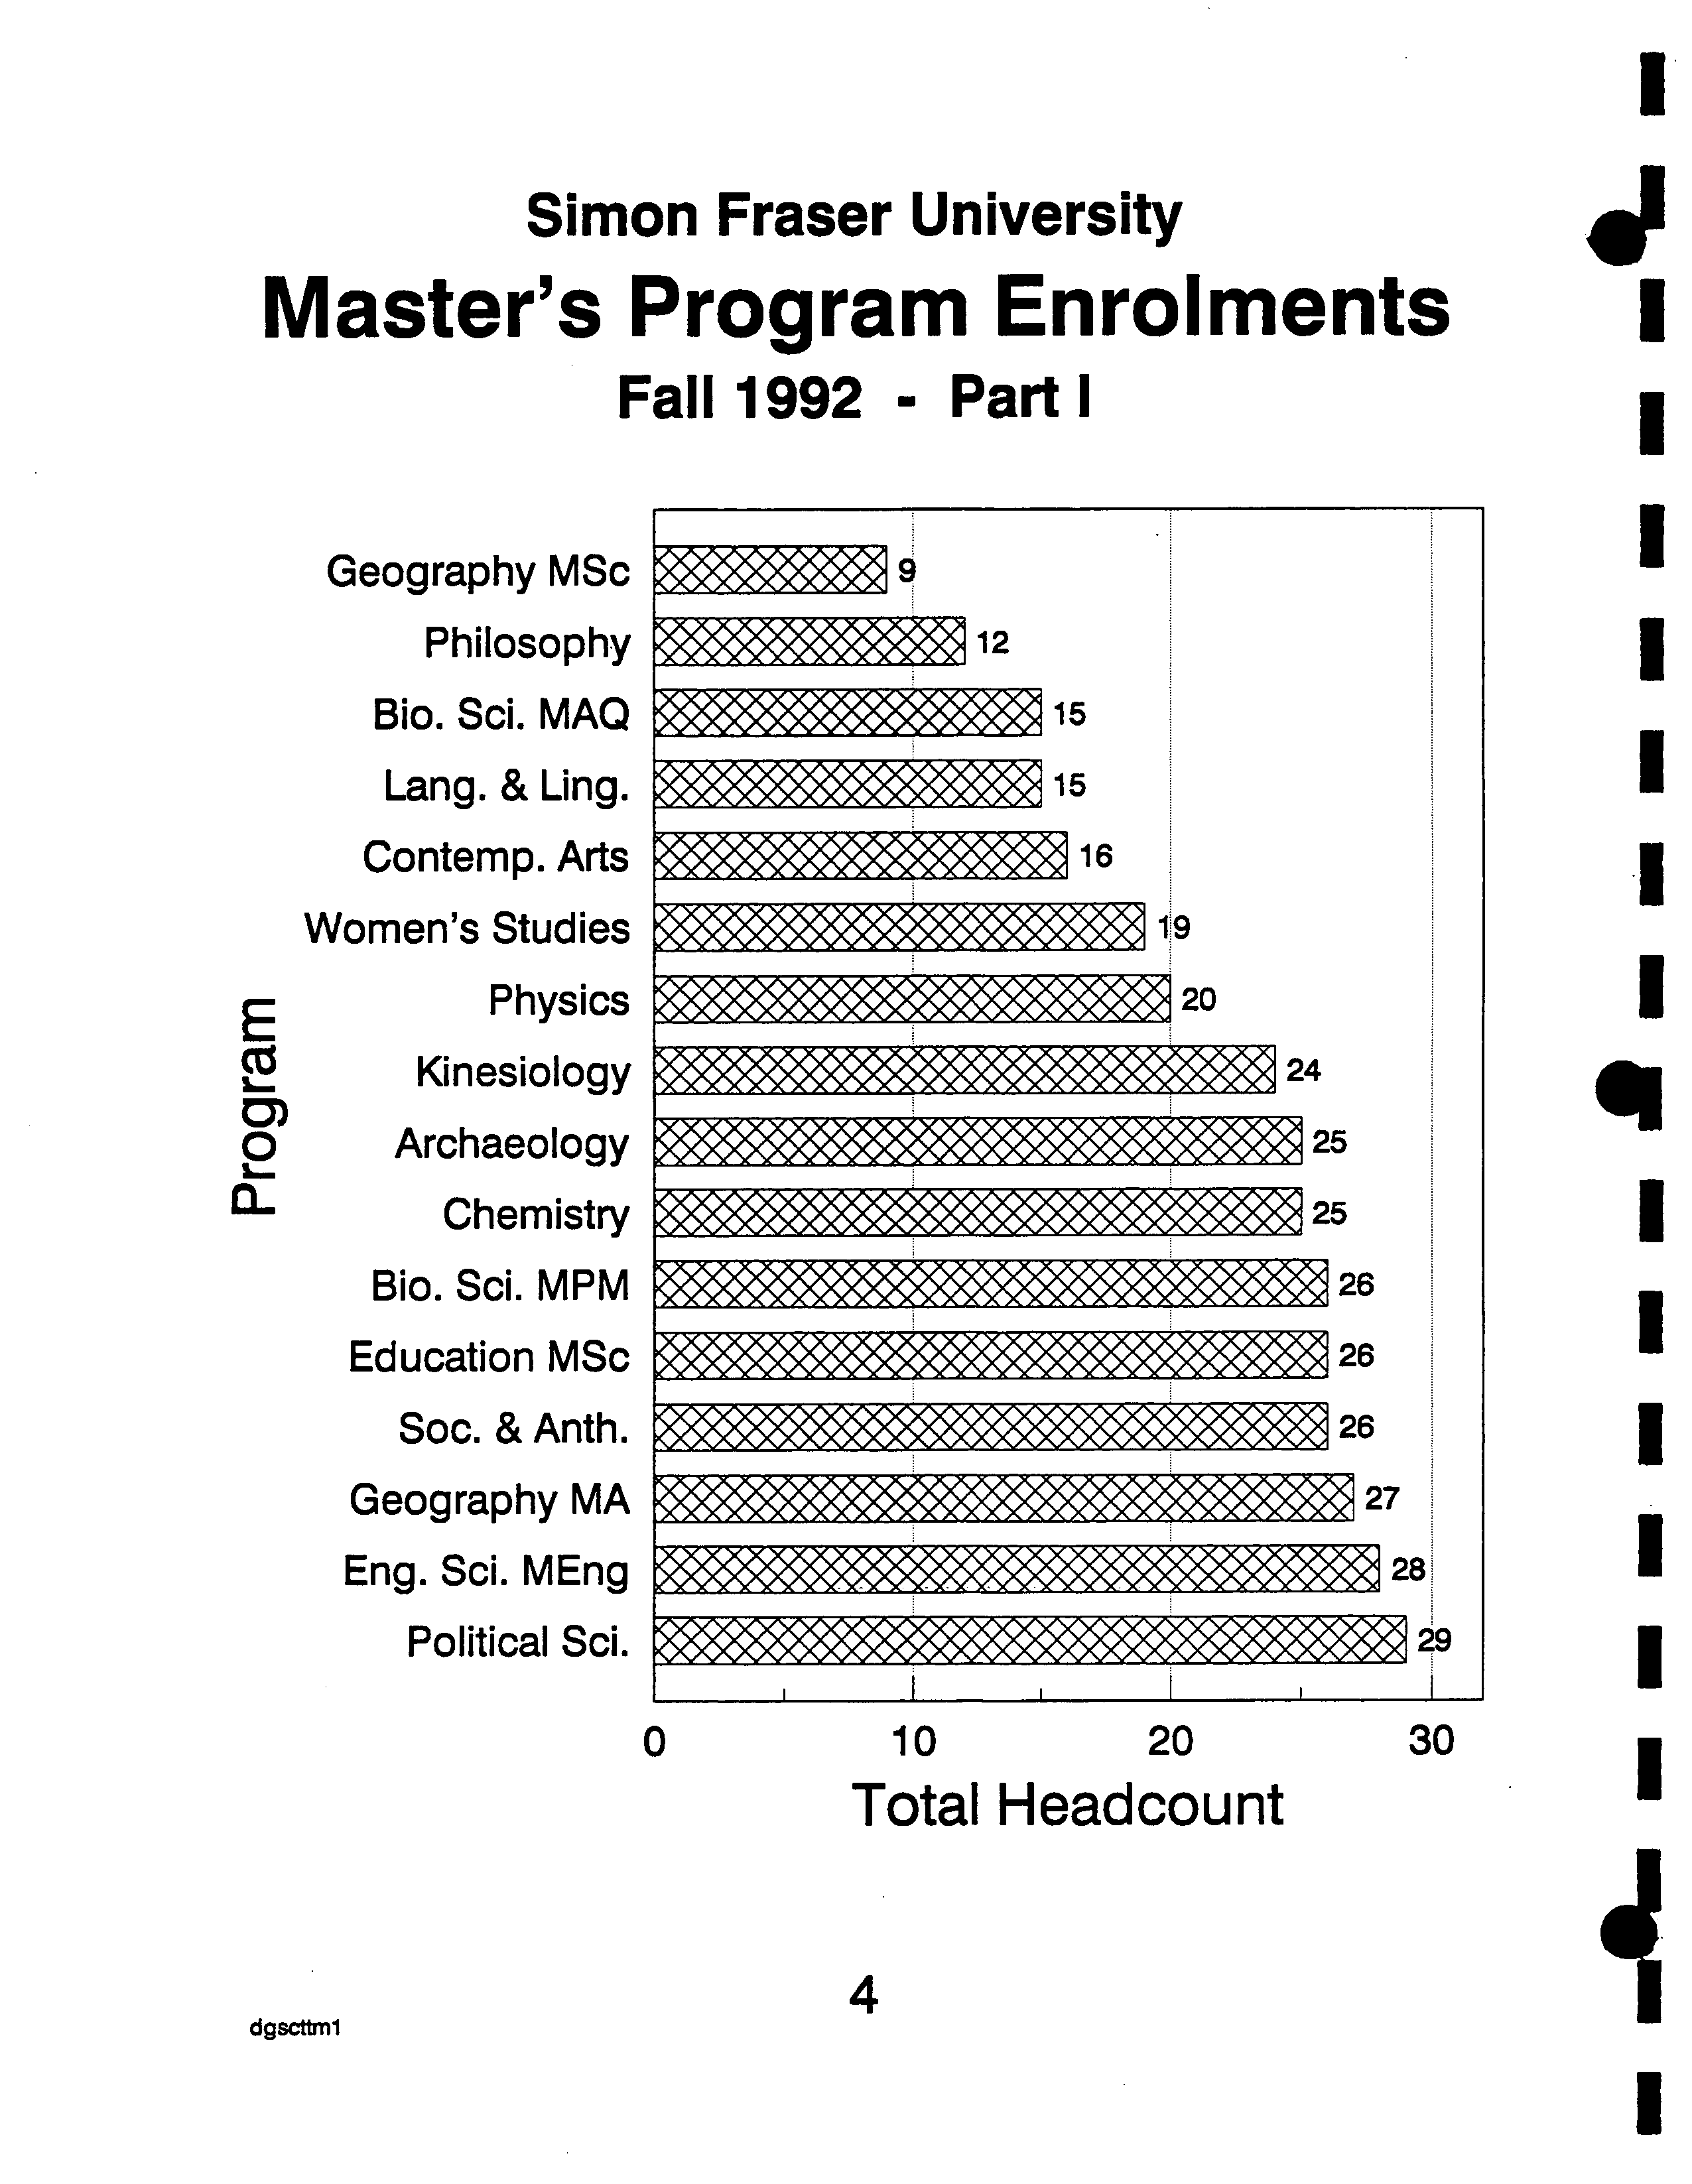
Geography MSc
Philosophy
Bio. Sci. MAQ
Lang. & Ling.
Contemp. Arts
Women's Studies
E
Physics
CO
Kinesiology
8'
Archaeology
CL
Chemistry
Bio. Sd. MPM
Education MSc
Soc. & Anth.
Geography MA
Eng. Sci. MEng
Political Sci.
12
15
15
16
Fi]
112
5
...
ORION
A.-
a-'
Simon Fraser University
Master's Program Enrolments
Fall 1992 - Part
0 ?
10 ?
20 ?
30
Total Headcount
ri
dgscttml
I
I
I.
I
I
I
I
I
I
p
I
I
I
I
I
I
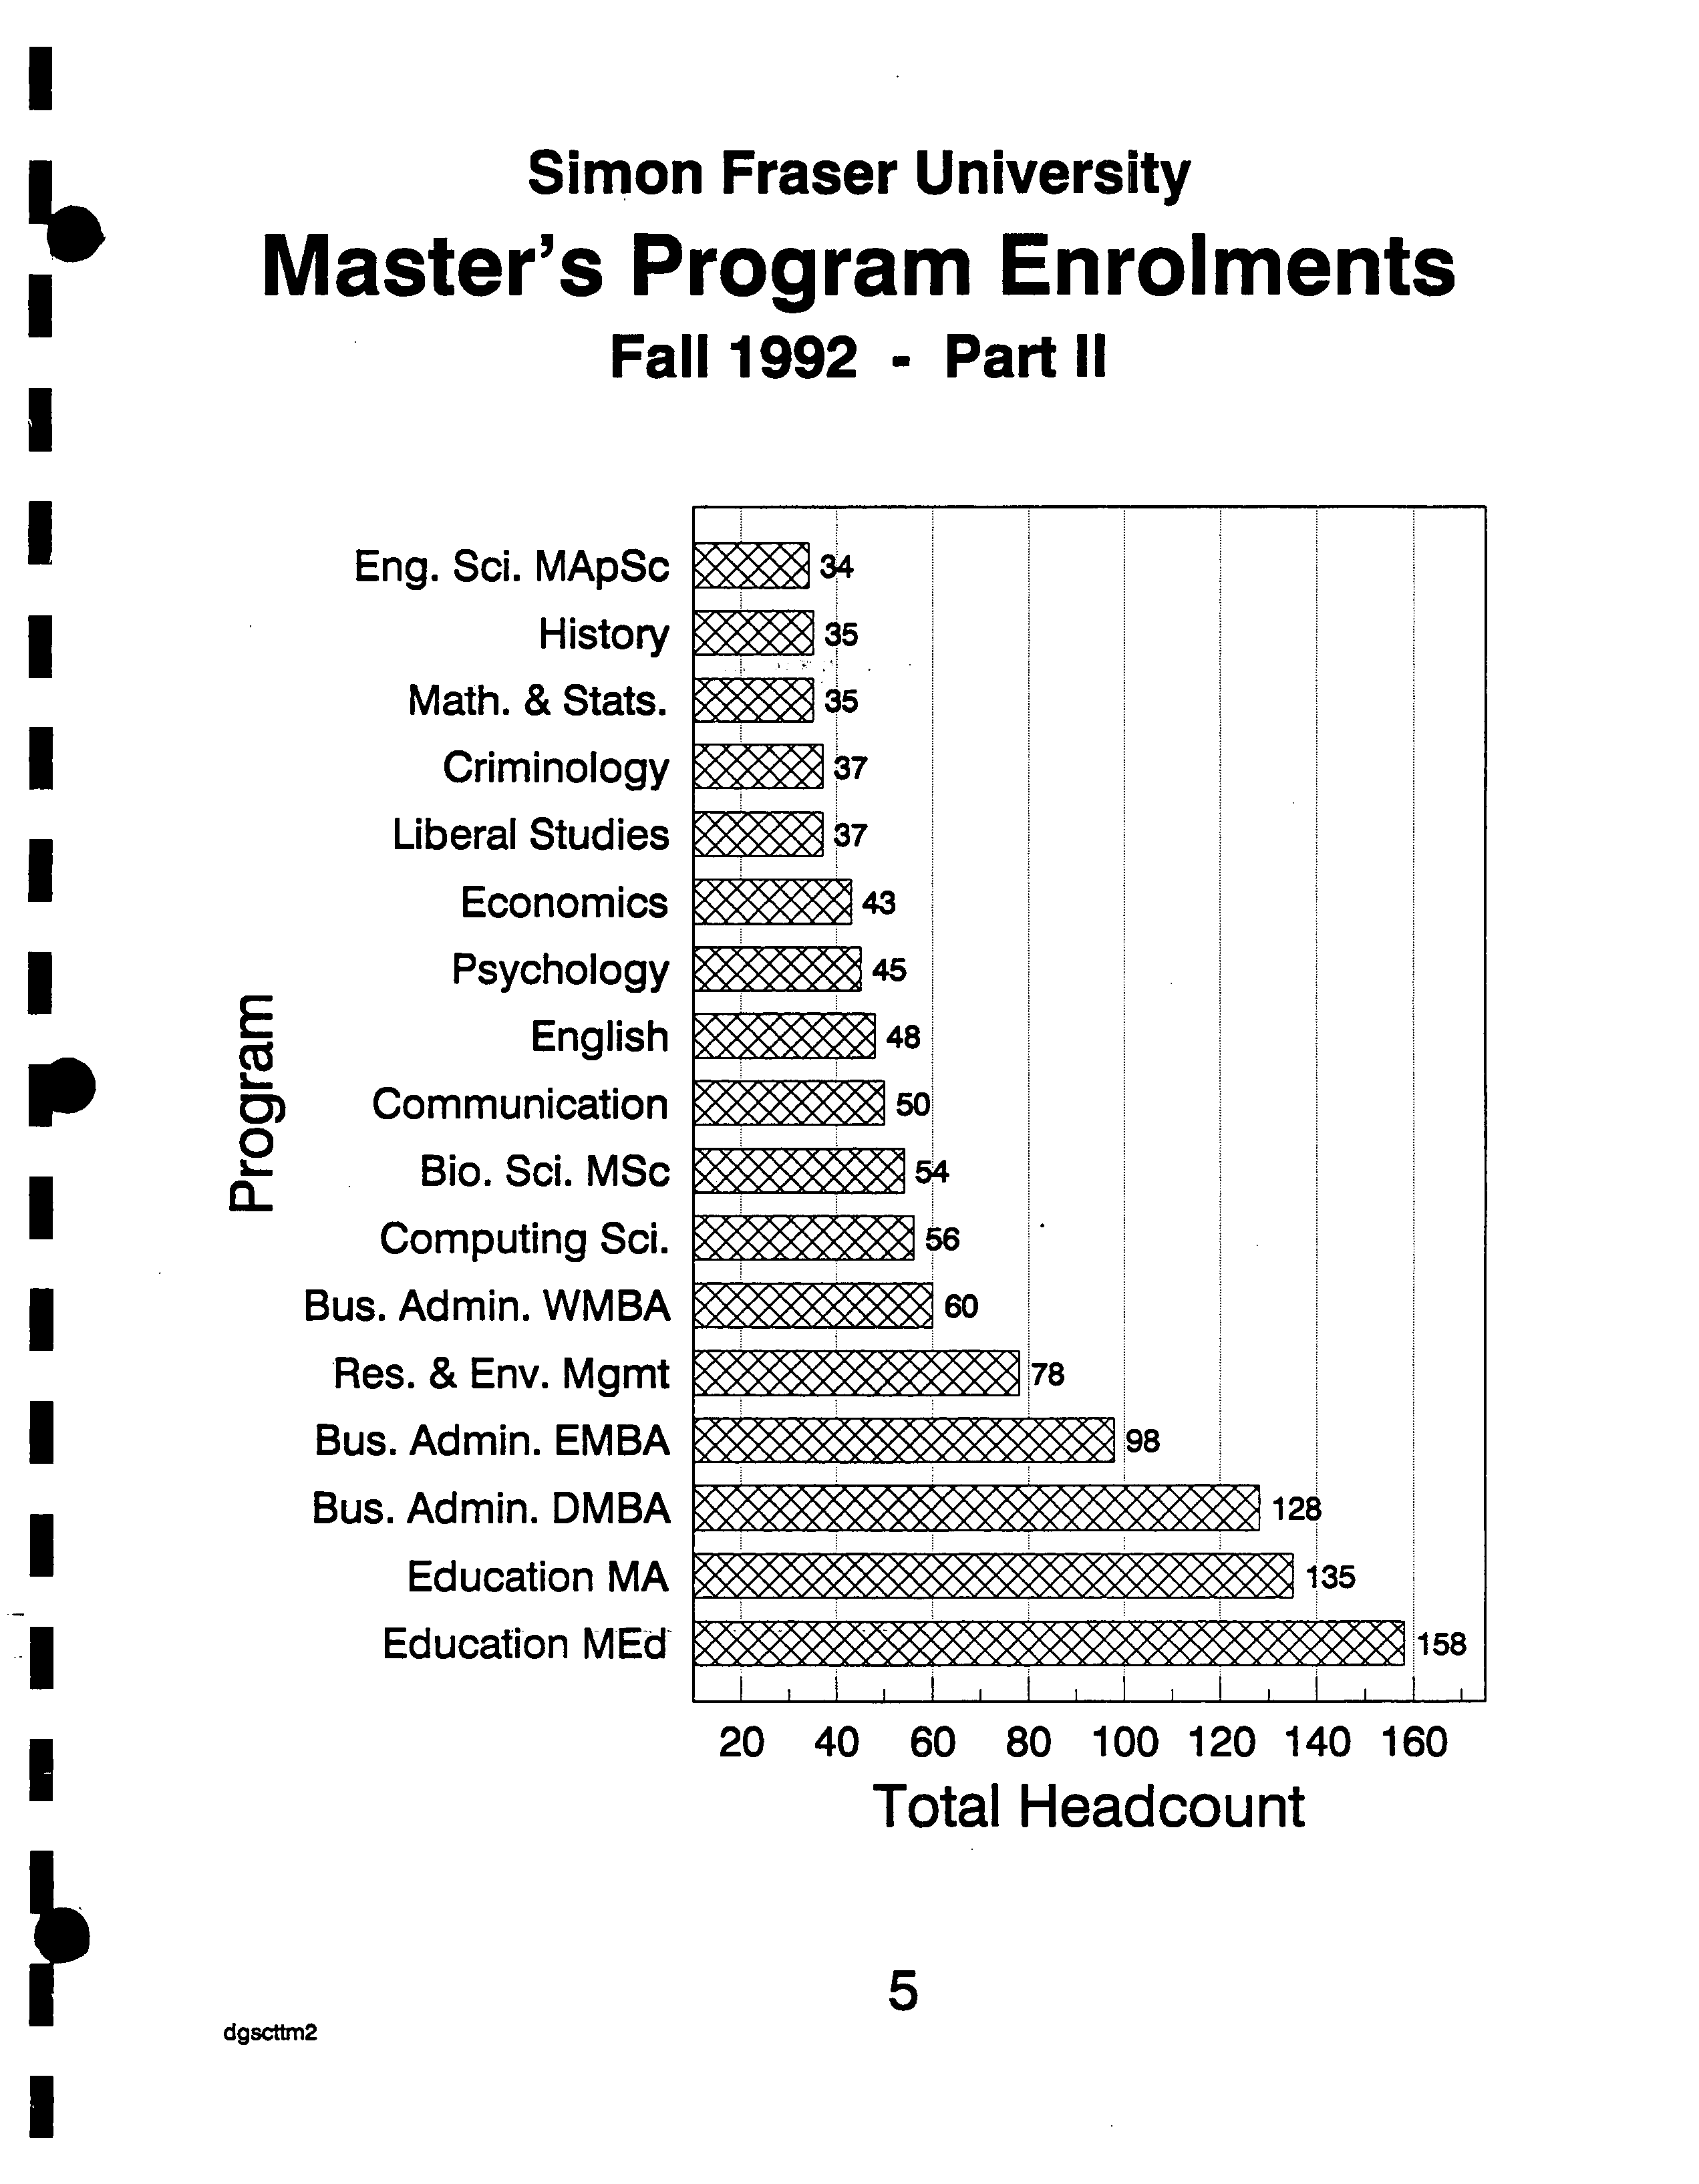
Simon Fraser University
Master's Program Enrolments
Fall 1992 - Part 11
Eng. Sd. MApSc ?
History ?
Math. & Stats. ?
Criminology ?
Liberal Studies
?
Economics
?
43
?
Psychology
?
45
CU
?
English
?
48
Communication
CL
?
Bio. Sci. MSc
Computing Sci.
?
Bus. Admin. WMBA
?
60
Res. & Env. Mgmt
Bus. Admin. EMBA
?
Bus. Admin. DMBA
?
1
?
Education MA
?
35
?
Education MEd
?
58 I
20 40 60 80 100 120 140 160
Total Headcount
p
?
dgscttni2
?
5
Soc. & Anth.
Archaeology
History
Geography
Engineering Sci.
Criminology
Lang. & Ling.
4—a
a)
English
E
Spl.Arr.
It
Kinesiology
Cz
0..
Math. & Stats.
C)
ô
Computing Sci.
Communication
Physics
Chemistry
Economics
Education
Psychology
Bio. Sci.
S
•••i
£ £ £1
8
8
20
22
32
234
34
40
54
641
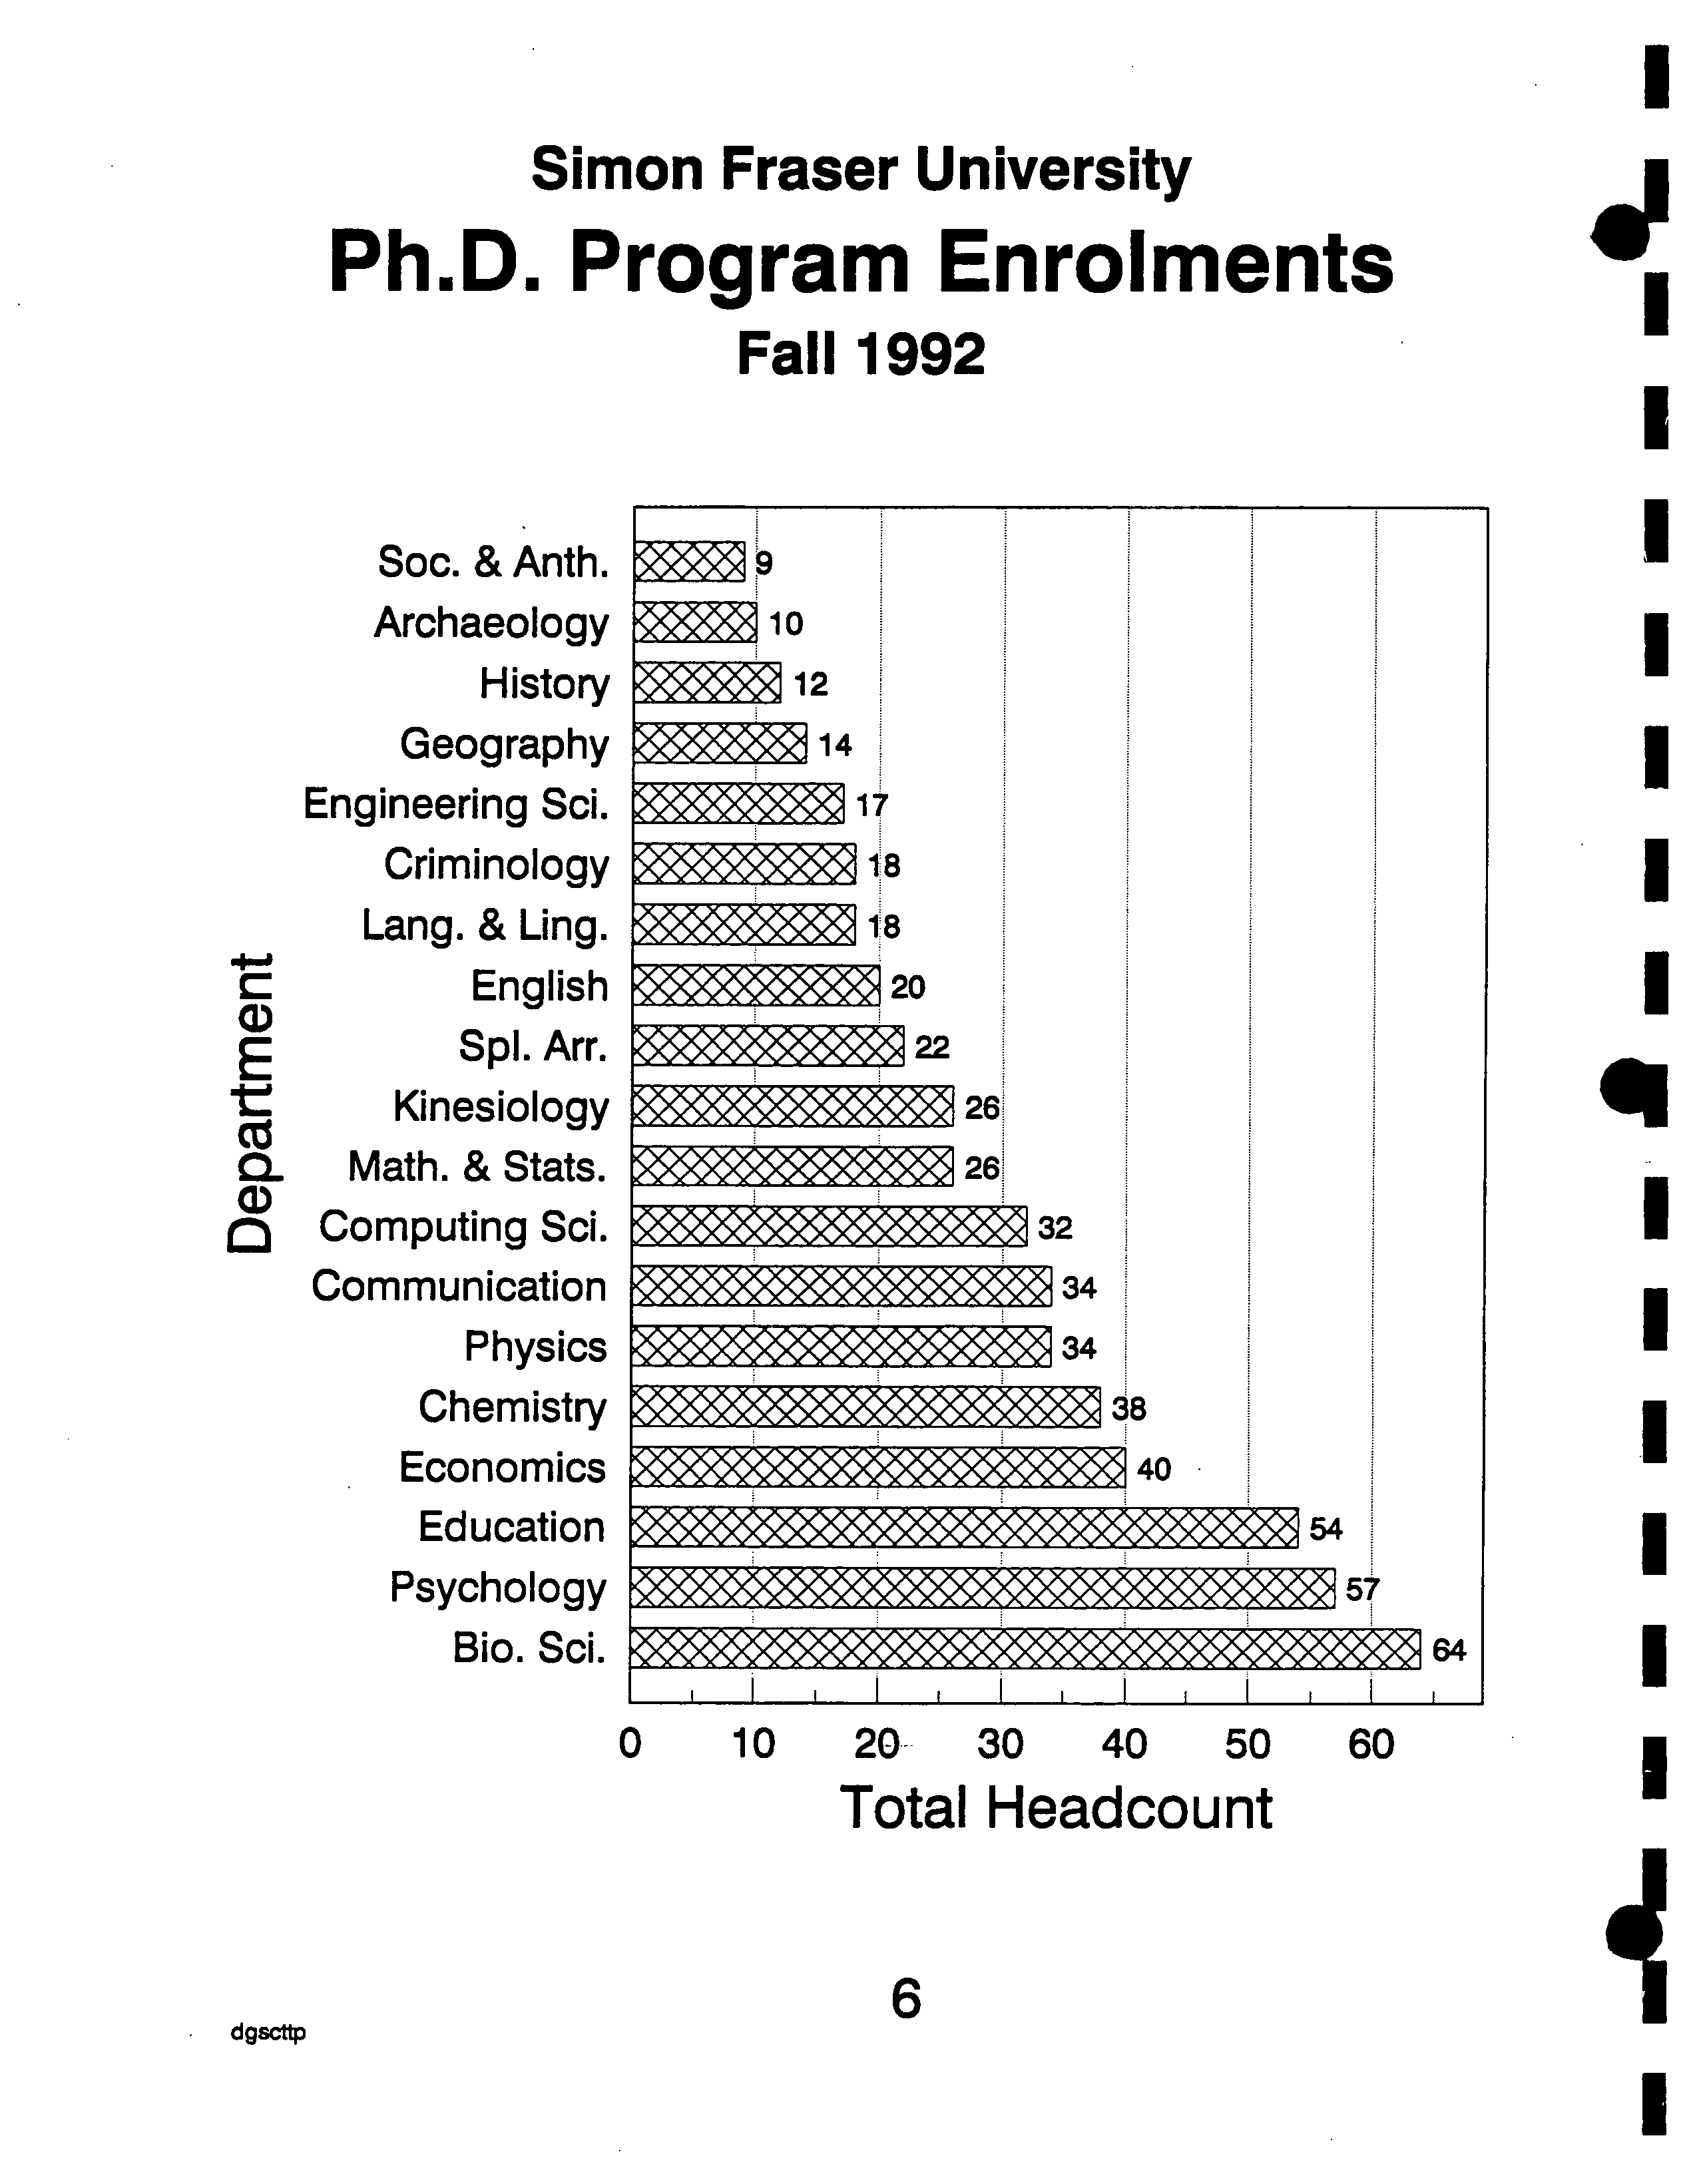
Simon Fraser University
Ph.D. Program Enrolments
Fall 1992
0 ?
10 ?
20- 30
?
40 ?
50 ?
60
Total Headcount
dgscttp
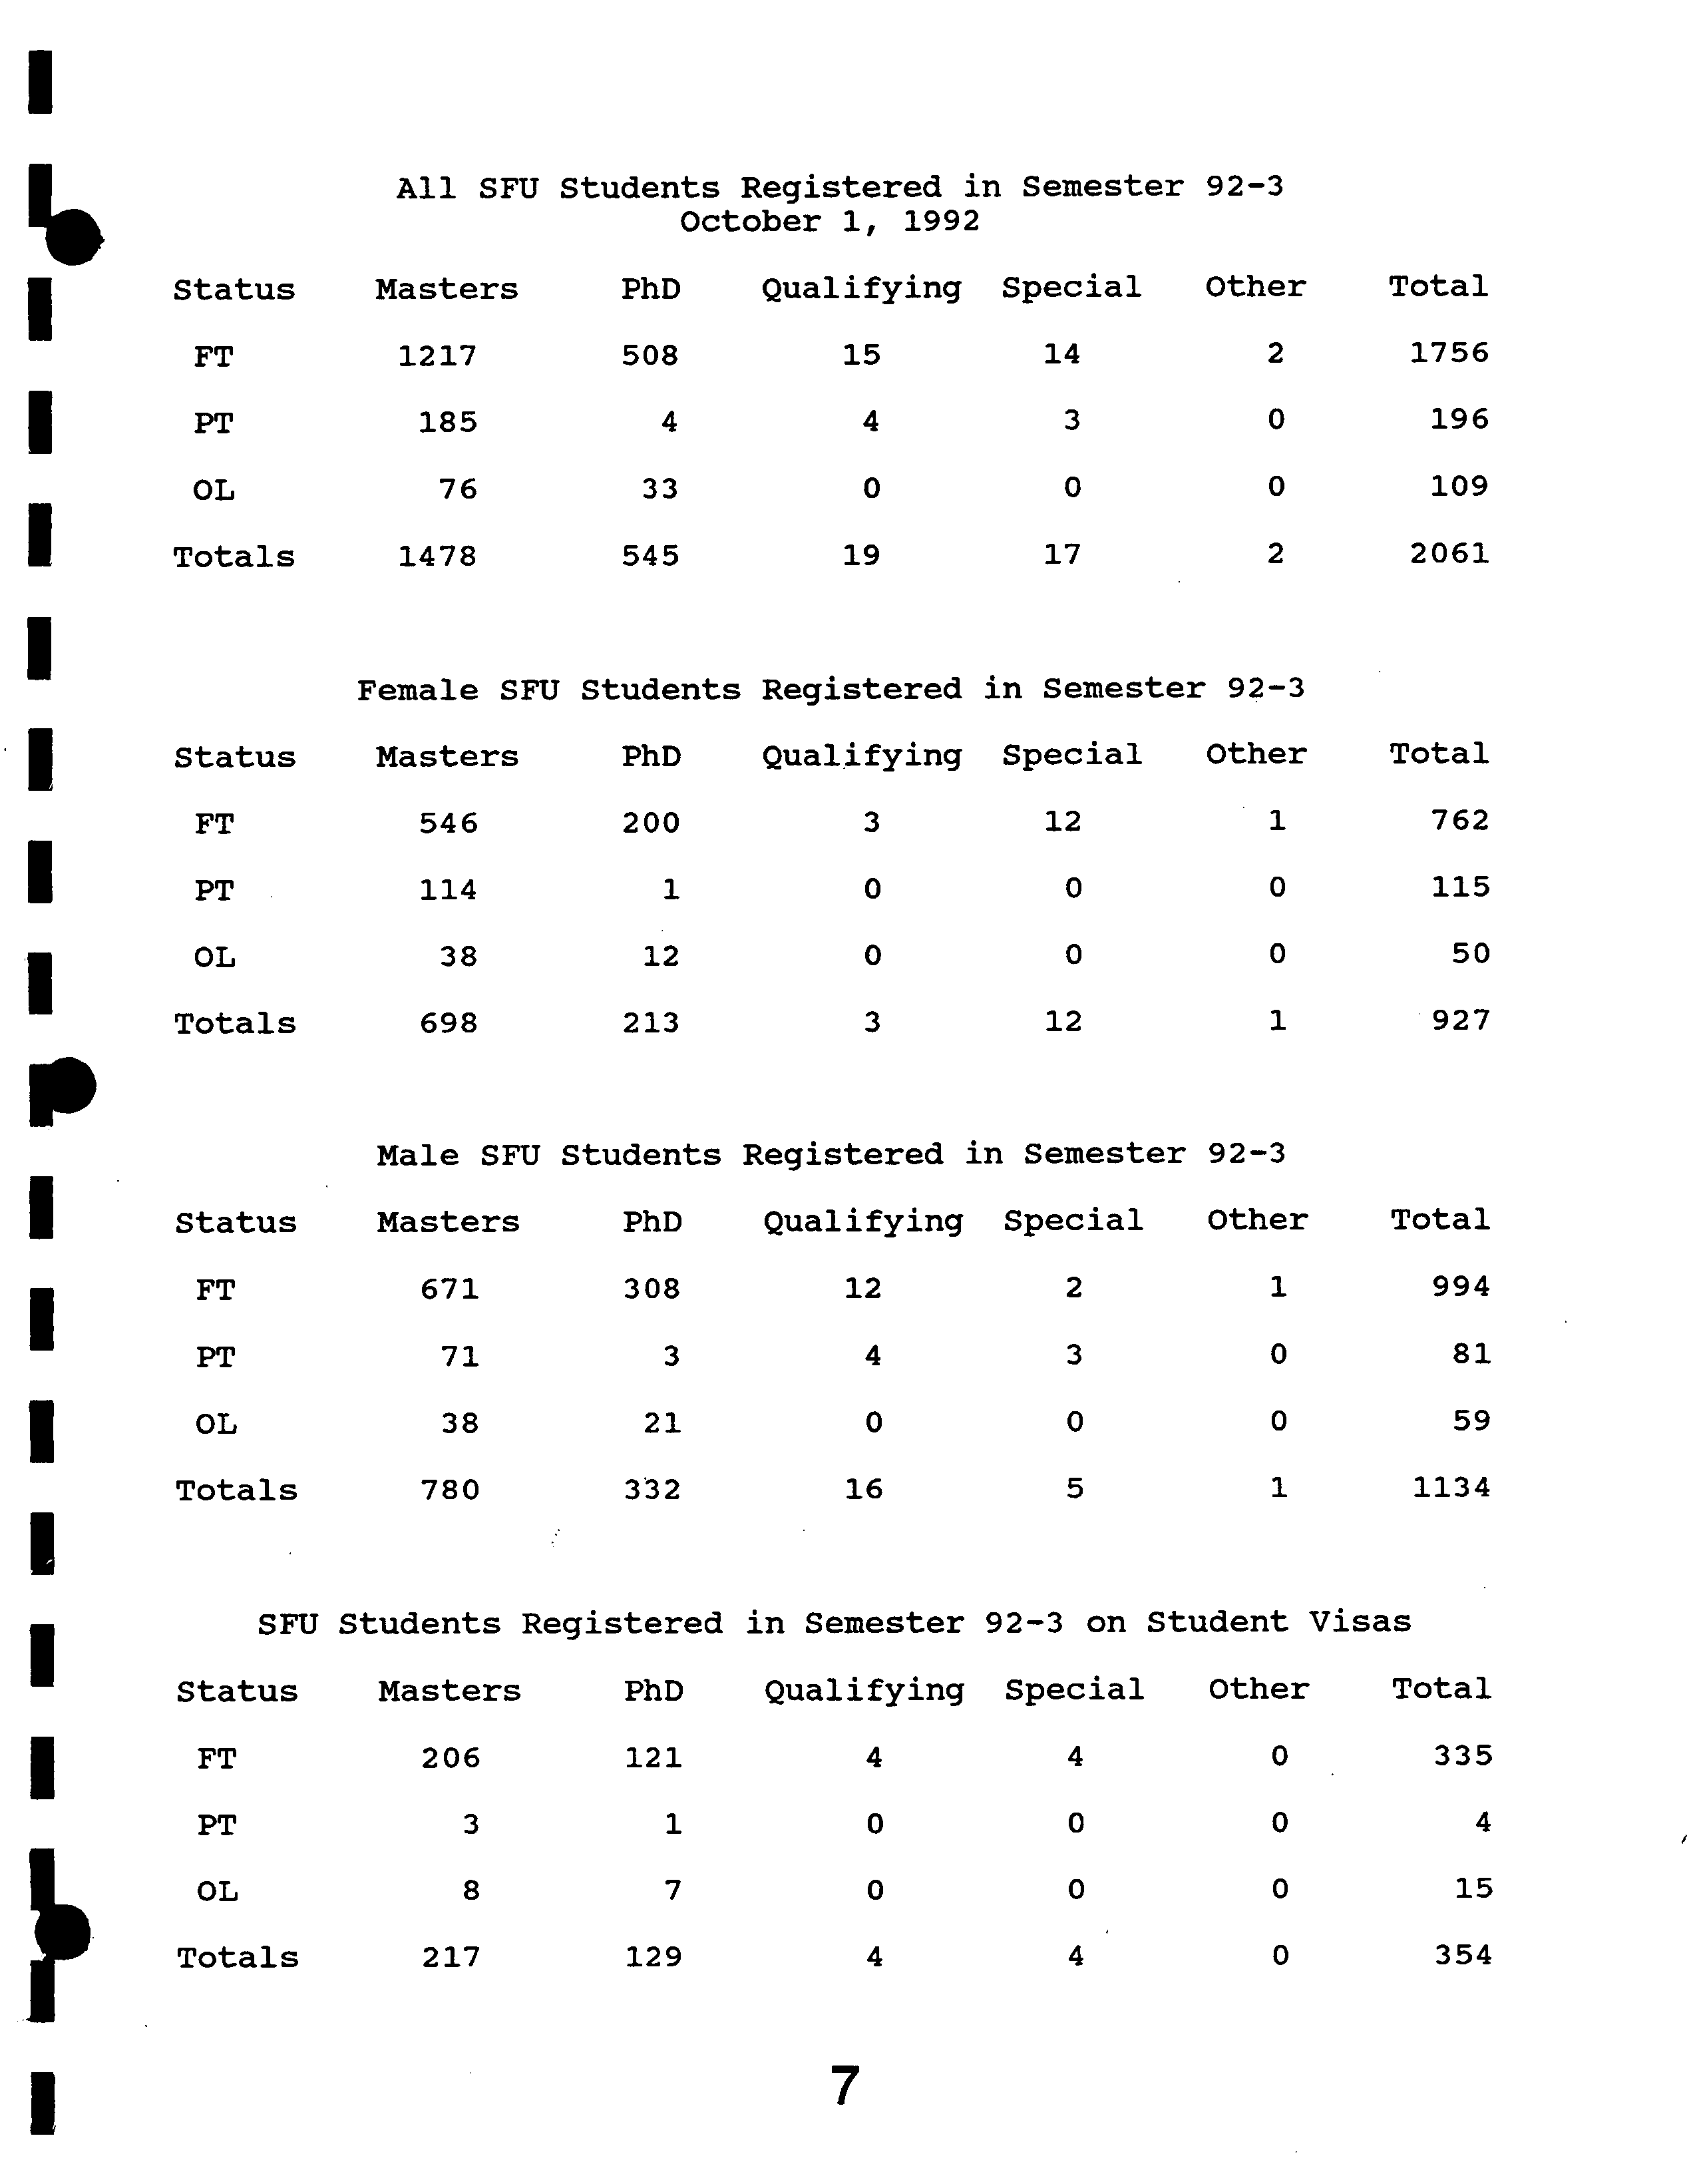
All SFU
Students
Registered in
Semester 92-3
October 1, 1992
Status
Masters PhD
Qualifying
Special
Other Total
FT
1217
508
15
14
2
1756
PT
185
4
4
3
0
196
OL
76
33
0
0
0
109
Totals
1478
545
19
17
2
2061
Female SF13 Students Registered in Semester 92-3
Status
Masters PhD
Qualifying
Special
Other Total
FT
546
200
3
12
1
762
PT
114
1
0
0
0
115
OL
38
12
0
0
0
50
Totals
698
213
3
12
1
927
Male SFU Students Registered in Semester 92-3
Status
Masters PhD Qualifying
Special
Other Total
FT
671
308
12
2
1
994
PT
71
3
4
3
0
81
OL
38
21
0
0
0
59
Totals
780
332
16
5
1
1134
SFU Students Registered in Semester 92-3 on Student Visas
Status
Masters PhD
Qualifying
Special
Other
Total
FT
206
121
4
4
0
335
PT
3
1
0
0
0
4
OL
8
7
0
0
0
15
Totals
217
129
4
4
0
354
7
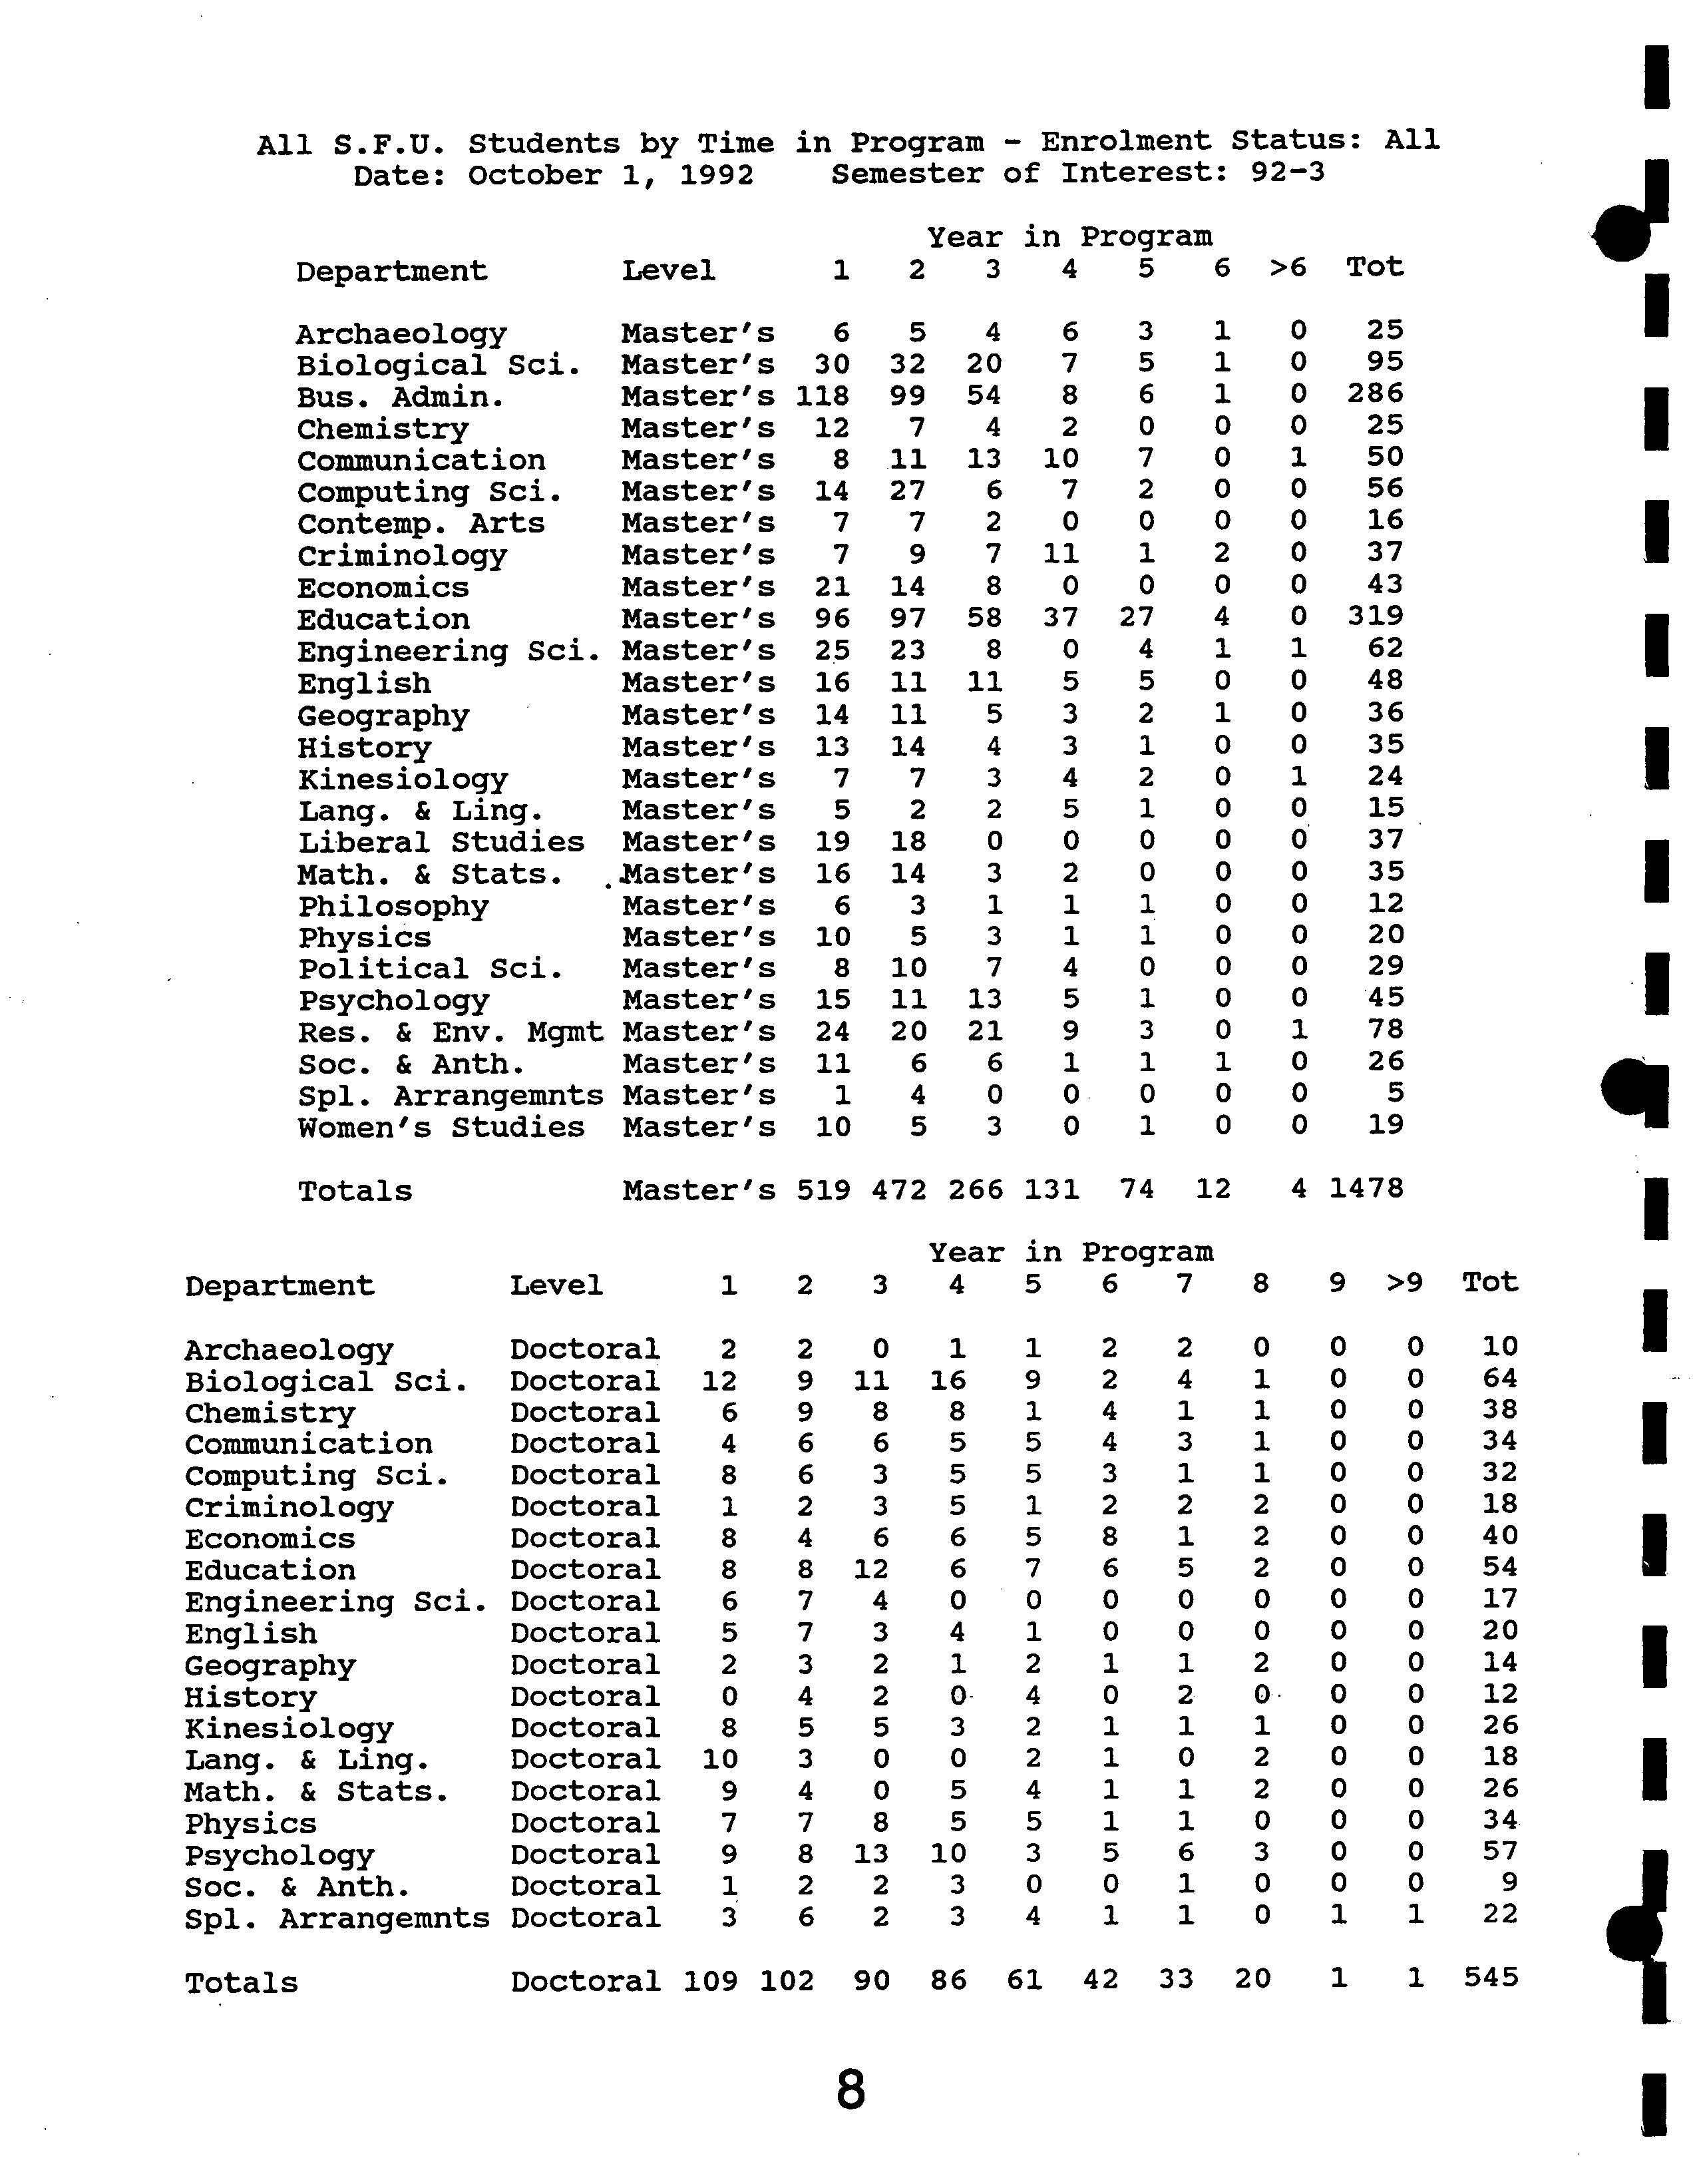
All S.F.U. Students by Time in Program - Enrolment Status: All
?
Date: October 1, 1992
?
Semester of Interest: 92-3
Year in Program
Department ?
Level ?
1 2 3 4 5 6 >6 Tot
Archaeology
?
Master's 6 5 4 6 3 1 0 25
Biological Sci. Master's 30 32 20 7
?
5 1 0
?
95
Bus. Admin. ?
Master's 118 99 54
?
8 ?
6 ?
1 0 286
Chemistry ?
Master's 12 7 4 2 0 0 0 25
Communication ?
Master's 8 11 13 10 7 0 1 50
?
Computing Sci. Master's 14 27 6 7 2 0 0 56
Contemp. Arts
?
Master's 7 7 2 0 0 0 0 16
Criminology ?
Master's 7 9 7 11 1 2 0 37
Economics ?
Master's 21 14 8 0 0 0 0 43
Education ?
Master's 96 97 58 37 27 4 0 319
?
Engineering Sci. Master's 25 23 8 0 4 1 1 62
English ?
Master's 16 11 11 5 5 0 0 48
Geography ?
Master's 14 11 5 3 2 1 0 36
History ?
Master's 13 14 4 3
?
1 0 0 35
Kinesiology ?
Master's 7 7 3 4 2 0 1 24
Lang. & Ling.
?
Master's 5 2 ?
2 ?
5 ?
1 0 0
?
15
?
Liberal Studies Master's 19 18 0 0 0 0 0 37
Math. & Stats. ..Master's 16 14
?
3 ?
2 ?
0 ?
0 ?
0 ?
35
Philosophy ?
Master's 6 3 1 1 1 0 0 12
Physics ?
Master's 10 5 3
?
1 1 0 0 20
Political Sci.
?
Master's 8 10 7
?
4 ?
0 ?
0 ?
0 ?
29
Psychology ?
Master's 15 11 13 5 1 0 0 45
Res. & Env. Mgmt Master's 24 20 21 9
?
3 ?
0 ?
1 78
Soc. & Anth. ?
Master's 11 ?
6 ?
6 ?
1 ?
1 ?
1 ?
0 ?
26
Spl. Arrangemnts Master's 1 4 0 0 0 0 0
?
5 ?
Women's Studies Master's 10 5 3 0 1 0 0 19
Totals ?
Master's 519 472 266 131 74 12
?
4 1478
Year in Program
Department ?
Level ?
1 2 3 4 5 6 7 8 9 >9 Tot
Archaeology ?
Doctoral 2 2 0 1 1 2 2 0 0 0 10
Biological Sci. Doctoral 12 9 11 16 9
?
2 4
?
1 0 0 64
Chemistry ?
Doctoral 6 9 8 8 1 4 1 1 0 0 38
Communication ?
Doctoral 4 6 6 5 5 4 3 1 0 0 34
Computing Sci.
?
Doctoral 8 6 3
?
5 5 3 1 1 0 0 32
Criminology ?
Doctoral 1 2 3 5 1 2 2 2 0 0 18
Economics
?
Doctoral 8 4 6 6 5 8 1 2 0 0 40
Education ?
Doctoral 8 8 12
?
6 7 6 5 2 0 0 54
Engineering
Sd.
Doctoral 6 7 4
?
0 0 0 0 0 0 0 17
English ?
Doctoral 5 7 3 4 1 0 0 0 0 0 20
Geography
?
Doctoral 2 3 2
?
1 2
?
1 1 2 0 0 14
History ?
Doctoral ?
0 4 2
?
0- 4 ?
0 2 ?
0 0
?
0 12
Kinesiology ?
Doctoral 8 5 5 3 2
?
1 1 1 0 0 26
Lang. & Ling. ?
Doctoral 10
?
3 ?
0 ?
0 ?
2 ?
1 0 2
?
0 ?
0 ?
18
Math. & Stats.
?
Doctoral 9 ?
4 ?
0 ?
5 4 ?
1 1 2
?
0 ?
0 26
Physics ?
Doctoral 7 7 8 5 5 1 1 0 0 0 34
Psychology
?
Doctoral 9 8 13 10 3
?
5 6 3 ?
0 0 57
Soc. & Anth. ?
Doctoral ?
1 2 2 ?
3 ?
0 ?
0 1 0
?
0 ?
0 ?
9
Spi. Arrangemnts Doctoral 3 6 2 3 4
?
1 1 0 1 1 22
Totals ?
Doctoral 109 102 90 86 61 42 33 20
?
1 ?
1 545
L!J
Simon Fraser University
Grades of All Students
Fall 1992
Economics
Bus. Admin.
Chemistry
Eng. Science
History
Physics
Res. .& Env. Mgmt.
Computing Sci.
English
-
DIO. CCI.
U)
E ?
?
Lang.
Geography
& Ling.
Political Sci.
Cz
CL
Contemp. Arts
Liberal Studies
Women's Studies
Math. & Stats.
Philosophy
Kinesiology
Education
Communication
Psychology
Soc. & Anth.
Criminology
Archaeology
3.40 3.50 3.60 3.70 3.80 3.90 4.00
Grades
University Average: 3.65 Median: 3.72
I
I.
I
I
I
I
I
I
I
p
I
I
I
•1
I
I
Average Grade
I
I Median Gade
I
?
dgsgrd
I
Seines
CGPA
Aver.
3.85
3.66
3.46
3.53
3.74
3.62
3.71
3.83
3.46
3.75
3.57
3.60
3.69
3.57
3.75
3.72
3.70
3.78
3.75
3.55
3.70
3.80
3.61
3.82
3.83
3.69
3.66
Simon Fraser University
Cumulative Grade Point Averages at the End of
Date of Report: October 1, 1992
All Graduate Students
# of CGPA CGPA CGPA
Department ?
Stu. ?
25% 20% 10%
Archaeology ?
26 4.00 4.00 4.00
Biological Sciences
?
133 3.89 3.93 4.00
Business Administration ?
173 3.67 3.70 3.79
Chemistry ?
45 3.72 3.74 3.95
Communication ?
73 3.93 3.95 4.00
Computing Science
?
71 3.84 3.89 4.00
Contemporary Arts
?
9 3.75 3.75 3.93
Criminology ? 50 4.00 4.00 4.00
Economics ? 64 3.69 3.77 3.82
Education ? 294 3.93 3.95 4.00
Engineering Science ?
63 3.84 3.84 4.00
English ? 52 3.89 4.00 4.00
Geography ? 30 3.89 3.89 4.00
History ?
25 3.75 3.78 3.92
Kinesiology ? 37 3.93 4.00 4.00
Languages & Linguistics
?
21 4.00 4.00 4.00
Liberal Studies ? 18 4.00 4.00 4.00
Mathematics & Statistics ?
41 4.00 4.00 4.00
Philosophy ?
7 4.00 4.00 4.00
Physics
? 39 3.87 3.89 4.00
Political Science ?
22 3.92 3.92 4.00
Psychology ? 79 4.00 4.00 4.00
Resource & Environ. Mgmt.
?
59 3.74 3.78 3.86
Sociology & Anthropology ?
23 4.00 4.00 4.00
Special Arrangements ?
25 4.00 4.00 4.00
Women's Studies ?
11 3.75 3.89 4.00
Totals ?
1490 3.89 3.93 4.00
I
ter 92-2
I
CGPA CGPA
Med. Wted.
3.89 3.86
3.67 3.65
3.50 3.46
3.56 3.54
3.80 3.76
3.65 3.61
3.67 3.70
3.87 3.83
3.45 3.44
3.80 3.75
3.67 3.57
3.67 3.64
3.67 3.66
3.58 3.58
3.84 3.74
3.87 3.69
3.67 3.71
3.89 3.73
4.00 3.73
3.67 3.60
3.74 3.69
3.88 3.78
3.63 3.60
3.83 3.80
3.87 3.75
3.67 3.72
3.72 3.65
CGPA 25%
CGPA Wted.
CGPA Aver.
CGPA Med.
=
= Average
Lowest CGPA
CGPA
of
weighted
the top
by
25%
semester
of studentshours
?
completed
I
= Average CGPA unweighted by semester hours completed
= Median CGPA ?
I
10 ?
1
I
I*
I
Simon Fraser University
Cumulative Grade Point Averages at the End of Semester 92-2
I
Date of Report: October 1, 1992
Female Graduate Students
# of CGPA CGPA CGPA CGPA CGPA CGPA
Department
?
Stu. ?
25% 20% 10% Aver. Med. Wted.
I
?
Archaeology ?
15 4.00 4.00 4.00 3.86 3.89 3.87
Biological Sciences ?
46 3.86 3.89 4.00 3.61 3.67 3.66
Business Administration
?
57 3.67 3.70 3.80 3.45 3.42 3.45
Chemistry
19 3.83 3.84
3.96 3.53 3.50 3.53
Communication
42 3.93 3.95 4.00 3.72 3.78 3.75
Computing Science
10
3.80 3.80 3.81
3.64 3.67 3.66
Contemporary Arts
3 3.67 3.67 4.00 3.78
3.67
3.78
I ?
Criminology ? 27 4.00 4.00 4.00 3.83 3.87 3.83
Economics ? 11 3.81 3.82 3.88 3.57 3.54 3.60
Education ? 186 3.93 3.95 4.00 3.76 3.80 3.77
I ?
Engineering Science ?
4 3.78 3.78 4.00 3.82 3.75 3.81
English ?
35 3.83 3.92 4.00 3.61 3.67 3.65
Geography ?
10 3.84 3.84 4.00 3.71 3.67 3.71
History
13 3.83
3.83 4.00 3.62 3.75 3.61
P ?
Kinesiology
22 4.00
4.00 4.00 3.79 3.84 3.79
Languages & Linguistics
11 4.00 4.00 4.00 3.69 3.75 3.67
Liberal Studies
10 4.00 4.00 4.00 3.75
3.83 3.78
I ?
Mathematics & Statistics ?
8 4.00 4.00 4.00 3.81 3.89 3.71
Philosophy ?
4 4.00 4.00 4.00 3.88 4.00 3.83
Physics ? 11 3.67 3.92 4.00 3.52 3.64 3.53
Political Science
4
?
3.92 3.92 4.00
3.79 3.67 3.80
I
Psychology
49
?
4.00 4.00 4.00 3.84 3.88 3.81
Resource & Environ. Mgmt.
23
?
3.73 3.73 3.91 3.62 3.63
3.61
Sociology & Anthropology
12 ?
4.00 4.00 4.00 3.85 3.83 3.83
I
Special Arrangements
17 ?
3.94
4.00 4.00 3.77 3.83 3.69
Women's Studies
11 ?
3.75 3.89 4.00 3.69
3.67 3.72
Totals
660 ?
3.92
3.95 4.00 3.70 3.75 3.70
I
CGPA 25% ?
= Lowest CGPA
of the top 25%
of students
CGPA Wted. = Average CGPA weighted by semester
hours
completed
CGPA Aver. = Average CGPA unweighted by semester hours completed
I
CGPA Med. = Median CGPA
1 ?
11
I
Simon Fraser University
Cumulative Grade Point Averages at the End of
Date of Report: October 1, 1992
Male Graduate Students
# of CGPA CGPA CGPA
Department ? Stu. ?
25% 20% 10%
Archaeology ?
11 3.92 4.00 4.00
Biological Sciences
?
87 3.91 4.00 4.00
Business Administration ?
116 3.67 3.71 3.79
Chemistry ?
26 3.65 3.72 3.74
Communication ? 31 3.93 4.00 4.00
Computing Science ?
61 3.87 3.92 4.00
Contemporary Arts ?
6 3.75 3.75 3.75
Criminology ?
23 4.00 4.00 4.00
Economics ?
53 3.67 3.71 3.81
Education ? 108 3.93 3.95 4.00
Engineering Science ?
59 3.84 3.84 4.00
English ?
17 4.00 4.00 4.00
Geography ?
20 3.89 3.89 4.00
History ?
12 3.58 3.67 3.75
Kinesiology ?
15 3.84 3.87 4.00
Languages & Linguistics ?
10 4.00 4.00 4.00
Liberal Studies
? 8 3.67 3.67 3.83
Mathematics & Statistics ?
33 4.00 4.00 4.00
Philosophy ? 3 3.50 3.50 4.00
Physics ? 28 3.87 3.89 4.00
Political Science ?
18 3.89 3.89 4.00
Psychology ? 30 4.00 4.00 4.00
Resource & Environ. Mgiut. ?
36 3.78 3.83 3.86
Sociology & Anthropology ?
11 4.00 4.00 4.00
Special Arrangements ?
8 4.00 4.00 4.00
Women's Studies ?
0 no students meet
Totals ? 830 3.87 3.92 4.00
•I
I
Semester 92-2
I
CGPA CGPA CGPA
Aver. Med. Wted.
3.84 3.89 3.85
3.68 3.75 3.65
3.46 3.50 3.47
3.53 3.56 3.54
3.78 3.80 3.78
3.61 3.61 3.60
3.67 3.61 3.67
3.83 3.92 3.84
3.44 3.40 3.42
3.74 3.78 3.73
3.56 3.67 3.56
3.59 3.67 3.62
3.68 3.67 3.64
3.51 3.50 3.55
3.69 3.77 3.66
3.75 3.95 3.72
3.63 3.67 3.62
3.77 3.86 3.74
3.57 3.50 3.52
3.55 3.67 3.62
3.68 3.74 3.67
3.74 3.84 3.72
3.60 3.63 3.59
3.79 3.83 3.78
search
3.94 3.92
criteria
3.94
?
1
3.63 3.67 3.61
CGPA 25% = Lowest CGPA of the top 25% of students
?
I
CGPA Wted. = Average CGPA weighted by semester hours completed
CGPA Aver = Average CGPA unweighted by semester hours completed
CGPA Med. = Median CGPA ?
I
12 ?
1
Simon Fraser University
Citizenship of Students
Fall 1992
Countries 139 6.9%
Indonesia 11 0.5%
/ Germany 12 0.6%
...Hong Kong 16 0.8%
Ghana 17 0.8%
United Kingdom 27 1.3%
India 29 1.4%
U.S.A. 44 2.2%
P.R.C. 90 4.4%
nt Residents 197 9.7%
13
dgscit2
1
I.
I
1
1
I
I
I
I
p
I
I
1
I
I
1
p
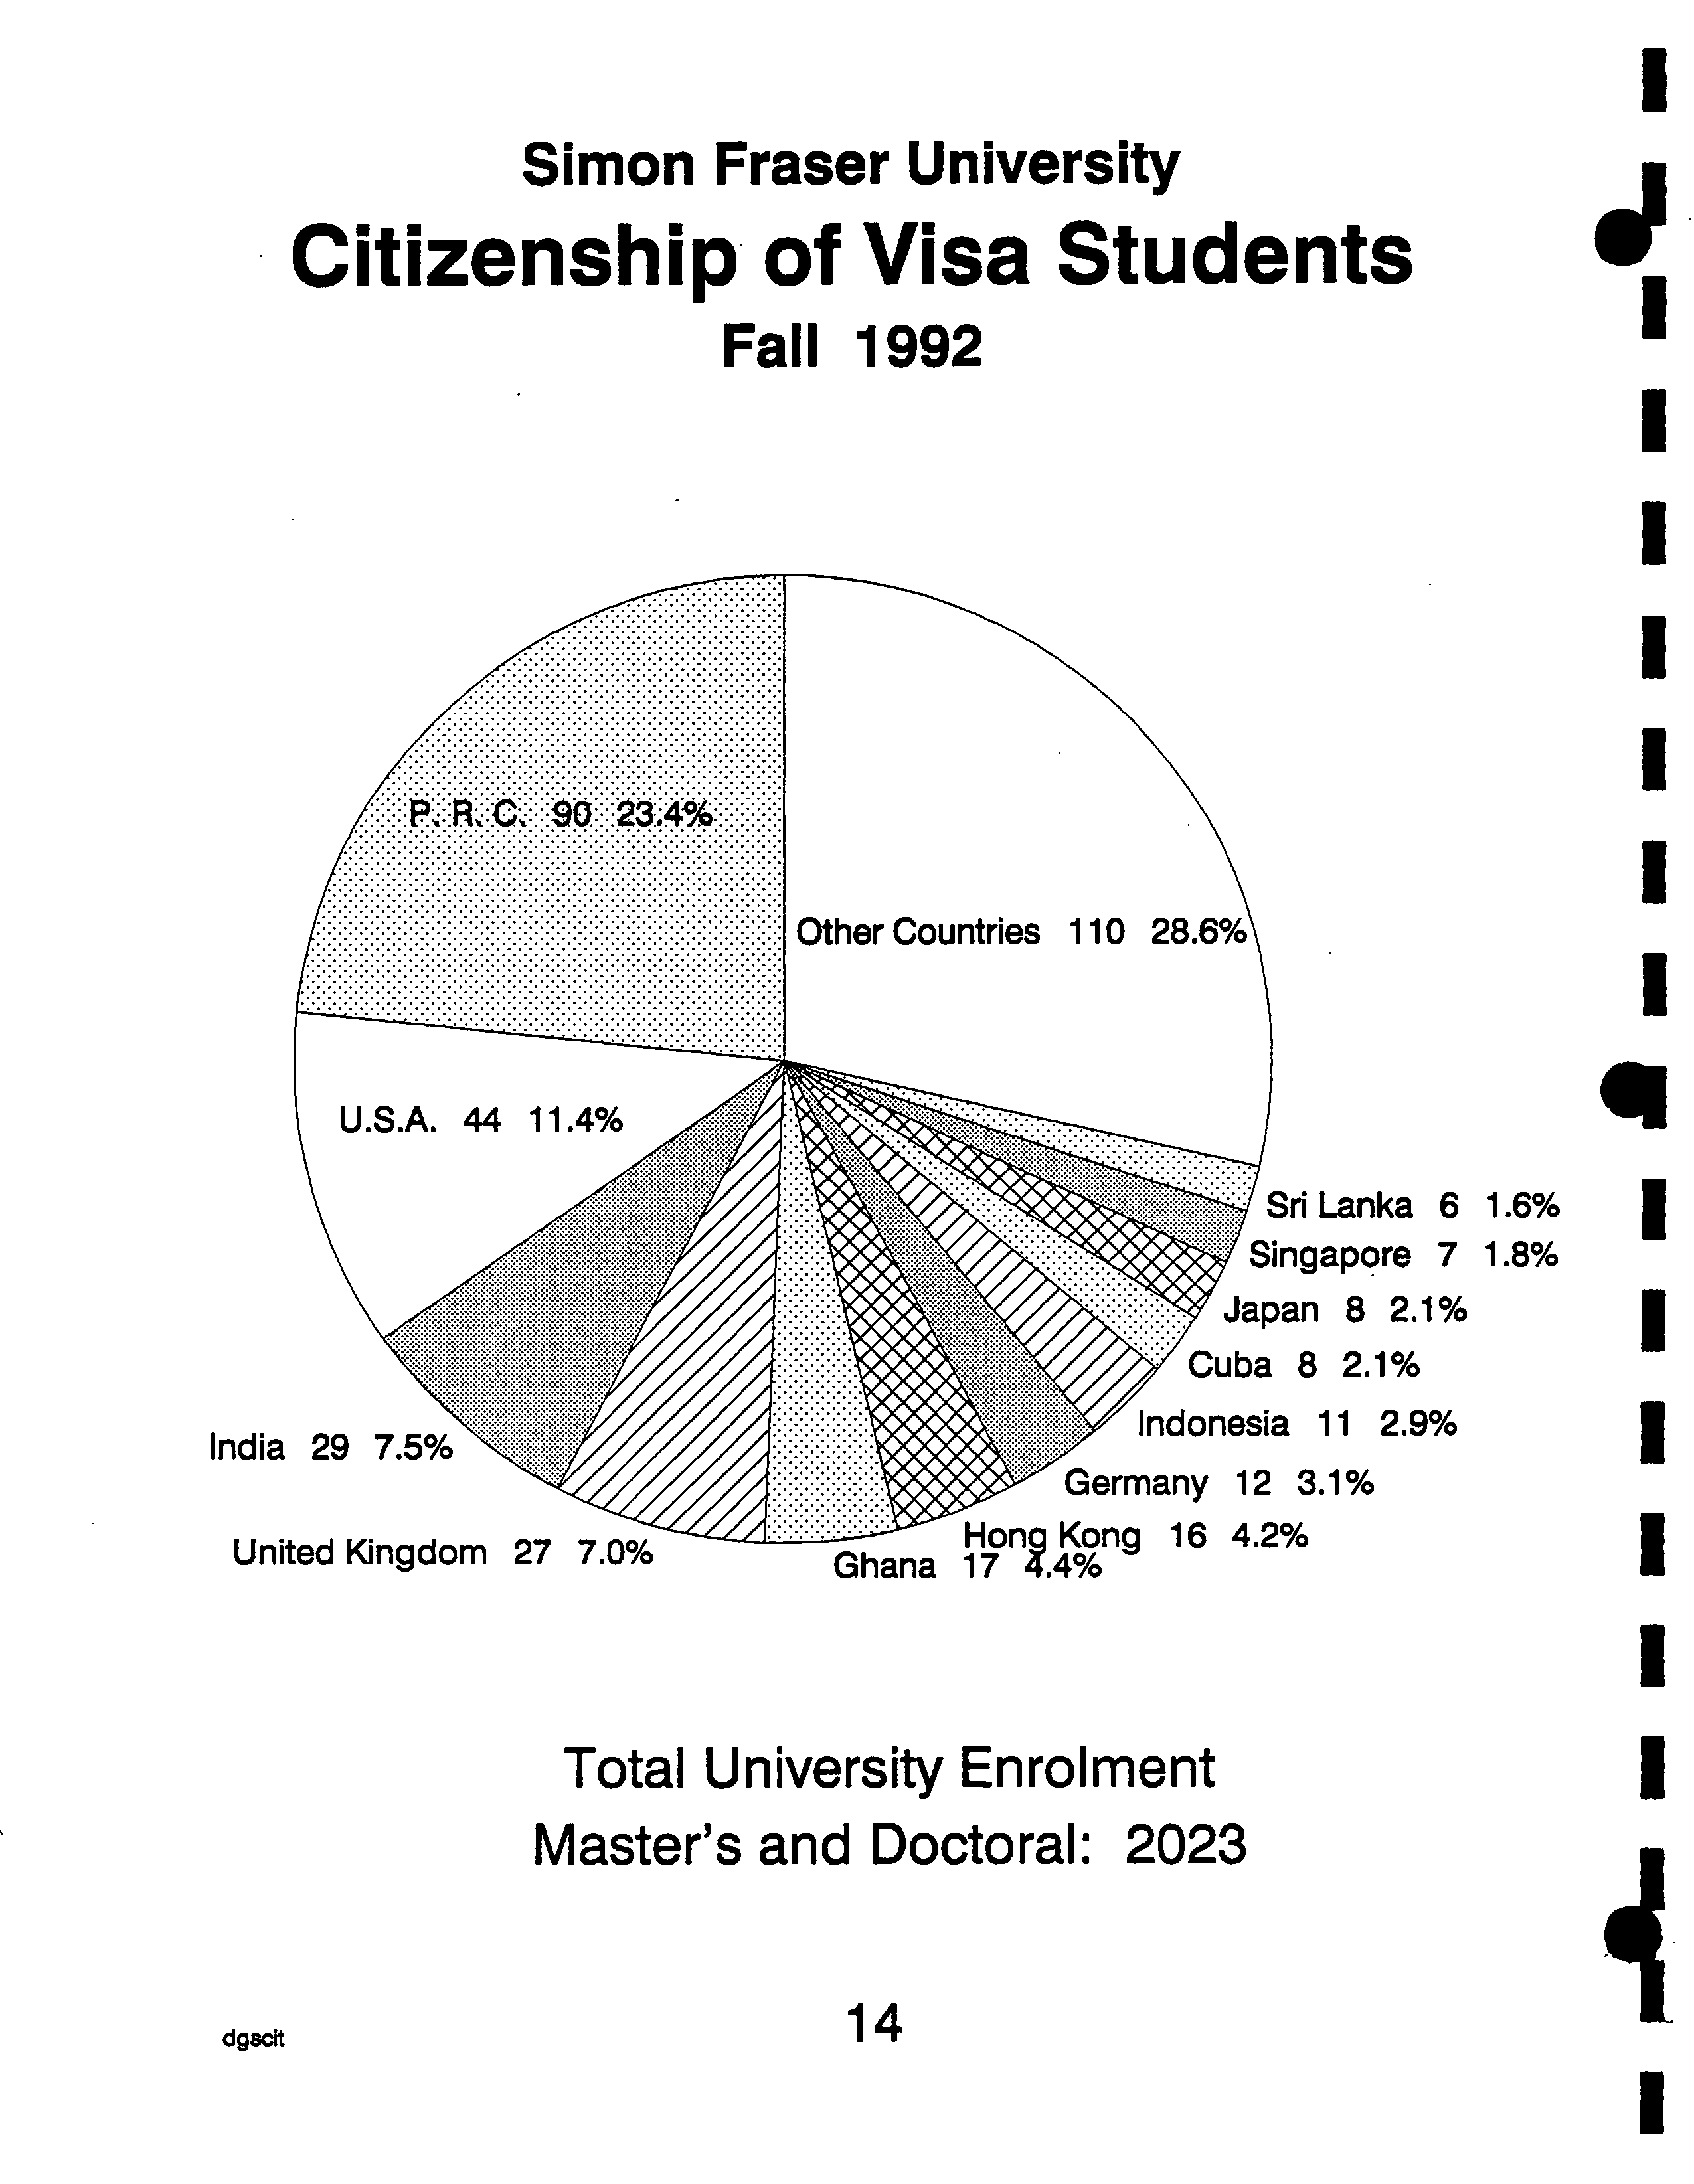
Simon Fraser University
Citizenship of Visa Students
Fall 1992
Total University Enrolment
Master's and Doctoral: 2023
dgsclt ?
14
I
I
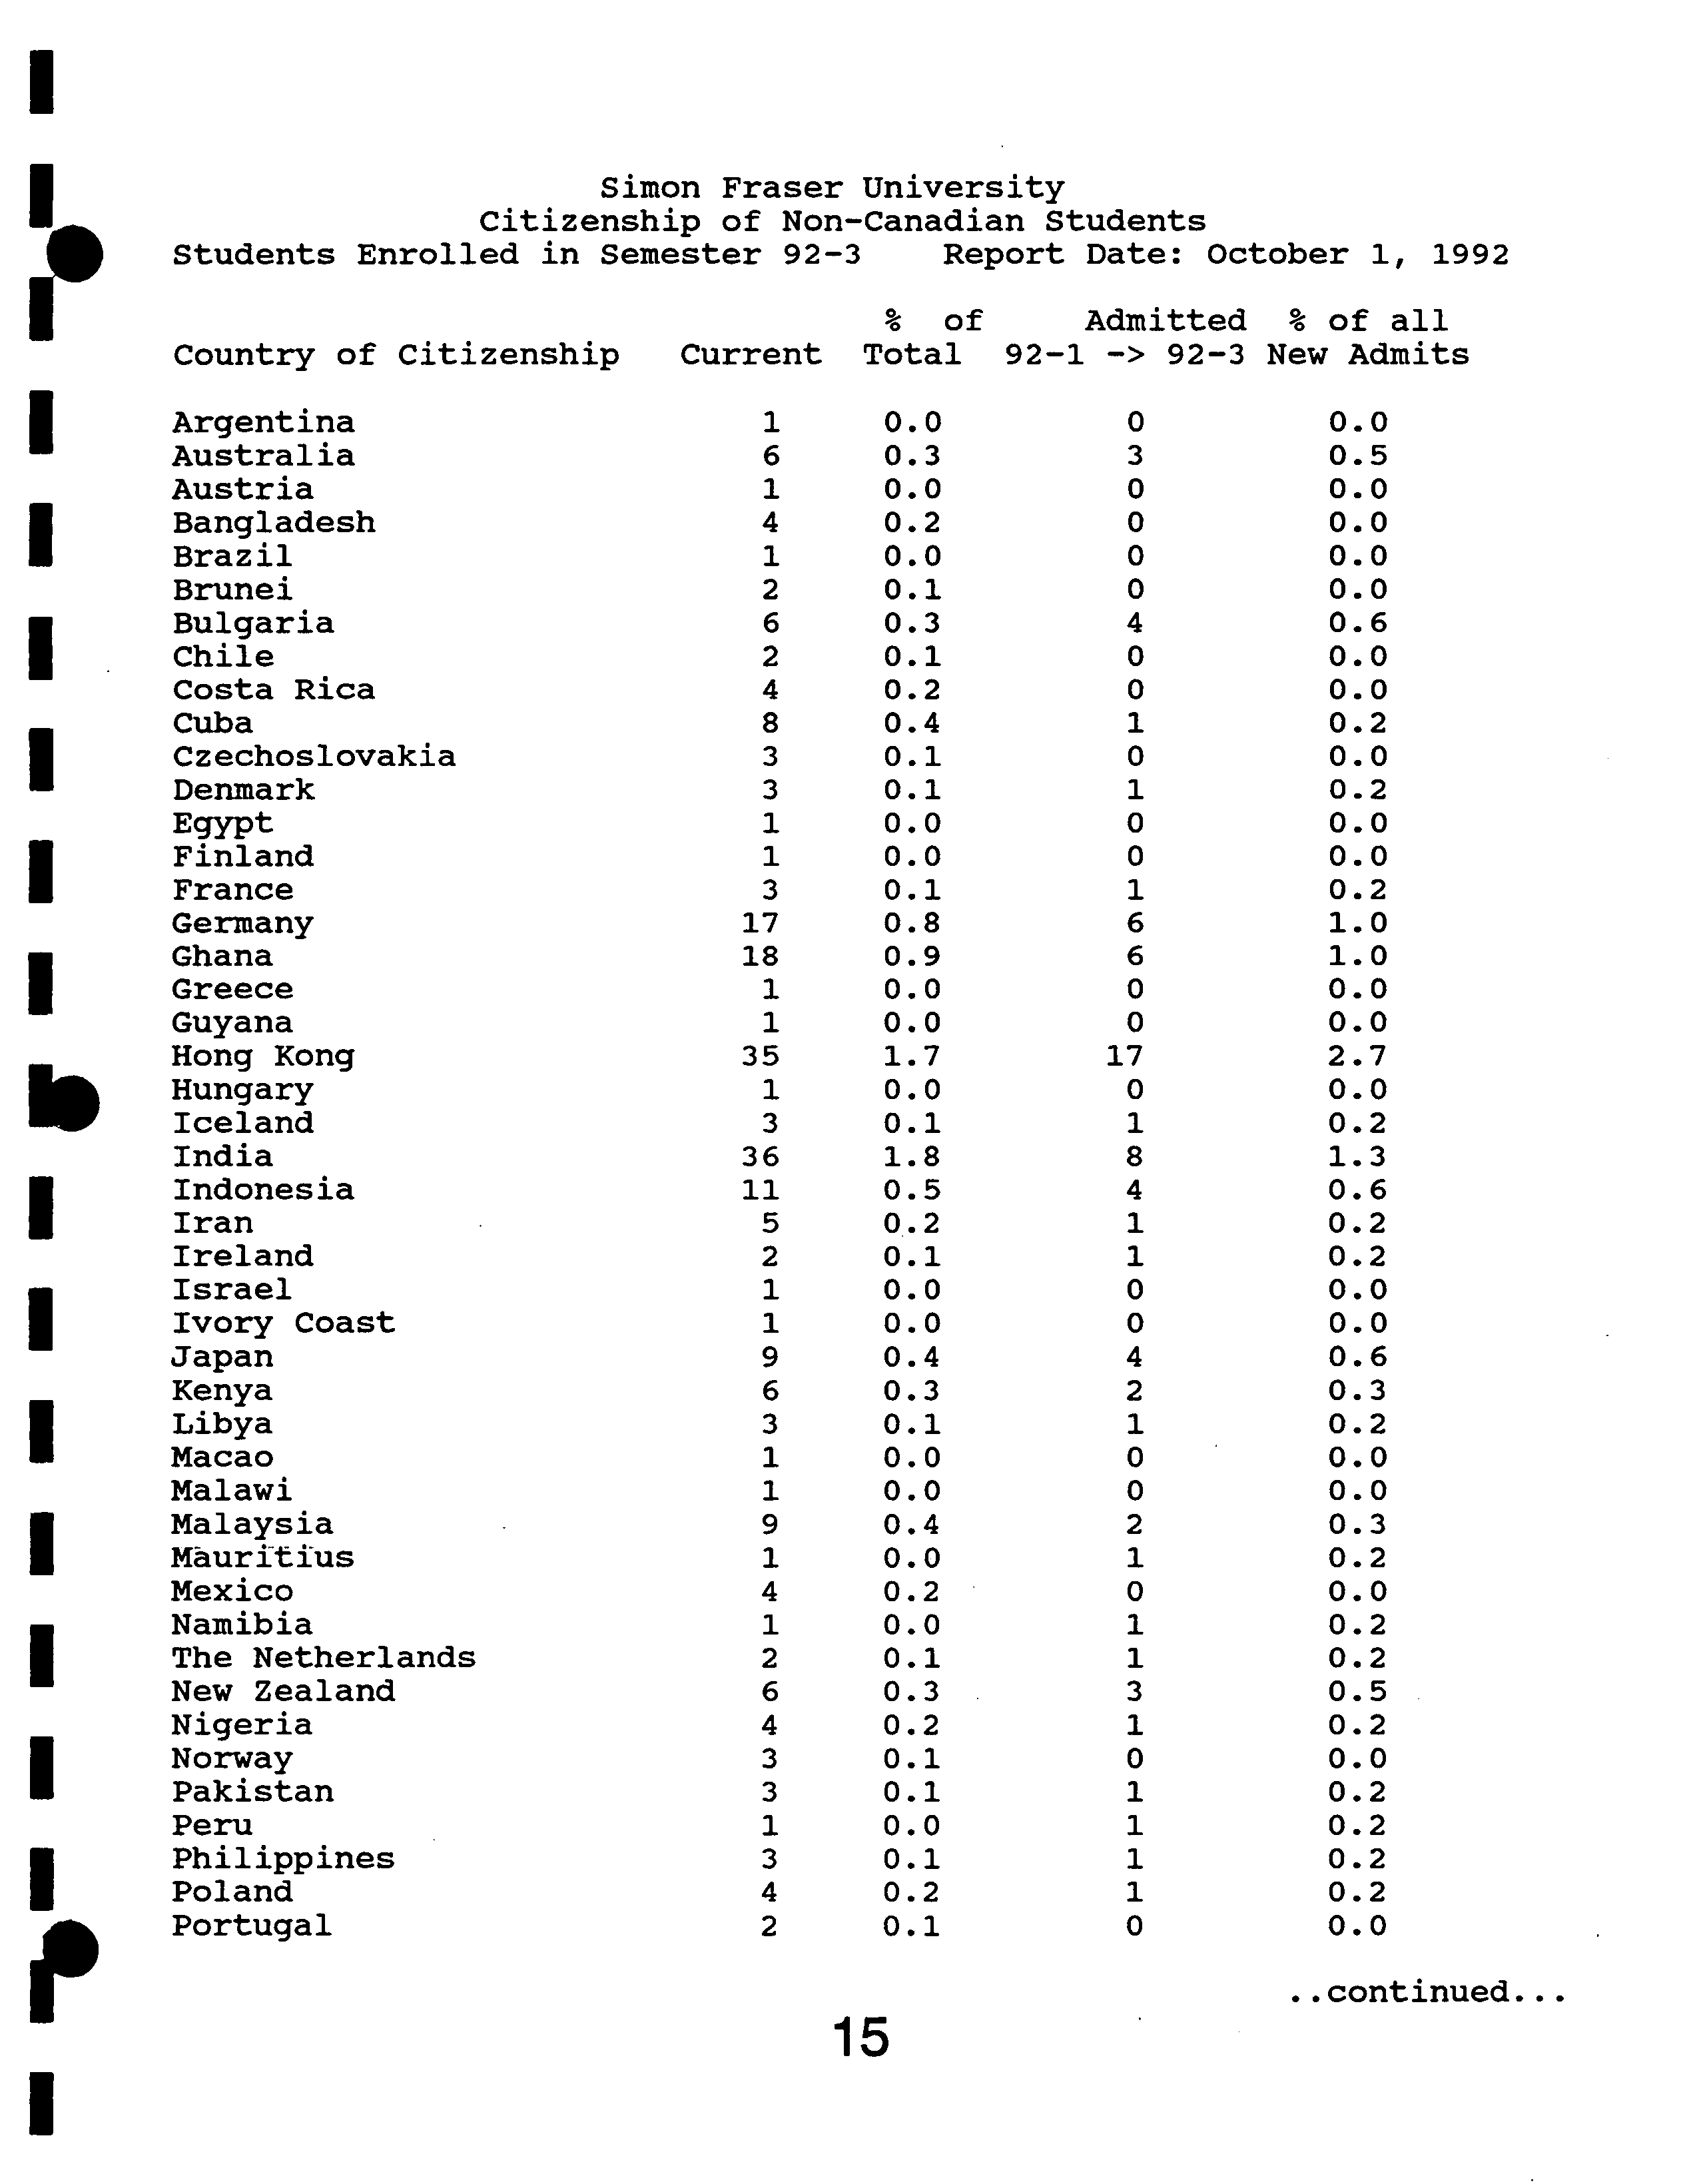
Simon Fraser
University
Citizenship
of Non-Canadian Students
Students Enrolled in Semester 92-3 ?
Report Date: October 1, 1992
%
?
of Admitted
% of all
Country of Citizenship ?
Current Total ?
92-1
-> 92-3
New Admits
I
Argentina
1
0.0
0
0.0
Australia
6
0.3
3
0.5
Austria
1
0.0
0
0.0
I
Bangladesh
4
0.2
0
0.0
Brazil
1
0.0
0
0.0
Brunei
2
0.1
0
0.0
Bulgaria
6
0.3
4
0.6
I
Chile
2
0.1
0
0.0
Costa Rica
4
0.2
0
0.0
I
Cuba
Czechoslovakia
8
3
0.4
0.1
1
0
0.2
0.0
Denmark
3
0.1
1
0.2
Egypt
1
0.0
0
0.0
I
Finland
1
0.0
0
0.0
France
3
0.1
1
0.2
Germany
17
0.8
6
1.0
Ghana
18
0.9
6
1.0
I
Greece
1
0.0
0
0.0
Guyana
1
0.0
0
0.0
Hong Kong
35
1.7
17
2.7
b
Hungary
1
0.0
0
0.0
Iceland
3
0.1
1
0.2
India
36
1.8
8
1.3
Indonesia
11
0.5
4
0.6
I
Iran
5
0.2
1
0.2
Ireland
2
0.1
1
0.2
Israel
1
0.0
0
0.0
I
Ivory Coast
1
0.0
0
0.0
Japan
9
0.4
4
0.6
Kenya
6
0.3
2
0.3
I
Libya
3
0.1
1
0.2
Macao
1
0.0
0
0.0
Malawi
1
0.0
0
0.0
Malaysia
9
0.4
2
0.3
I
MàuritIus
1
0.0
1
0.2
Mexico
4
0.2
0
0.0
I
Namibia
The Netherlands
1
2
0.0
0.1
1
1
0.2
0.2
New Zealand
6
0.3
3
0.5
Nigeria
4
0.2
1
0.2
I
Norway
3
0.1
0
0.0
Pakistan
3
0.1
1
0.2
Peru
1
0.0
1
0.2
Philippines
3
0.1
1
0.2
I
Poland
4
0.2
1
0.2
Portugal
2
0.1
0
0.0
,
.continued...
15
I
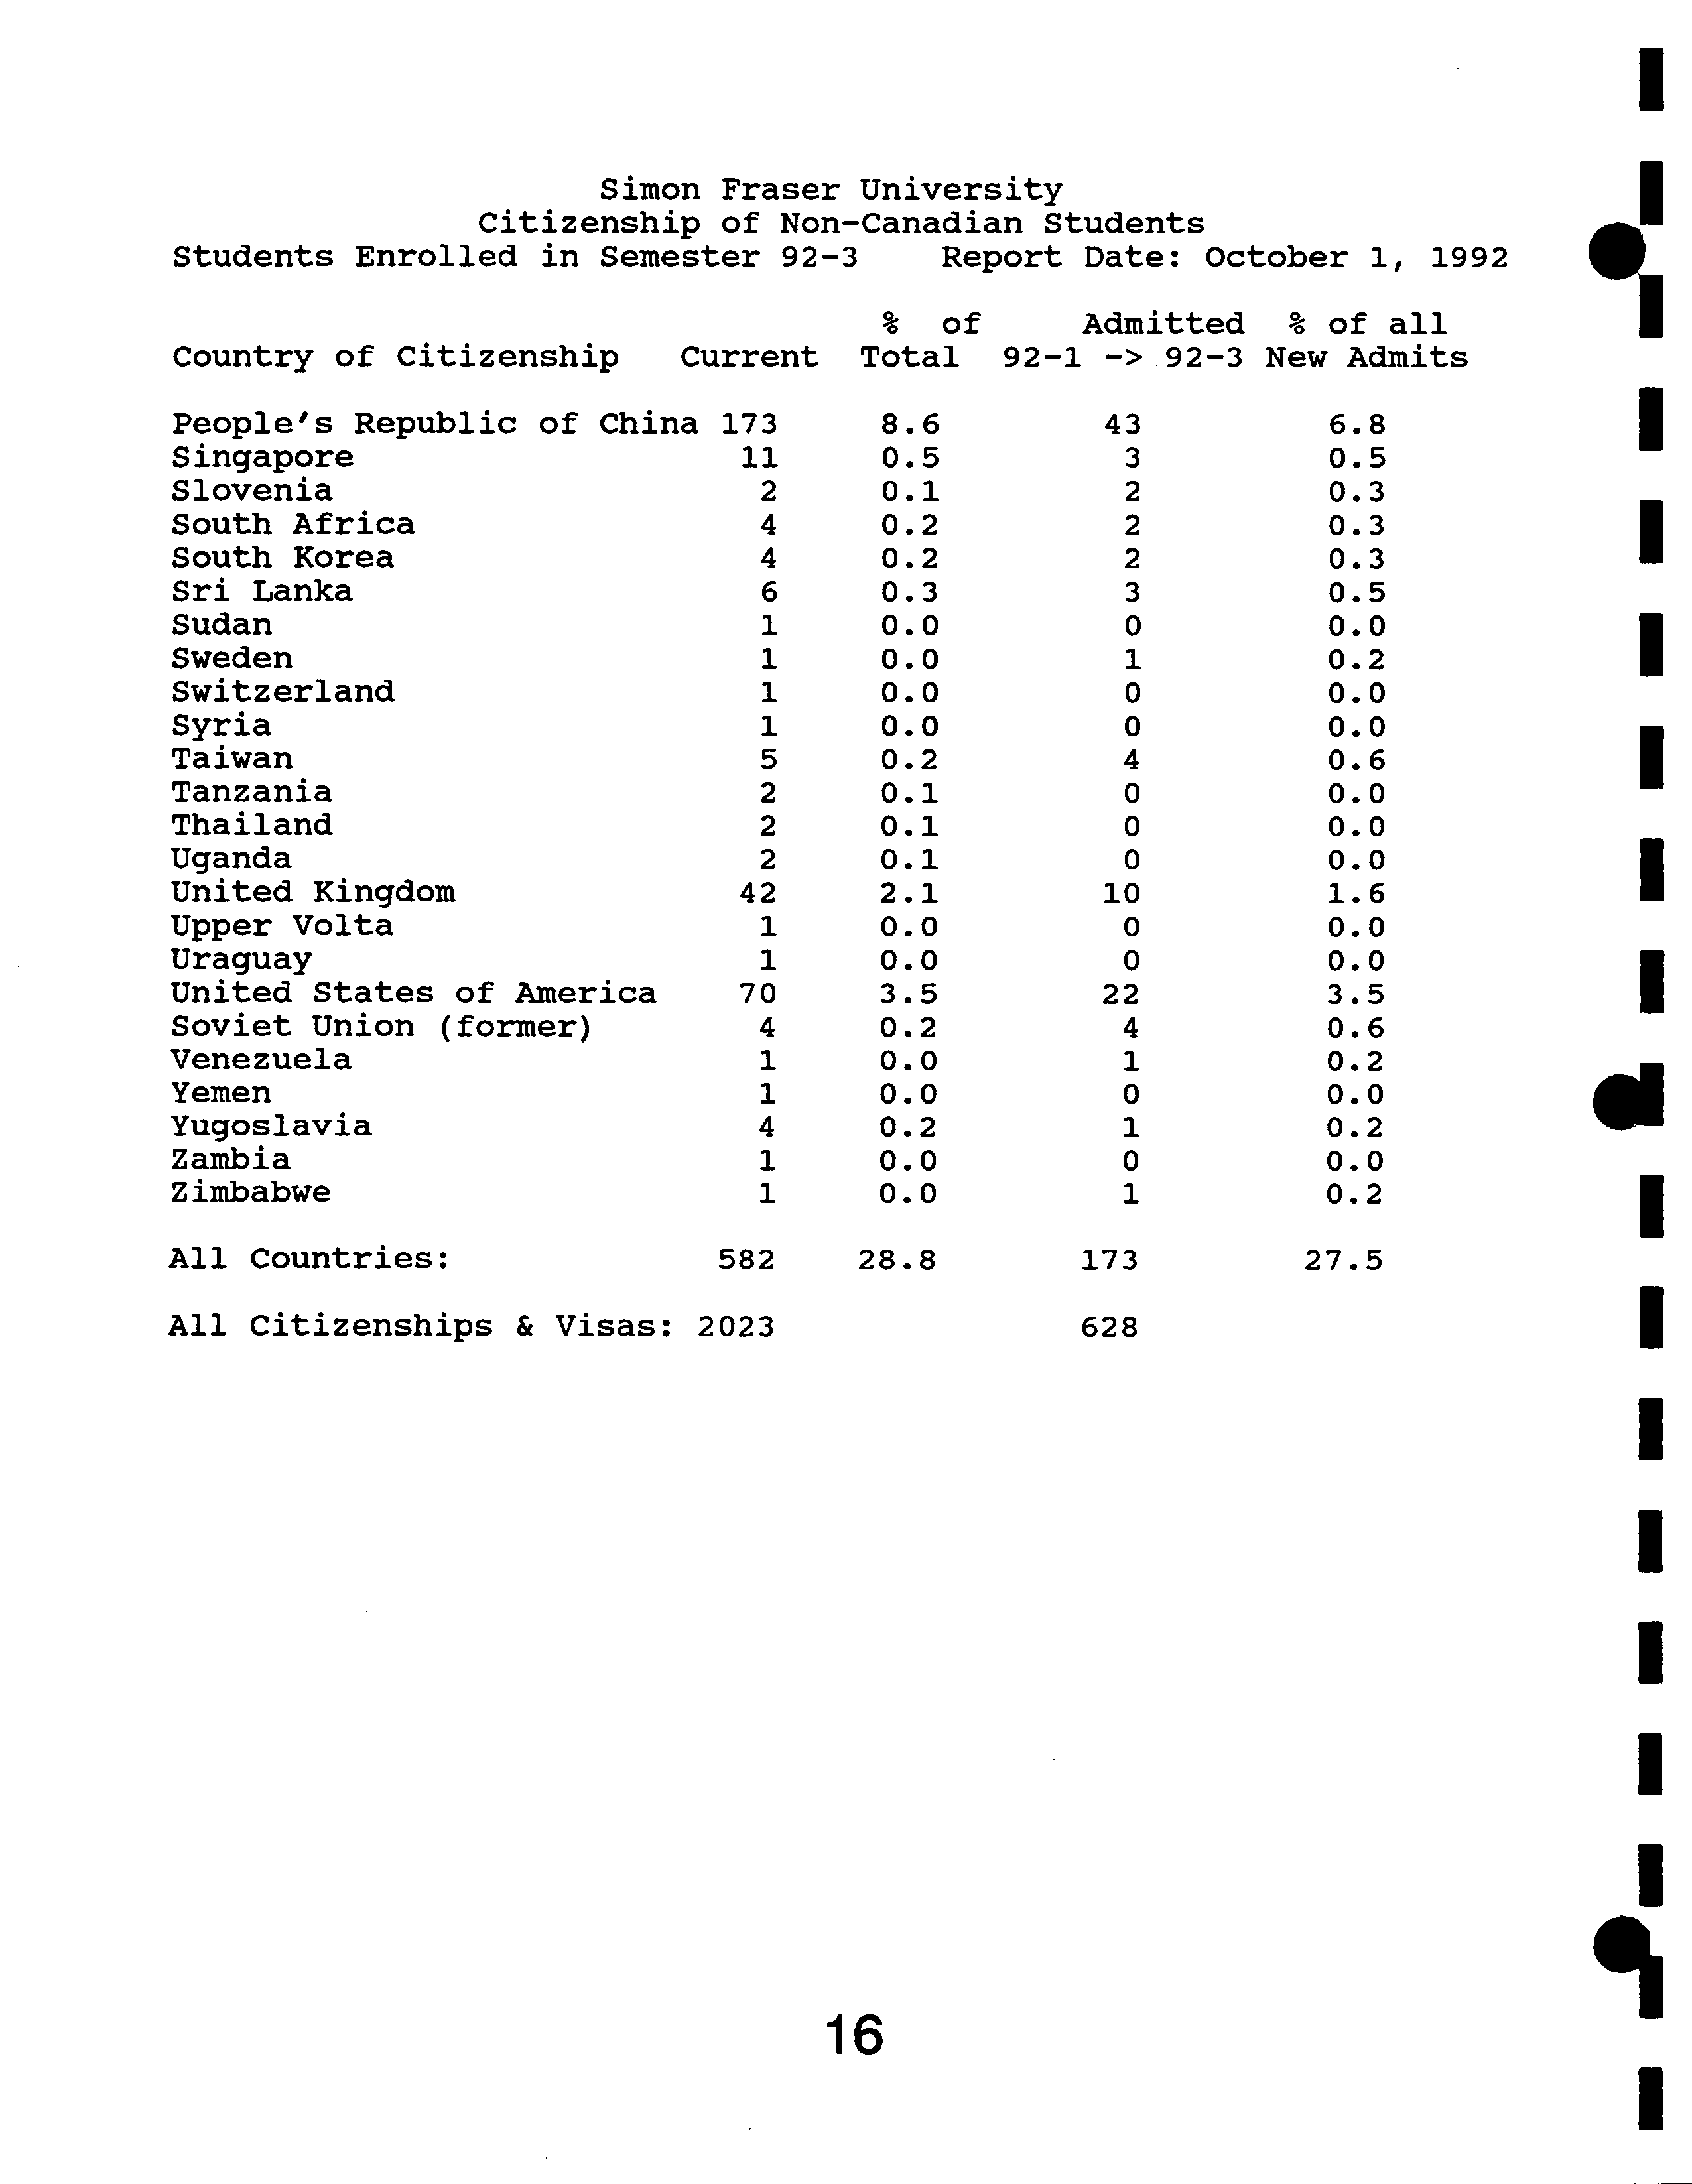
Simon Fraser University
Citizenship of Non-Canadian Students
Students Enrolled in Semester 92-3
?
Report Date: October 1, 1992
% ?
of
Admitted
% of all
Country of Citizenship Current
Total
92-1 ->.92-3 New Admits
People's Republic of China 173
8.6
43
6.8
Singapore
11
0.5
3
0.5
Slovenia
2
0.1
2
0.3
South Africa
4
0.2
2
0.3
South Korea
4
0.2
2
0.3
Sri Lanka
6
0.3
3
0.5
Sudan
1
0.0
0
0.0
Sweden
1
0.0
1
0.2
Switzerland
1
0.0
0
0.0
Syria
1
0.0
0
0.0
Taiwan
5
0.2
4
0.6
Tanzania
2
0.1
0
0.0
Thailand
2
0.1
0
0.0
Uganda
2
0.1
0
0.0
United Kingdom
42
2.1
10
1.6
Upper Volta
1
0.0
0
0.0
Uraguay
1
0.0
0
0.0
United States of America
70
3.5
22
3.5
Soviet Union (former)
4
0.2
4
0.6
Venezuela
1
0.0
1
0.2
Yemen
1
0.0
0
0.0
Yugoslavia
4
0.2
1
0.2
Zambia
1
0.0
0
0.0
Zimbabwe
1
0.0
1
0.2
All Countries:
582 28.8
173
27.5
All Citizenships & Visas:
2023
628
16
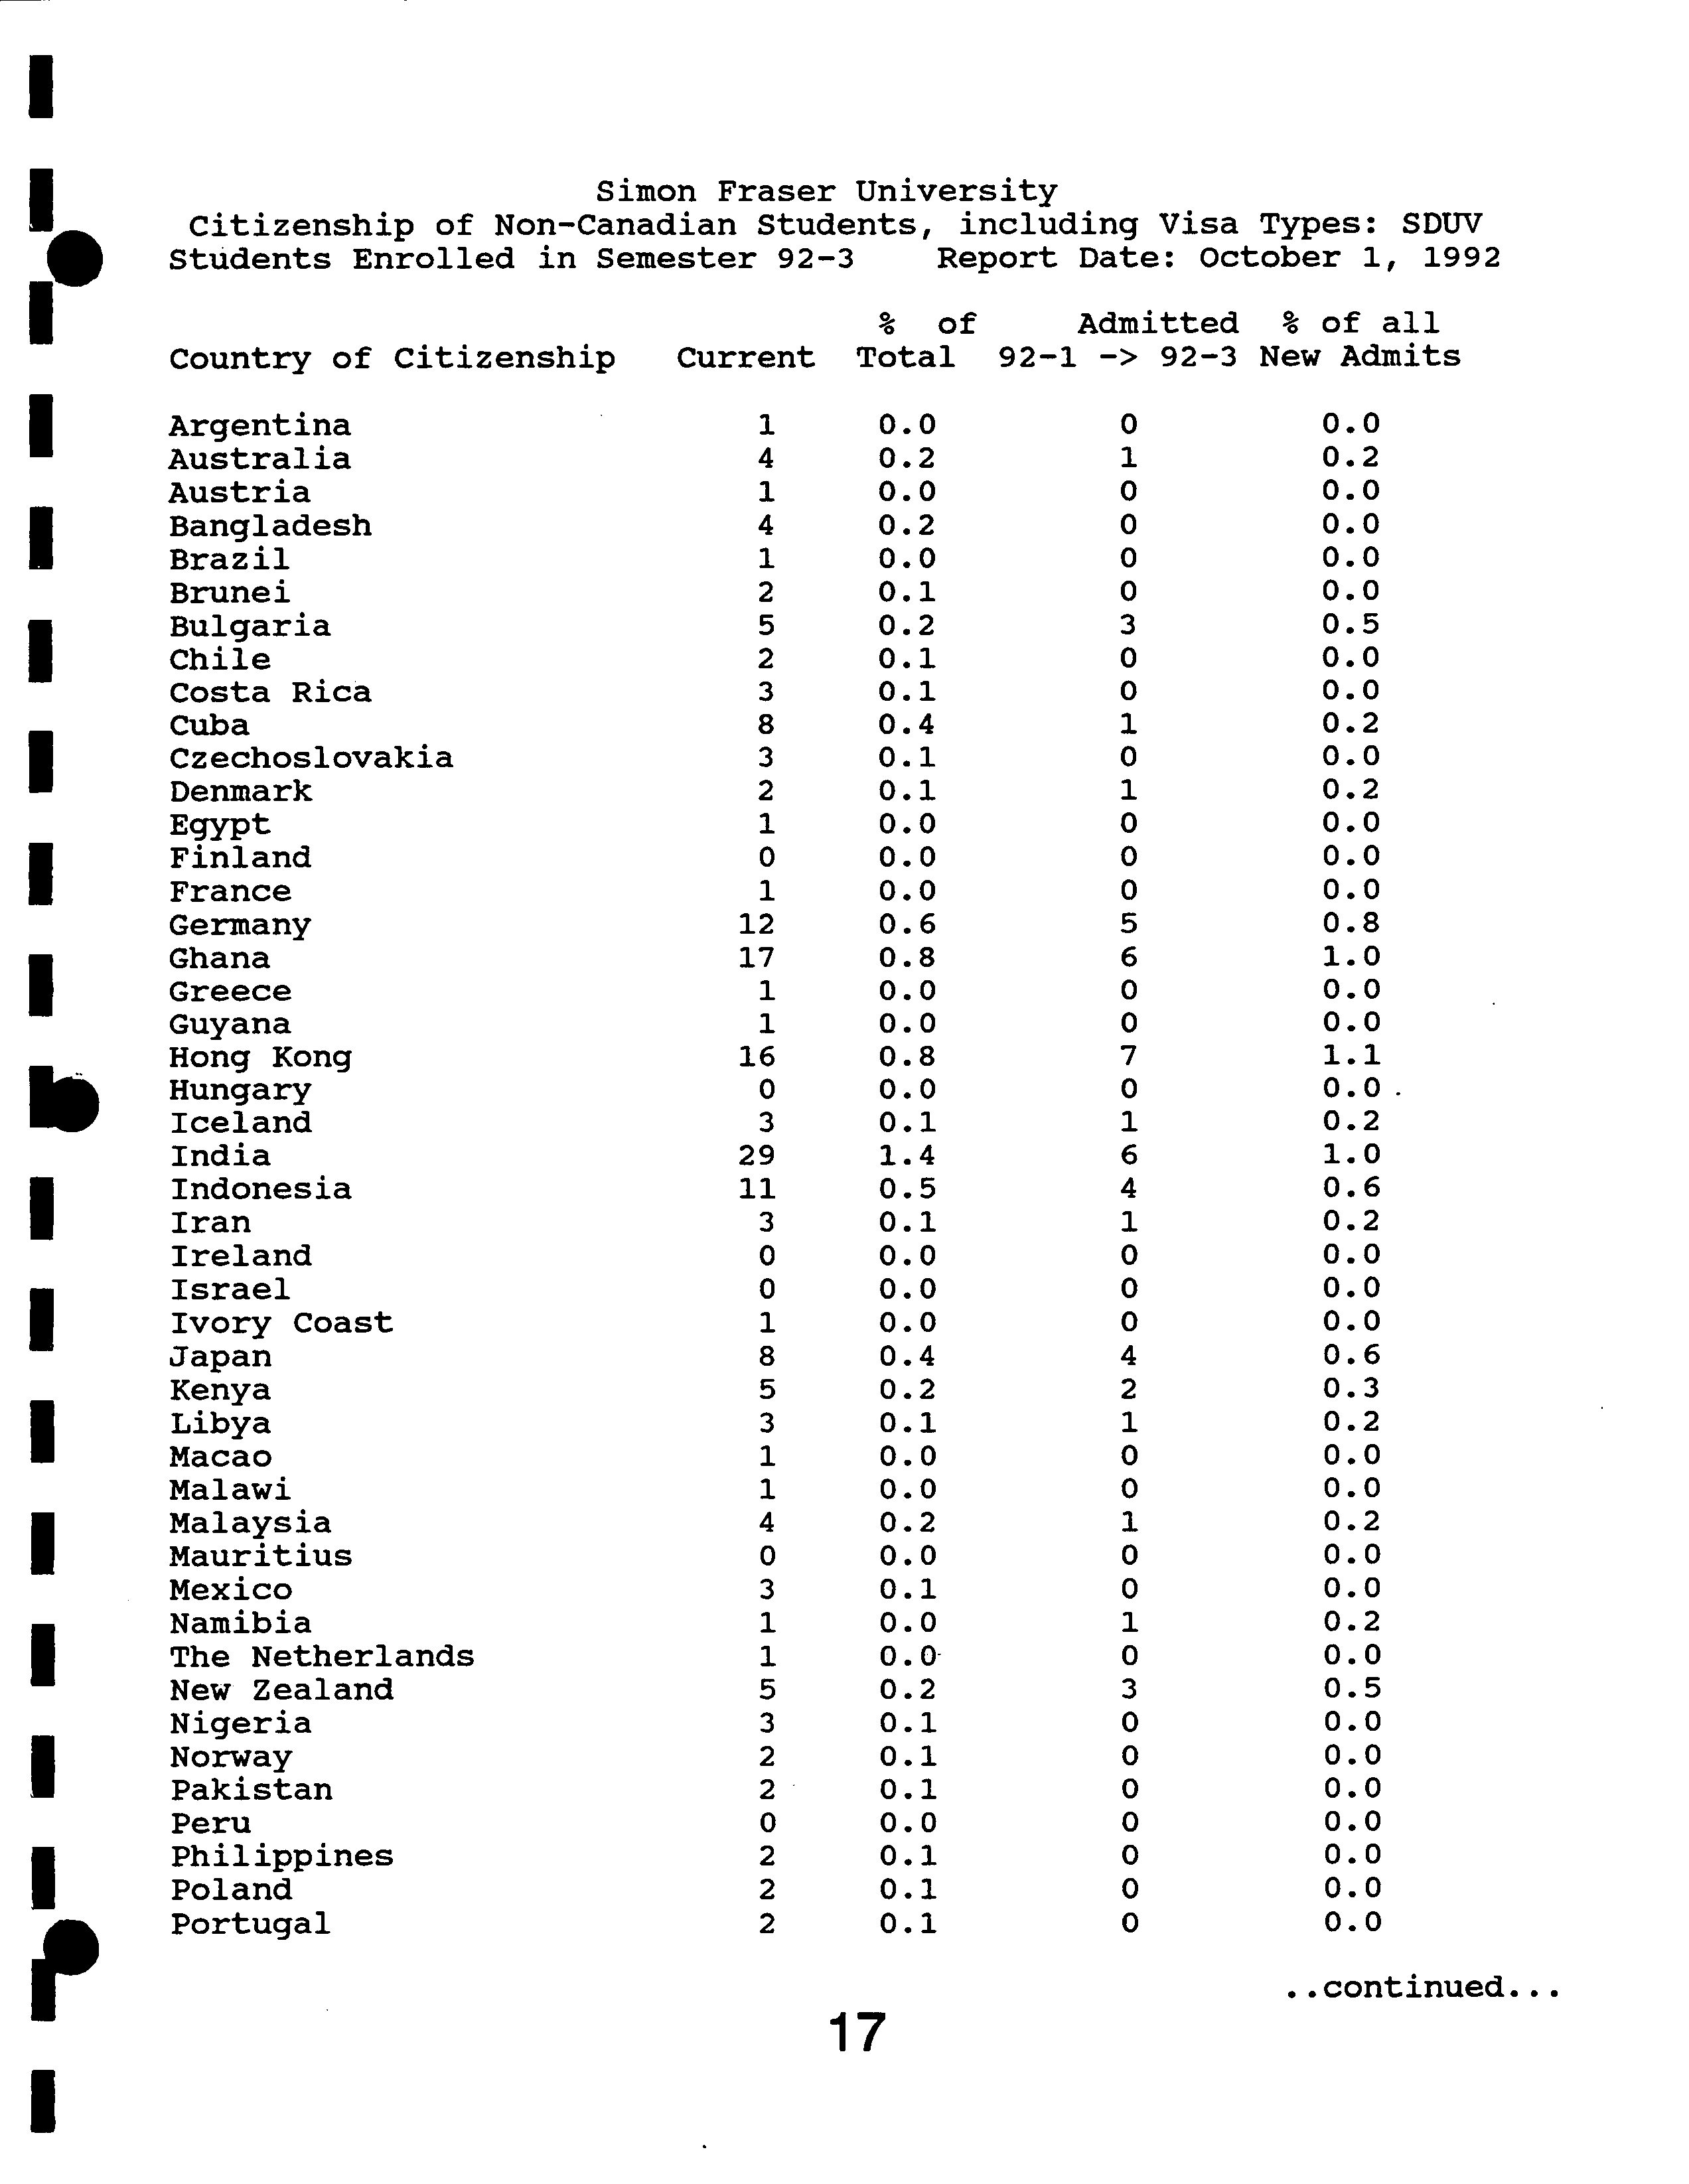
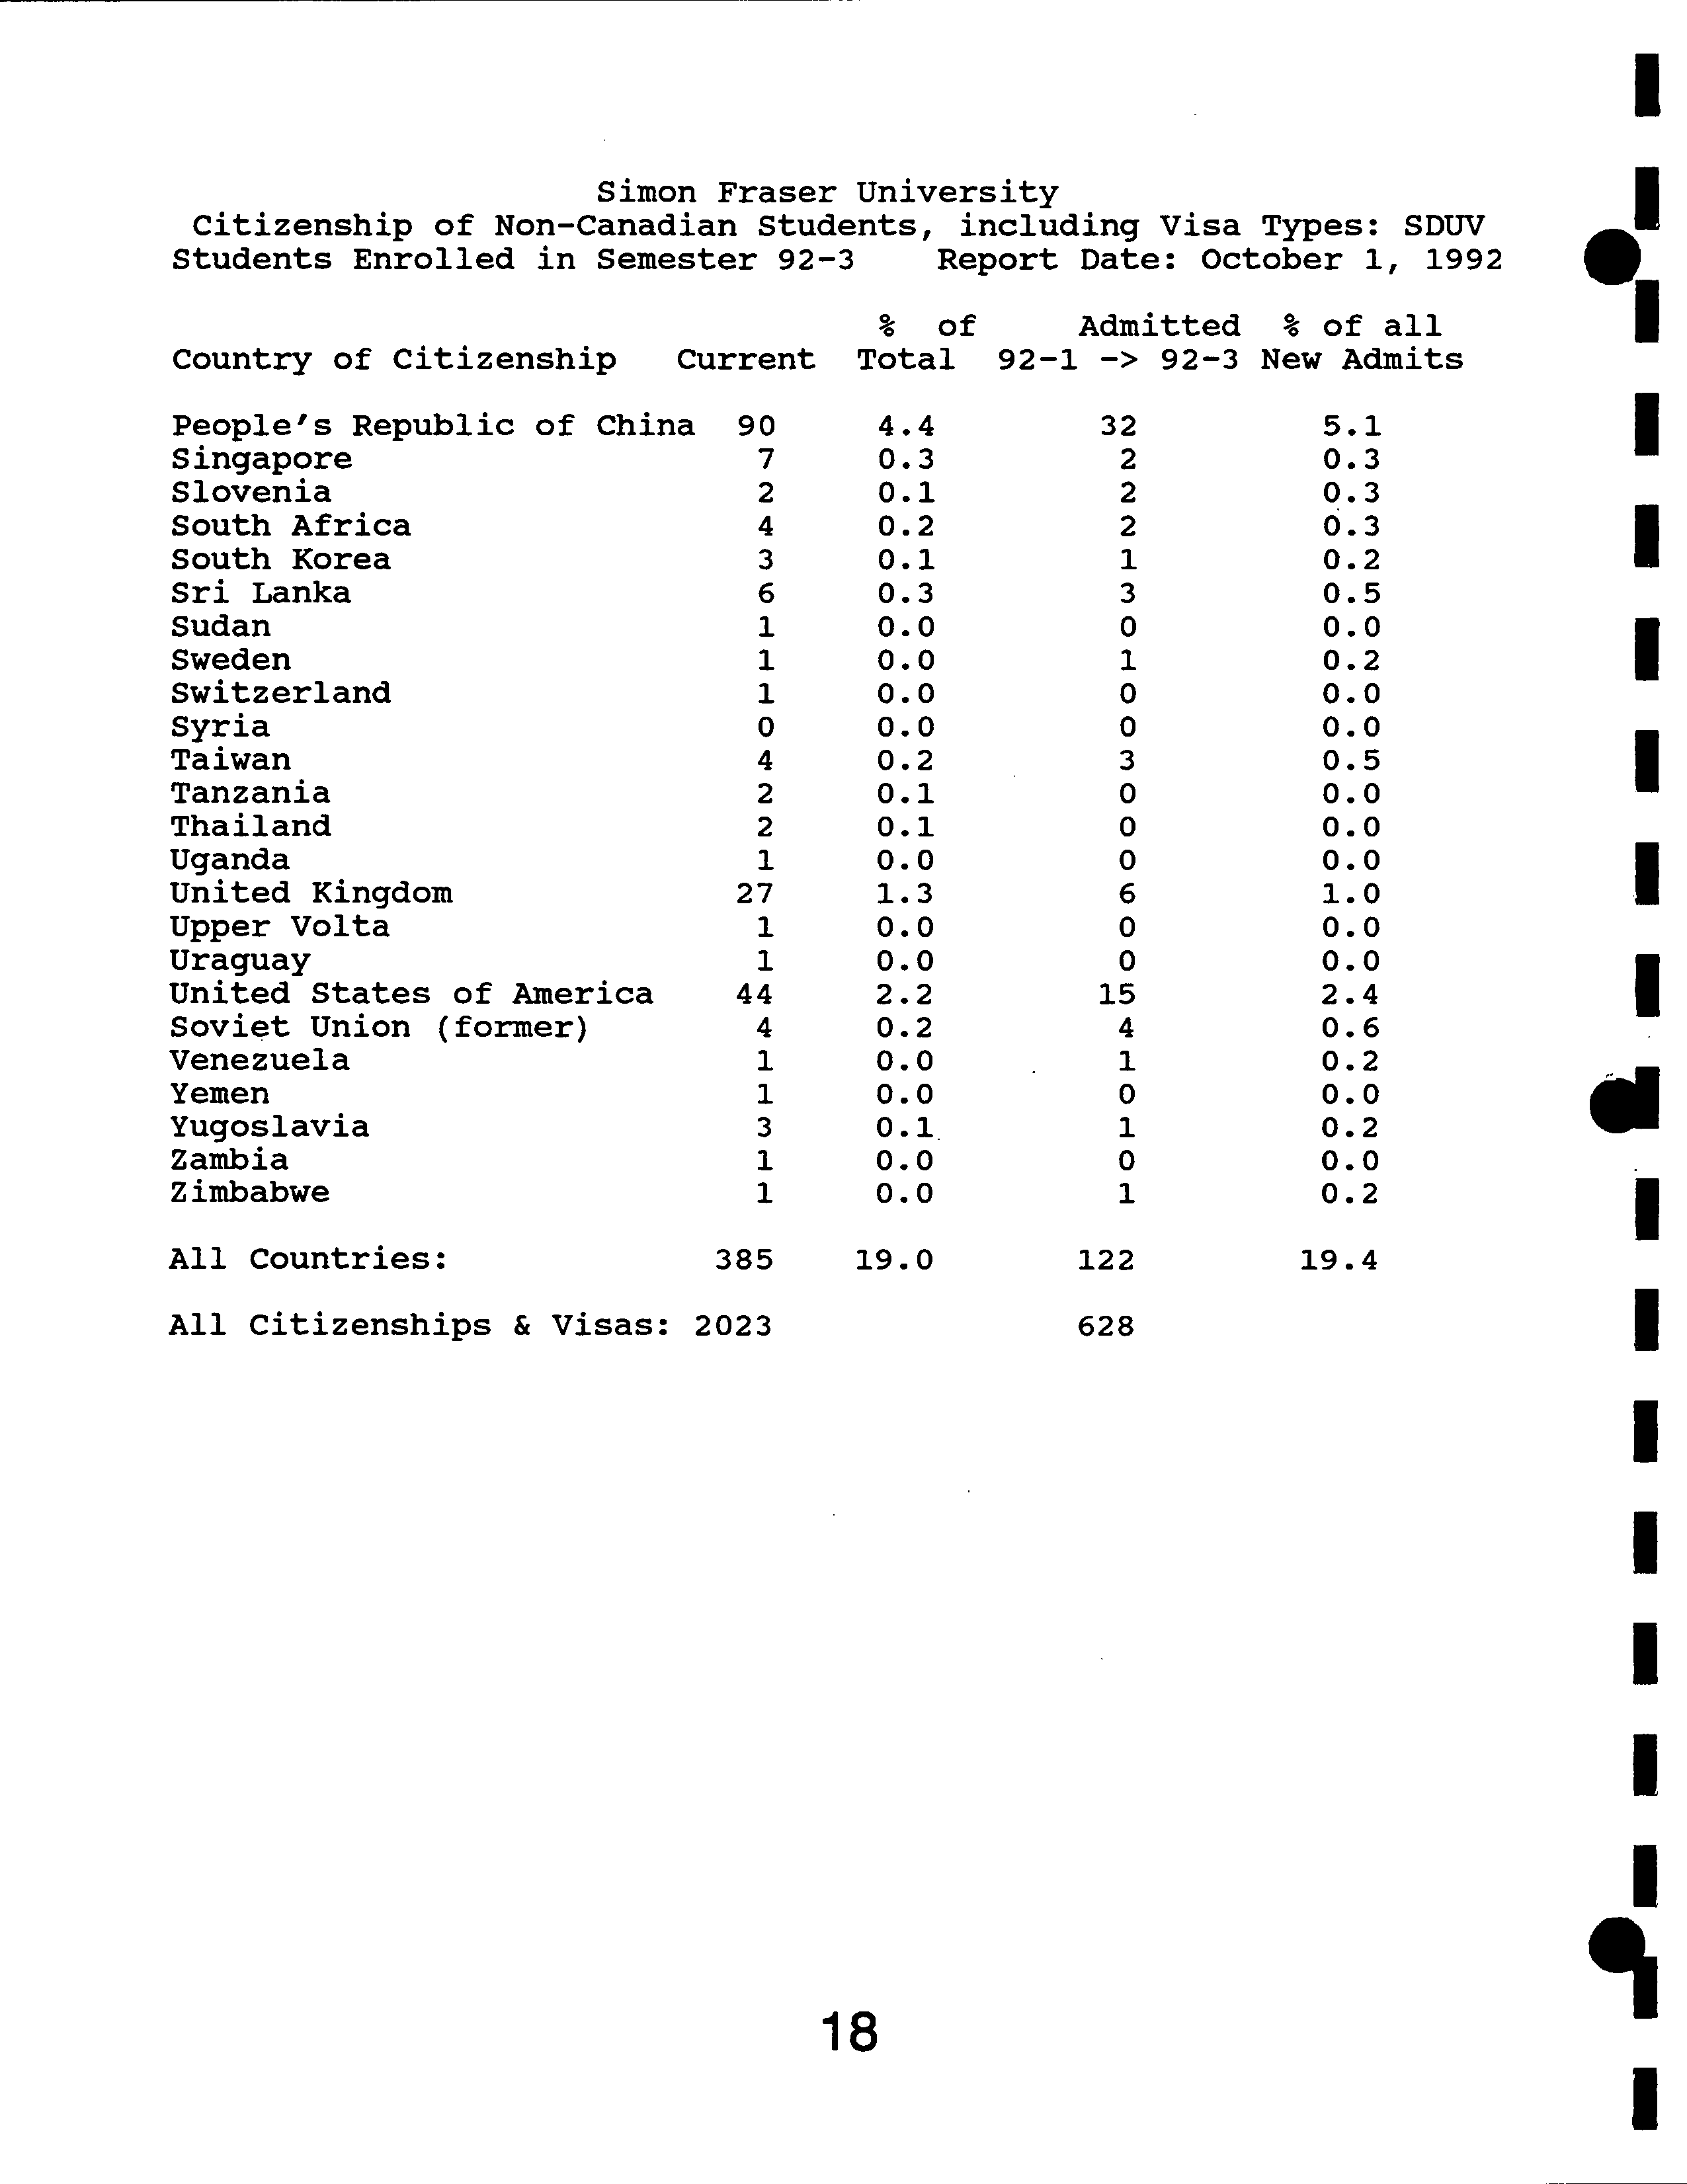
Simon Fraser University
Citizenship of Non-Canadian Students, including Visa Types: SDUV
?
Students Enrolled in Semester 92-3 ?
Report Date: October 1, 1992
% ?
of
Admitted
% of all
Country of Citizenship
Current
Total
92-1 -> 92-3
New Admits
Argentina
1
0.0
0
0.0
Australia
4
0.2
1
0.2
Austria
1
0.0
0
0.0
Bangladesh
4
0.2
0
0.0
Brazil
1
0.0
0
0.0
Brunei
2
0.1
0
0.0
Bulgaria
5
0.2
3
0.5
Chile
2
0.1
0
0.0
Costa Rica
3
0.1
0
0.0
Cuba
8
0.4
1
0.2
Czechoslovakia
3
0.1
0
0.0
Denmark
2
0.1
1
0.2
Egypt
1
0.0
0
0.0
Finland
0
0.0
0
0.0
France
1
0.0
0
0.0
Germany
12
0.6
5
0.8
Ghana
17
0.8
6
1.0
Greece
1
0.0
0
0.0
Guyana
1
0.0
0
0.0
Hong Kong
16
0.8
7
1.1
Hungary
0
0.0
0
0.0.
Iceland
3
0.1
1
0.2
India
29
1.4
6
1.0
Indonesia
11
0.5
4
0.6
Iran
3
0.1
1
0.2
Ireland
0
0.0
0
0.0
Israel
0
00
0
0.0
Ivory Coast
1
0.0
0
0.0
Japan
8
0.4
4
0.6
Kenya
5
0.2
2
0.3
Libya
3
0.1
1
0.2
Macao
1
0.0
0
0.0
Malawi
1
0.0
0
0.0
Malaysia
4
0.2
1
0.2
Mauritius
0
0.0
0
0.0
Mexico
3
0.1
0
0.0
Namibia
1
0.0
1
0.2
The Netherlands
1
0.0
0
0.0
New Zealand
5
0.2
3
0.5
Nigeria
3
0.1
0
0.0
Norway
2
0.1
0
0.0
Pakistan
2
0.1
0
0.0
Peru
0
0.0
0
0.0
Philippines
2
0.1
0
0.0
Poland
2
0.1
0
0.0
Portugal
2
0.1
0
0.0
• .continued...
17
I
Simon Fraser University ?
I
Citizenship of Non-Canadian Students, including Visa Types: SDUV ?
Students Enrolled in Semester 92-3
?
Report Date: October 1, 1992
% of
?
Admitted % of all ?
I
Country of Citizenship Current Total 92-1 -> 92-3 New Admits
People's Republic of China 90
Singapore
7
Slovenia
2
South Africa
4
South Korea
3
Sri Lanka
6
Sudan
1
Sweden
1
Switzerland
1
Syria
0
Taiwan
4
Tanzania
2
Thailand
2
Uganda
1
United Kingdom
27
Upper Volta
1
Uraguay
1
United States of America
44
Soviet Union (former)
4
Venezuela
1
Yemen
1
Yugoslavia
3
Zambia
1
Zimbabwe
1
All Countries: ?
385
All Citizenships & Visas: 2023
I
P.
I
I
I
•1
18
1
4.4
32
5.1
0.3
2
0.3
0.1
2
0.3
0.2
2
0.3
0.1
1
0.2
0.3
3
0.5
0.0
0
0.0
0.0
1
0.2
0.0
0
0.0
0.0
0.2
0
3
0.0
0.5
0.1
0
0.0
0.1
0
0.0
0.0
0
0.0
1.3
6
1.0
0.0
0
0.0
0.0
0
0.0
2.2
15
2.4
0.2
4
0.6
0.0
1
0.2
0.0
0
0.0
0.1
.
1
0.2
0.0
0
0.0
0.0
1
0.2
I
19.0
122
19.4
628
I
I
I
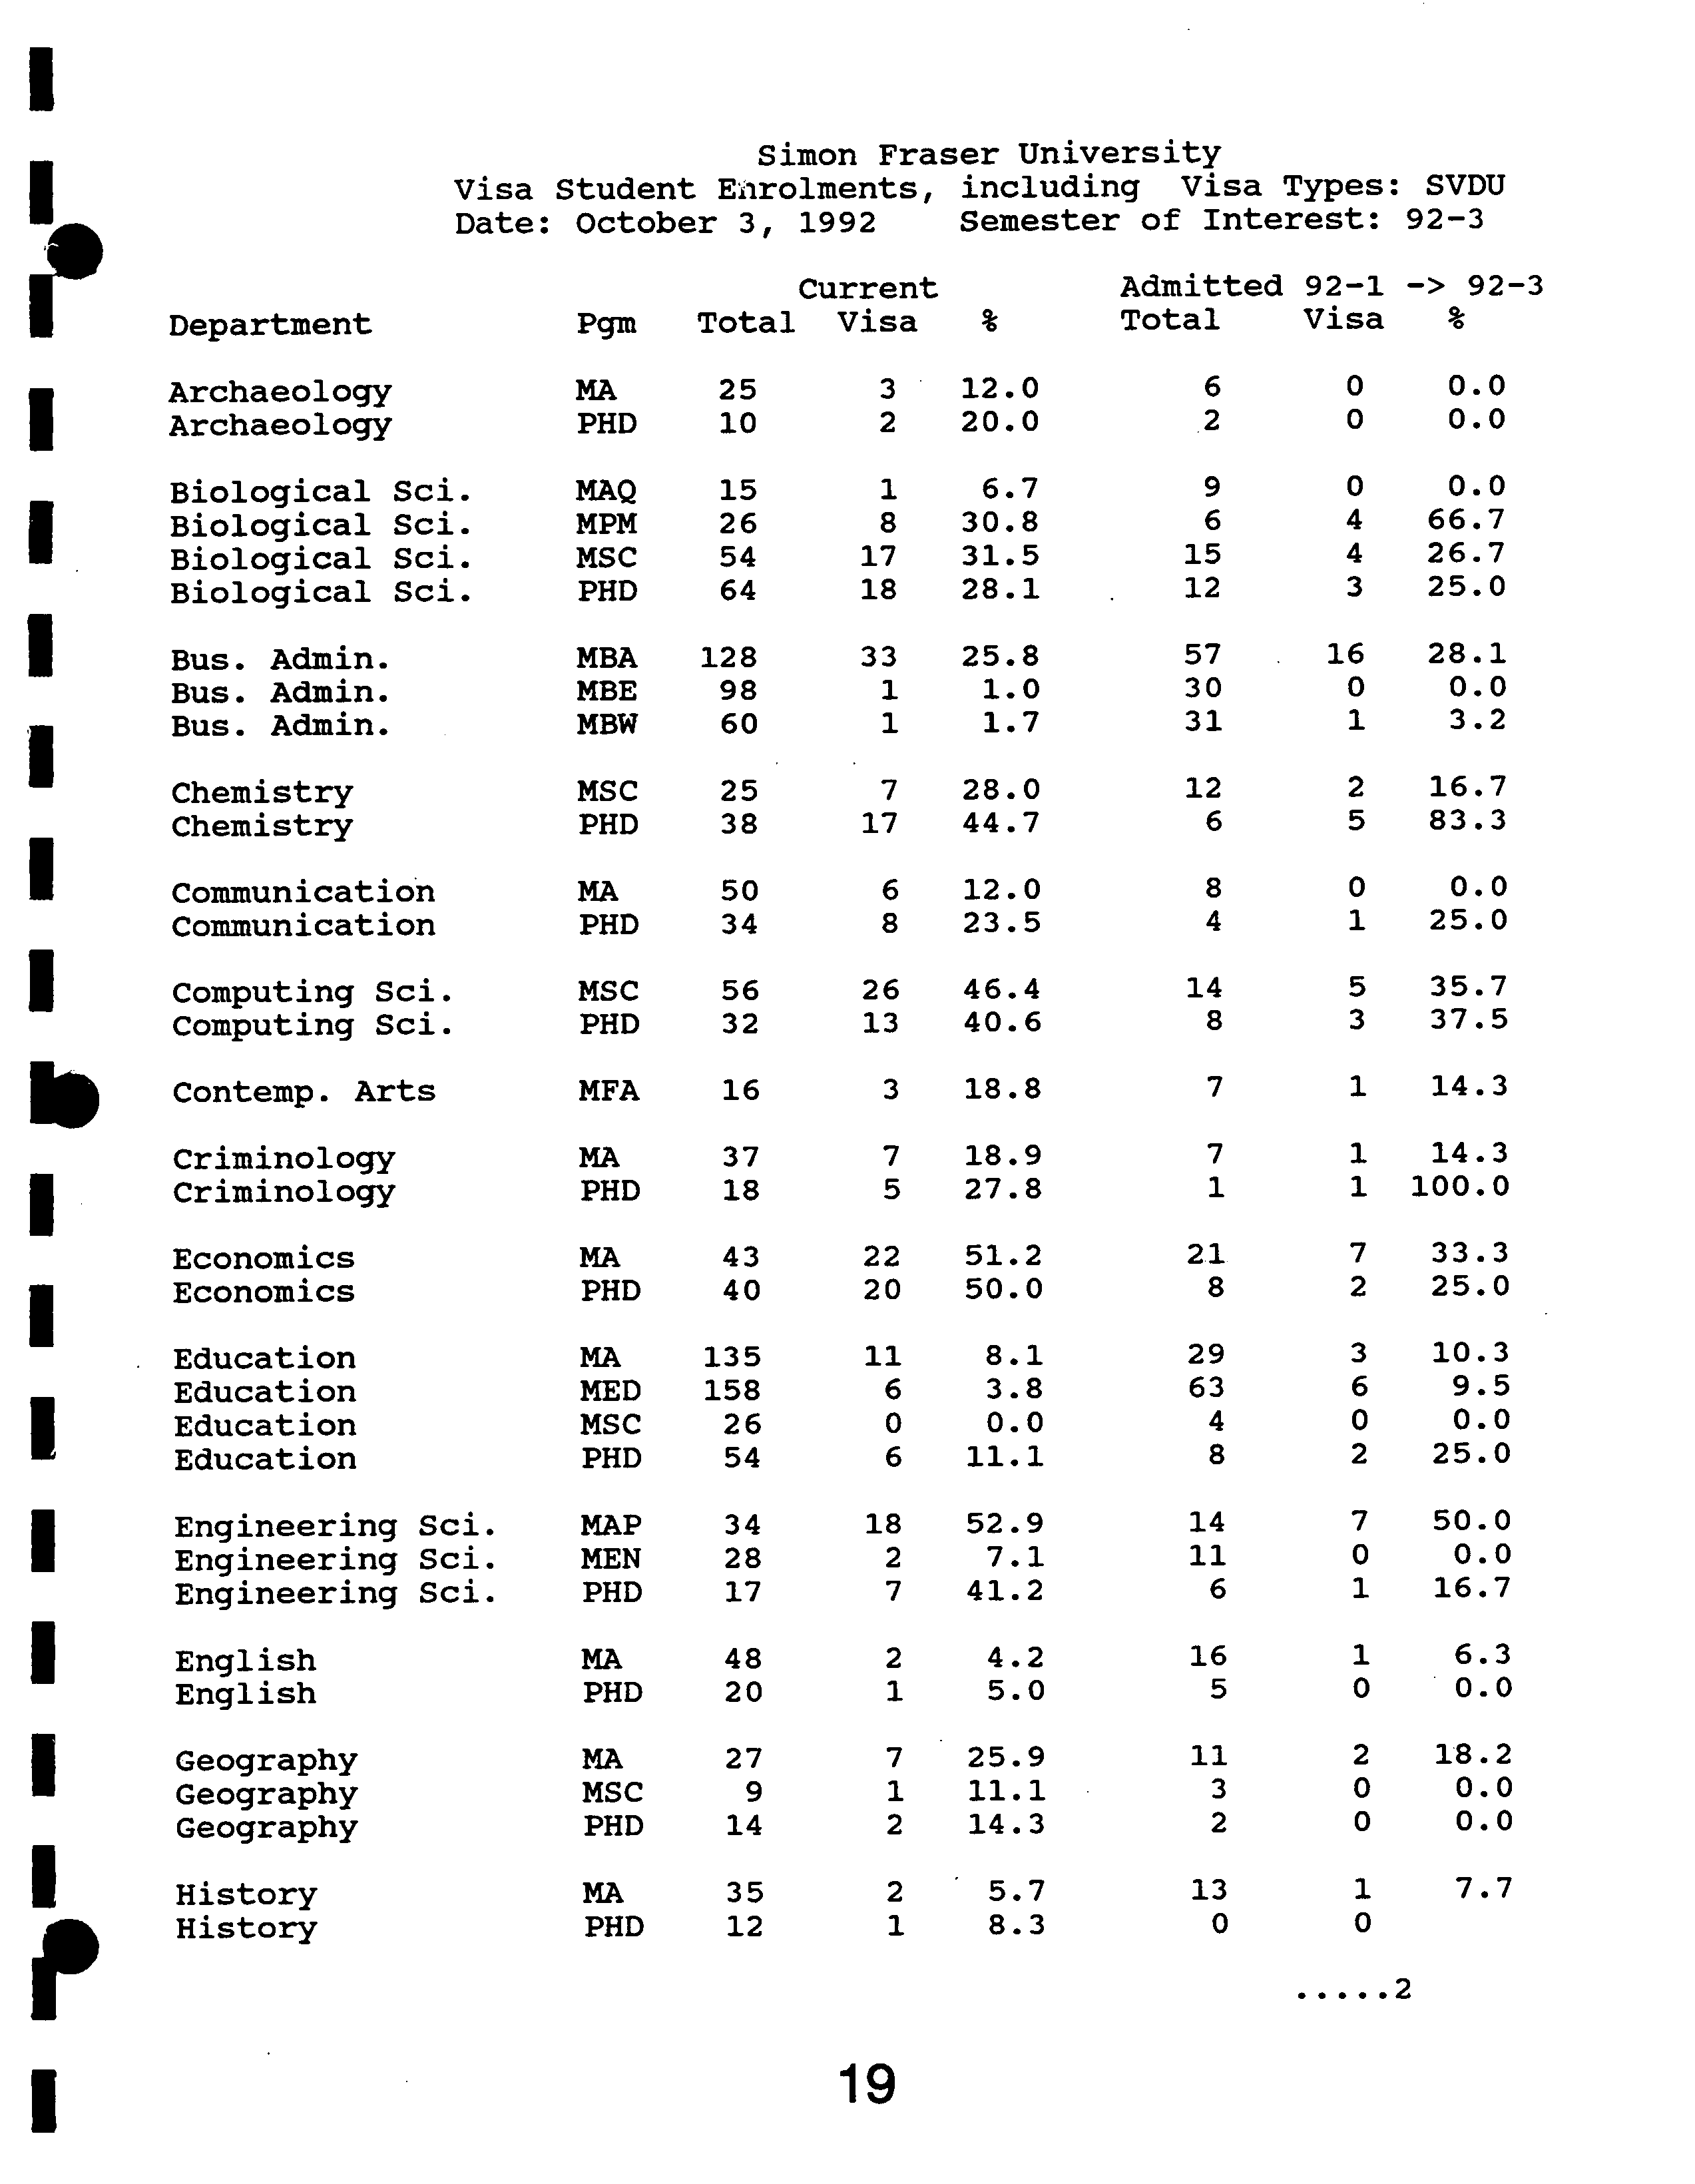
Simon Fraser University
fl
Visa Student Erolments, including Visa Types: SVDU
Date: October 3, 1992
?
Semester of Interest: 92-3
Current ?
Admitted 92-1 -> 92-3
Department ?
Pgm Total Visa %
?
Total ?
Visa %
I ?
Archaeology ?
MA ?
25 ?
3 ?
12.0
?
6 ?
0 ?
0.0
Archaeology ?
PHD ?
10 ?
2 ?
20.0 ?
2 ?
0 ?
0.0
Biological Sci.
?
MAQ ?
15 ?
1 ?
6.7
?
9 ?
0 ?
0.0
I
?
Biological Sci.
?
MPM ?
26 ?
8 ?
30.8 ?
6 ?
4 ?
66.7
Biological Sci.
?
MSC ?
54 ?
17 ?
31.5 ?
15 ?
4 ?
26.7
Biological Sd.
?
PHD ?
64 ?
18 ?
28.1 ?
12 ?
3 ?
25.0
1
?
Bus. Admin. ?
MBA
?
128 ?
33 ?
25.8 ?
57 ?
16 ?
28.1
Bus. Admin. ?
MBE ?
98 ?
1 ?
1.0 ?
30 ?
0 ?
0.0
I
Bus. Admin.
?
MBW ?
60 ?
1 ?
1.7 ?
31
?
1 ?
3.2
Chemistry ?
MSC
?
25
?
7 ?
28.0 ?
12
?
2 ?
16.7
I ?
Chemistry ?
PHD
?
38 ?
17 ?
44.7 ?
6
?
5 83.3
Communication ?
MA ?
50
?
6 ?
12.0 ?
8 ?
0 ?
0.0
Communication ?
PHD ?
34
?
8 ?
23.5 ?
4
?
1 25.0
I
Computing Sci.
?
MSC ?
56 ?
26 ?
46.4 ?
14
?
5 ?
35.7
Computing Sd.
?
PHD
?
32 ?
13 ?
40.6 ?
8 ?
3 ?
37.5
b
Contemp. Arts
?
MFA
?
16 ?
3 18.8 ?
7 ?
1 14.3
Criminology ?
MA
?
37 ?
7 ?
18.9 ?
7
?
1 ?
14.3
I
Criminology ?
PHD
?
18
?
5 27.8 ?
1
?
1 100.0
Economics ?
MA ?
43 ?
22 ?
51.2 ?
21
?
7 ?
33.3
I
Economics ?
PHD
?
40
?
20 ?
50.0 ?
8
?
2 ?
25.0
Education ?
MA ?
135 ?
11 ?
8.1 ?
29 ?
3 ?
10.3
I ?
Education ?
MED 158
?
6 ?
3.8 ?
63
?
6 ?
9.5
Education ?
MSC ?
26
?
0 ?
0.0 ?
4 ?
0
?
0.0
Education ?
PHD ?
54 ?
6
?
11.1 ?
8 ?
2
?
25.0
I ?
Engineering Sci.
?
MAP ?
34 ?
18 ?
52.9 ?
14 ?
7 ?
50.0
Engineering Sci.
?
MEN ?
28 ?
2 ?
7.1
?
11 ?
0 ?
0.0
Engineering Sci.
?
PHD ?
17 ?
7 ?
41.2 ?
6 ?
1 ?
16.7
I
English ?
MA ?
48 ?
2 ?
4.2 ?
16 ?
1 ?
6.3
English ?
PHD ?
20 ?
1 ?
5.0 ?
5 ?
0 ?
0.0
I ?
Geography ?
MA ?
27 ?
7 ?
25.9 ?
11 ?
2 ?
18.2
Geography ?
MSC ?
9 ?
1 ?
11.1 ?
3 ?
0 ?
0.0
Geography ?
PHD ?
14 ?
2 ?
14.3 ?
2 ?
0 ?
0.0
I
History ?
MA
?
35 ?
2 ?
5.7 ?
13
?
1 ?
7.7
) ?
History ?
PHD
?
12
?
1 ?
8.3 ?
0 ?
0
......2
I ?
S
? 19
Current
Admitted
Department
Pgin ?
Total Visa
%
Total
Visa
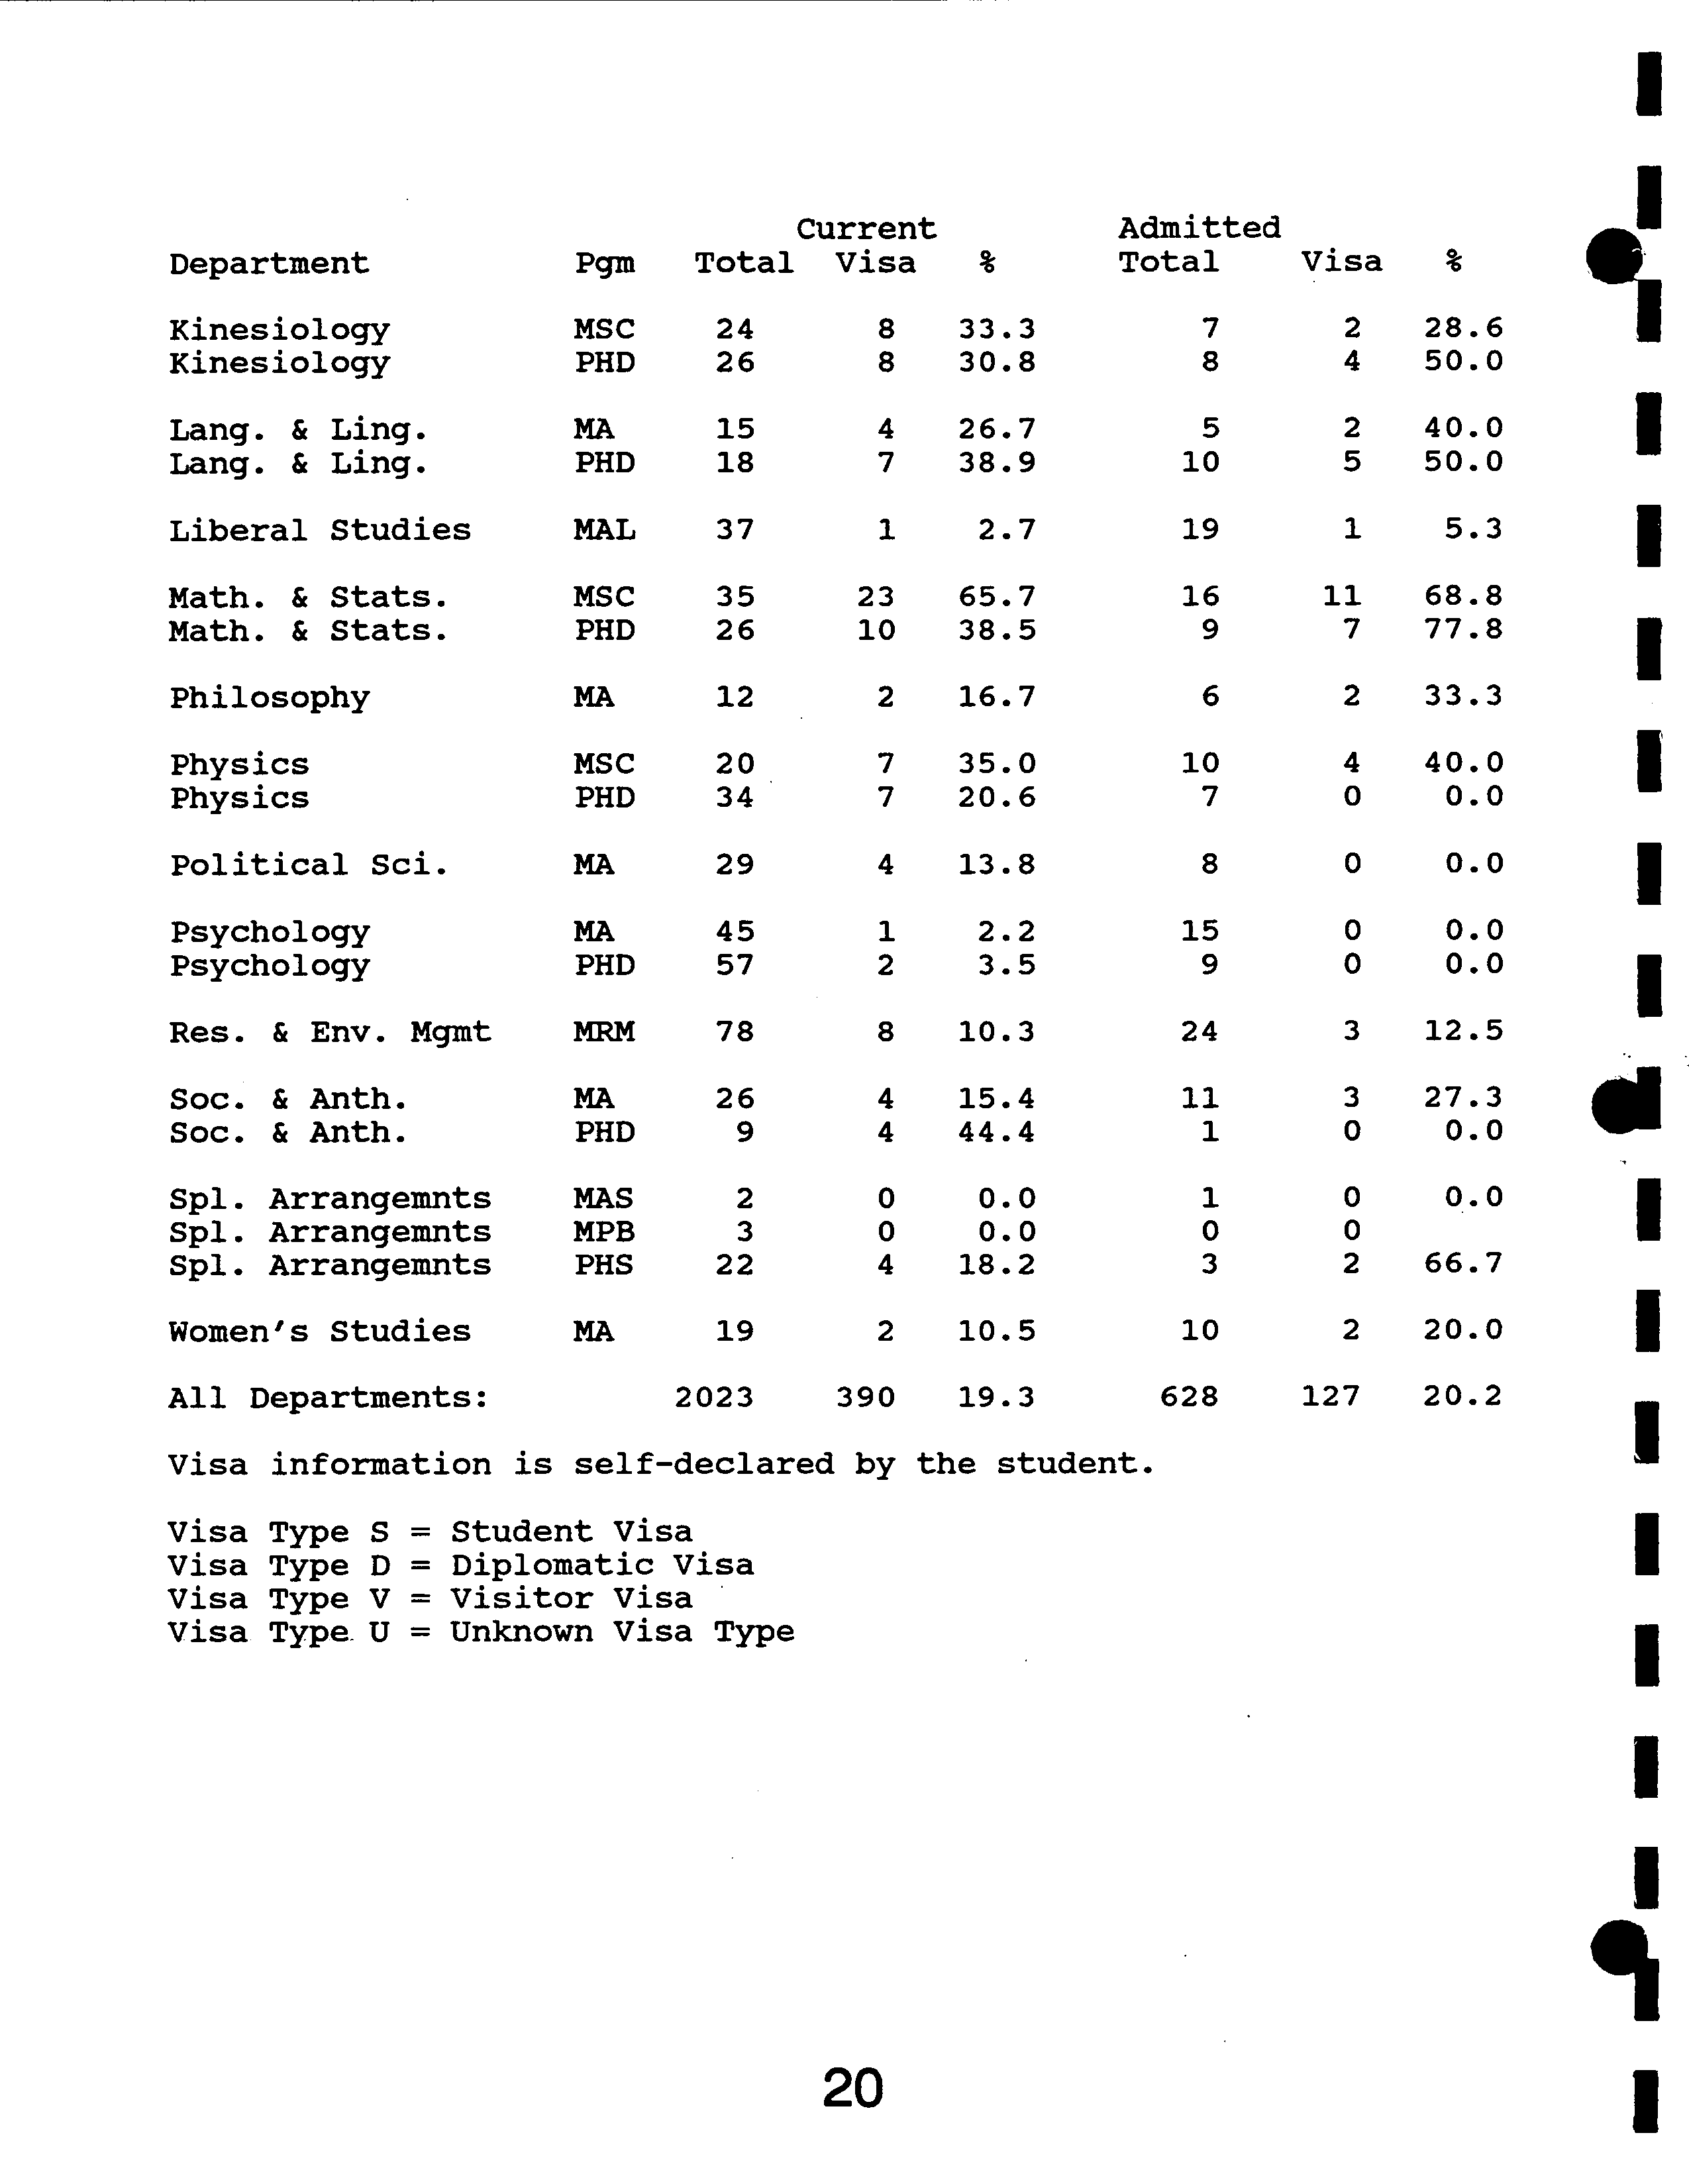
Kinesiology
MSC 24
8 33.3
7
2
Kinesiology
PHD 26
8
30.8
8
4
Lang. & Ling.
MA
15
4 26.7
5
2
Lang. & Ling.
PHD 18
7 38.9
10
5
Liberal Studies
MAL
37
1
2.7
19
1
Math. & Stats.
MSC
35
23 65.7
16
11
Math. & Stats.
PHD 26
10 38.5
9
7
Philosophy
MA
12
2
16.7
6
2
Physics
MSC 20
7 35.0
10
4
Physics
PHD
34
7 20.6
7
0
Political Sci.
MA
29
4 13.8
8
0
Psychology
MA
45
1 2.2
15
0
Psychology
PHD 57
2
3.5
9
0
Res. & Env. Mgmt
MRN 78
8 10.3
24
3
Soc. & Anth.
MA 26
4
15.4
11
3
Soc. & Anth.
PHD 9
4
44.4
1
0
Spl. Arrangemnts MAS
2
0
0.0
1
0
Spi. Arrangemnts
MPB
3
0 0.0
0
0
Spi. Arrangenints
PHS 22
4 18.2
3
2
Women's Studies
MA
19
2 10.5
10
2
All Departments:
2023 390 19.3
628
127
Visa information
is self-declared
by the student.
Visa Type S = Student Visa
Visa Type D = Diplomatic Visa
Visa Type V = Visitor Visa
Visa Type. U = Unknown Visa Type
%
28.6
50.0
40.0
50.0
5.3
68.8
77.8
33.3
40.0
0.0
0.0
0.0
0.0
12.5
27.3
0.0
0.0
66.7
20.0
20.2
20
I
I
I
I.
I
I
b
I
I
I
F
I
I
P
I
I
ci)
t
Cz
E
C)
0
dgsageml
Chemistry ?
Physics ?
Eng. Sci. MApSc ?
Economics
?
Math. & Stats. ?
Bus. Admin. DMBA
?
History
?
Computing Sd.
?
Kinesiology ?
Psychology
?
Bio. Sci. MSc ?
Eng. Sd. MEng
?
Res. & Env. Mgmt
?
Geography MSc
?
Philosophy ?
Bio. Sc. - MAq ?
Criminology
?
26.0 ?
• Average Age
26.6 ?
Median Age
?
- ?
27.2
7.9
28.0
28.1
• 28.3
W#aW :.
WeWaWe'oi :.
wwjowawe'
29.8
S
WJeWJM4 :
I
I
e1:s
I
I
I.
28
?
32
Age
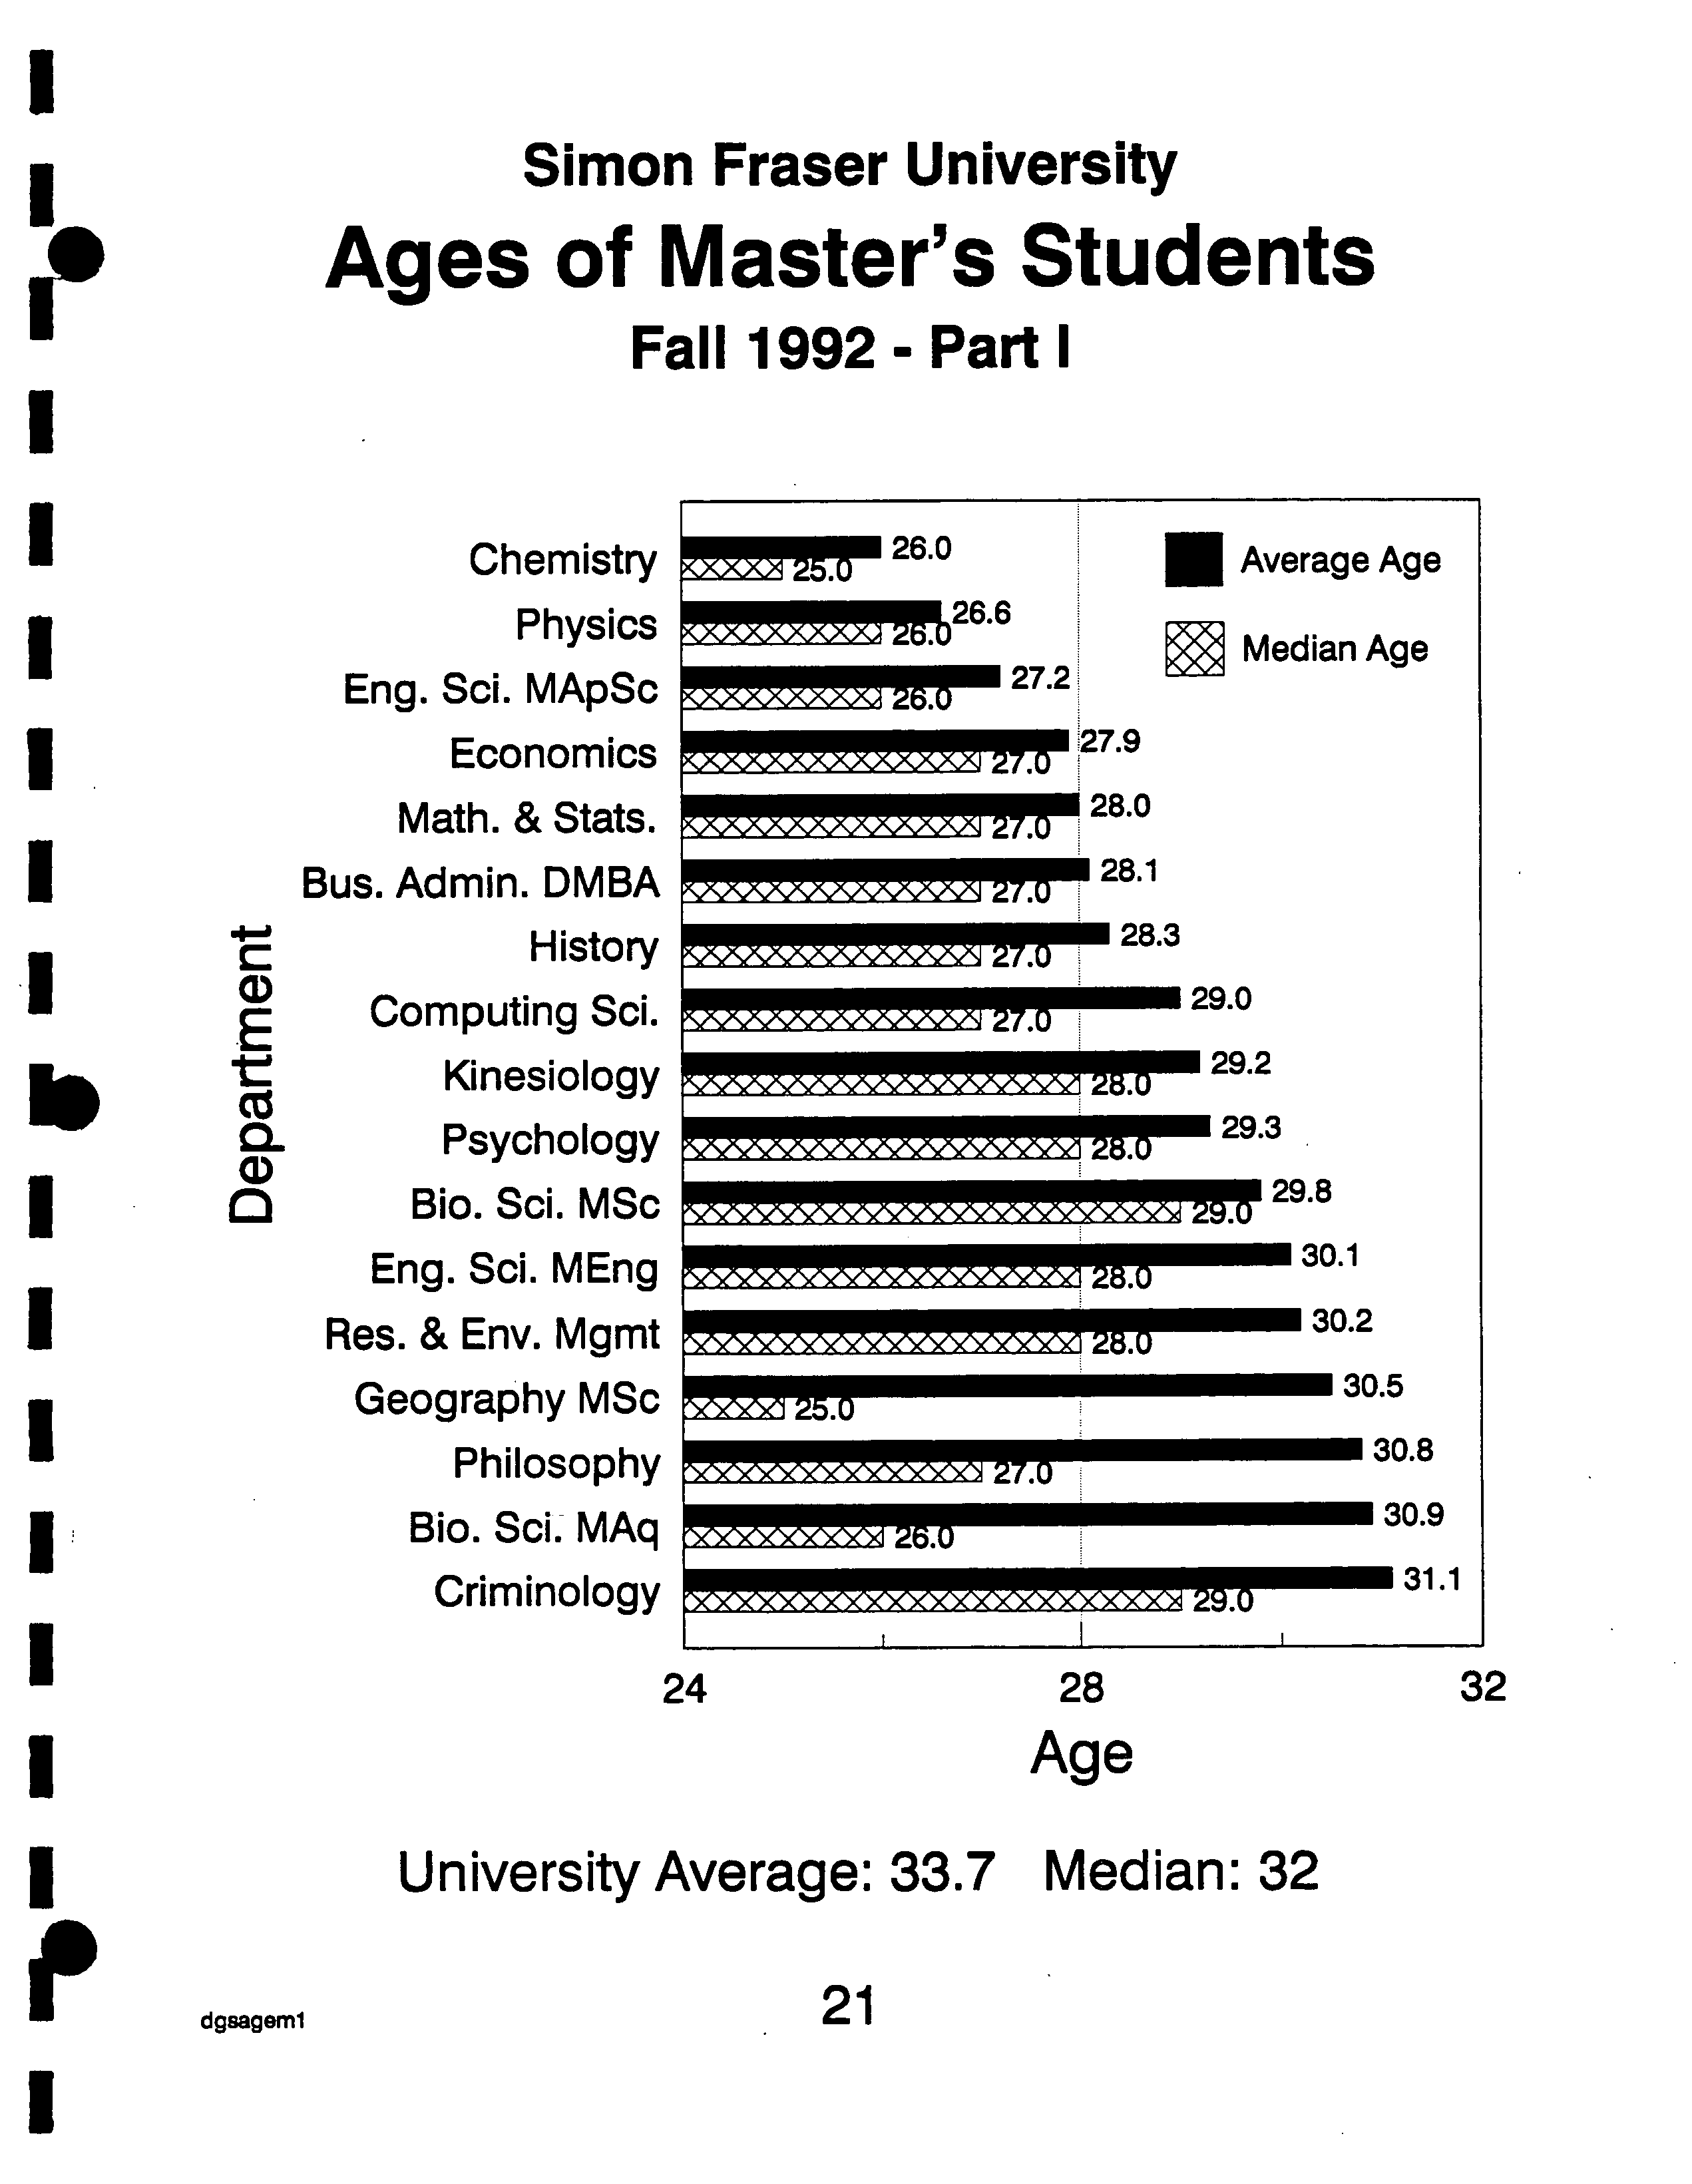
Median: 32
21
Simon Fraser University
Ages of Master's Students
Fall 1992 - Part I
24
University Average: 33.7
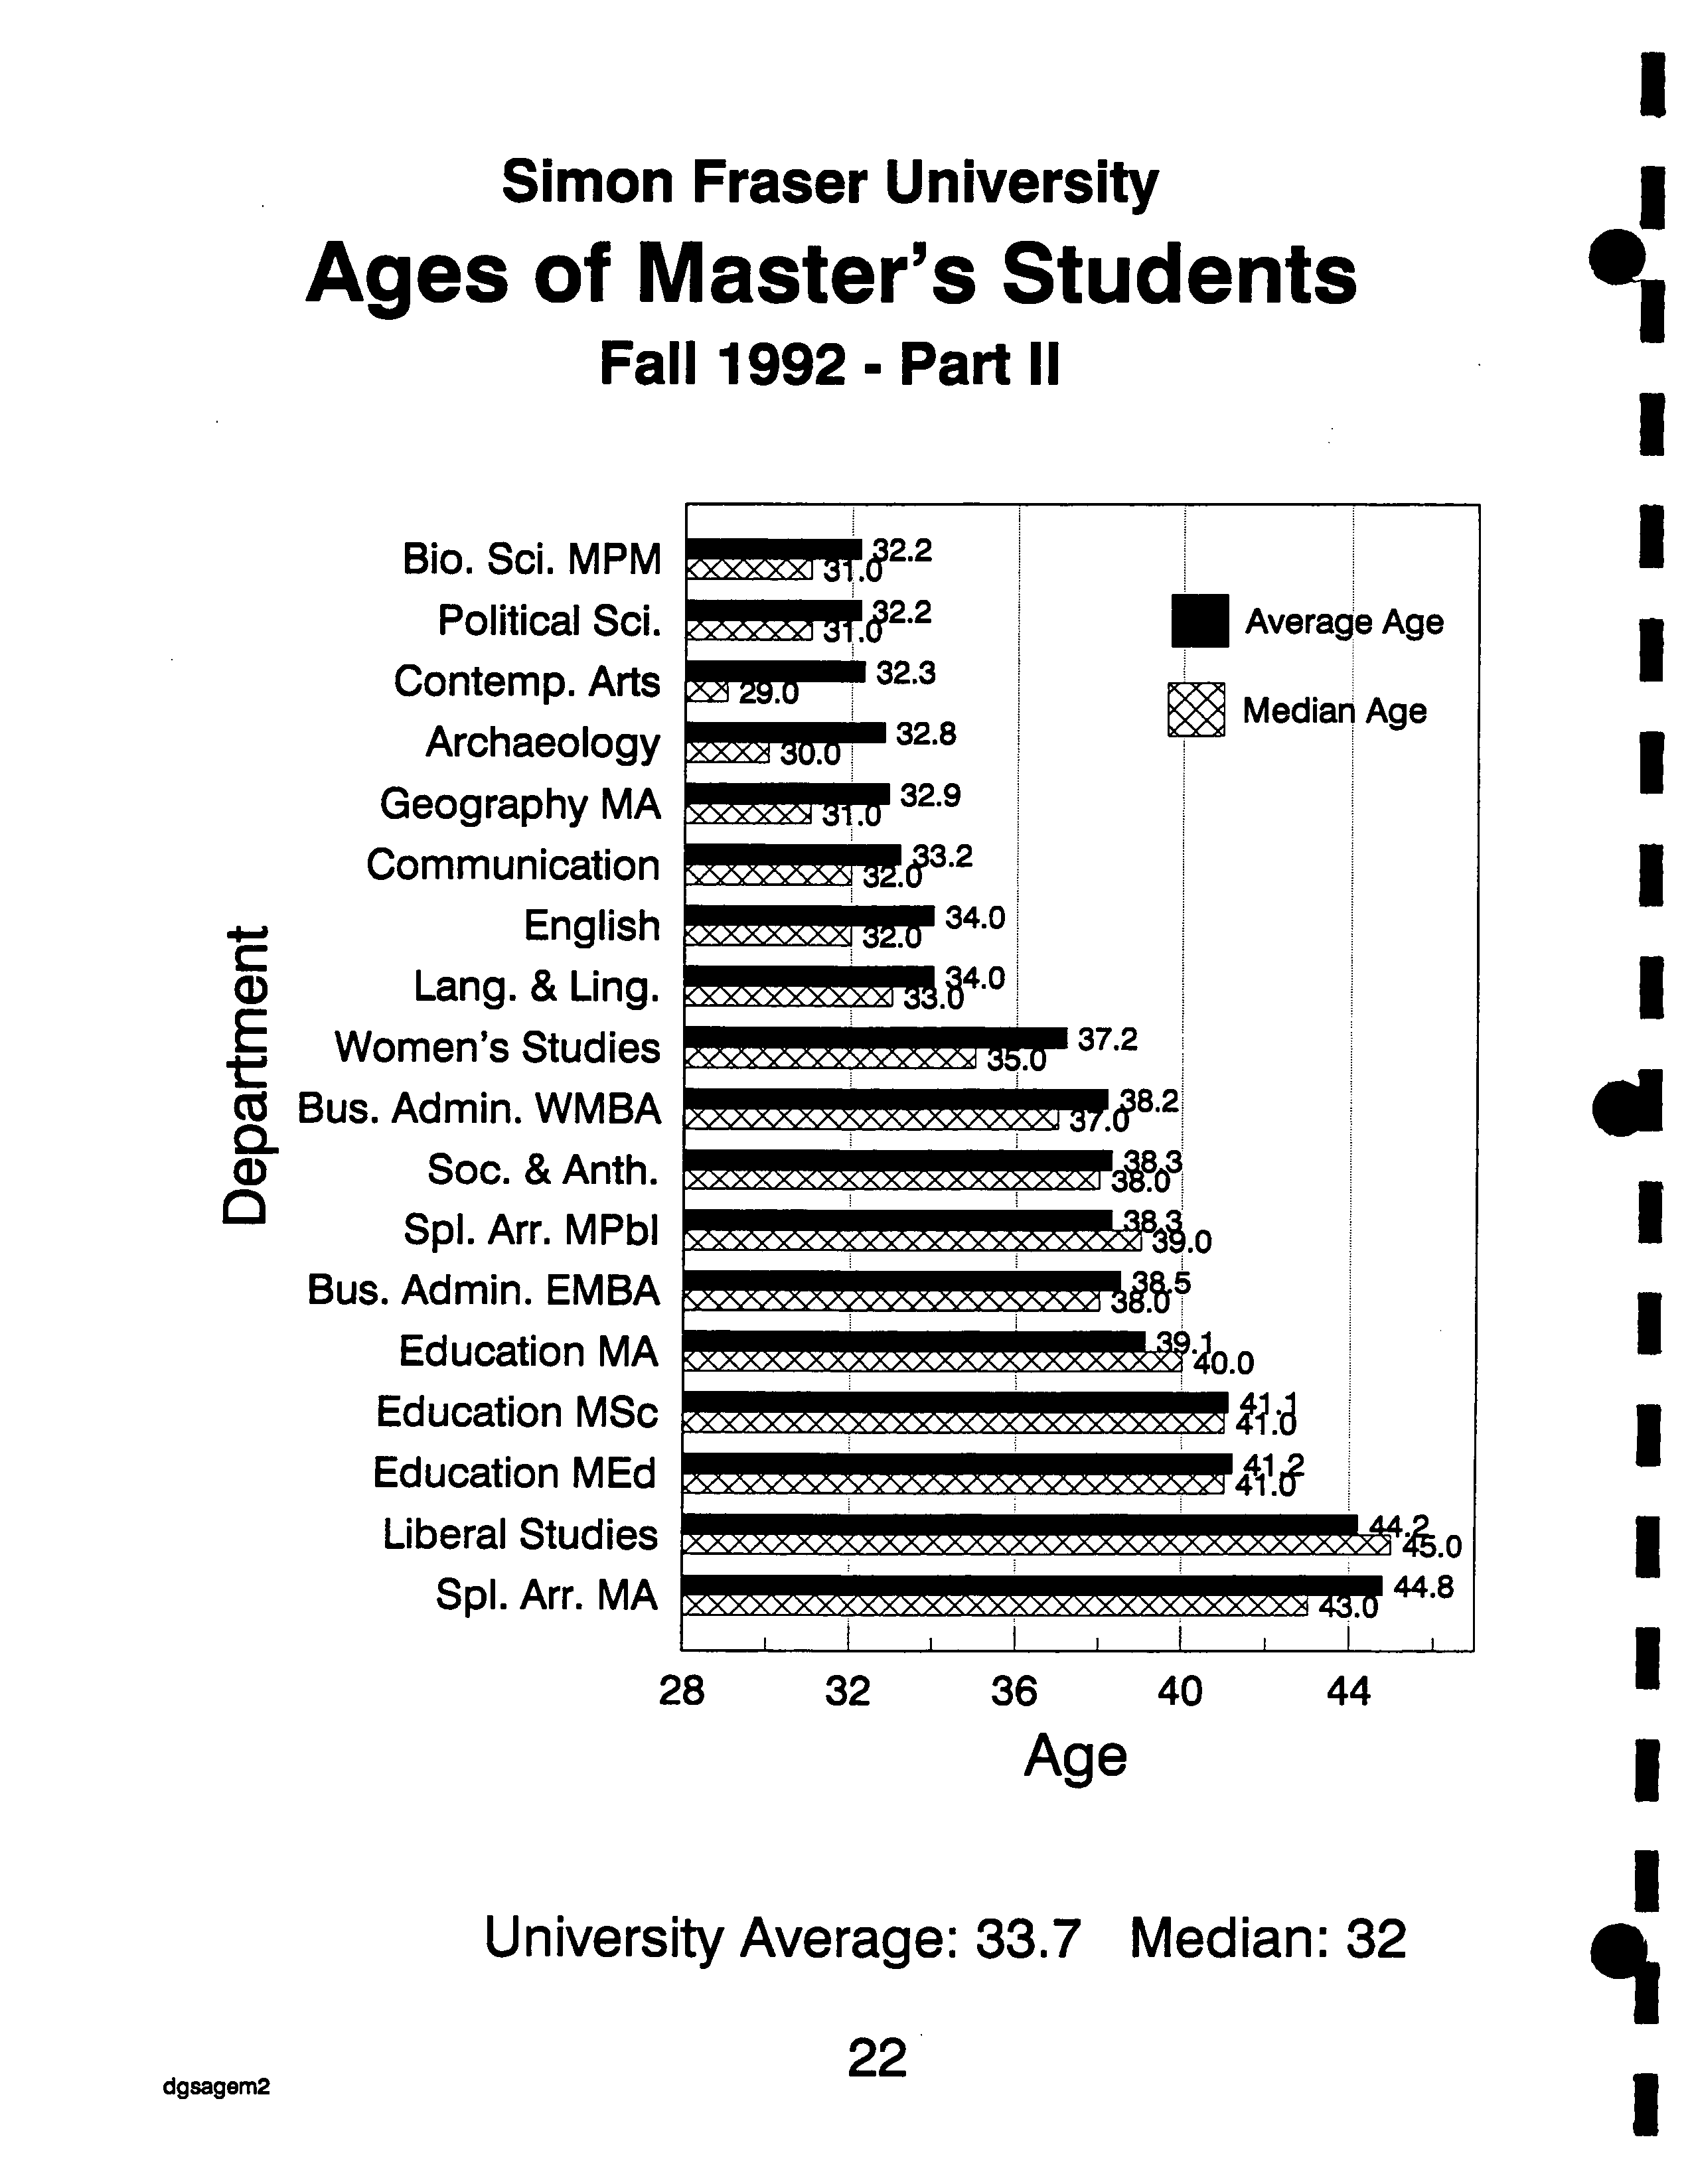
Simon Fraser University
Ages of Master's Students
Fall 1992 - Part II
Bio. Sd. MPM ?
Political Sd.?
Contemp. Arts?
Archaeology ?
Geography MA?
Communication?
English ?
Lang. & Ling.
?
E=1
Women's Studies
CO Bus. Admin. WMBA
CL
Soc. & Anth.
SpI. Arr. MPbl
?
Bus. Admin. EMBA ?
Education MA
?
Education MSc?
Education MEd?
Liberal Studies?
SpI. Arr. MA
o:4ri ?
.
S
SI
i*i*a
Media
i
S
!!WJaW ?
S
www
Avera9_
's-
S.
: • S
•
?
I
SI
AA 9
'
I
c ?
s
28
?
32 ?
36 ?
40 ?
44
Age
University Average: 33.7 Median: 32
22
dgsagem2
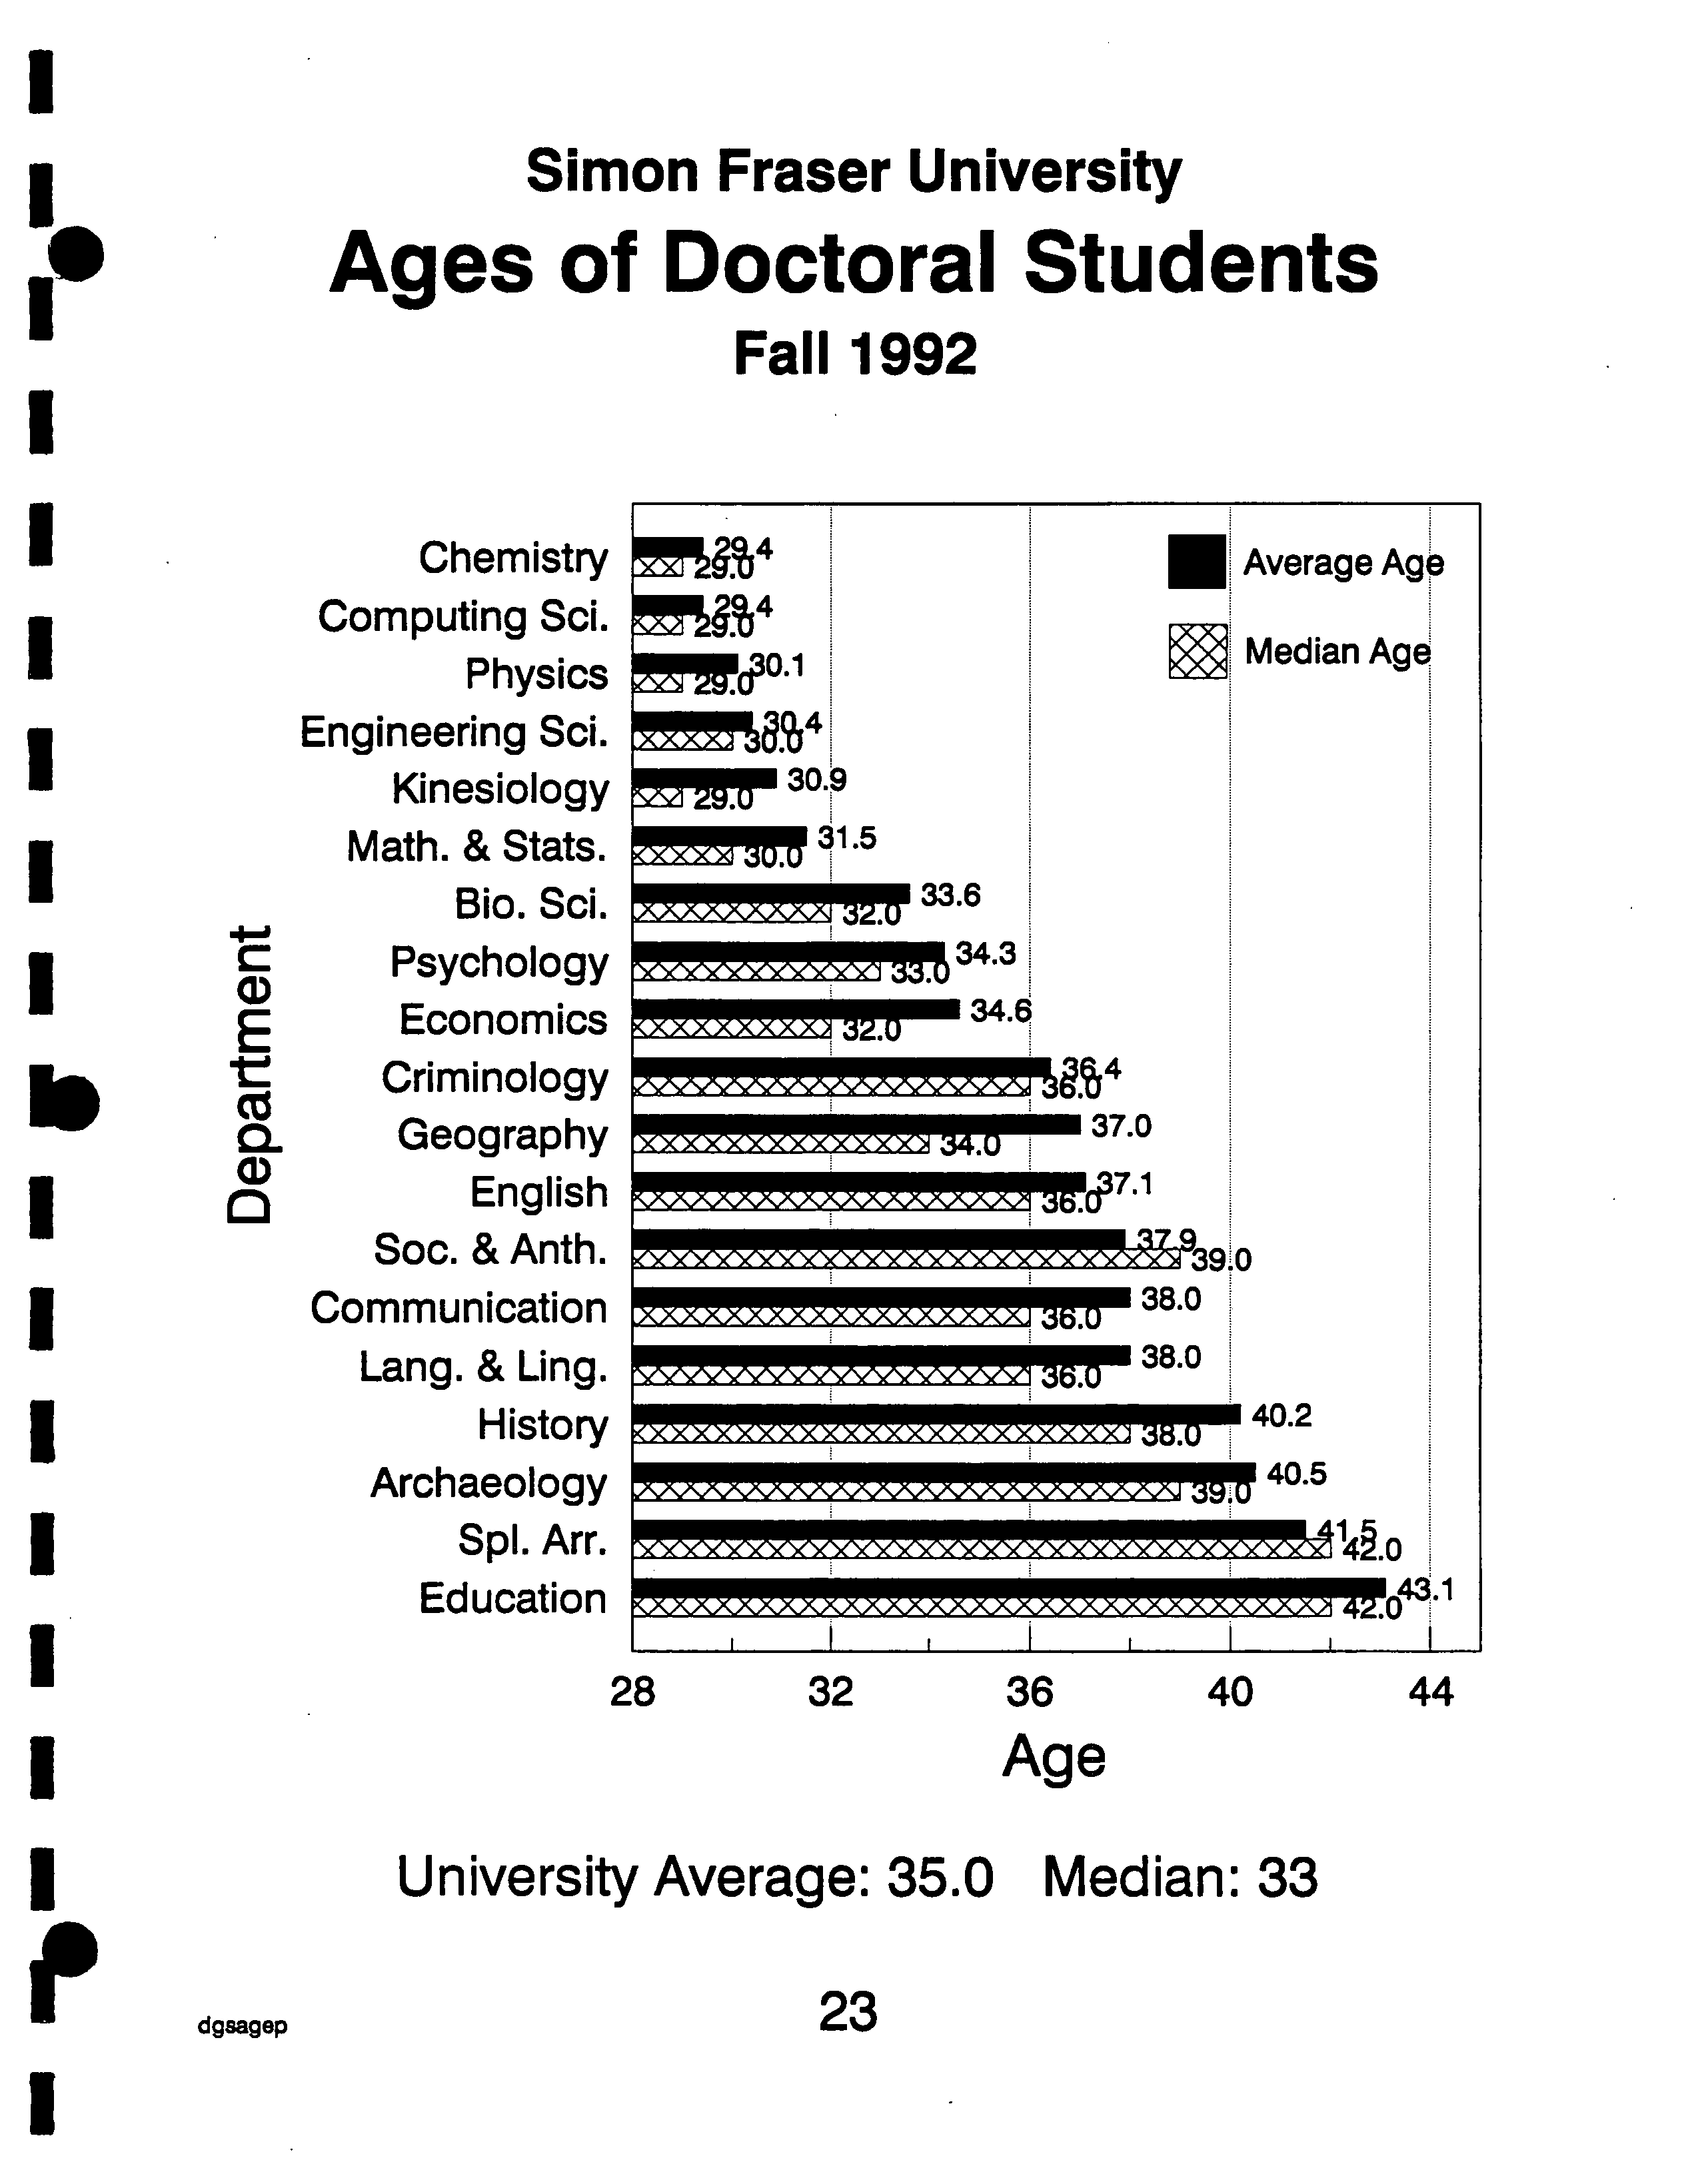
Simon Fraser University
Ages of Doctoral Students
Fall 1992
I
I
I
I
I
I
b
I
I
I
I
I
I
P
I
I
Chemistry
Computing Sci.
Physics
Engineering Sci.
Kinesiology
Math. & Stats.
Bio. Sd.
Psychology
Economics
Criminology
Geography
English
Soc. & Anth.
Communication
Lang. & Ling.
History
Archaeology
Spi. Arr.
Education
a)
E
.
Cz
CL
CD
0
dgsagep
28 ?
32 ?
36 ?
40 ?
44
Age
University Average: 35.0 Median: 33
23
I
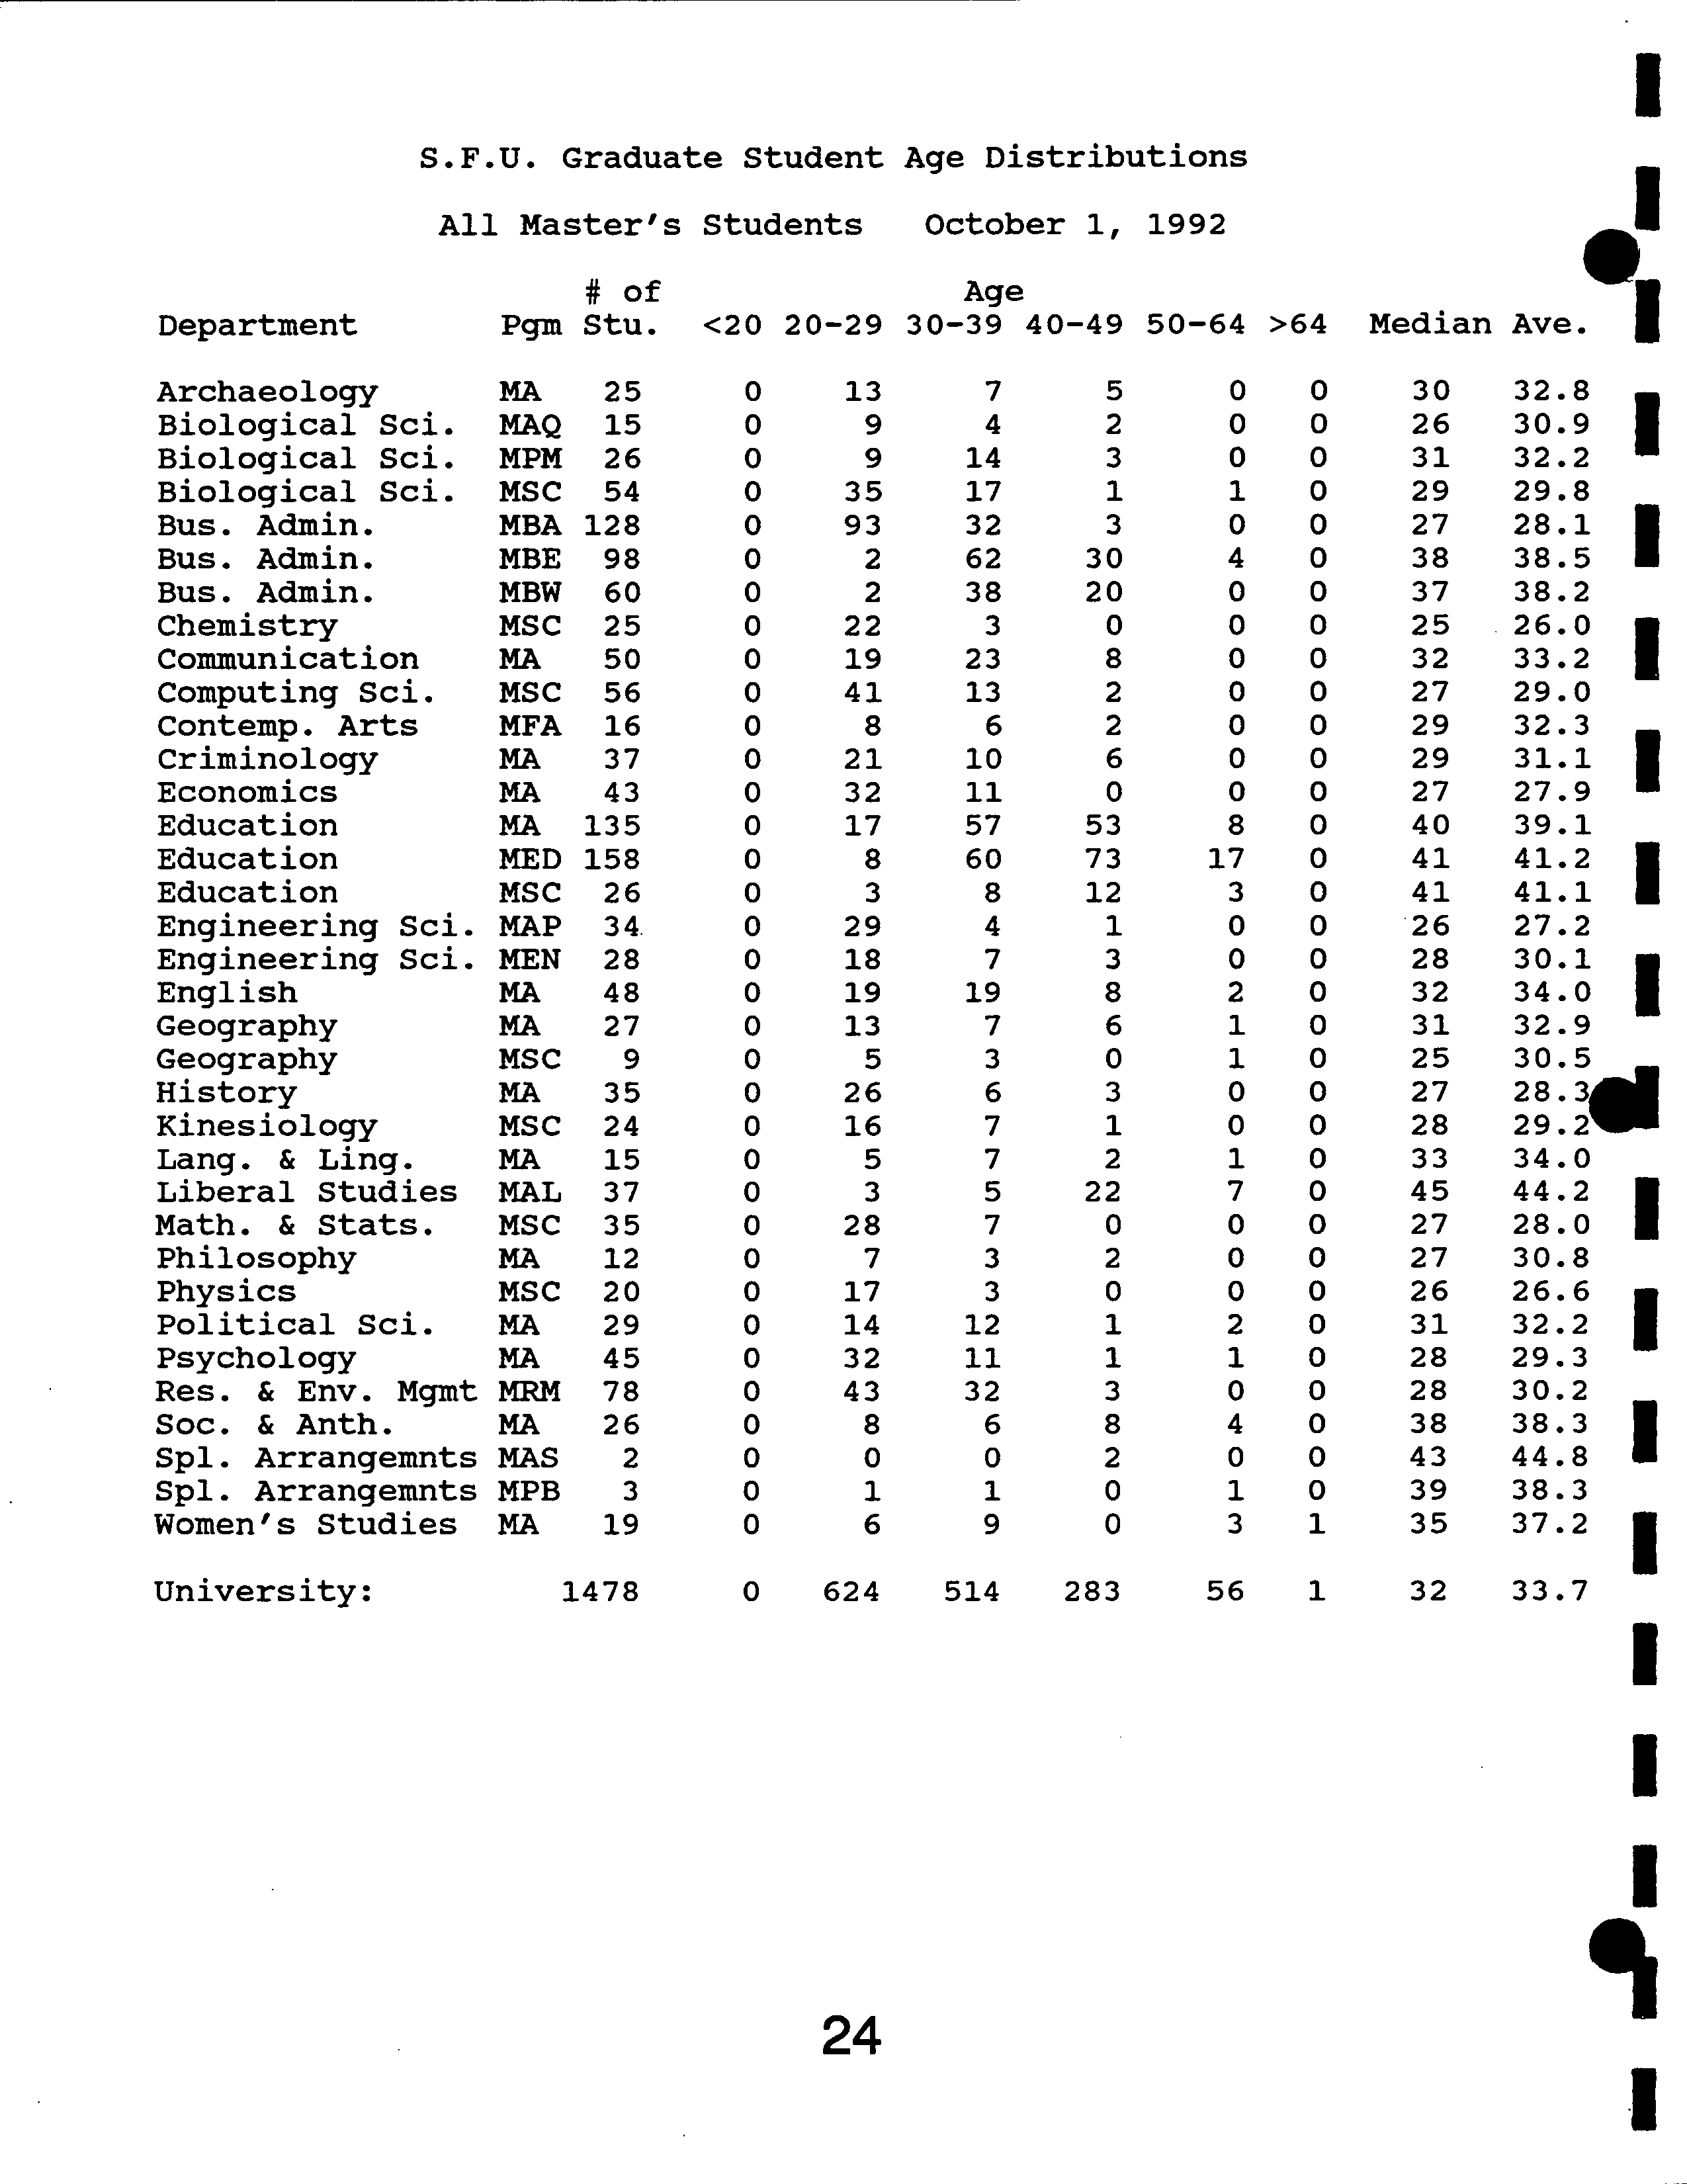
S.F.U. Graduate Student
Age Distributions
All Master's Students
October 1, 1992
#of
Age
Department
Pg-rn Stu. <20 20-29
30-39 40-49 50-64
>64 Median Ave.
Archaeology
MA
25
0 13 7
5 0 0 30 32.8
Biological
Sd.
MAQ 15 0 9
4 2 0
0
26 30.9
Biological Sci.
MPH
26 0
9 14 3
0 0 31 32.2
Biological Sci.
MSC 54 0 35 17
1 1 0 29 29.8
Bus. Admin.
MBA 128
0 93
32
3
0 0 27 28.1
Bus. Admin.
MBE 98
0 2
62 30
4 0 38 38.5
Bus. Admin.
MBW
60
0 2 38
20
0 0 37 38.2
Chemistry
MSC 25 0 22
3 0 0
0 25 26.0
Communication MA 50 0 19 23
8 0 0 32 33.2
Computing Sci.
MSC
56
0
41 13
2
0 0 27 29.0
Contemp. Arts MFA 16 0 8 6
2
0 0 29 32.3
Criminology MA 37 0 21 10
6 0 0 29
31.1
Economics
MA
43
0 32
11 0
0 0 27 27.9
Education
MA 135 0 17
57 53 8 0
40 39.1
Education
MED
158
0
8
60
73 17 0 41 41.2
Education
MSC 26 0 3 8 12
3 0 41 41.1
Engineering Sci. MAP 34. 0 29 4 1
0 0 26 27.2
Engineering Sci. MEN 28 0 18 7 3 0
0 28 30.1
English
MA 48 0 19 19 8 2
0 32 34.0
Geography
MA 27
0
13 7 6
1 0 31 32.9
Geography
MSC 9 0 5
3 0 1
0 25 30.5
History
MA
35 0
26 6 3
0 0 27 28.3
Kinesiology MSC 24 0 16 7
1 0 0
28 29.2
Lang. & Ling. MA
15
0
5
7
2
1 0
33 34.0
Liberal Studies
HAL 37 0 3
5 22
7 0 45 44.2
Math. & Stats.
MSC 35 0 28
7 0 0
0 27 28.0
Philosophy
MA 12 0 7 3
2 0 0
27 30.8
Physics
MSC 20 0 17 3 0 0
0 26 26.6
Political Sci.
MA 29 0
14 12 1 2
0 31 32.2
Psychology
MA 45 0 32 11
1 1
0 28 29.3
Res. & Env. Mgmt
MRN 78 0 43
32 3 0 0
28 30.2
Soc. & Anth.
MA 26
0
8
6
8
4
0 38 38.3
Spi. Arrangemnts
MAS
2
0
0
0
2
0 0
43 44.8
Spl. Arrangeinnts MPB 3
0
1
1
0
1
0 39 38.3
Women's Studies MA
19
0
6 9
0
3 1 35
37.2
University:
1478 0 624 514 283
56 1 32 33.7
24
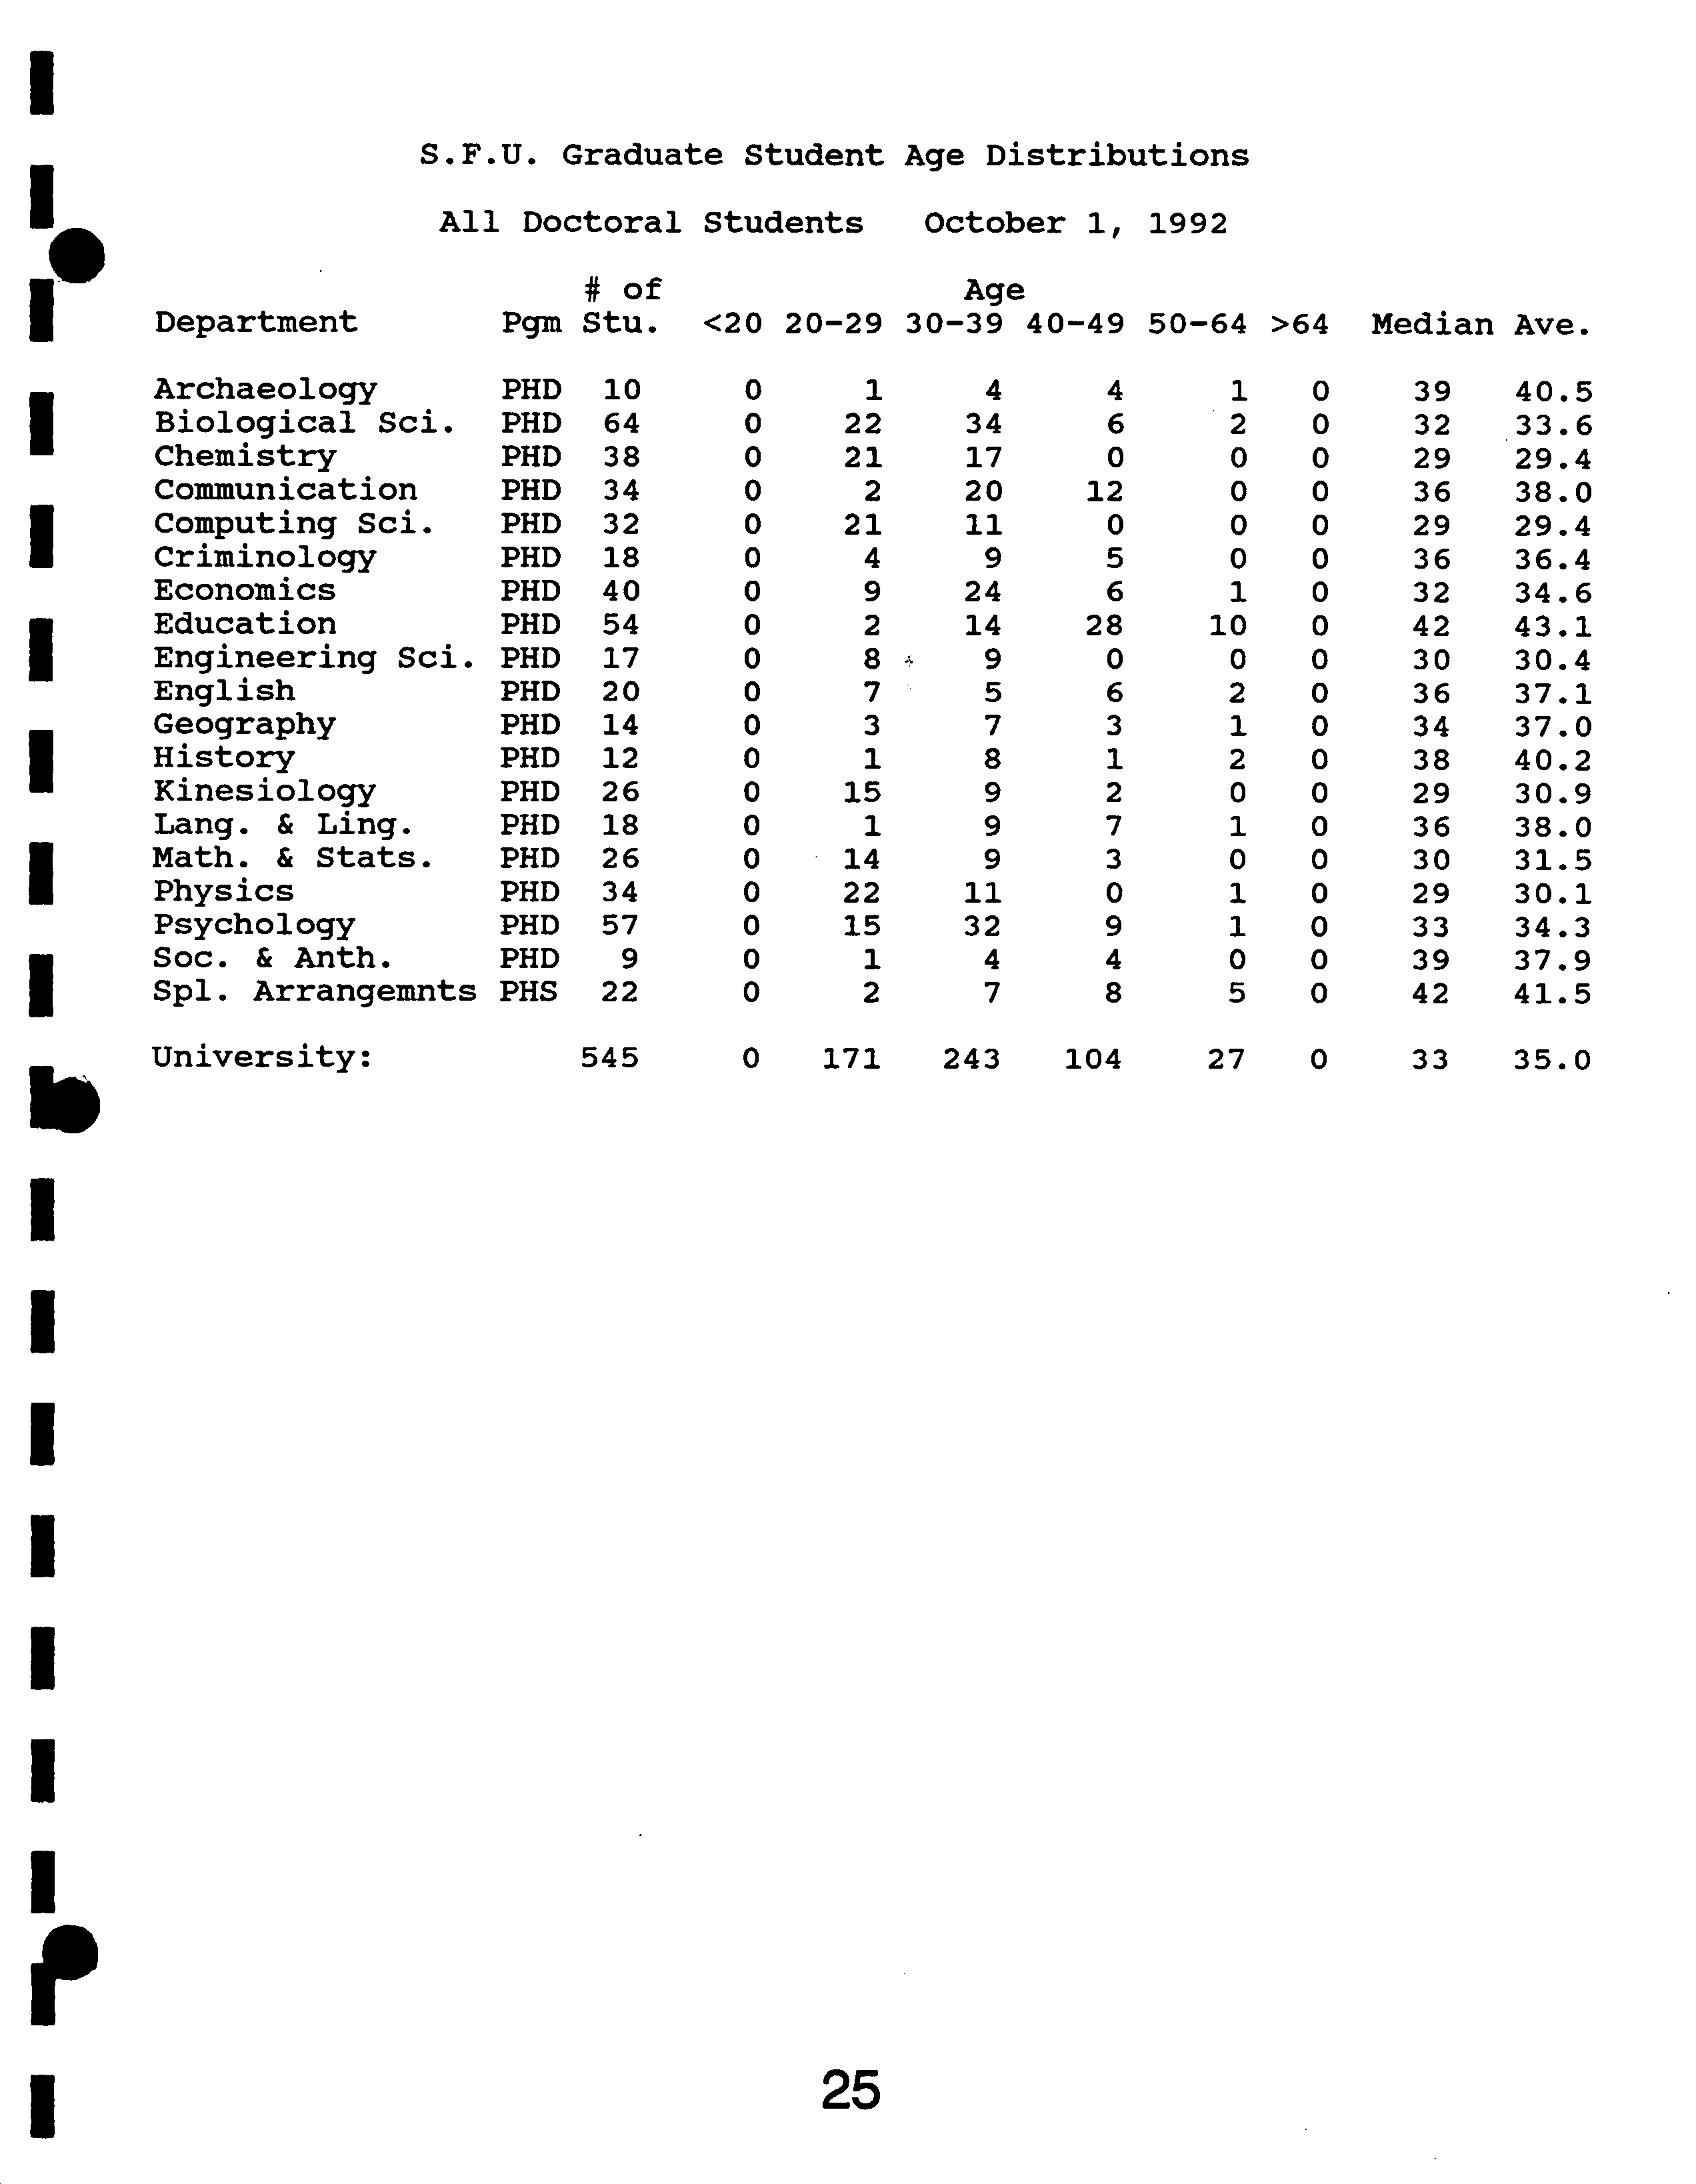
S.F.U. Graduate Student
Age Distributions
All Doctoral
Students October
1, 1992
#of
Age
Department
Pgm Stu. <20
20-29 30-39 40-49 50-64
>64 Median
Ave.
Archaeology
PHD 10
0
1
4
4
1 0
39 40.5
Biological Sci.
PHD 64
0 22 34
6 2 0
32 33.6
Chemistry
PHD
38
0
21
17 0
0 0 29
29.4
Communication
PHD 34
0
2
20
12 0
0 36
38.0
Computing Sci. PHD
32
0
21 11
0
0 0 29
29.4
Criminology
PHD 18
0
4
9
5
0 0 36
36.4
Economics
PHD 40
0 9 24 6
1 0 32
34.6
Education
PHD
54 0
2 14 28 10
0 42
43.1
Engineering Sd.
PHD 17
0
8 9 0
0 0 30
30.4
English
PHD
20
0
7
5
6
2 0
36 37.1
Geography
PHD 14
0 3 7 3
1 0
34 37.0
History
PHD 12
0
1
8
1
2 0
38 40.2
Kinesiology
PHD 26
0 15
9
2
0 0
29 30.9
Lang. & Ling.
PHD 18
0
1 9 7 1 0
36 38.0
Math. & Stats.
PHD 26
0 14
9
3
0 0 30
31.5
Physics
PHD 34
0
22
11 0
1 0 29 30.1
Psychology
PHD 57
0 15
32 9
1 0 33
34.3
Soc. & Anth.
PHD
9
0
1
4
4
0 0
39 37.9
Spi. Arrangenmts
PHS 22
0
2
7 8 5
0 42
41.5
University:
545
0 171
243
104 27
0 33 35.0
25
0
I
I
I
I
I
I
b
I
I
I
I
I
I
I
'I
I
dgstim2
Univerisity Average: 10.24 Median: 9
27
7.0 ?
9.0 ?
11.0 ?
13.0 ?
15.0 ?
17.0
Semesters to Completion
Res. & Env. Mgmt
?
Education MEd?
Lang. & Ling. MA
?
SpI. Arr. MA ?
History ?
Education MA
?
Geography MA?
Criminology?
Education MSc?
Political Sci.
?
Communication?
Soc. & Anth.
?
English?
Eng. Sci. MEng?
Archaeology
?
Spi. Arr. MSc
?
Lang. & Ling. MATF
E
Cz
C)
0
0
Simon Fraser University
Master's Degree Completion Times
Fall 1985 - Summer 1992 Part II
[IJnrTnrI 11
I
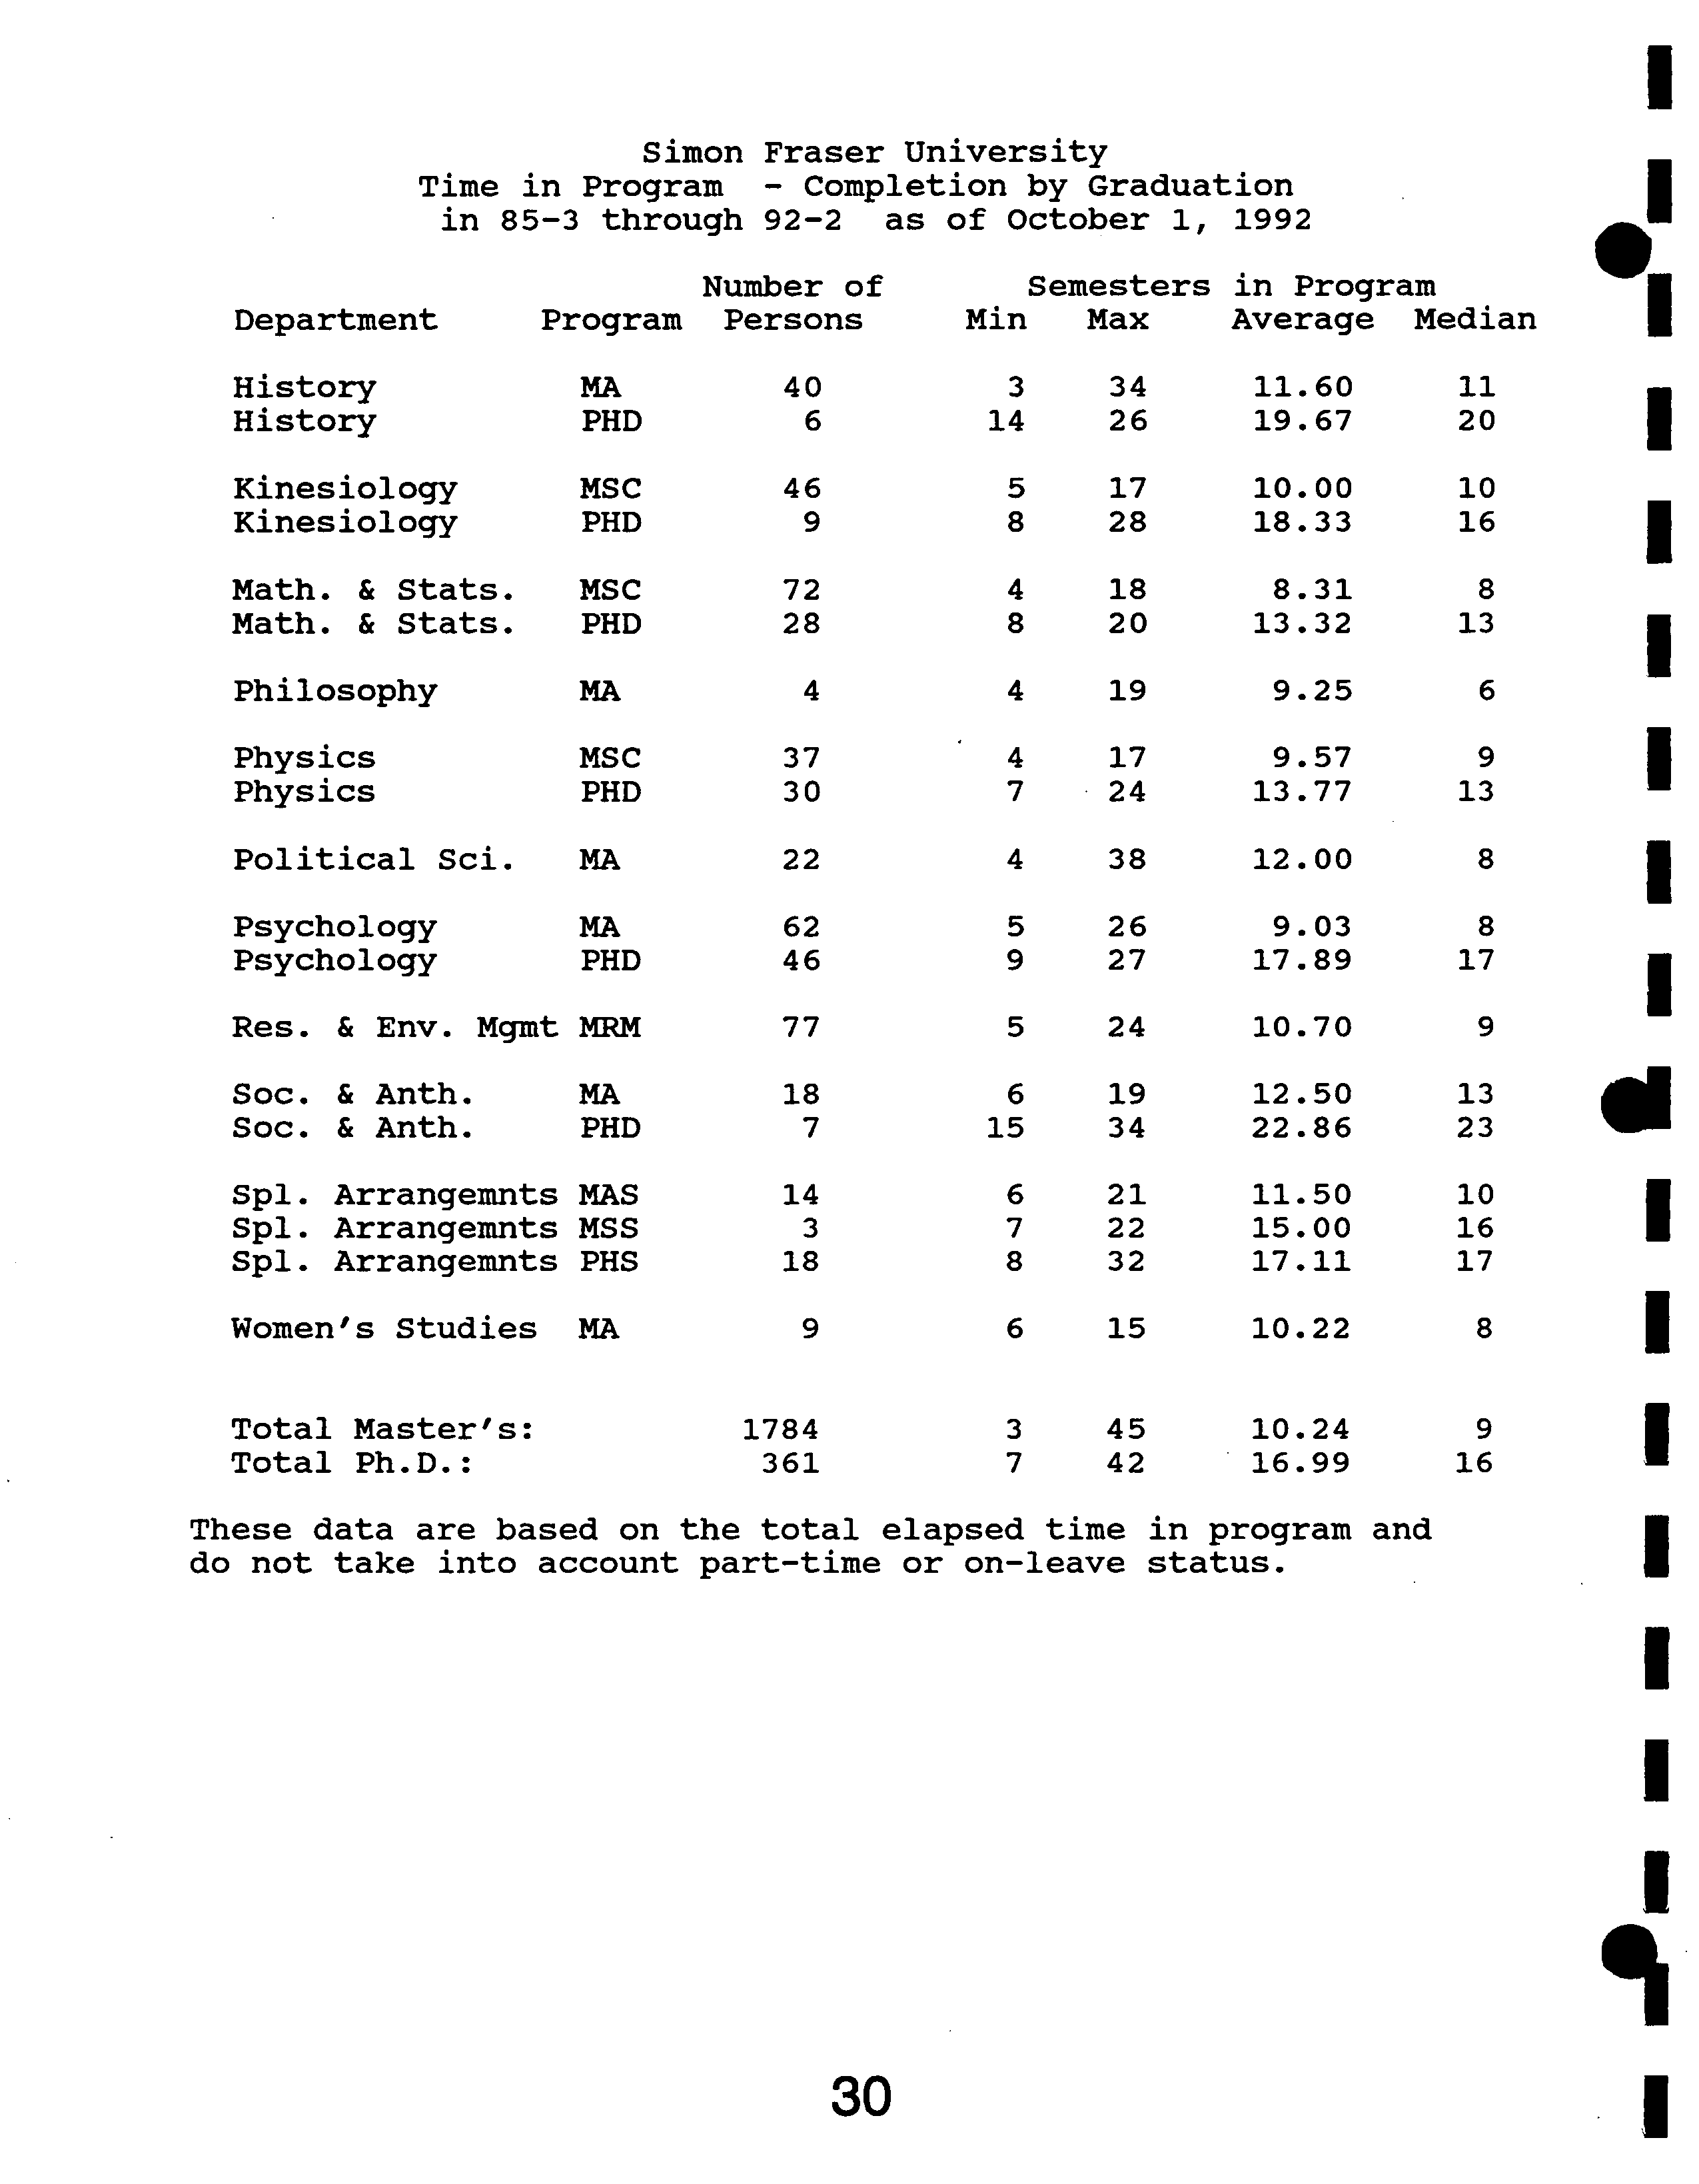
Simon Fraser University
I
Time in Program - Completion by Graduation
• ? in 85-3 through 92-2 as of October 1, 1992
I
Number of
?
Semesters in Program
Department ?
Program Persons
?
Min Max
?
Average Median
Archaeology ?
MA ?
23 ?
6 ?
18 ?
13.74 ?
15
Archaeology ?
PHD ?
13 ?
12 ?
27 ?
20.92 ?
23
Biological Sci. MAQ ?
3 ?
4 ?
6 ?
5.00 ?
5
I ?
Biological Sci. MPM ?
74 ?
5 ?
17 ?
10.26 ?
10
Biological Sci. MSC ?
68 ?
5
?
17 ?
10.65 ?
10
Biological
Sd.
PHD ?
73 ?
10
?
28
?
16.45
?
16
I
Bus. Admin. ?
MBA
?
99
?
3 ?
18 ?
6.82 ?
6
Bus. Admin. ?
MBE
?
203 ?
5 ?
17 ?
10.27 ?
9
I
Contemp. Arts ?
MFA
?
3 ?
5 ?
8 ?
7.00 ?
8
Chemistry ?
MSC
?
35 ?
4 ?
18 ?
9.46 ?
8
I
Chemistry ?
PHD
?
35 ?
11 ?
23 ?
17.29 ?
17
Communication
?
MA ?
53 ?
5 ?
45 ?
12.38 ?
12
I
Communication
?
PHD
?
6 ?
11 ?
19 ?
14.50 ?
13
Computing Sci. ?
MSC ?
91
?
4 ?
18 ?
8.92 ?
8
b
?
Computing Sci. PHD ?
10
?
11 ?
25 ?
16.30 ?
15
Criminology ?
MA ?
54-
?
3
?
33 ?
11.87 ?
11
Criminology ?
PHD ?
2
?
9
?
20
?
14.50
?
9
I
Lang. & Ling.
?
MA
?
8
?
8 ?
16 ?
11.25 ?
11
Lang. & Ling. ?
MAT
?
7 ?
14 ?
24 ?
16.43 ?
15
I
Lang. & Ling. ?
PHD
?
4 ?
7 ?
28 ?
18.75 ?
16
Economics ?
MA ?
106 ?
3 ?
24 ?
7.07 ?
6
I ?
Economics ?
PHD ?
34 ?
11 ?
42 ?
18.76 ?
18
Education ?
MA ?
172 ?
5 ?
23 ?
11.66 ?
12
Education ?
MED ?
226 ?
4 ?
28 ?
11.21 ?
11
I ?
Education ?
MSC ?
13 ?
6 ?
16 ?
11.92 ?
13
Education ?
PHD ?
15 ?
8 ?
21 ?
15.07 ?
15
I ?
English ?
MA
?
65 ?
4
?
35
?
12.65
?
12
English ?
PHD ?
9 ?
12.
?
29 ?
18.22 ?
19
Engineering
Sd.
MAP ?
34- ?
3. ?
12 ?
6.18 ?
6
Engineering Sci. MEN ?
6 ?
10 ?
17 ?
13.67 ?
13
Geography ?
MA ?
21
?
7 ?
18 ?
11.81 ?
11
I ?
Geography ?
MSC ?
16
?
6 ?
12 ?
8.38 ?
8
Geography ?
PHD ?
16
?
12 ?
29 ?
19.63 ?
17
continued...
I ?
29
Simon Fraser University
Time in Program - Completion by Graduation
in 85-3 through 92-2 as of October 1, 1992
Number of
Semesters in Program
Department ?
Program
Persons Min Max Average ?
Median
History
MA
40
3
34
11.60
11
History
PHD
6
14
26
19.67
20
Kinesiology
MSC
46
5
17
10.00
10
Kinesiology
PHD
9
8 28
18.33
16
Math. & Stats. MSC
72
4
18
8.31
8
Math. & Stats.
PHD
28
8 20
13.32
13
Philosophy
NA
4
4 19
9.25
6
Physics
MSC
37
4
17
9.57
9
Physics
PHD
30
7
24
13.77
13
Political Sci. MA
22
4 38
12.00
8
Psychology
MA
62
5 26
9.03
8
Psychology
PHD
46
9
27
17.89
17
Res. & Env. Mgmt IIRN
77
5 24
10.70
9
Soc. & Anth.
MA
18
6 19
12.50
13
Soc. & Anth.
PHD
7
15 34
22.86
23
Spl. Arrangemrits
MAS
14
6 21
11.50
10
Spl. Arrangeinnts
MSS
3
7 22
15.00
16
Spi. Arrangemnts
PHS
18
8 32
17.11
17
Women's Studies
MA
9
6 15 10.22
8
Total Master's: ?
1784 ?
3 ?
45 ?
10.24 ?
9
Total Ph.D.: ? 361 ?
7 ?
42 ?
16.99 ?
16
These data are based on the total elapsed time in program and
do not take into account part-time or on-leave status.
30
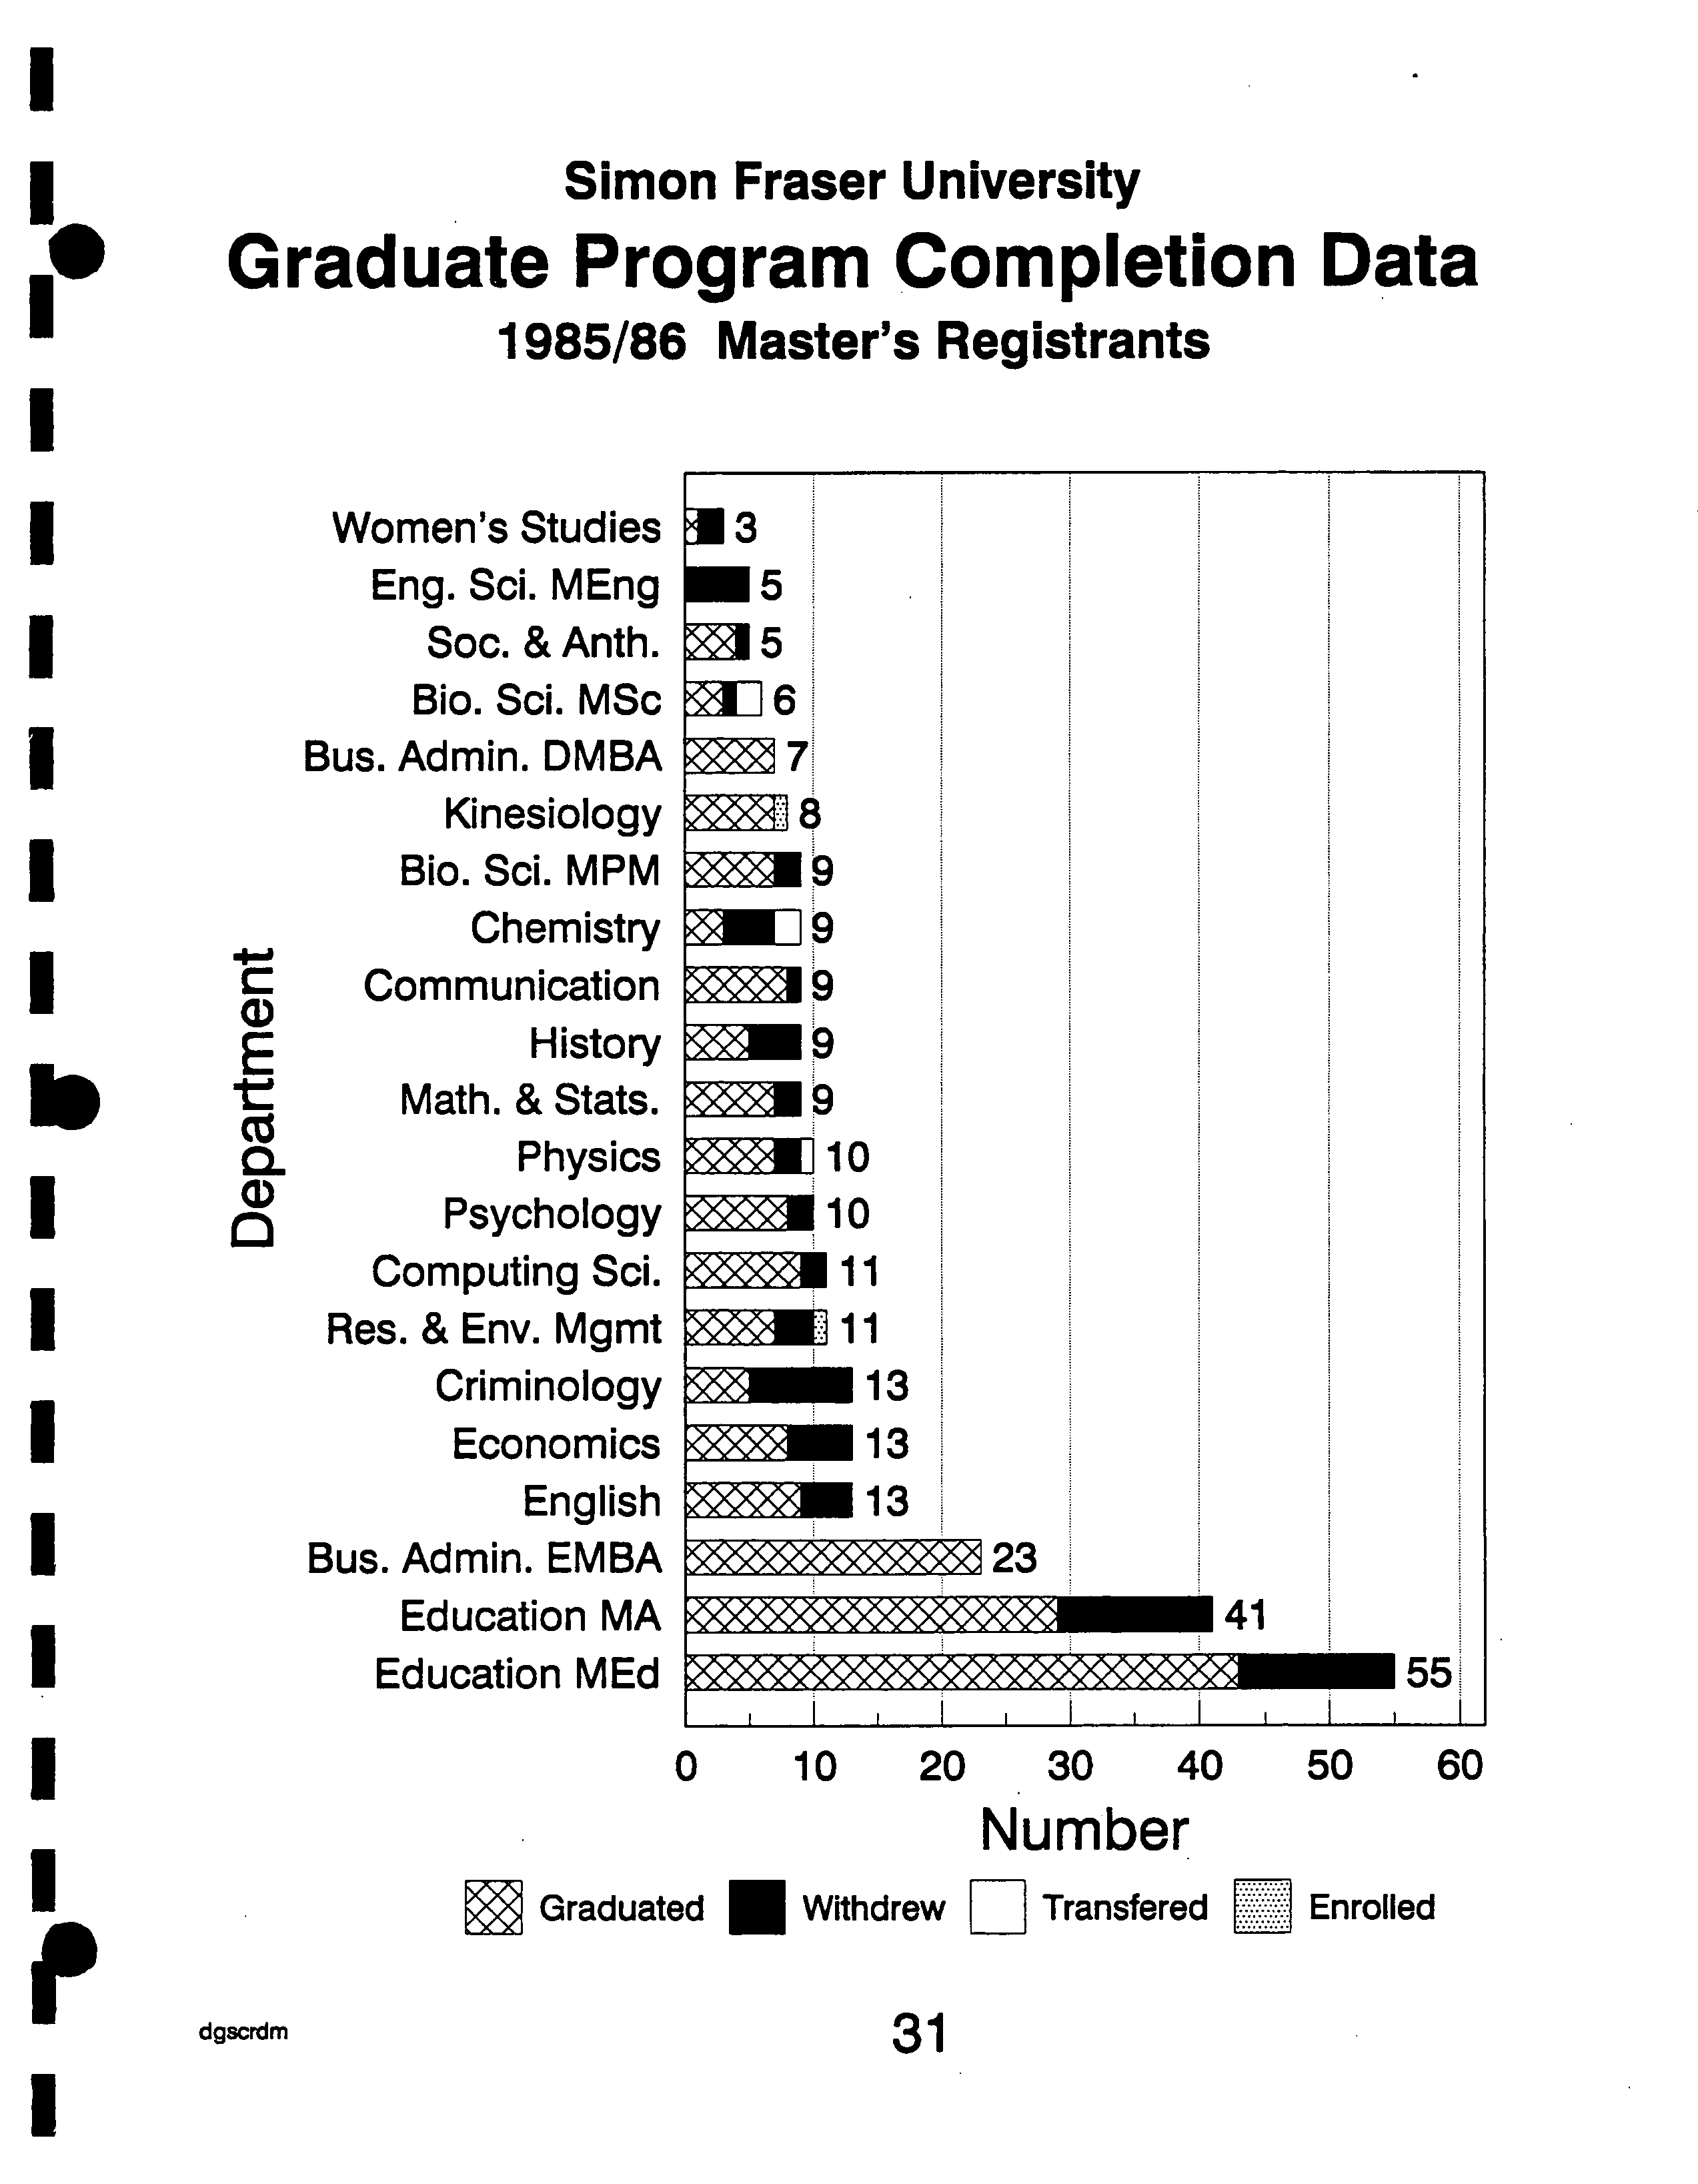
Simon Fraser University
Graduate Program Completion Data
1985/86 Master's Registrants
E
It
O
cz
a-
ci)
dgscrdm
I
I
I
I
I
I
b
I
I
I
I
I
I
1
1
Women's Studies ?
Eng. Sci. MEng?
Soc. & Anth.
?
Bio. Sd. MSc ?
Bus. Admin. DMBA ?
Kinesiology?
Bio. Sci. MPM ?
Chemistry?
Communication ?
History ?
Math. & Stats. ?
Physics ?
Psychology ?
Computing Sci.
?
Res. & Env. Mgmt ?
Criminology ?
Economics ?
English?
Bus. Admin. EMBA ?
Education MA ?
Education MEd
3
15
15
L16
10
10
11
11
113
113
113
23
41
55
0 ?
10
?
20
?
30
?
40
?
50 ?
60
Number
Graduated
N
Withdrew ?
Transfered BiEnrolled
31
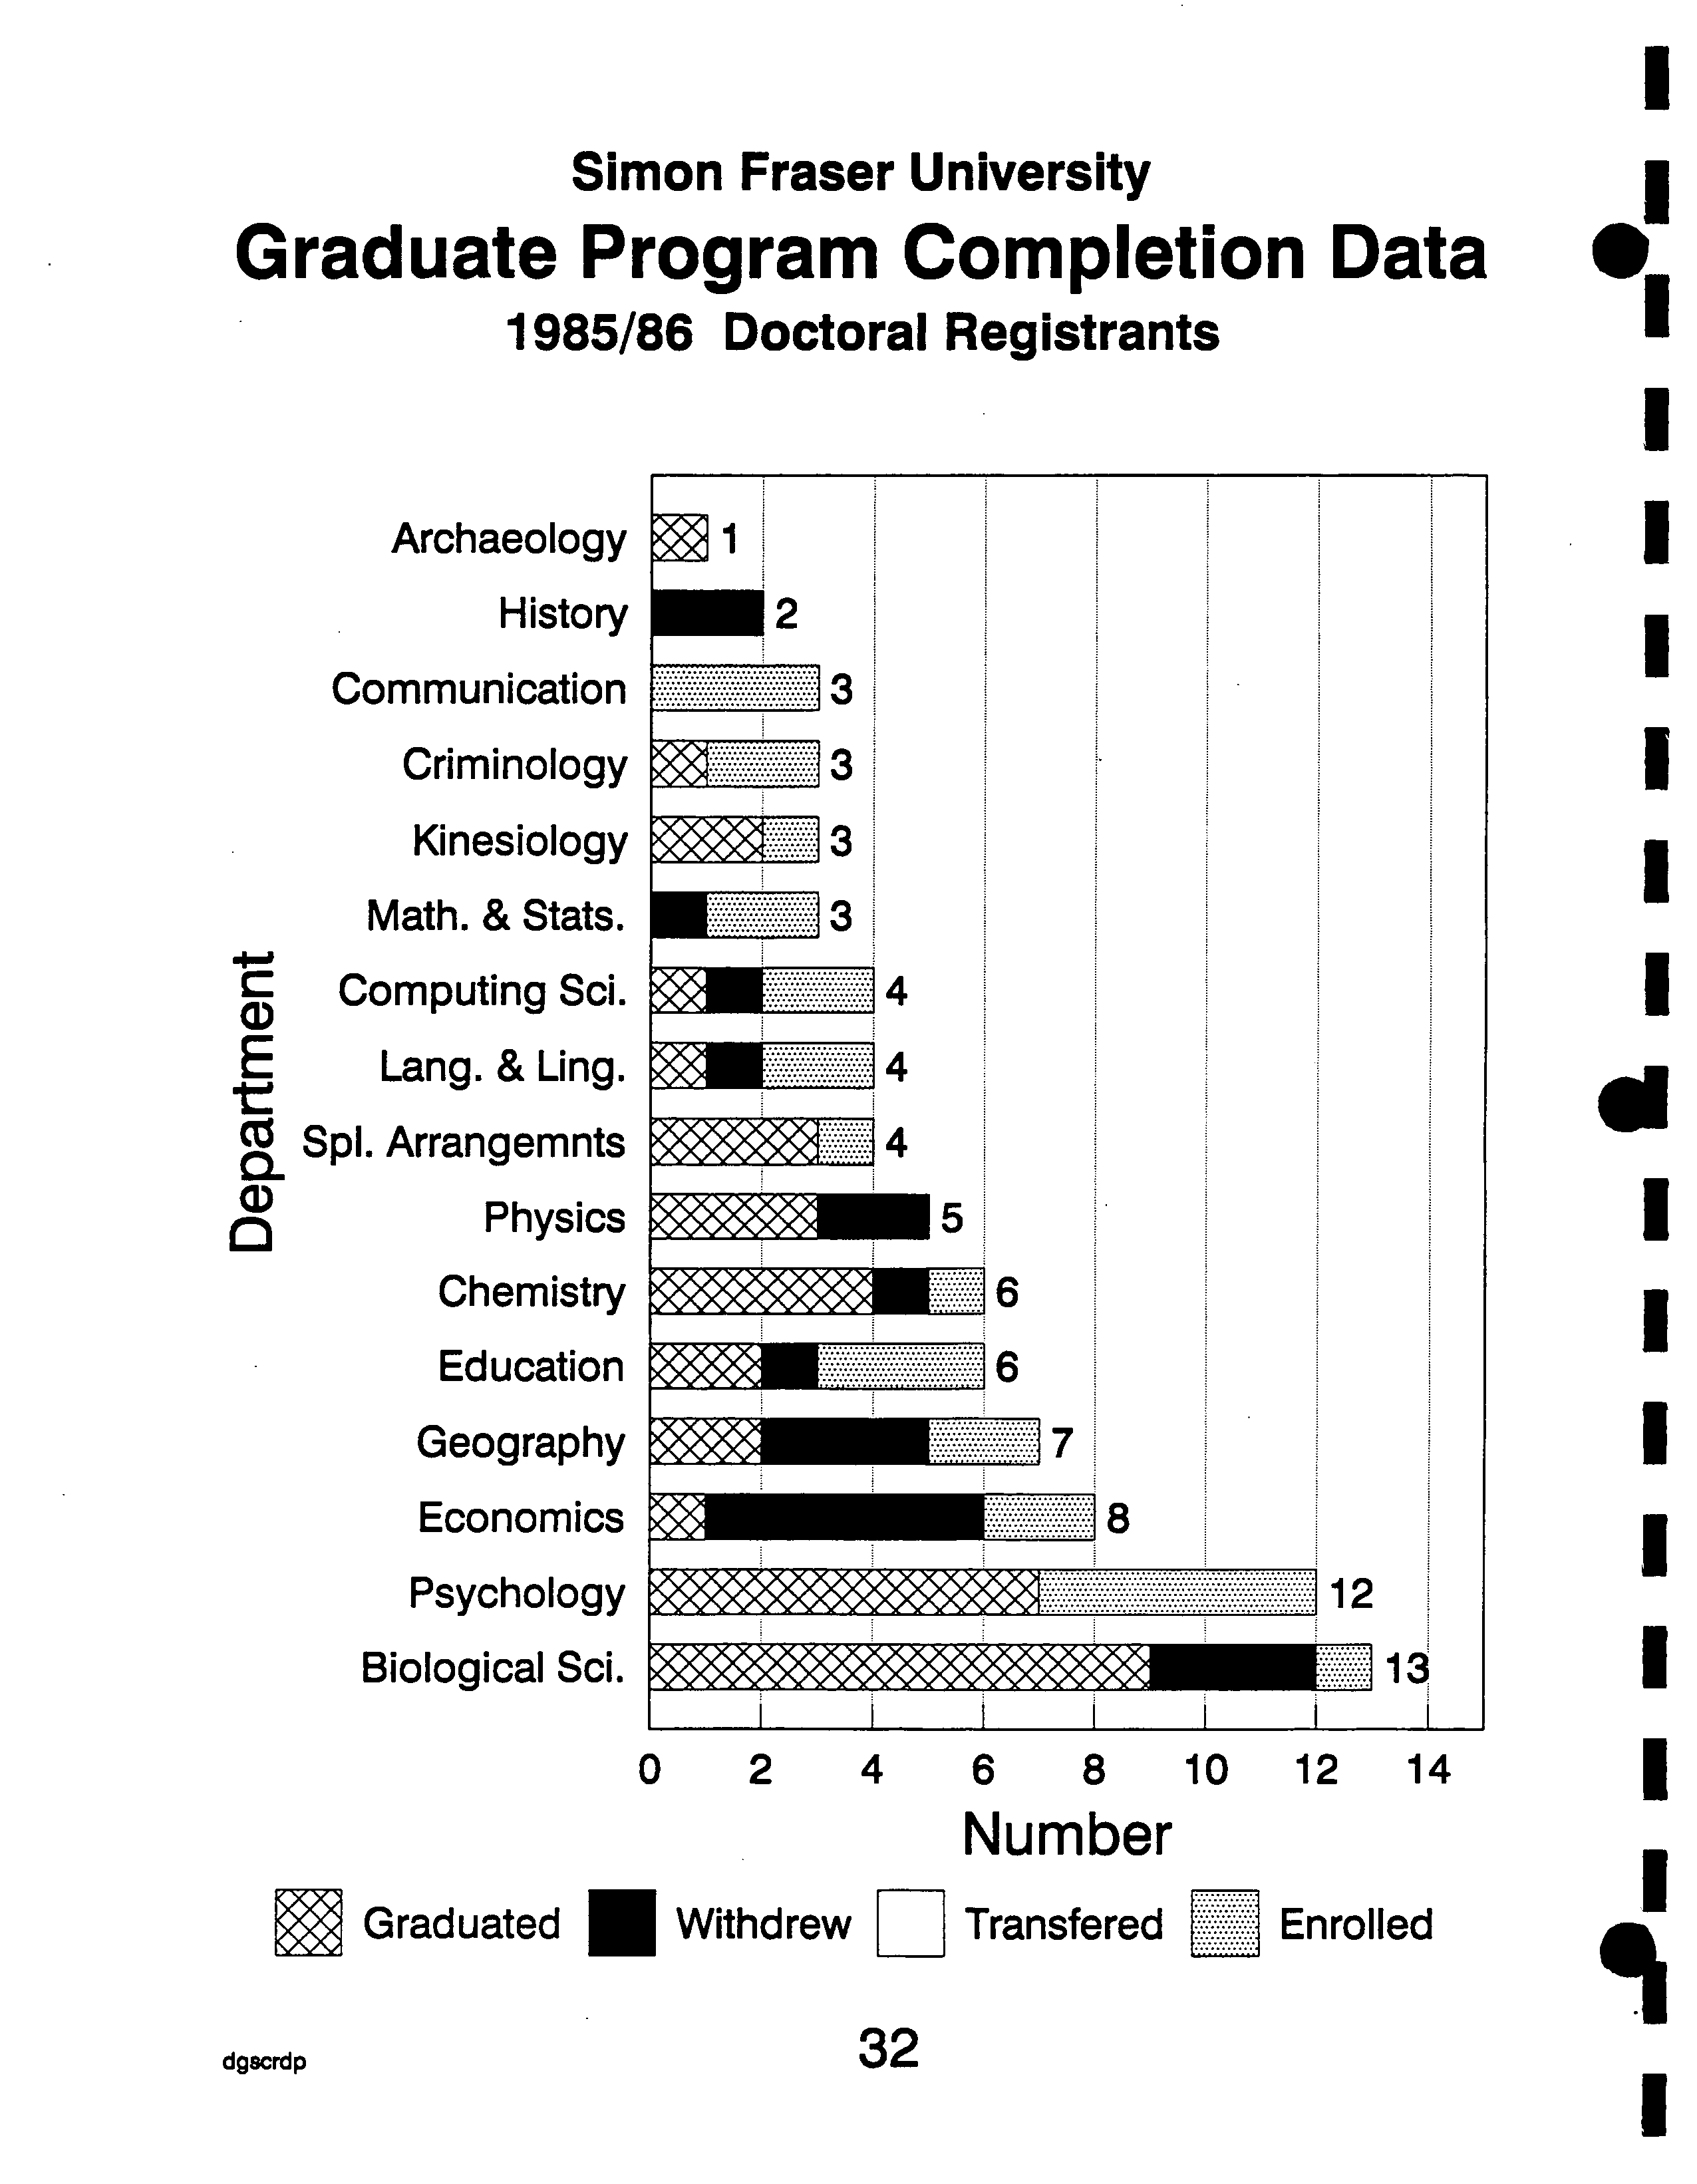
Archaeology
History
Communication
Criminology
Kinesiology
Math. & Stats.
Computing Sci.
E
Lang. & Ling.
I
CIO
CL
Spi. Arrangemnts
Physics
Chemistry
Education
Geography
Economics
Psychology
Biological Sd.
1
2
3
3
3
3
4
4
4
S
S
7
8
12
ME
Simon Fraser University
Graduate Program Completion Data
1985/86 Doctoral Registrants
0 ?
2 ?
4 ?
6 ?
8 ?
10 12 14
Number
Graduated
?
Withdrew ?
Transfered ?
Enrolled
dgscrdp
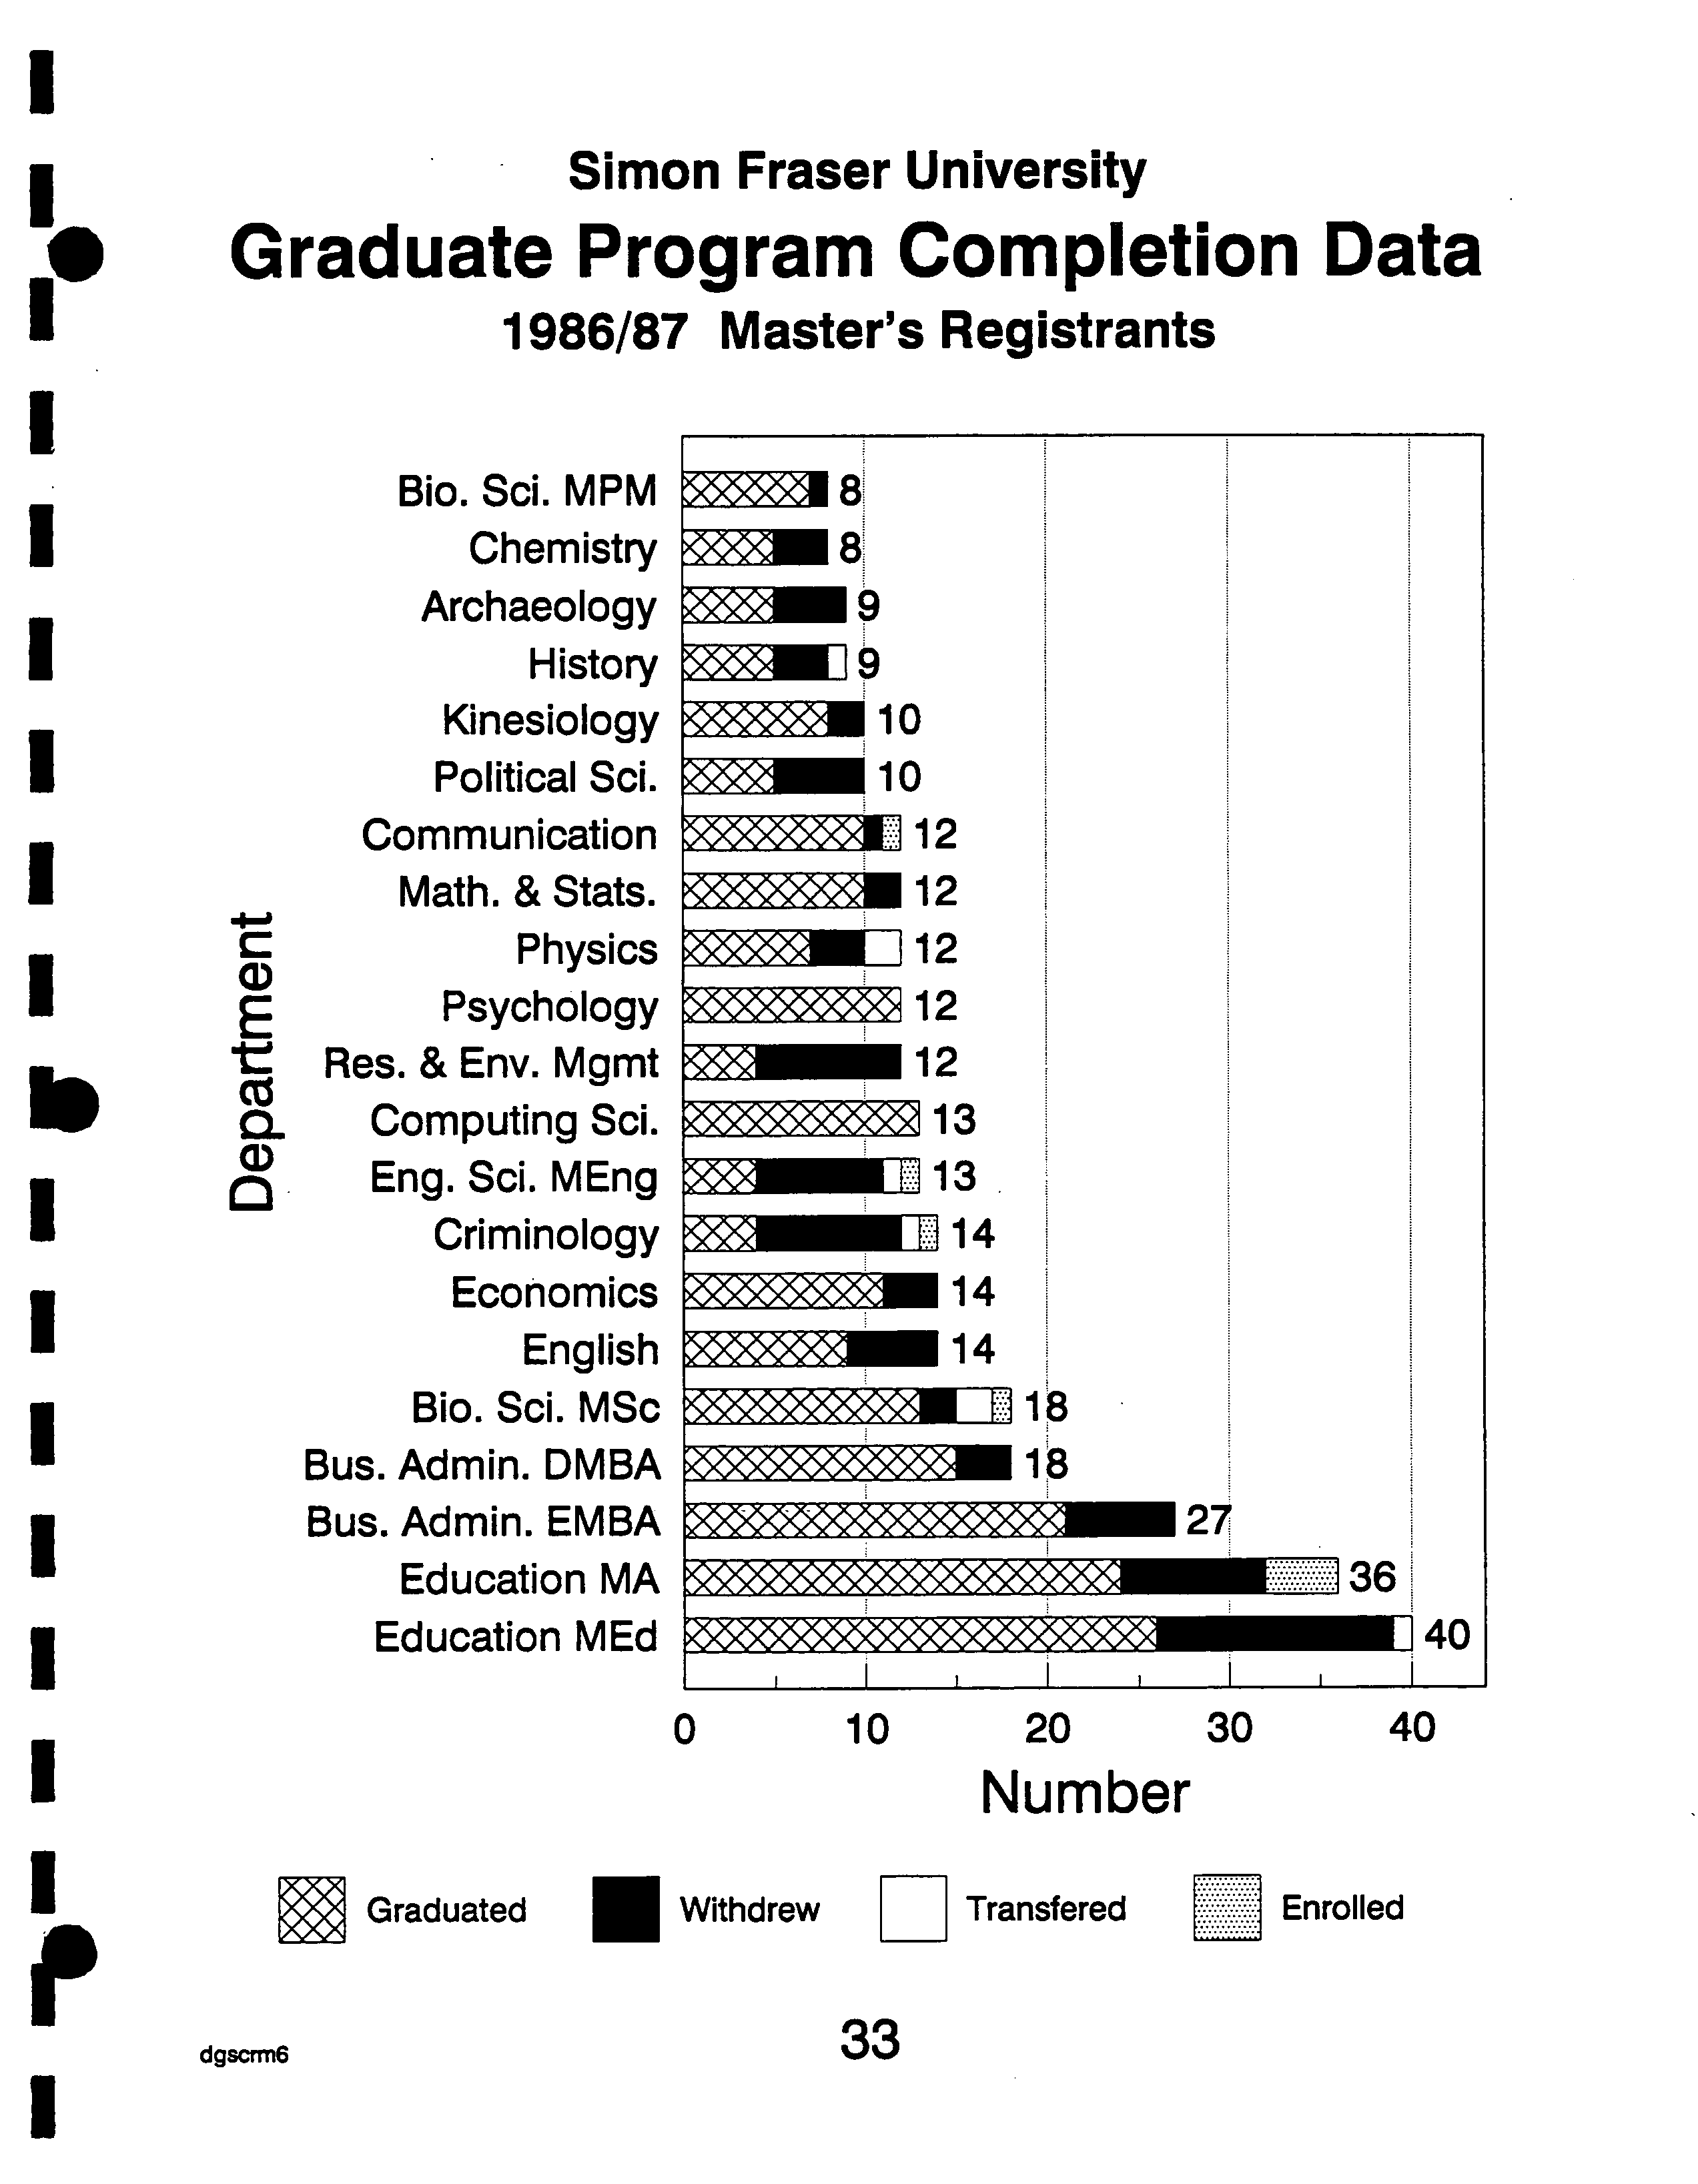
Simon Fraser University
Graduate Program Completion Data
1986/87 Master's Registrants
I
I
I
I
I
I
I
I
I
I
I
I
I
'I
I
Bio. Sci. MPM
Chemistry
Archaeology
History
Kinesiology
Political Sd.
Communication
Math. & Stats.
Physics
E ?
Psychology
tf Res. & Env. Mgmt
Cz
CL
?
Computing Sd.
Eng. Sci.MEng
Criminology
Economics
English
Blo. Sd. MSc
Bus. Admin. DMBA
Bus. Admin. EMBA
Education MA
Education MEd
10
10
[12
112
11112
12
112
13
11:13
I11.14
14
14
1
1
40
0 ?
10
?
20 ?
30 ?
40
Number
Graduated
?
Withdrew ?
Transfered
?
Enrolled
dgscrm6 ?
33
Simon Fraser University
Graduate Program Completion Data
1986/87 Doctoral Registrants
Criminology
Geography
Spi. Arrangèmnts
Archaeology
Communication
Kinesiology
Chemistry
I
co
CL
t
Computing
History
Sci.
Math. &Stats.
Education
Physics
Psychology
Economics
Bio. Sci.
o
2 4 6 8 10 12 14 16 18 20 22
Number
0
Withdrew
?
Transfered
R]
Enrolled
34
dgscrdp6
I
Simon Fraser University
I
Degree Completion Rates by Department and Semester of Entry
.
?
Entry in 85-3 through 86-2 - October 1, 1992
I
Completed ?
Currently
Department ?
Pgm Total Degree Withdrawn Transfered Enrolled
Archaeology ?
MA
I
Archaeology ?
PHD
Biological Sci. MPM
I ?
Biological Sci. MSC
Biological Sci. ?
PHD
I ?
Bus. Admin. ?
MBA
Bus. Admin. ?
MBE
Chemistry ?
MSC
I
Chemistry ?
PHD
Communication ?
MA
I
Communication ?
PHD
Computing Sci. ?
MSC
I
Computing Sci.
?
PHD
Criminology ?
MA
b
?
Criminology ?
PHD
Lang. & Ling. ?
MA
Lang. & Ling. ?
PHD
1 ?
Economics ?
MA
Economics
?
PHD
I
Education ?
MA
Education ?
MED
Education ?
MSC
I
Education ?
PHD
English ?
MA
I
Engineering Sci. MAP
Engineering Sci. MEN
I
Geography ?
MA
Geography ?
MSC
Geography ?
PHD
I
History ?
MA
History ?
PHD
I
Kinesiology
Kinesiology ?
PHD
?
2 ?
1 50.0%
?
1 ?
1 100.0%
?
9 ?
7 77.8%
?
6 ?
3 50.0%
?
13 ?
9 69.2%
?
7
?
7 100.0%
23 23 100.0%
?
9
?
3 33.3%
?
6 ?
4 66.7%
?
9 ?
8 88.9%
?
3 ?
0
?
0.0%
?
11
?
9 81.8%
?
4 ?
1 25.0%
?
13 ?
5 38.5%
?
3 ?
1 33.3%
?
2
?
1 50.0%
?
4
?
1 25.0%
?
13
?
8 61.5%
?
8
?
1 12.5%
41 29 70.7%
55 43 78.2%
?
2 ?
2 100.0%
?
6 ?
2 33.3%
?
13 ?
9 69.2%
?
1 ?
1 100.0%
?
5 ?
0 ?
0.0%
?
2 ?
1 50.0%
?
2 ?
1 50.0%
?
7 ?
2 28.6%
?
9 ?
5 55.6%
?
2 ?
0 ?
0.0%
?
8
?
7 87.5%
?
3
?
2 66.7%
?
1 50.0% ?
0 ?
0.0% ?
0 ?
0.0%
0 ?
0.0% ?
0 ?
0.0% ?
0 ?
0.0%
?
2 22.2% ?
0 ?
0.0% ?
0 ?
0.0%
?
1 16.7% ?
2 33.3% ?
0 ?
0.0%
?
3 23.1% ?
0 ?
0.0% ?
1 ?
7.7%
0
?
0.0%
?
0 ?
0.0% ?
0
?
0.0%
0
?
0.0% ?
0 ?
0.0% ?
0
?
0.0%
?
4 44.4% ?
2 22.2% ?
0
?
0.0%
?
1 16.7% ?
0 ?
0.0% ?
1 16.7%
?
1 11.1% ?
0 ?
0.0% ?
0 ?
0.0%
0 ?
0.0% ?
0 ?
0.0% ?
3 100.0%
?
2 18.2% ?
0 ?
0.0% ?
0 ?
0.0%
?
1 25.0% ?
0 ?
0.0% ?
2 50.0%
?
8 61.5% ?
0 ?
0.0% ?
0 ?
0.0%
?
0. 0.0% ?
0 ?
0.0% ?
2 66.7%
0
?
0.0%
?
1 50.0% ?
0
?
0.0%
?
1 25.0%
?
0 ?
0.0% ?
2 50.0%
?
5 38.5%
?
0
?
0.0% ?
0
?
0.0%
?
5 62.5%
?
0
?
0.0% ?
2 25.0%
?
12 29.3%
?
0
?
0.0%
?
0
?
0.0%
?
12 21.8% ?
0
?
0.0%
?
0
?
0.0%
0 ?
0.0% ?
0 ?
0.0% ?
0 ?
0.0%
?
1 16.7% ?
0 ?
0.0% ?
3 50.0%
?
4 30.8% ?
0 ?
0.0% ?
0 ?
0.0%
0 ?
0.0% ?
0 ?
0.0% ?
0 ?
0.0%
?
5 100.0% ?
0 ?
0.0% ?
0 ?
0.0%
?
1 50.0% ?
0 ?
0.0% ?
0 ?
0.0%
?
1 50.0% ?
0 ?
0.0% ?
0 ?
0.0%
?
3 42.9% ?
0 ?
0.0% ?
2 28.6%
?
4 44.4% ?
0 ?
0.0% ?
0 ?
0.0%
?
2 100.0% ?
0 ?
0.0% ?
0 ?
0.0%
0
?
0.0% ?
0 ?
0.0% ?
1 12.5%
0
?
0.0%
?
0 ?
0.0% ?
1 33.3%
1 ?
35
1
Simon Fraser University
Degree Completion Rates by Department and Semester of Entry ?
Entry in 85-3 through 86-2 - October 1, 1992
Completed ? Currently
Department ?
Pgm Total Degree Withdrawn Transfered Enrolled
Math. & Stats.
MSC 9 7 77.8% 2 22.2% 0
0.0% 0
0.0%
Math. & Stats.
PHD
3 0 0.0% 1
33.3% 0 0.0% 2 66.7%
Philosophy
MA
2
0 0.0%
2
100.0%
0
0.0% 0
0.0%
1
Physics
MSC
10 7 70.0% 2 20.0%
1 10.0% 0
0.0%
Physics
PHD
5 3 60.0% 2 40.0%
0 0.0% 0 0.0%
Political Sd. MA 2 2 100.0% 0 0.0% 0 0.0%
0
0.0%
Psychology
MA 10 8 80.0%
2
20.0% 0
0.0% 0 0.0%
Psychology
PHD 12 7
58.3%
0 0.0% 0
0.0% 5 41.7%
Res. & Env. Mgmt
NRM 11 7 63.6% 3 27.3% 0
0.0% 1 9.1%
Soc. & Anth.
MA
5 4 80.0% 1
20.0%
0 0.0%
0 0.0%
Spl. Arrangemnts
MAS
2 1 50.0% 1 50.0% 0
0.0%
0
0.0%
Spl. Arrangemnts
MSS
1
1 100.0% 0 0.0% 0
0.0% 0 0.0%
Spl. Arrangemnts PHD
4
3
75.0% 0
0.0% 0
0.0%
1
25.0i
Women's Studies MA
3 1 33.3% 2
66.7% 0 0.0% 0
0.0
I
All Master's
297 211 71.0% 78 26.3%
6 2.0% 2 0.7%
All Doctoral
84 37 44.0% 20 23.8% 0
0.0% 27 32.1%
[1
I
I
I
I
36 ?
1
Simon Fraser
University
Degree Completion Rates by Department and
Semester of
Entry
Entry in 86-3 through
87-2
- October
1,
?
1992
Completed
Currently
Department
Pgin
Total
Degree
Withdrawn Trans fered
Enrolled
Archaeology
MA 9 5 55.6% 4
44.4% 0
0.0% 0
0.0%
Archaeology
PHD
3
1 33.3%
0 0.0% 0 0.0%
2 66.7%
Biological Sci. MPM 8 7 87.5% 1 12.5%
0
0.0% 0
0.0%
Biological Sci. MSC
18 13 72.2% 2 11.1% 2 11.1%
1 5.6%
Biological Sci. PHD 21 13 61.9% 3
14.3% 0 0.0% 5
23.8%
Bus. Admin.
MBA 18
15 83.3% 3 16.7%
0
0.0% 0 0.0%
BUS.
Admin.
MBE 27 21 77.8% 6 22.2%
0
0.0% 0 0.0%
Chemistry
MSC 8
5
62.5% 3
37.5% 0 0.0% 0
0.0%
Chemistry
PHD 4 1 25.0% 1 25.0% 0 0.0% 2 50.0%
Communication MA 12 10 83.3% 1 8.3%
0
0.0% 1 8.3%
Communication
PHD 3 0 0.0% 0 0.0%
0
0.0% 3 100.0%
Computing
Sd.
MSC 13 13 100.0% 0 0.0% 0 0.0% 0 0.0%
Computing Sci. PHD
6 1 16.7%
3 50.0%
0
0.0% 2
33.3%
Criminology
MA 14 4 28.6% 8
57.1% 1 7.1% 1 7.1%
Criminology
PHD 2
0
0.0% 0
0.0% 0 0.0% 2 100.0%
Lang. & Ling. MA 3 1 33.3% 1 33.3%
0 0.0% 1 33.3%
Lang. & Ling.
PHD 1 0 0.0% 0
0.0% 1 100.0% 0 0.0%
Economics
MA 14 11 78.6%
3 21.4% 0 0.0% 0 0.0%
Economics
PHD 12
5
41.7% 2
16.7%
0
0.0% 5 41.7%
Education
MA
36
24 66.7% 8
22.2%
0
0.0% 4 11.1%
Education
MED 40 26
65.0%
13 32.5%
1 2.5% 0 0.0%
Education
MSC 2 2 100.0% 0
0.0% 0 0.0% 0 0.0%
Education
PHD 8 4 50.0% 1 12.5%
0 0.0% 3 37.5%
English
MA 14 9 64.3% 5
35.7% 0 0.0% 0 0.0%
Engineering Sci. MAP 2 2 100.0% 0 0.0%
0
0.0%
0 0.0%
Engineering Sci.
MEN
13 4
30.8% 7 53.8%
1 7.7%
1
7.7%
Geography
MA 4 2
50.0%
1
25.0% 0 0.0% 1
25.0%
Geography
MSC 2 2 100.0% 0
0.0% 0 0.0% 0 0.0%
Geography
PHD 2 1 50.0% 0
0.0% 0 0.0% 1 50.0%
History
MA 9 5 55.6% 3 33.3% 1
11.1% 0 0.0%
History
PHD 5 0 0.0% 3 60.0% 0 0.0% 2 40.0%
Kinesiology
MSC 10 8 80.0% 2 20.0%
0
0.0% 0 0.0%
Kinesiology
PHD
3 0 0.0% 2
66.7% 0 0.0% 1 33.3%
37
Math. & Stats.
?
MSC 12
Math. & Stats.
PHD 7
Philosophy
MA 3
Physics
MSC 12
Physics
PHD 9
Political Sci. MA
10
Psychology
MA
12
Psychology
PHD 10
Res. & Env. Mgmt
MPH
12
Soc. & Anth.
MA 4
Soc. & Anth.
PHD 1
Spl. Arrangemnts
HAS
2
Spl. Arrangemnts
PHD 2
Women's Studies MA 4
10 83.3%
2 28.6%
0
?
0.0%
7 58.3%
6 66.7%
5 50.0%
12 100.0%
3 30.0%
4 33.3%
3 75.0%
0
?
0.0%
2 100.0%
2 100.0%
2 50.0%
2 16.7%
3 42.9%
2 66.7%
3 25.0%
1 11.1%
5 50.0%
0 ?
0.0%
0 ?
0.0%
8 66.7%
1 25.0%
0
?
0.0%
0
?
0.0%
0
?
0.0%
2 50.0%
Simon Fraser University
Degree Completion Rates by Department and Semester of Entry
?
Entry in 86-3 through 87-2 - October 1, 1992
Completed ?
Currently
Department ?
Pgm Total Degree Withdrawn Transfered Enrolled
I
0 ?
0.0% 0
0.0%
1 ?
14.3% 1 14.3%
0 ?
0.0% 1
33.3%
2 ?
16.7% 0 0.0%
0
?
0.0% 2
22.2%
0
?
0.0% 0
0.0%
0 ?
0.0% 0
0.0%
0 ?
0.0%
7 70.0%
0 ?
0.0% 0
0.0%
0 ?
0.0% 0 0.0%
0 ?
0.0% 1 100.0%
0 ?
0.0%
0 0.0%
0 ?
0.0% 0
0.0%
0
?
0.0% 0
0.011
I
8
?
2.3% 11
3.2%
2
?
2.0% 39
39.4%
All Master's
?
347 234 67.4% 94 27.1%
All Doctoral
?
99 39 39.4% 19 19.2%
I
I
I
I
I
f i
-
38
?
1
U
I
I
I
I
I
b
I
I
I
I
I
I
I
P
I
E
Cz
I-
0
0
dgswdrl
Contemp. Arts?
Bio. Sci. MPM
?
Bus. Admin. EMBA
?
Kinesiology
?
Psychology ?
Bus. Admin. DMBA
?
Geography MSc
?
Math. & Stats. ?
Computing Sci.?
Eng. Sci. MApSc?
Bio. Sci. MSc
?
Economics ?
Spi. Arr. MA ?
Physics
?
Education MSc?
Bio. Sci. MAq
Ii]
13
14
14
15
16
16
17
S
0 ?
10 ?
20 ?
30
Fraction of Withdrawals (%)
Simon Fraser University
Master's Program Withdrawals
Fall 1985 - Fall 1992 Part I
University Average: 26%
Simon Fraser University
Master's Program Withdrawals
Fall 1985 - Fall 1992 Part II
Communication
SpI. Arr. MSc
Chemistry
Education MA
Geography MA
Education MEd
Lang. & Ling.
E
Res. & Env.
Mgmt
Cz
C)
2
Archaeology
Soc. & Anth.
English
History
Criminology
Political Sci.
Women's Studies
Philosophy
Eng. Sci. MEng
Liberal Studies
20 30 40 50 60 70 80 90 100
Fraction
of Withdrawals (%)
University
Average: 26%
dgswdr2 ?
40
Simon Fraser University
Doctoral Program Withdrawals
Fall 1985 - Fall 1992
Communication
Psychology
Lang. & Ling.
Physics
Biological Sci.
Math. & Stats.
Chemistry
Archaeology
Cz
Geography
)
English
2
SpI. Arrangemnts
Kinesiology
Education
Economics
Soc. & Anth.
History
Computing Sci.
Criminology
Engineering Sci.
o
10 20 30 40 50 60 70 80 90
Fraction of Withdrawals (%)
University Average: 31%
clgswdrp
?
41
I,
I
I
I
I
I
I
I
I
I
I
I
I
I
F
1
Simon Fraser
University
Completion Statistics
All
Students
since Fall
1985
Report
Dated:
October 1,
1992
Active
Total
W/D
Department
Pgm
Now
Degree
Trf
W/D
Completed Rate (%)
Archaeology
MA
25
23
0
12
35
34
Archaeology
PHD
10
13
0
4
17
24
Biological Sci.
MAQ 15
3
0
1
4
25
Biological Sci.
MPM
26
74
0
7
81
9
Biological Sci.
MSC
54
68
22 22
112
20
Biological Sd.
PHD
64
73
2
18
93
19
Bus. Admin.
MBA
128
99
0
18
117
15
Bus. Admin.
MBE
98
203
0
31
234
13
BUS.
Admin.
MBW 60
0
0
0
0
N/A
Chemistry
MSC 25
35
12
17
64
27
Chemistry
PHD
38
35
2
11
48
23
Communication
MA
50
53
1
18
72
25
Communication PHD
34
6
0
0
6
0
Computing Sci.
MSC 56
91
2
19
112
17
Computing Sci.
PHD
32
10
3
21
34
62
Contemp. Arts
MFA
16
3
0
0
3
0
Criminology
MA
37
54
3
42
99
42
Criminology
PHD 18
2
0
4
6
67
Economics
MA 43
106
0
29
135
21
Economics
PHD 40
34
1
26
61
43
Education
MA 135
172
2
76
250
30
Education
MED 158
226
1
101
328
31
Education
MSC
26
13
0
4
17
24
Education
PHD 54
15
0
11
26
42
Engineering Sci.
MAP 34
34
5
9
48
19
Engineering Sci.
MEN 28
6
1
28
35
80
Engineering Sci.
PHD
17
0
1
5
6
83
English
MA 48
65
0
36
101
36
English
PHD 20
9
0
4
13
31
Geography
MA
27
21
0
9
30
30
Geography
MSC
9
16
0
3
19
16
Geography
PHD 14
16
0
6
22
27
History
MA
35
40
1
27
68
40
History
PHD 12
6
0
9
15
60
.continued...
42
I
I
Simon
Fraser University Completion
Statistics
All Students since
Fall
1985
Report
Dated: October
1,
1992
Active
Total
W/D
Department
Pgm Now Degree Trf
W/D Completed Rate (%)
Kinesiology
MSC 24
46
9
9
64
14
Kinesiology
PHD 26
9
0
5
14
36
I
Lang.
& Ling.
MA 15
15
3
8
26
31
Lang. & Ling.
PHD 18
4
1
1
6
17
I
Liberal
Studies HAL 37
0
0
2
2
100
Math. & Stats.
MSC 35
72
3
14
89
16
I
Math.
& Stats. PHD 26
28
2
8
38
21
Philosophy
MA 12
4
0
11
15
73
I
Physics
MSC 20
37
13
15
65
23
Physics
PHD
34
30
0
6
36
17
I
Political
Sci. MA
29
22
0
18
40
45
Psychology
MA 45
62
0
10
72
14
Psychology
PHD 57
46
0
9
55
16
Res. & Env. Ng]nt
MRN 78 77
0 34 111
31
I
Soc. & Anth.
MA 26
18
0
9
27
33
Soc. & Anth.
PHD
9
7
0
8
15
53
Spi. Arrangemnts
HAS
2
14
0
4
18
22
Spl. Arrangeinnts
MSS
0
3
0
1
4
25
Spi. Arrangemnts
NPB
3
0
0
0
0
N/A
Spi. Arrangemnts
PHS 22
18
0
8
26
31
Women's Studies MA
19
9
0
10
19
53
I
Totals
Masters 1478 1784
78 654
2516
26
I
Totals ?
Doctoral 545 361 12
164
537
31
Totals
All 2023 2145
90 818
3053
27
I
Active Now = headcount
enrolment in
the most recent semester.
Degree = number of
degrees completed.
I
Trf = number of students who
transferred to a different
degree program without completing
the first.
p
W/D = number of
students who
withdrew without completing
a
degree
W/D Rate = ratio of W/D to
Total Completed.
I
Ph.D. Stipend 22 12.0%
)octoral Entrance 9 4.9%
ter's Entrance 6 3.3%
Simon Fraser University
Distribution of S.F.U. Awards
Fall 1992
Master's GF 93 50.8%
Doctoral GF 53 29.0%
Total Awards = 180
dgsawl ?
44
Simon Fraser University
Gender Distribution of S.F.U. Awards
Fall 1992
Male 52 52.5%
?
Male 46 56.1%
Female 47 47.5%
Master's Awards?
Total = 99
Female 36 43.9%
Doctoral Awards?
Total = 84
Male 671 55.1%
?
Male 308 60.6%
Female 546 44.9%
?
Female 200 39.4%
FT Master's Enrol.
?
FT Doctoral Enrol.
Total = 1217
?
Total = 508
Gender Distributions of Full-time Students ?
are shown for comparison
dgsaw2 ?
45
Semesters
4-6: 34 34.
rnesters
7-: 26 26.3%
Semesters
7-9: 14 16.7%
emesters 1-3: 15 17.9%
Simon Fraser University
Semesters of Tenure of S.F.U. Awards
Fall 1992
Semesters
1-3: 39 39.4%
Master's Awards ?
Total =
99
Semesters
4-6: 19 22.6%
Semesters
10-: 36 42.9%
Doctoral Awards ?
Total = 84
Graduate Fellowships, Entrance Scholarships and
President's Ph.D. Research Stipends are included
dgsaw3
All Students
Distribution of Awards by Semester in Program
SFU Awards 92-3
SFU
SFIJ
GF PRS ?
Ent Awards FT
Awards
Sem 92
92 ?
92 ?
Total
92-3
p er FT
Master's 1-3
33
0 ?
6 ?
39
428 9.1%
4-6 34
0
?
0
?
34
368
9.2%
7- 26
0 ?
0 ?
26 421
6.2%
Subtotal
93
0 ?
6 ?
99
1217
8.1%
PhD 1-3
6
0
?
9
?
15
104
14.4%
4-6
17
2
?
0
?
19
96
19.8%
7-9 10
4 ?
0
?
14
84
16.7%
10-
20 16 ?
0 ?
36
224 16.1%
Subtotal
53
22 ?
9 ?
84
508
16.5%
Total
146
22 ?
15 ?
183
1725
10.6%
GF:
Graduate Fellowship
PRS:
President's Ph.D. Research
Stipend
Ent:
S.F.U. Entrance Scholarship
FT:
Full-Time Enrolment
scholr3.wk1
47